Exploiting Process Lifetime Distributions for Dynamic Load...
33
Exploiting Process Lifetime Distributions for Dynamic Load Balancing MOR HARCHOL-BALTER and ALLEN B. DOWNEY University of California, Berkeley We consider policies for CPU load balancing in networks of workstations. We address the question of whether preemptive migration (migrating active processes) is necessary, or whether remote execution (migrating processes only at the time of birth) is sufficient for load balancing. We show that resolving this issue is strongly tied to understanding the process lifetime distribution. Our measurements indicate that the distribution of lifetimes for a UNIX process is Pareto (heavy-tailed), with a consistent functional form over a variety of workloads. We show how to apply this distribution to derive a preemptive migration policy that requires no hand-tuned parameters. We used a trace-driven simulation to show that our preemptive migration strategy is far more effective than remote execution, even when the memory transfer cost is high. Categories and Subject Descriptors: C.2.4 [Computer-Communication Networks]: Distrib- uted Systems; C.4 [Computer Systems Organization]: Performance of Systems; C.5.3 [Computer System Implementation]: Microcomputers; G.3 [Mathematics of Comput- ing]: Probability and Statistics; G.m [Mathematics of Computing]: Miscellaneous; I.6 [Computing Methodologies]: Simulation and Modeling General Terms: Algorithms, Design, Performance, Measurement Additional Key Words and Phrases: Heavy-tailed, load balancing, load sharing, migration, network of workstations, Pareto distribution, remote execution, trace-driven simulation, workload modeling 1. INTRODUCTION Most systems that perform load balancing use remote execution (i.e., nonpreemptive migration) based on a priori knowledge of process behavior, often in the form of a list of process names eligible for migration. Although M. Harchol-Balter is supported by National Physical Science Consortium (NPSC) Fellowship and NSF grant number CCR-9201092. A. B. Downey is partially supported by NSF (DARA) grant DMW-8919074. An earlier version of this article appeared in the Proceedings of the ACM Sigmetrics Conference on Measurement and Modeling of Computer Systems (May 23–26, 1996), 13–24. Authors’ addresses: University of California, Berkeley, CA 94720; email: {harchol; downey}@ cs.berkeley.edu. Permission to make digital / hard copy of part or all of this work for personal or classroom use is granted without fee provided that the copies are not made or distributed for profit or commercial advantage, the copyright notice, the title of the publication, and its date appear, and notice is given that copying is by permission of the ACM, Inc. To copy otherwise, to republish, to post on servers, or to redistribute to lists, requires prior specific permission and/or a fee. © 1997 ACM 0734-2071/97/0800 –0253 $03.50 ACM Transactions on Computer Systems, Vol. 15, No. 3, August 1997, Pages 253–285.
Transcript of Exploiting Process Lifetime Distributions for Dynamic Load...

Exploiting Process Lifetime Distributionsfor Dynamic Load Balancing
MOR HARCHOL-BALTER and ALLEN B. DOWNEYUniversity of California, Berkeley
We consider policies for CPU load balancing in networks of workstations. We address thequestion of whether preemptive migration (migrating active processes) is necessary, orwhether remote execution (migrating processes only at the time of birth) is sufficient for loadbalancing. We show that resolving this issue is strongly tied to understanding the processlifetime distribution. Our measurements indicate that the distribution of lifetimes for a UNIXprocess is Pareto (heavy-tailed), with a consistent functional form over a variety of workloads.We show how to apply this distribution to derive a preemptive migration policy that requiresno hand-tuned parameters. We used a trace-driven simulation to show that our preemptivemigration strategy is far more effective than remote execution, even when the memorytransfer cost is high.
Categories and Subject Descriptors: C.2.4 [Computer-Communication Networks]: Distrib-uted Systems; C.4 [Computer Systems Organization]: Performance of Systems; C.5.3[Computer System Implementation]: Microcomputers; G.3 [Mathematics of Comput-ing]: Probability and Statistics; G.m [Mathematics of Computing]: Miscellaneous; I.6[Computing Methodologies]: Simulation and Modeling
General Terms: Algorithms, Design, Performance, Measurement
Additional Key Words and Phrases: Heavy-tailed, load balancing, load sharing, migration,network of workstations, Pareto distribution, remote execution, trace-driven simulation,workload modeling
1. INTRODUCTION
Most systems that perform load balancing use remote execution (i.e.,nonpreemptive migration) based on a priori knowledge of process behavior,often in the form of a list of process names eligible for migration. Although
M. Harchol-Balter is supported by National Physical Science Consortium (NPSC) Fellowshipand NSF grant number CCR-9201092. A. B. Downey is partially supported by NSF (DARA)grant DMW-8919074.An earlier version of this article appeared in the Proceedings of the ACM SigmetricsConference on Measurement and Modeling of Computer Systems (May 23–26, 1996), 13–24.Authors’ addresses: University of California, Berkeley, CA 94720; email: {harchol; downey}@cs.berkeley.edu.Permission to make digital / hard copy of part or all of this work for personal or classroom useis granted without fee provided that the copies are not made or distributed for profit orcommercial advantage, the copyright notice, the title of the publication, and its date appear,and notice is given that copying is by permission of the ACM, Inc. To copy otherwise, torepublish, to post on servers, or to redistribute to lists, requires prior specific permissionand / or a fee.© 1997 ACM 0734-2071/97/0800–0253 $03.50
ACM Transactions on Computer Systems, Vol. 15, No. 3, August 1997, Pages 253–285.

some systems are capable of migrating active processes, most do so only forreasons other than load balancing, such as preserving autonomy. A previ-ous analytic study by Eager et al. [1988] discourages implementing pre-emptive migration for load balancing, showing that the additional perfor-mance benefit of preemptive migration is small compared to the benefit ofsimple nonpreemptive migration schemes. But simulation studies, whichcan use more realistic workload descriptions, and implemented systemshave shown greater benefits for preemptive migration [Barak et al. 1993;Krueger and Livny 1988]. This article uses a measured distribution ofprocess lifetimes and a trace-driven simulation to investigate these conflict-ing results.
1.1 Load-Balancing Taxonomy
On a network of shared processors, CPU load balancing is the idea ofmigrating processes across the network from hosts with high loads to hostswith lower loads. The motivation for load balancing is to reduce the averagecompletion time of processes and improve the utilization of the processors.Analytic models and simulation studies have demonstrated the perfor-mance benefits of load balancing, and these results have been confirmed inexisting distributed systems (see Section 1.4).
An important part of the load-balancing strategy is the migration policy,which determines when migrations occur and which processes are mi-grated. This is the question we address in this article. The other half of aload-balancing strategy is the location policy—the selection of a new hostfor the migrated process. Previous work has suggested that simply choosingthe target host with the shortest CPU run queue is both simple andeffective [Kunz 1991; Zhou 1987]. Our work confirms the relative unimpor-tance of location policy.
Process migration for purposes of load balancing comes in two forms:remote execution, also called nonpreemptive migration, in which some newprocesses are (possibly automatically) executed on remote hosts, and pre-emptive migration, in which running processes may be suspended, moved toa remote host, and restarted. In nonpreemptive migration only newbornprocesses are migrated.
Load balancing may be done explicitly (by the user) or implicitly (by thesystem). Implicit migration policies may or may not use a priori informa-tion about the function of processes, how long they will run, etc.
Since the cost of remote execution is usually significant relative to theaverage lifetime of processes, implicit nonpreemptive policies require somea priori information about job lifetimes. This information is often imple-mented as an eligibility list that specifies by process name which processesare worth migrating [Svensson 1990; Zhou et al. 1993].
In contrast, most preemptive migration policies do not use a prioriinformation, since this is often difficult to maintain, and preemptivestrategies can perform well without it. These systems use only system-visible data like the current age of each process or its memory size.
254 • M. Harchol-Balter and A. B. Downey
ACM Transactions on Computer Systems, Vol. 15, No. 3, August 1997.

This article examines the performance benefits of preemptive, implicitload-balancing strategies that assume no a priori information aboutprocesses.
We answer the following questions:
(1) Is preemptive migration worthwhile, given the additional cost (CPUand latency) associated with migrating an active process?
(2) Which active processes, if any, are worth migrating?
1.2 Process Model
In our model, processes use two resources: CPU and memory (we do notconsider I/O). Thus, we use “age” to mean CPU age (the CPU time a processhas used thus far) and “lifetime” to mean CPU lifetime (the total CPU timefrom start to completion). We assume that processors implement time-sharing with round-robin scheduling; in Section 7 we discuss the effect ofother local scheduling policies. Since processes may be delayed while on therun queue or while migrating, the slowdown imposed on a process is
Slowdown of process p 5wall-time~p!
CPU-time~p!,
where wall time is the total time a process spends running, waiting inqueue, or migrating.
1.3 Outline
The effectiveness of load balancing—either by remote execution or preemp-tive migration—depends strongly on the nature of the workload, includingthe distribution of process lifetimes and the arrival process. This articlepresents empirical observations about the workload on a network of UNIXworkstations and uses a trace-driven simulation to evaluate the impact ofthis workload on proposed load-balancing strategies.
Section 2 presents a study of the distribution of process lifetimes for avariety of workloads in an academic environment, including instructionalmachines, research machines, and machines used for system administra-tion. We find that the distribution is predictable with goodness of fitgreater than 99% and consistent across a variety of machines and work-loads. As a rule of thumb, the probability that a process with CPU age ofone second uses more than T seconds of total CPU time is 1/T (see Figure1).
Our measurements are consistent with those of Leland and Ott [1986],but their prior work has been incorporated in few subsequent analytic andsimulator studies of load balancing. This omission is unfortunate, since theresults of these are sensitive to the lifetime model (see Section 2.2).
Our observations of lifetime distributions have the following conse-quences for load balancing:
Exploiting Process Lifetime Distributions • 255
ACM Transactions on Computer Systems, Vol. 15, No. 3, August 1997.

—They suggest that it is preferable to migrate older processes becausethese processes have a higher probability of living long enough (eventu-ally using enough CPU) to amortize their migration cost.
—A functional model of the distribution provides an analytic tool forderiving the eligibility of a process for migration as a function of itscurrent age, migration cost, and the loads at its source and target host.
In Section 3 we derive a migration eligibility criterion that guaranteesthat the slowdown imposed on a migrant process is lower in expectation
Fig. 1. (a) distribution of lifetimes for processes with lifetimes greater than 1 second,observed on machine po mid-semester; the dotted (thicker) line shows the measured distribu-tion; the solid (thinner) line shows the least-squares curve fit; (b) the same distribution on alog-log scale; the straight line in log-log space indicates that the distribution can be modeledby Tk, where k is the slope of the line.
256 • M. Harchol-Balter and A. B. Downey
ACM Transactions on Computer Systems, Vol. 15, No. 3, August 1997.

than it would be without migration. According to this criterion, a process iseligible for migration only if its
CPU age .1
n 2 mz migration cost,
where n (respectively, m) is the number of processes at the source (target)host.
In Section 5 we use a trace-driven simulation to compare our preemptivemigration policy with a nonpreemptive policy based on name-lists. Thesimulator uses start times and durations from traces of a real system, andmigration costs chosen from a measured distribution.
We use the simulator to run three experiments: first we evaluate theeffect of migration cost on the relative performance of the two strategies.Not surprisingly, we find that as the cost of preemptive migration in-creases, it becomes less effective. Nevertheless, preemptive migration per-forms better than nonpreemptive migration even with surprisingly largemigration costs, despite several conservative assumptions that give nonpre-emptive migration an unfair advantage.
Next we choose a specific model of preemptive and nonpreemptivemigration costs based on real systems (see Section 4) and use this model tocompare the two migration strategies in more detail. We find that preemp-tive migration reduces the mean delay (queuing and migration) by 35–50%,compared to nonpreemptive migration. We also propose several alternativemetrics intended to measure users’ perception of system performance. Bythese metrics, the additional benefits of preemptive migration compared tononpreemptive migration appear even more significant.
In Section 5.4 we discuss in detail why a simple preemptive migrationpolicy is more effective than even a well-tuned nonpreemptive migrationpolicy. In Section 5.5 we use the simulator to compare our preemptivemigration strategy with previously proposed preemptive strategies.
We finish with a criticism of our model in Section 6, a discussion of futurework in Section 7, and conclusions in Section 8.
1.4 Related Work
1.4.1 Systems. Although several systems have the mechanism to mi-grate active jobs, few have implemented implicit load-balancing policies.Most systems only allow for explicit load balancing. That is, there is noload-balancing policy; the user decides which processes to migrate andwhen. Examples include Accent [Zayas 1987], Locus [Thiel 1991], Utopia[Zhou et al. 1993], DEMOS/MP [Powell and Miller 1983], V [Theimer et al.1985], NEST [Agrawal and Ezzet 1987], RHODOS [De Paoli and Goscinski1995], and MIST [Casas et al. 1995].
A few systems have implicit load-balancing policies; however, they arestrictly nonpreemptive policies (active processes are only migrated forpurposes other than load balancing, such as preserving workstation auton-
Exploiting Process Lifetime Distributions • 257
ACM Transactions on Computer Systems, Vol. 15, No. 3, August 1997.

omy). Examples include Amoeba [Tanenbaum et al. 1990], Charlotte [Artsyand Finkel 1989], Sprite [Douglis and Ousterhout 1991], Condor [Litzkowet al. 1988], and Mach [Milojicic 1993]. In general, nonpreemptive load-balancing policies depend on a priori information about processes, e.g.,explicit knowledge about the run-times of processes or user-provided listsof migratable processes [Agrawal and Ezzet 1987; Douglis and Ousterhout1991; Litzkow and Livny 1990; Zhou et al. 1993].
One existing system that has implemented automated preemptive loadbalancing is MOSIX [Barak et al. 1993]. Our results support the MOSIXclaim that their scheme is effective and robust.
1.4.2 Studies. Although few systems incorporate migration policies,there have been many simulation and analytical studies of various migra-tion policies. Most of these studies have focused on load balancing byremote execution.1
Only a few studies address preemptive migration policies [Krueger andLivny 1988; Leland and Ott 1986]. The Leland and Ott migration policy isalso age based, but does not take migration cost into account.
Eager et al. [1988] conclude that the additional performance benefit ofpreemptive migration is too small compared to the benefit of nonpreemp-tive migration to make preemptive migration worthwhile. This result hasbeen widely cited and in several cases has been used to justify the decisionnot to implement preemptive migration, as in the Utopia system [Zhou etal. 1993]. Our work differs from Eager et al. [1988] in both system modeland workload description. Eager et al. [1988] model a server farm in whichincoming jobs have no affinity for a particular processor, and thus the costof initial placement (remote execution) is free. This is different from ourmodel, a network of workstations, in which incoming jobs arrive at aparticular host, and the cost of moving them away, even by remoteexecution, is significant compared to most process lifetimes. Also, Eager etal. [1988] use a degenerate hyperexponential distribution of lifetimes thatincludes few jobs with nonzero lifetimes. When the coefficient of variationof this distribution matches the distributions we observed, fewer than 4% ofthe simulated processes have nonzero lifetimes. With so few jobs (andbalanced initial placement) there is seldom any load imbalance in thesystem and thus little benefit for preemptive migration. Furthermore, theEager et al. [1988] process lifetime distribution is exponential for jobs withnonzero lifetimes, the consequences of which we discuss in Section 2.2. Fora more detailed explanation of this distribution and its effect on the study,see Downey and Harchol-Balter [1995].
Krueger and Livny [1988] investigate the benefits of supplementingnonpreemptive migration with preemptive migration and find that preemp-tive migration is worthwhile. They use a hyperexponential lifetime distri-
1Livny and Melman [1982], Wang and Morris [1985], Casavant and Kuhl [1987], Zhou [1987],Pulidas et al. [1988], Kunz [1991], Bonomi and Kumar [1990], Evans and Butt [1993], Lin andRaghavendra [1993], Mirchandaney et al. [1990], Zhang et al. [1995], Zhou and Ferrari [1987],Hac and Jin [1990], and Eager et al. [1986].
258 • M. Harchol-Balter and A. B. Downey
ACM Transactions on Computer Systems, Vol. 15, No. 3, August 1997.

bution that approximates closely the distribution we observed; as a result,their findings are largely in accord with ours. One difference between theirwork and ours is that they used a synthetic workload with Poisson arrivals.The workload we observed, and used in our trace-driven simulations,exhibits serial correlation; that is, it is more bursty than a Poisson process.Another difference is that their migration policy requires several hand-tuned parameters. In Section 3.1 we show how to use the distribution oflifetimes to eliminate these parameters.
Similarly as we have done, Bryant and Finkel [1981] discuss the distri-bution of process lifetimes and its effect on preemptive migration policy,but their hypothetical distributions are not based on system measure-ments. Also as we do, they choose migrant processes on the basis ofexpected slowdown on the source and target hosts, but their estimation ofthose slowdowns is very different from ours. In particular, they use thedistribution of process lifetimes to predict a host’s future load as a functionof its current load and the ages of the processes running there. We haveexamined this issue and found (1) that this model fails to predict futureloads because it ignores future arrivals, and (2) that current load is the bestpredictor of future load (see Section 3.1). Thus, in our estimates of slow-down, we assume that the future load on a host is equal to the current load.
2. DISTRIBUTION OF LIFETIMES
The general shape of the distribution of process lifetimes in an academicenvironment has been known for a long time [Rosin 1965]: there are manyshort jobs and a few long jobs, and the variance of the distribution isgreater than that of an exponential distribution.
In 1986, Cabrera measured UNIX processes and found that over 40%doubled their current age [Cabrera 1986]. That same year, Leland and Ott[1986] proposed a functional form for the process lifetime distribution,based on measurements of the lifetimes of 9.5 million UNIX processesbetween 1984 and 1985. They conclude that process lifetimes have a UBNE(used-better-than-new-in-expectation) type of distribution. That is, thegreater the current CPU age of a process, the greater its expected remain-ing CPU lifetime. Specifically, they find that for T . 3 seconds, theprobability of a process’s lifetime exceeding T seconds is rTk, where21.25 , k , 21.05 and where r normalizes the distribution.
In contrast, Rommel [1991] claims that his measurements show that“long processes have exponential service times.” Many subsequent studiesassume an exponential lifetime distribution.
Because of the importance of the process lifetime distribution for load-balancing policies, we performed an independent study of this distributionand found that the functional form proposed by Leland and Ott fits theobserved distributions well, for processes with lifetimes greater than 1second. This functional form is consistent across a variety of machines andworkloads, and although the parameter k varies from 21.3 to 20.8, it isgenerally near 21. Thus, as a rule of thumb,
Exploiting Process Lifetime Distributions • 259
ACM Transactions on Computer Systems, Vol. 15, No. 3, August 1997.

—the probability that a process with age 1 second uses at least T seconds oftotal CPU time is about 1/T;
—the probability that a process with age T seconds uses at least anadditional T seconds of CPU time is about 1/2—thus, the median remain-ing lifetime of a process is equal to its current age.
Section 2.1 describes our measurements and the distribution of lifetimeswe observed. Section 2.2 discusses other models for the distribution oflifetimes and argues that the particular shape of this distribution is criticalfor evaluating migration policies.
2.1 Lifetime Distribution when Lifetime is Greater than 1 Second
To determine the distribution of lifetimes for UNIX processes, we measuredthe lifetimes of over one million processes, generated from a variety ofacademic workloads, including instructional machines, research machines,and machines used for system administration. We obtained our data usingthe UNIX command lastcomm, which outputs the CPU time used by eachcompleted process.
Figure 1 shows the distribution of lifetimes from one of the machines.The plot shows only processes whose lifetimes exceed one second. Thedotted (heavy) line shows the measured distribution; the solid (thinner)line shows the least-squares fit to the data using the proposed functionalform Pr{Lifetime . T} 5 Tk.
By visual inspection, it is clear that the proposed model fits the observeddata well. In contrast, Figure 2 shows that it is impossible to find anexponential curve that fits the distribution of lifetimes we observed.
For all the machines we studied, the distribution of process lifetimes fitsa curve of the form Tk, with k varying from 21.3 to 20.8 for differentmachines. Table I shows the value of the parameter for each machine westudied, estimated by an iteratively weighted least-squares fit (with nointercept, in accordance with the functional model). We calculated theseestimates with the BLSS command robust [Abrahams and Rizzardi 1988].
The standard error associated with each estimate gives a confidenceinterval for that parameter (all of these parameters are statistically signif-icant at a high degree of certainty). The R2 value indicates the goodness offit of the model—the values shown here indicate that the fitted curveaccounts for greater than 99% of the variation of the observed values. Thusthe goodness of fit of these models is high (for an explanation of R2 values,see Larsen and Marx [1986]).
Table II shows the cumulative distribution function, probability densityfunction, and conditional distribution function for process lifetimes. Thesecond column shows these functions when k 5 21, which we assume forour analysis in Section 3.
The functional form we are proposing (the fitted distribution) has theproperty that its moments (mean, variance, etc.) are infinite. Of course,since the observed distributions have finite sample size, they have finitemean (0.4 seconds) and coefficient of variation (5–7). One must be cautious
260 • M. Harchol-Balter and A. B. Downey
ACM Transactions on Computer Systems, Vol. 15, No. 3, August 1997.

when summarizing long-tailed distributions though, because calculatedmoments tend to be dominated by a few outliers. In our analyses we usemore robust summary statistics (order statistics like the median, or theestimated parameter k) to summarize distributions, rather than moments.
Fig. 2. In log-log space, this plot shows the distribution of lifetimes for the 13,000 processesfrom our traces with lifetimes greater than 1 second, and two attempts to fit a curve to thesedata. One of the fits is based on the model proposed in this article, Tk. The other fit is anexponential curve, c z e2lT. Although the exponential curve is given the benefit of an extrafree parameter, it fails to model the observed data. The proposed model fits well. Both fitswere performed by iteratively weighted least squares.
Table I. Estimated Lifetime Distribution for Each Machine Measured and AssociatedGoodness-of-Fit Statistics
Exploiting Process Lifetime Distributions • 261
ACM Transactions on Computer Systems, Vol. 15, No. 3, August 1997.

2.1.1 Processes with Lifetime Less than 1 Second. For processes withlifetimes less than 1 second, we did not find a consistent functional form;however, for the machines we studied these processes had an even lowerhazard rate than those of age . 1 second. That is, the probability that aprocess of age T , 1 seconds lives another T seconds is always greater than1/2. Thus for jobs with lifetimes less than 1 second, the median remaininglifetime is greater than the current age.
2.2 Why the Distribution Is Critical
Many prior studies of process migration assume an exponential distribu-tion of process lifetimes, both in analytical papers2 and in simulationstudies.3 The reasons for this assumption include (1) analytic tractabilityand (2) the belief that even if the actual lifetime distribution is in fact notexponential, assuming an exponential distribution will not affect the re-sults of load-balancing studies.
Regarding the first point, although the functional form that we andLeland and Ott propose cannot be used in queuing models as easily as anexponential distribution, it nevertheless lends itself to some forms ofanalysis, as we show in Section 3.1.
Regarding the second point, we argue that the particular shape of thelifetime distribution affects the performance of migration policies andtherefore that it is important to model this distribution accurately. Specif-ically, the choice of a migration policy depends on how the expectedremaining lifetime of a job varies with age. In our observations we found adistribution with the UBNE property: the expected remaining lifetime of ajob increases linearly with age. As a result, we chose a migration policythat migrates only old jobs.
But different distributions yield different relationships between the ageof a process and its remaining lifetime. For example, a uniform distributionhas the NBUE property: the expected remaining lifetime decreases linearlywith age. Thus if the distribution of lifetimes were uniform, the migrationpolicy should choose to migrate only young processes. In this case, we
2Lin and Raghavendra [1993], Mirchandaney et al. [1990], Eager et al. [1986], and Ahmad etal. [1991].3Kunz [1991], Pulidas et al. [1988], Wang and Morris [1985], Evans and Butt [1993], Livnyand Melman [1982], Zhang et al. [1995], and Chowdhury [1990].
Table II. Cumulative Distribution Function, Probability Density Function, and ConditionalDistribution Function for the Process Lifetime L
262 • M. Harchol-Balter and A. B. Downey
ACM Transactions on Computer Systems, Vol. 15, No. 3, August 1997.

expect nonpreemptive migration to perform better than preemptive migra-tion.
As another example, the exponential distribution is memoryless: theremaining lifetime of a job is independent of its age. In this case, since allprocesses have the same expected lifetimes, the migration policy mightchoose to migrate the process with the lowest migration cost, regardless ofage.
As a final example, processes whose lifetimes are chosen from a uniformlog distribution (a uniform distribution in log-space) have a remaininglifetime that increases up to a point and then begins to decrease. In thiscase, the best migration policy might be to migrate jobs that are oldenough, but not too old.
Thus different distributions, even with the same mean and variance, canlead to different migration policies. In order to evaluate a proposed policy,it is critical to choose a distribution model with the appropriate relation-ship between expected remaining lifetime and age.
Some studies have used hyperexponential distributions to model thedistribution of lifetimes. These distributions may or may not have the rightbehavior, depending on how accurately they fit observed distributions.Krueger and Livny [1988] use a three-stage hyperexponential with param-eters estimated to fit observed values. This distribution has the appropriateUBNE property. But the two-stage hyperexponential distribution Eager etal. [1988] use is memoryless; the remaining lifetime of a job is independentof its age (for jobs with nonzero lifetimes). According to this distribution,migration policy is irrelevant; all processes are equally good candidates formigration. This result is clearly in conflict with our observations.
Assuming the wrong lifetime distribution may also underestimate thebenefits of preemptive migration. The heavy tail of our measured lifetimedistribution implies that a tiny fraction of the jobs require more CPU thanall the other jobs combined. As we discuss in Section 5.4, part of the powerof preemptive migration is its ability to identify those few hogs. In alifetime distribution without such a heavy tail, preemptive migration mightnot be as effective.
3. MIGRATION POLICY
A migration policy is based on two decisions: when to migrate processesand which processes to migrate. The first question concerns how often or atwhat times the system checks for eligible migrants. We address this issuebriefly in Section 5.1.1. The focus of this article is the second question, alsoknown as the selection policy:
—Given that the load at a host is too high, how do we choose which processto migrate?
Our heuristic is to migrate processes that are expected to have longremaining lifetimes. The motivation for this heuristic is twofold. From theprocess’s perspective, migration time has a large impact on response time.
Exploiting Process Lifetime Distributions • 263
ACM Transactions on Computer Systems, Vol. 15, No. 3, August 1997.

A process would choose to migrate only if the migration overhead could beamortized over a longer lifetime. From the perspective of the source host, ittakes a significant amount of work to package a process for migration. Thehost would only choose to migrate processes that are likely to be moreexpensive to run than to migrate.
Many existing migration policies only migrate newborn processes (nopreemption), because these processes have no allocated memory, and thustheir migration cost is low. The idea of migrating newborn processes mightalso stem from the fallacy that process lifetimes have an exponentialdistribution, implying that all processes have equal expected remaininglifetimes regardless of their age, so one should migrate the cheapestprocesses. The problem with only migrating newborn processes is that,according to the process lifetime distribution, newborn processes are un-likely to live long enough to justify the cost of remote execution. In fact, ourmeasurements show that over 70% of processes have lifetimes smaller thanthe smallest nonpreemptive migration cost (see Table III).
Thus a newborn migration policy is only justified if the system has priorknowledge about processes and can selectively migrate processes likely tobe CPU hogs. We have found, though, that the ability of the system topredict process lifetimes by name is limited (Section 5.4).
Can we do better? The distribution of lifetimes implies that we expect anold process to run longer than a young process; thus it is preferable tomigrate old processes.
There are two potential problems with this approach. First, since thevast majority of processes are short, there might not be enough oldprocesses to have a significant load-balancing effect. In fact, although thereare few long-lived processes, they account for a large part of the total CPUload. According to our measurements, typically fewer than 4% of processeslive longer than two seconds, yet these processes make up more than 60% ofthe total CPU load. This is due to the long tail of the process lifetimedistribution. Furthermore, we show that the ability to migrate even a few
Table III. Cost of Nonpreemptive Migration in Various Systems
264 • M. Harchol-Balter and A. B. Downey
ACM Transactions on Computer Systems, Vol. 15, No. 3, August 1997.

large jobs can have a large effect on system performance, since a single longprocess on a busy host imposes slowdowns on many short processes.
A second problem with migrating old processes is that the migration costfor an active process is much greater than the cost of remote execution. Ifpreemptive migration is done carelessly, this additional cost might over-whelm the benefit of migrating processes with longer expected lives.
3.1 Our Migration Policy
For this reason, we propose a strategy that guarantees that every migra-tion improves the expected performance of the migrant process and theother processes at the source host. This strategy migrates a process only ifit improves the expected slowdown of the process, where slowdown is definedas in Section 1.2. Of course, processes on the target host are slowed by anarriving migrant, but on a moderately loaded system there are almostalways idle hosts; thus the number of processes at the target host is usuallyzero. In any case, the number of processes at the target is always less thanthe number at the source.
If there is no process on the host that satisfies the preceding migrationcriterion, no migration is done. If migration costs are high, few processeswill be eligible for migration; in the extreme there will be no migration atall. But in no case is the performance of the system worse (in expectation)than the performance without migration.
Using the distribution of process lifetimes, we calculate the expectedslowdown imposed on a migrant process and use this result to derive aminimum age for migration based on the cost of migration. Denoting theage of the migrant process by a, the cost of migration by c, the (eventualtotal) lifetime of the migrant by L, the number of processes at the sourcehost by n, and the number of processes at the target host (including themigrant) by m, we have
E$slowdown of migrant%
5 Et5a
`
PrH Lifetime ofmigrant is tJ z HSlowdown given
lifetime is t Jdt
5 Et5a
`
Pr$t # L , t 1 dt uL $ a% zna 1 c 1 m~t 2 a!
t
5 Et5a
` a
t2zna 1 c 1 m~t 2 a!
tdt
51
2 S c
a1 m 1 nD .
Exploiting Process Lifetime Distributions • 265
ACM Transactions on Computer Systems, Vol. 15, No. 3, August 1997.

If there are n processes at a heavily loaded host, then a process should beeligible for migration only if its expected slowdown after migration is lessthan n (which is the slowdown it expects in the absence of migration).
Thus, we require (1/2) ((c/a) 1 m 1 n) , n, which implies
Minimum migration age 5Migration cost
n 2 m.
We can extend this analysis to the case of heterogeneous processorspeeds by applying a scale factor to n or m.
This analysis assumes that current load predicts future load, that is, thatthe load at the source and target hosts will be constant during themigration. In an attempt to evaluate this assumption, and possibly improveit, we considered a number of alternative load predictors, including (1)taking a load average (over an interval of time), (2) summing the ages ofthe processes running on the host, and (3) calculating a prediction ofsurvivors and future arrivals based on the distribution model proposedhere. We found that current (instantaneous) load is the best single predic-tor and that using several predictive variables in combination did notgreatly improve the accuracy of prediction. These results are in accord withZhou [1987] and Kunz [1991].
3.2 Prior Preemptive Policies
Only a few preemptive strategies have been implemented in real systems orproposed in prior studies. The three that we have found are, like ours,based on the principle that a process should be migrated if it is old enough.
In many cases, the definition of “old enough” depends on a “voodoo”constant4: a free parameter whose value is chosen without explanation andthat would need to be retuned for a different system or another workload.
Under Leland and Ott’s policy, a process p is eligible for migration if
age~ p! . ages of k younger jobs at host,
where k is a free parameter called MINCRIT [Leland and Ott 1986].Krueger and Livny’s policy, like ours, takes the job’s migration cost intoaccount. A process p is eligible for migration if
age~ p! . 0.1 p migration cost~ p!,
but they do not explain how they chose the value 0.1 [Krueger and Livny1988].
The MOSIX policy is similar [Barak et al. 1993]; a process is eligible formigration if
age~ p! . 1.0 p migration cost~ p!.
4This term was coined by Professor John Ousterhout at U.C. Berkeley.
266 • M. Harchol-Balter and A. B. Downey
ACM Transactions on Computer Systems, Vol. 15, No. 3, August 1997.

The choice of the constant (1.0) in the MOSIX policy ensures that theslowdown of a migrant process is never more than 2, since in the worst casethe migrant completes immediately upon arrival at the target.
Despite this justification, the choice of the maximum slowdown (2) isarbitrary. We expect the MOSIX policy to be too restrictive, for two reasons:it ignores the slowdown that would be imposed at the source host in theabsence of migration (presumably there is more than one process there, orthe system would not be attempting to migrate processes away), and it isbased on the worst-case slowdown rather than the expected slowdown. InSection 5.5, we show that the best choice for this parameter, for ourworkload, is usually near 0.4, but it depends on load.
4. MODEL OF MIGRATION COSTS
Migration cost has such a large effect on the performance of preemptiveload balancing; this section presents the model of migration costs we use inour simulation studies.
We model the cost of migrating an active process as the sum of a fixedmigration cost for migrating the process’s system state and a memorytransfer cost that is proportional to the amount of the process’ memory thatmust be transferred.
We model remote execution cost as a fixed cost; it is the same for allprocesses. The cost of remote execution includes sending the command andarguments to the remote host, logging in or otherwise authenticating theprocess, and creating a new shell and environment on the remote host.
Throughout this article, we use the following notation:
—r: the cost of remote execution, in seconds,—f: the fixed cost of preemptive migration, in seconds,—b: the memory transfer bandwidth, in MB per second,—m: the memory size of migrant processes, in MB.
And thus we get
cost of remote execution 5 r
cost of preemptive migration 5 f 1 m/b,
where the quotient m/b is the memory transfer cost.
4.1 Memory Transfer Costs
The amount of a process’ memory that must be transferred during preemp-tive migration depends on properties of the distributed system. Douglis andOusterhout [1991] have an excellent discussion of this issue, and we borrowfrom them here.
At the most, it might be necessary to transfer a process’ entire memory.On a system like Sprite, which integrates virtual memory with a distrib-uted file system, it is only necessary to write dirty pages to the file system
Exploiting Process Lifetime Distributions • 267
ACM Transactions on Computer Systems, Vol. 15, No. 3, August 1997.
before migration. When the process is restarted at the target host, it willretrieve these pages. In this case the cost of migration is proportional to thesize of the resident set rather than the size of memory.
In systems that use precopying, such as V [Theimer et al. 1985], pagesare transferred while the program continues to run at the source host.When the job stops execution at the source, it will have to transfer againany pages that have become dirty during the precopy. Although the numberof pages transferred might be increased, the delay imposed on the migrantprocess is greatly decreased. Additional techniques can reduce the cost oftransferring memory even more [Zayas 1987].
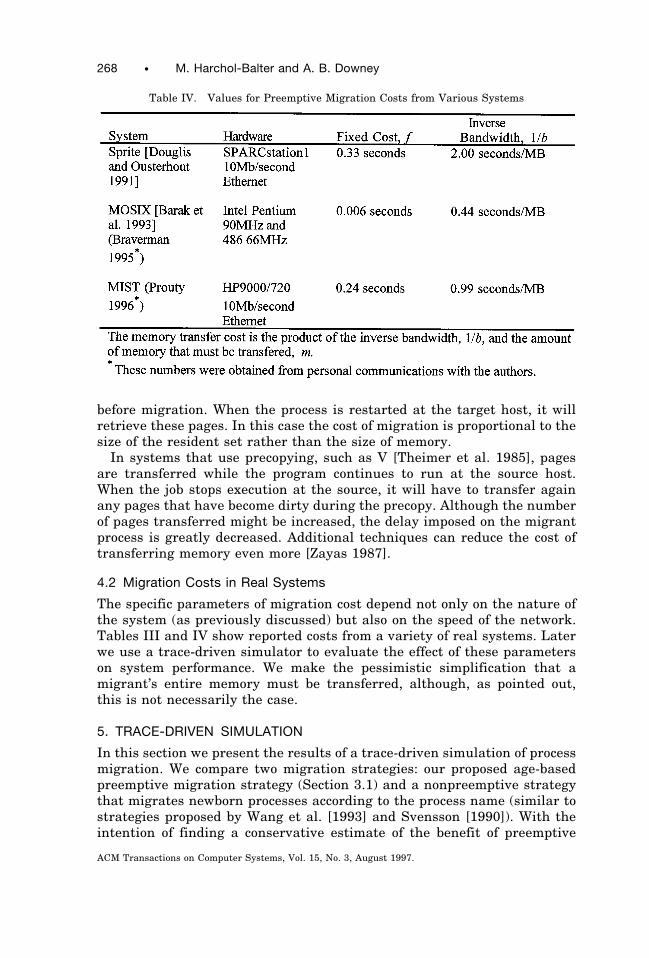
4.2 Migration Costs in Real Systems
The specific parameters of migration cost depend not only on the nature ofthe system (as previously discussed) but also on the speed of the network.Tables III and IV show reported costs from a variety of real systems. Laterwe use a trace-driven simulator to evaluate the effect of these parameterson system performance. We make the pessimistic simplification that amigrant’s entire memory must be transferred, although, as pointed out,this is not necessarily the case.
5. TRACE-DRIVEN SIMULATION
In this section we present the results of a trace-driven simulation of processmigration. We compare two migration strategies: our proposed age-basedpreemptive migration strategy (Section 3.1) and a nonpreemptive strategythat migrates newborn processes according to the process name (similar tostrategies proposed by Wang et al. [1993] and Svensson [1990]). With theintention of finding a conservative estimate of the benefit of preemptive
Table IV. Values for Preemptive Migration Costs from Various Systems
268 • M. Harchol-Balter and A. B. Downey
ACM Transactions on Computer Systems, Vol. 15, No. 3, August 1997.

migration, we give the name-based strategy the benefit of several unrealis-tic advantages; for example, the name-lists are derived from the same tracedata used by the simulator.
Section 5.1 describes the simulator and the two strategies in more detail.We use the simulator to run three experiments. First, in Section 5.2, weevaluate the sensitivity of each strategy to the migration costs r, f, b, andm discussed in Section 4. Next, in Section 5.3, we choose values for theseparameters that are representative of current systems and compare theperformance of the two strategies in detail. In Section 5.4 we discuss whythe preemptive policy outperforms the nonpreemptive policy. Last, inSection 5.5, we evaluate the analytic criterion for migration age proposed inSection 3.1, compared to criteria used in previous studies.
5.1 The Simulator
We have implemented a trace-driven simulation of a network of sixidentical workstations.5 We selected six daytime intervals from the traceson machine po (see Section 2.1), each from 9:00 a.m. to 5:00 p.m. From thesix traces we extracted the start times and CPU durations of the processes.We then simulated a network where each of six hosts executes (concurrent-ly with the others) the process arrivals from one of the daytime traces.
Although the workloads on the six hosts are homogeneous in terms of thejob mix and distribution of lifetimes, there is considerable variation in thelevel of activity during the eight-hour trace. For most of the traces, everyarriving process finds at least one idle host in the system, but in the twobusiest traces, a small fraction of processes (0.1%) arrives to find all hostsbusy. In order to evaluate the effect of changes in system load, we dividedthe eight-hour trace into eight one-hour intervals. We refer to these as runs0 through 7, where the runs are sorted from lowest to highest load. Run 0has a total of 15,000 processes submitted to the 6 simulated hosts; Run 7has 30,000 processes. The average duration of processes (for all runs) is 0.4seconds. Thus the total utilization of the system, r, is between 0.27 and0.54.
The birth process of jobs at our hosts is burstier than a Poisson process.For a given run and a given host, the serial correlation in interarrival timesis typically between 0.08 and 0.24, which is significantly higher than onewould expect from a Poisson process (uncorrelated interarrival times yielda serial correlation of 0.0; perfect correlation is 1.0).
Although the start times and durations of the processes come from tracedata, the memory size of each process, which determines its migration cost,is chosen randomly from a measured distribution (see Section 5.2). Thissimplification obliterates any correlations between memory size and otherprocess characteristics, but it allows us to control the mean memory size asa parameter and examine its effect on system performance.
5The trace-driven simulator and the trace data are available at http://http.cs.berkeley.edu/;harchol/loadbalancing.html.
Exploiting Process Lifetime Distributions • 269
ACM Transactions on Computer Systems, Vol. 15, No. 3, August 1997.

In our system model, we assume that processes are always ready to run,i.e., they are never blocked on I/O. During a given time interval, we divideCPU time equally among the processes on the host (processor sharing).
In real systems, part of the migration time is spent on the source hostpackaging the transferred pages, part in transit in the network, and parton the target host unpacking the data. The size of these parts and whetherthey can be overlapped depend on details of the system. In our simulationwe charge the entire cost of migration to the source host. This simplifica-tion is conservative in the sense that it makes preemptive migration lesseffective.
5.1.1 Strategies. We compare the preemptive migration strategy pro-posed in Section 3.1 with a nonpreemptive migration strategy, where thenonpreemptive strategy is given unfair advantages. For purposes of com-parison, we have tried to make the policies as simple and as similar aspossible. For both types of migration, we consider performing a migrationonly when a new process is born, even though a preemptive strategy mightbenefit by initiating migrations at other times. Also, for both strategies, ahost is considered heavily loaded any time it contains more than oneprocess: in other words, any time it would be sensible to consider migra-tion. Finally, we use the same location policy in both cases: the host withthe lowest instantaneous load is chosen as the target host (ties are brokenby random selection). Thus the only difference between the two migrationpolicies is which processes are considered eligible for migration:
Name-Based Nonpreemptive Migration. A process is eligible for migra-tion only if its name is on a list of processes that tend to be long-lived. If aneligible process is born at a heavily loaded host, the process is executedremotely on the selected host. Processes cannot be migrated once they havebegun execution.
The performance of this strategy depends on the list of eligible processnames. We derived this list by sorting the processes from the tracesaccording to name and duration and selecting the 15 common names withthe longest mean durations. We chose a threshold on mean duration that isempirically optimal (for this set of runs). Adding more names to the listdetracts from the performance of the system, as it allows more short-livedprocesses to be migrated. Removing names from the list detracts fromperformance, as it becomes impossible to migrate enough processes tobalance the load effectively. Since we used the trace data to construct thelist, our results may overestimate the performance benefits of this strategy.
Age-Based Preemptive Migration. A process is eligible for migrationonly if it has aged for some fraction of its migration cost. Based on thederivation in Section 3.1, this fraction is 1/(n 2 m), where n (respectively,m) is the number of processes at the source (target) host. When a newprocess is born at a heavily loaded host, all processes that satisfy themigration criterion are migrated away.
270 • M. Harchol-Balter and A. B. Downey
ACM Transactions on Computer Systems, Vol. 15, No. 3, August 1997.

This strategy understates the performance benefits of preemptive migra-tion, because it does not allow the system to initiate migrations exceptwhen a new process arrives.
As described in Section 3.1, we also modeled other location policies basedon more complicated predictors of future loads, but none of these predictorsyielded significantly better performance than the instantaneous load weuse here.
We also considered the effect of allowing preemptive migration at timesother than when a new process arrives. Ideally, one would like to initiate amigration whenever a process becomes eligible (since the eligibility crite-rion guarantees that the performance of the migrant will improve inexpectation). One of the strategies we considered performs periodic checksof each process on a heavily loaded host to see if any satisfy the criterion.The performance of this strategy is significantly better than that of thesimpler policy (migrating only at process arrival times).
5.1.2 Metrics. We evaluate the effectiveness of each strategy accordingto the following performance metrics.
Mean Slowdown. Slowdown is the ratio of wall-clock execution time toCPU time (thus it is always greater than 1). The average slowdown of alljobs is a common metric of system performance. When we compute the ratioof mean slowdowns (as from different strategies) we use normalized slow-down, which is the ratio of inactive time (the excess slowdown caused byqueuing and migration delays) to CPU time. For example, if the (unnormal-ized) mean slowdown drops from 2.0 to 1.5, the ratio of normalized meanslowdowns is 0.5/1.0 5 0.5: a 50% reduction in delay.
Mean slowdown alone is not a sufficient measure of the difference inperformance of the two strategies; it understates the advantages of thepreemptive strategy for these two reasons:
—Skewed Distribution of Slowdowns: Even in the absence of migration, themajority of processes suffer small slowdowns (typically 80% are less than3.0; see Figure 3). The value of the mean slowdown is dominated by thismajority.
—User Perception: From the user’s point of view, the important processesare the ones in the tail of the distribution, because although they are theminority they cause the most noticeable and annoying delays. Eliminat-ing these delays might have a small effect on the mean slowdown, but alarge effect on a user’s perception of performance.
Therefore, we also consider the following three metrics.
Variance of Slowdown. This metric is often cited as a measure of theunpredictability of response time [Silberschatz et al. 1994], which is anuisance for users trying to schedule tasks. In light of the distribution ofslowdowns, however, it may be more meaningful to interpret this metric as
Exploiting Process Lifetime Distributions • 271
ACM Transactions on Computer Systems, Vol. 15, No. 3, August 1997.

a measure of the length of the tail of the distribution, i.e., the number ofjobs that experience long delays (see Figure 5(b)).
Number of Severely Slowed Processes. In order to quantify the numberof noticeable delays explicitly, we consider the number (or percentage) ofprocesses that are severely affected by queuing and migration penalties(see Figures 5(c) and (d)).
Mean Slowdown of Long Jobs. Delays in longer jobs (those with life-times greater than 0.5 seconds) are more perceivable to users than delaysin short jobs (see Figure 6).
5.2 Sensitivity to Migration Costs
In this section we compare the performance of the nonpreemptive andpreemptive strategies over a range of values of r, f, b, and m (themigration cost parameters defined in Section 4).
For the following experiments, we chose the remote execution cost r 50.3 seconds. We considered a range for the fixed migration cost of 0.1 ,f , 10 seconds.
The memory transfer cost is the quotient of m (the memory size of themigrant process) and b (the bandwidth of the network). We chose thememory transfer cost from a distribution with the same shape as thedistribution of process lifetimes, setting the mean memory transfer cost(MMTC) to a range of values from 1 to 64 seconds. The shape of thisdistribution is based on an informal study of memory use patterns on thesame machines from which we collected trace data. The important featureof this distribution is that there are many jobs with small memory demands
Fig. 3. Distribution of process slowdowns for run 0 (with no migration). Most processes suffersmall slowdowns, but the processes in the tail of the distribution are more noticeable andannoying to users.
272 • M. Harchol-Balter and A. B. Downey
ACM Transactions on Computer Systems, Vol. 15, No. 3, August 1997.

and a few jobs with very large memory demands. Empirically, the exactform of this distribution does not affect the performance of either migrationstrategy strongly, but of course the mean (MMTC) does have a strong effect.
Figures 4(a) and (b) are contour plots of the ratio of the performance ofthe two migration strategies using normalized slowdown. Specifically, foreach of the eight one-hour runs we calculate the mean (respectively,standard deviation) of the slowdown imposed on all processes that completeduring the hour. For each run, we then take the ratio of the means
Fig. 4. (a) the performance of preemptive migration relative to nonpreemptive migrationdeteriorates as the cost of preemptive migration increases. The two axes are the twocomponents of the preemptive migration cost. The cost of nonpreemptive migration is heldfixed. The X marks the particular set of parameters we consider in the next section; (b) thestandard deviation of slowdown may give a better indication of a user’s perception of systemperformance than mean slowdown. By this metric, the benefit of preemptive migration is evenmore significant.
Exploiting Process Lifetime Distributions • 273
ACM Transactions on Computer Systems, Vol. 15, No. 3, August 1997.

(standard deviations) of the two strategies. Last, we take the geometricmean of the eight ratios (for discussion of the geometric mean see Hennessyand Patterson [1990]).
Fig. 5. (a) mean slowdown; (b) standard deviation of slowdown; (c) percentage of processesslowed by a factor of 3 or more; (d) percentage of processes slowed by a factor of 5 or more.
274 • M. Harchol-Balter and A. B. Downey
ACM Transactions on Computer Systems, Vol. 15, No. 3, August 1997.

The two axes in Figure 4 represent the two components of the cost ofpreemptive migration—namely, the fixed cost, f, and the MMTC, m/b. Thecost of nonpreemptive migration, r, is fixed at 0.3 seconds. As expected,increasing either the fixed cost of migration or the MMTC hurts theperformance of preemptive migration. The contour line marked 1.0 indi-cates the crossover where the performance of preemptive and nonpreemp-tive migration is equal (the ratio is 1.0). For smaller values of the costparameters, preemptive migration performs better; for example, if the fixedmigration cost is 0.3 seconds, and the MMTC is 2 seconds, the normalizedmean slowdown with preemptive migration is almost 40% lower than withnonpreemptive migration. When the fixed cost of migration or the MMTCare very high, almost all processes are ineligible for preemptive migration;thus, the preemptive strategy does almost no migrations. The nonpreemp-tive strategy is unaffected by these costs, so the nonpreemptive strategycan be more effective.
Figure 4(b) shows the effect of migration costs on the standard deviationof slowdowns. The crossover point—where nonpreemptive migration sur-passes preemptive migration—is considerably higher here than in Figure4(a). Thus there is a region where preemptive migration yields a highermean slowdown than nonpreemptive migration, but a lower standarddeviation. The reason for this is that nonpreemptive migration occasionallychooses a process for remote execution that turns out to be short-lived.These processes suffer large delays (relative to their run times) and add tothe tail of the distribution of slowdowns. In the next section, we show casesin which the standard deviation of slowdowns is actually worse withnonpreemptive migration than with no migration at all (three of the eightruns).
5.3 Comparison of Preemptive and Nonpreemptive Strategies
In this section we choose migration cost parameters representative ofcurrent systems (see Section 4.2) and use them to examine more closely theperformance of the two migration strategies. The values we chose are
—r: the cost of remote execution, 0.3 seconds,—f: the fixed cost of preemptive migration, 0.3 seconds,—b: the memory transfer bandwidth, 0.5MB per second, and—m: the mean memory size of migrant processes, 1MB.
In Figures 4(a) and (b), the point corresponding to these parametervalues is marked with an X. Figure 5 shows the performance of the twomigration strategies at this point (compared to the case of no migration).
Nonpreemptive migration reduces the normalized mean slowdown (Fig-ure 5(a)) by less than 20% for most runs (and 40% for the two runs with thehighest loads). Preemptive migration reduces the normalized mean slow-down by 50% for most runs (and more than 60% for two of the runs). Theperformance improvement of preemptive migration over nonpreemptivemigration is typically between 35% and 50%.
Exploiting Process Lifetime Distributions • 275
ACM Transactions on Computer Systems, Vol. 15, No. 3, August 1997.

As discussed previously, we feel that the mean slowdown (normalized ornot) understates the performance benefits of preemptive migration. Wehave proposed other metrics to try to quantify these benefits. Figure 5(b)shows the standard deviation of slowdowns, which reflects the number ofseverely impacted processes. Figures 5(c) and (d) explicitly measure thenumber of severely impacted processes, according to two different thresh-olds of acceptable slowdown. By these metrics, the benefits of migration ingeneral appear greater, and the discrepancy between preemptive andnonpreemptive migration appears much greater. For example, in Figure5(d), in the absence of migration, 7–18% of processes are slowed by a factorof 5 or more. Nonpreemptive migration is able to eliminate 42–62% ofthese, which is a significant benefit, but preemptive migration consistentlyeliminates nearly all (86–97%) severe delays.
An important observation from Figure 5(b) is that for several runs,nonpreemptive migration actually makes the performance of the systemworse than if there were no migration at all. For the preemptive migrationstrategy, this outcome is nearly impossible, since migrations are onlyperformed if they improve the slowdowns of all processes involved (inexpectation). In the worst case, then, the preemptive strategy will do noworse than the case of no migration (in expectation).
Another benefit of preemptive migration is graceful degradation of sys-tem performance as load increases (as shown in Figure 5). In the presenceof preemptive migration, both the mean and standard deviation of slow-down are nearly constant, regardless of the overall load on the system.
5.4 Why Preemptive Migration Outperforms Nonpreemptive Migration
The alternate metrics previously discussed shed some light on the reasonsfor the performance difference between preemptive and nonpreemptivemigration. We consider two kinds of mistakes a migration system mightmake:
(1) Failing to Migrate Long-Lived Jobs: This type of error imposes moder-ate slowdowns on a potential migrant and, more importantly, inflictsdelays on short jobs that are forced to share a processor with a CPUhog. Under nonpreemptive migration, this error occurs whenever along-lived process is not on the name-list, possibly because it is anunknown program or an unusually long execution of a typically short-lived program. Preemptive migration can correct these errors by mi-grating long jobs later in their lives.
(2) Migrating Short-Lived Jobs: This type of error imposes large slowdownson the migrated process, wastes network resources, and fails to effectsignificant load balancing. Under nonpreemptive migration, this erroroccurs when a process whose name is on the eligible list turns out to beshort-lived. Our preemptive migration strategy all but eliminates thistype of error by guaranteeing that the performance of a migrantimproves in expectation.
276 • M. Harchol-Balter and A. B. Downey
ACM Transactions on Computer Systems, Vol. 15, No. 3, August 1997.

Even occasional mistakes of the first kind can have a large impact onperformance, because one long job on a busy machine will impede manysmall jobs. This effect is aggravated by the serial correlation betweenarrival times (see Section 5.1), which suggests that a busy host is likely toreceive many future arrivals.
Thus, an important feature of a migration policy is its ability to identifylong-lived jobs for migration. To evaluate this ability, we consider theaverage lifetime of the processes chosen for migration under each policy.Under nonpreemptive migration, the average lifetime of migrant processeswas 2.0 seconds (the mean lifetime for all processes is 0.4 seconds), and themedian lifetime of migrants was 0.9 seconds. The nonpreemptive policymigrated about 1% of all jobs, which accounted for 5.7% of the total CPU.
The preemptive migration policy was better able to identify long jobs; theaverage lifetime of migrant processes under preemptive migration was 4.9seconds; the median lifetime of migrants was 2.0 seconds. The preemptivepolicy migrated 4% of all jobs, but since these migrants were long-lived,they accounted for 55% of the total CPU. Thus the primary reason for thesuccess of preemptive migration is its ability to identify long jobs accu-rately and to migrate those jobs away from busy hosts.
The second type of error did not have as great an impact on the meanslowdown for all processes, but it did impose large slowdowns on somesmall processes. These outliers are reflected in the standard deviation ofslowdowns—because the nonpreemptive policy sometimes migrates veryshort jobs, it can make the standard deviation of slowdowns worse thanwith no migration (see Figure 5(b)). The age-based preemptive migrationcriterion eliminates most errors of this type by guaranteeing that theperformance of the migrant will improve in expectation.
There is, however, one type of migration error that is more problematicfor preemptive migration than for nonpreemptive migration: stale loadinformation. A target host may have a low load when a migration isinitiated, but its load may have increased by the time the migrant arrives.This is more likely for a preemptive migration because the migration timeis longer. In our simulations, we found that these errors do occur, althoughinfrequently enough that they do not have a severe impact on performance.
Specifically, we counted the number of migrant processes that arrived ata target host and found that the load was higher than it had been at thesource host when migration began. For most runs, this occurred less than0.5% of the time (for 2 runs with high loads it was 0.7%). Somewhat moreoften, 3% of the time, a migrant process arrived at a target host and foundthat the load at the target was greater than the current load at the source.These results suggest that the performance of a preemptive migrationstrategy might be improved by a reservation system as in MOSIX.
One other potential problem with preemptive migration is the volume ofnetwork traffic that results from large memory transfers. In our simula-tions, we did not model network congestion, on the assumption that thetraffic generated by migration would not be excessive. This assumption
Exploiting Process Lifetime Distributions • 277
ACM Transactions on Computer Systems, Vol. 15, No. 3, August 1997.

seems to be reasonable: under our preemptive migration strategy fewerthan 4% of processes are migrated once, and fewer than 0.25% of processesare migrated more than once. Furthermore, there is seldom more than onemigration in progress at a time.
In summary, the advantage of preemptive migration—its ability toidentify long jobs and move them away from busy hosts—overcomes itsdisadvantages (longer migration times and stale load information).
5.4.1 Effect of Migration on Short and Long Jobs. We have claimedthat identifying long jobs and migrating them away from busy hosts helpsnot only the long jobs (which run on more lightly loaded hosts) but alsothe short jobs that run on the source host. To test this claim, we divided theprocesses into three lifetime groups and measured the performancebenefit for each group due to migration. The number of jobs in the shortgroup is roughly 10 times the number in the medium group, which in turnis roughly 10 times the number in the long group. Figure 6 shows thatmigration reduces the mean slowdown of all three groups: for nonpreemp-tive migration the improvement is the same for all groups; under preemp-tive migration the long jobs enjoy a slightly greater benefit.
This breakdown by lifetime group is useful for evaluating various metricsof system performance. The metric we are using here, slowdown, givesequal weight to all jobs; as a result, the mean slowdown metric is domi-nated by the most populous group, short jobs. Another common metric,residence time, effectively weights jobs according to their lifetimes. Thusthe mean residence time metric reflects, primarily, the performance benefitfor long jobs. Under the mean residence time metric, then, preemptivemigration appears even more effective.
Fig. 6. Mean slowdown broken down by lifetime group.
278 • M. Harchol-Balter and A. B. Downey
ACM Transactions on Computer Systems, Vol. 15, No. 3, August 1997.

5.5 Evaluation of Analytic Migration Criterion
As derived in Section 3.1, the minimum age for a migrant process accordingto our analytic criterion is
Minimummigration age
5Migration cost
n 2 m,
where n is the load at the source host, and m is the load at the target host(including the potential migrant).
We compare the analytic criterion with the fixed-parameter criterion:
Minimummigration age
5 a p Migration cost,
where a is a free parameter. This parameter is meant to model preemptivemigration strategies in the literature, as discussed in Section 3.2. Forcomparison, we use the best fixed parameter, which for each run is thevalue that yields the smallest mean slowdown. Of course, this gives thefixed-parameter criterion a considerable advantage.
Figure 7 compares the performance of the analytic minimum-age crite-rion with the best fixed parameter. The best fixed parameter variesconsiderably from run to run and appears to be roughly correlated with theaverage load during the run (the runs are sorted in increasing order of totalload).
The performance of the analytic criterion is always within a few percentof the performance of the best fixed-value criterion. The advantage of the
Fig. 7. The mean slowdown for eight runs, using the two criteria for minimum migration age.The value of the best fixed parameter a is shown in parentheses for each run.
Exploiting Process Lifetime Distributions • 279
ACM Transactions on Computer Systems, Vol. 15, No. 3, August 1997.

analytic criterion is that it is parameterless and therefore more robustacross a variety of workloads. We feel that the elimination of one freeparameter is a useful result in an area with so many (usually hand-tuned)parameters.
This result also suggests that the parameter used by Krueger and Livny(a 5 0.1) is too low, and the parameter used in MOSIX (a 5 1.0) is too high,at least for this workload (see Section 3.2).
6. WEAKNESSES OF THE MODEL
Our simulation ignores a number of factors that would affect the perfor-mance of migration in real systems:
—CPU-Bound Jobs Only: Our model considers all jobs as being CPU-bound; thus, their response time necessarily improves if they run on ahost with a lighter load. For I/O-bound jobs, however, CPU contentionhas little effect on response time. These jobs would benefit less frommigration. To see how large a role this plays in our results, we noted thenames of the processes that appear most frequently in our traces (withCPU time greater than 1 second, since these are the processes most likelyto be migrated). The most common names were cc1plus and cc1, both ofwhich are CPU-bound. Next most frequent were trn, cpp, ld, jove (aversion of emacs), and ps. So although some jobs in our traces are inreality interactive, our simple model is reasonable for many of the mostcommon jobs. In Section 7 we discuss further implications of a workloadincluding interactive, I/O-bound, and nonmigratable jobs.
—Environment: Our migration strategy takes advantage of the used-better-than-new property of process lifetimes. In an environment with a differ-ent distribution, this strategy will not be effective.
—Local Scheduling: We assume that local scheduling on the hosts issimilar to round-robin. Other policies, like feedback scheduling, canreduce the impact of long jobs on the performance of short jobs andthereby reduce the need for load balancing. We explore this issue in moredetail in Section 7 and find that preemptive migration is still beneficialunder feedback scheduling.
—Memory Size: One weakness of our model is that we chose memory sizesfrom a measured distribution, and therefore our model ignores anycorrelation between memory size and other process characteristics. Tojustify this simplification, we conducted an informal study of processes inour department and found no correlation between memory size andprocess CPU usage. Krueger and Livny [1988] report a similar observa-tion. Thus this may be a reasonable simplification.
—Network Contention: Our model does not consider the effect of increasednetwork traffic as a result of process migration. We observe, however, forthe load levels we simulated that migrations are occasional (one everyfew seconds) and that there is seldom more than one migration inprogress at a time.
280 • M. Harchol-Balter and A. B. Downey
ACM Transactions on Computer Systems, Vol. 15, No. 3, August 1997.

7. FUTURE WORK
In our workload model we have assumed that all processes are CPU-bound.Of primary interest in future work is including interactive, I/O-bound, andnonmigratable jobs into our workload.
In a workload that includes interactive jobs, I/O-bound jobs, and dae-mons, there will be some jobs that should not or cannot be migrated. AnI/O-bound job, for example, will not necessarily run faster on a more lightlyloaded host, and might run slower if it is migrated away from the disk orother I/O device it uses. A migrated interactive job might benefit byrunning on a more lightly loaded host if it uses significant CPU time, butwill suffer performance penalties for all future interactions. Finally, somejobs (e.g., many daemons) cannot be migrated away from their hosts.
The policy we proposed for preemptive migration can be extended to dealappropriately with interactive and I/O-bound jobs by including in thedefinition of migration cost the additional costs that will be imposed onthese jobs after migration, including network delays, access to nonlocaldata, etc. The estimates of these costs might be based on the recentbehavior of the job, e.g., the number and frequency of I/O requests andinteractions. Jobs that are explicitly forbidden to migrate could be assignedan infinite migration cost.
The presence of a set of jobs that are either expensive or impossible tomigrate might reduce the ability of the migration policy to move workaround the network and balance loads effectively. However, we observethat the majority of long-lived jobs are, in fact, CPU-bound, and it is theselong-lived jobs that consume the majority of CPU time. Thus, even if themigration policy were only able to migrate a subset of the jobs in thesystem, it could still have a significant load-balancing effect.
Another way in which the proposed migration policy should be altered ina more general environment is that n (the number of jobs at the source)and m (the number of jobs at the target host) should distinguish betweenCPU-bound jobs and other types of jobs, since only CPU-bound jobs affectCPU contention and therefore are significant in CPU load balancing.
Another important consideration in load balancing is the effect of localscheduling at the hosts. Most prior studies of load balancing have assumed,as we do, that the local scheduling is round-robin (or processor-sharing). Afew assume first-come-first-served scheduling, but fewer still have studiedthe effect of feedback scheduling, where processes that have used the leastCPU time are given priority over older processes. We simulated feedbackscheduling and found that it greatly reduced mean slowdown (from approx-imately 2.5 to between 1.2 and 1.7, depending on load) even withoutmigration. Thus the potential benefit of either type of migration is greatlyreduced.
We evaluated the nonpreemptive migration policy from Section 5.1.1under feedback scheduling and found that it often makes things worse,increasing the mean slowdown in 5 of the 8 runs and only decreasing it by11% in the best case (highest load).
Exploiting Process Lifetime Distributions • 281
ACM Transactions on Computer Systems, Vol. 15, No. 3, August 1997.

To evaluate our preemptive policy, we had to change the migrationcriterion to reflect the effect of local scheduling. Under processor sharing,we assume that the slowdown imposed on a process is equal to the numberof processes on the host. Under feedback scheduling, the slowdown is closerto the number of younger processes, since older processes have lowerpriority. Thus, we modified the migration criterion in Section 3.1 so that nand m are the number of processes at the source and target hosts that areyounger than the migrant process. Using this criterion, preemptive migra-tion reduces mean normalized slowdown by 12–32% and reduces thenumber of severely slowed processes (slowdown greater than 5) by 30–60%.
An issue that remains unresolved is whether feedback scheduling is aseffective in real systems as it was in our simulations. For example,decay-usage scheduling as used in UNIX has some characteristics of bothround-robin and feedback policies [Epema 1995]. Young jobs do have someprecedence, but old jobs that perform interaction or other I/O are givenhigher priority, which allows them to interfere with short jobs. In ourexperiments on a SPARC workstation running SunOS, we found that along-running job that performs periodic I/O can obtain more than 50% ofthe CPU time, even if it is sharing a host with much younger processes. Themore recent lottery scheduling behaves more like processor sharing [Wald-spurger and Weihl 1994]. To understand the effect of local scheduling onload balancing requires a process model that includes interaction and I/O.
8. CONCLUSIONS
In summary, this article makes the following points:
—To evaluate migration strategies, it is important to model the distribu-tion of process lifetimes accurately. Assuming an exponential distribu-tion can underestimate the benefits of preemptive migration, because itignores the fact that old jobs are expected to be long-lived. Even alifetime distribution that matches the measured distribution in bothmean and variance may be misleading in designing and evaluatingload-balancing policies.
—Preemptive migration outperforms nonpreemptive migration even whenmemory-transfer costs are high, for the following reason: nonpreemptivename-based strategies choose processes for migration that are expectedto have long lives. If this prediction is wrong, and a process runs longerthan expected, it cannot be migrated away, and many subsequent smallprocesses will be delayed. A preemptive strategy is able to predictlifetimes more accurately (based on age), and more importantly, if theprediction is wrong, the system can recover by migrating the processlater.
—Migrating a long job away from a busy host helps not only the long job,but also the many short jobs that are expected to arrive at the host in thefuture. A busy host is expected to receive many arrivals because of theserial correlation (burstiness) of the arrival process.
282 • M. Harchol-Balter and A. B. Downey
ACM Transactions on Computer Systems, Vol. 15, No. 3, August 1997.

—Using the functional form of the distribution of process lifetimes, we havederived a criterion for the minimum time a process must age before beingmigrated. This criterion is parameterless and robust across a range ofloads.
—Exclusive use of mean slowdown as a metric of system performanceunderstates the benefits of load balancing as perceived by users andespecially understates the benefits of preemptive load balancing. Oneperformance metric which is more related to user perception is thenumber of severely slowed processes. Although nonpreemptive migrationeliminates half of these noticeable delays, preemptive migration reducesthem by a factor of 10.
—Although preemptive migration is difficult to implement, several systemshave chosen to implement it for reasons other than load balancing. Ourresults suggest these systems would benefit from incorporating a pre-emptive load-balancing policy.
ACKNOWLEDGMENTS
We would like to thank Tom Anderson and the members of the NOW groupfor comments and suggestions on our experimental setup. We are alsogreatly indebted to the anonymous reviewers from SIGMETRICS andSOSP and to John Zahorjan, whose comments greatly improved the qualityof this article.
REFERENCES
ABRAHAMS, D. M. AND RIZZARDI, F. 1988. The Berkeley Interactive Statistical System. W. W.Norton.
AGRAWAL, R. AND EZZET, A. 1987. Location independent remote execution in NEST. IEEETrans. Softw. Eng. 13, 8 (Aug.), 905–912.
AHMAD, I., GHAFOOR, A., AND MEHROTRA, K. 1991. Performance prediction of distributed loadbalancing on multicomputer systems. In Supercomputing. IEEE, New York, 830–839.
ARTSY, Y. AND FINKEL, R. 1989. Designing a process migration facility: The Charlotteexperience. IEEE Comput. 22, 1, 47–56.
BARAK, A., SHAI, G., AND WHEELER, R. G. 1993. The MOSIX Distributed Operating System:Load Balancing for UNIX. Springer-Verlag, Berlin.
BONOMI, F. AND KUMAR, A. 1990. Adaptive optimal load balancing in a nonhomogeneousmultiserver system with a central job scheduler. IEEE Trans. Comput. 39, 10 (Oct.),1232–1250.
BRYANT, R. M. AND FINKEL, R. A. 1981. A stable distributed scheduling algorithm. In the2nd International Conference on Distributed Computing Systems. 314–323.
CABRERA, F. 1986. The influence of workload on load balancing strategies. In Proceedings ofthe Usenix Summer Conference (June). USENIX Assoc., Berkeley, Calif., 446–458.
CASAS, J., CLARK, D. L., KONURU, R., OTTO, S. W., PROUTY, R. M., AND WALPOLE, J. 1995.Mpvm: A migration transparent version of pvm. Comput. Syst. 8, 2 (Spring), 171–216.
CASAVANT, T. L. AND KUHL, J. G. 1987. Analysis of three dynamic distributed load-balancingstrategies with varying global information requirements. In the 7th International Confer-ence on Distributed Computing Systems (Sept.). IEEE, New York, 185–192.
CHOWDHURY, S. 1990. The greedy load sharing algorithm. J. Parallel Distrib. Comput. 9,93–99.
DE PAOLI, D. AND GOSCINSKI, A. 1995. The rhodos migration facility. Tech. Rep. TR C95-36,School of Computing and Mathematics, Deakin Univ., Victoria, Australia. Available via
Exploiting Process Lifetime Distributions • 283
ACM Transactions on Computer Systems, Vol. 15, No. 3, August 1997.

http://www.cm.deakin.edu.au/rhodos/rh tr95.html#C95-36. Submitted to the Journal of Sys-tems and Software.
DOUGLIS, F. AND OUSTERHOUT, J. 1991. Transparent process migration: Design alternativesand the Sprite implementation. Softw. Pract. Exper. 21, 8 (Aug.), 757–785.
DOWNEY, A. B. AND HARCHOL-BALTER, M. 1995. A note on “The limited performance benefitsof migrating active processes for load sharing.” Tech. Rep. UCB/CSD-95-888, Univ. ofCalifornia, Berkeley, Calif.
EAGER, D. L., LAZOWSKA, E. D., AND ZHAORJAN, J. 1986. Adaptive load sharing in homoge-neous distributed systems. IEEE Trans. Softw. Eng. 12, 5 (May), 662–675.
EAGER, D. L., LAZOWSKA, E. D., AND ZAHORJAN, J. 1988. The limited performance benefits ofmigrating active processes for load sharing. In the ACM SIGMETRICS Conference onMeasuring and Modeling of Computer Systems. ACM, New York, 662–675.
EPEMA, D. 1995. An analysis of decay-usage scheduling in multiprocessors. In the ACMSIGMETRICS Conference on Measurement and Modeling of Computer Systems. ACM, NewYork, 74–85.
EVANS, D. J. AND BUTT, W. U. N. 1993. Dynamic load balancing using task-transferprobabilities. Parallel Comput. 19, 897–916.
HAC, A. AND JIN, X. 1990. Dynamic load balancing in a distributed system using a sender-initiated algorithm. J. Syst. Softw. 11, 79–94.
HENNESSY, J. L. AND PATTERSON, D. A. 1990. Computer Architecture: A Quantitative Ap-proach. Morgan Kaufmann, San Mateo, Calif.
KRUEGER, P. AND LIVNY, M. 1988. A comparison of preemptive and non-preemptive loaddistributing. In the 8th International Conference on Distributed Computing Systems. IEEE,New York, 123–130.
KUNZ, T. 1991. The influence of different workload descriptions on a heuristic load balanc-ing scheme. IEEE Trans. Softw. Eng. 17, 7 (July), 725–730.
LARSEN, R. J. AND MARX, M. L. 1986. An Introduction to Mathematical Statistics and ItsApplications. 2nd ed. Prentice-Hall, Englewood Cliffs, N.J.
LELAND, W. E. AND OTT, T. J. 1986. Load-balancing heuristics and process behavior. InProceedings of Performance ’86 and ACM SIGMETRICS. Vol. 14. ACM, New York, 54–69.
LIN, H.-C. AND RAGHAVENDRA, C. 1993. A state-aggregation method for analyzing dynamicload-balancing policies. In the IEEE 13th International Conference on Distributed Comput-ing Systems. IEEE, New York, 482–489.
LITZKOW, M. AND LIVNY, M. 1990. Experience with the Condor distributed batch system. Inthe IEEE Workshop on Experimental Distributed Systems. IEEE, New York, 97–101.
LITZKOW, M., LIVNY, M., AND MUTKA, M. 1988. Condor—A hunter of idle workstations. In the8th International Conference on Distributed Computing Systems. IEEE, New York.
LIVNY, M. AND MELMAN, M. 1982. Load balancing in homogeneous broadcast distributedsystems. In the ACM Computer Network Performance Symposium (April). ACM, New York,47–55.
MILOJICIC, D. S. 1993. Load distribution: Implementation for the Mach microkernel. Ph.D.dissertation, Univ. of Kaiserslautern, Kaiserslautern, Germany.
MIRCHANDANEY, R., TOWSLEY, D., AND STANKOVIC, J. A. 1990. Adaptive load sharing inheterogeneous distributed systems. J. Parallel Distrib. Comput. 9, 331–346.
POWELL, M. AND MILLER, B. 1983. Process migrations in DEMOS/MP. In the 6th ACMSymposium on Operating Systems Principles (Nov.). ACM, New York, 110–119.
PULIDAS, S., TOWSLEY, D., AND STANKOVIC, J. A. 1988. Imbedding gradient estimators in loadbalancing algorithms. In the 8th International Conference on Distributed Computing Sys-tems (June). IEEE, New York, 482–490.
ROMMEL, C. G. 1991. The probability of load balancing success in a homogeneous network.IEEE Trans. Softw. Eng. 17, 922–933.
ROSIN, R. F. 1965. Determining a computing center environment. Commun. ACM 8, 7.SILBERSCHATZ, A., PETERSON, J., AND GALVIN, P. 1994. Operating System Concepts. 4th ed.
Addison-Wesley, Reading, Mass.SVENSSON, A. 1990. History, an intelligent load sharing filter. In the IEEE 10th Interna-
tional Conference on Distributed Computing Systems. IEEE, New York, 546–553.
284 • M. Harchol-Balter and A. B. Downey
ACM Transactions on Computer Systems, Vol. 15, No. 3, August 1997.

TANENBAUM, A., VAN RENESSE, R., VAN STAVEREN, H., AND SHARP, G. 1990. Experiences withthe Amoeba distributed operating system. Commun. ACM 33, IEEE, New York, 336–346.
THEIMER, M. M., LANTZ, K. A., AND CHERITON, D. R. 1985. Preemptable remote executionfacilities for the V-System. In the 10th ACM Symposium on Operating Systems Principles.ACM, New York, 2–12.
THIEL, G. 1991. Locus operating system, a transparent system. Comput. Commun. 14, 6,336–346.
VAHDAT, A. M., GHORMLEY, D. P., AND ANDERSON, T. E. 1994. Efficient, portable, and robustextension of operating system functionality. Tech. Rep. UCB/CSD-94-842, Univ. of Califor-nia, Berkeley, Calif.
WALDSPURGER, C. A. AND WEIHL, W. E. 1994. Lottery scheduling: Flexible proportional-share resource management. In Proceedings of the 1st Symposium on Operating SystemDesign and Implementation. 1–11.
WANG, J., ZHOU, S., K. AHMED, AND LONG, W. 1993. LSBATCH: A distributed load sharingbatch system. Tech. Rep. CSRI-286, Computer Systems Research Inst., Univ. of Toronto,Toronto, Canada. April.
WANG, Y.-T. AND MORRIS, R. J. 1985. Load sharing in distributed systems. IEEE Trans.Comput. C-94, 3 (Mar.), 204–217.
ZAYAS, E. R. 1987. Attacking the process migration bottleneck. In the 11th ACM Sympo-sium on Operating Systems Principles. ACM, New York, 13–24.
ZHANG, Y., HAKOZAKI, K., KAMEDA, H., AND SHIMIZU, K. 1995. A performance comparison ofadaptive and static load balancing in heterogeneous distributed systems. In Proceedings ofthe 28th Annual Simulation Symposium. 332–340.
ZHOU, S. 1987. Performance studies for dynamic load balancing in distributed systems.Ph.D. dissertation, Univ. of California, Berkeley, Calif.
ZHOU, S. AND FERRARI, D. 1987. A measurement study of load balancing performance. In theIEEE 7th International Conference on Distributed Computing Systems. IEEE, New York,490–497.
ZHOU, S., WANG, J., ZHENG, X., AND DELISLE, P. 1993. Utopia: A load-sharing facility forlarge heterogeneous distributed computing systems. Softw. Pract. Exper. 23, 2 (Dec.),1305–1336.
Received January 1997; revised May 1997; accepted June 1997
Exploiting Process Lifetime Distributions • 285
ACM Transactions on Computer Systems, Vol. 15, No. 3, August 1997.