EXPLOITATION OF DIGITAL SURFACE MODELS GENERATED …
7
EXPLOITATION OF DIGITAL SURFACE MODELS GENERATED FROM WORLDVIEW-2 DATA FOR SAR SIMULATION TECHNIQUES R. Ilehag a, * , S. Auer b , P. d’Angelo b a Institute of Photogrammetry and Remote Sensing, Karlsruhe Institute of Technology (KIT), Englerstr. 7, 76131 Karlsruhe, Germany - [email protected] b Remote Sensing Technology Institute, German Aerospace Center (DLR), 82234 Oberpfaffenhofen, Germany - (stefan.auer, pablo.angelo)@dlr.de KEY WORDS: Synthetic Aperture Radar, Digital Surface Models, Simulation, Urban areas ABSTRACT: GeoRaySAR, an automated SAR simulator developed at DLR, identifies buildings in high resolution SAR data by utilizing geometric knowledge extracted from digital surface models (DSMs). Hitherto, the simulator has utilized DSMs generated from LiDAR data from airborne sensors with pre-filtered vegetation. Discarding the need for pre-optimized model input, DSMs generated from high resolution optical data (acquired with WorldView-2) are used for the extraction of building-related SAR image parts in this work. An automatic preprocessing of the DSMs has been developed for separating buildings from elevated vegetation (trees, bushes) and reducing the noise level. Based on that, automated simulations are triggered considering the properties of real SAR images. Locations in three cities, Munich, London and Istanbul, were chosen as study areas to determine advantages and limitations related to WorldView-2 DSMs as input for GeoRaySAR. Beyond, the impact of the quality of the DSM in terms of building extraction is evaluated as well as evaluation of building DSM, a DSM only containing buildings. The results indicate that building extents can be detected with DSMs from optical satellite data with various success, dependent on the quality of the DSM as well as on the SAR imaging perspective. 1. INTRODUCTION One of the strengths of using SAR images as source of infor- mation is related to near-real time applications in the context of unexpected events, e.g. earthquake, due to by the independence of weather conditions and the time of the day. However, the in- terpretation of scenes covering urban areas acquired with SAR is often a challenging task due to geometric distortion effects perti- nent to the imaging concept. Various simulators have been developed to ease the interpretation of SAR images of urban areas, e.g. by taking into account the electromagnetic and geometrical properties of buildings (Guida et al., 2008) or by utilizing ray tracing (Hammer and Schulz, 2011). GeoRaySAR is a simulator of the latter type, being de- veloped at DLR, which enables the identification of buildings in high resolution SAR data. To this end, prior knowledge about the scene geometry has to be extracted for the automated predic- tion of building extents. The knowledge can be acquired from either 3D GIS models (Auer and Donaubauer, 2015) or from DSMs (Tao et al., 2014). In (Tao et al., 2014) has prior knowl- edge been derived from DSMs based on LiDAR data (airborne sensor) that only contained man-made structures (i.e. vegetation had been pre-filtered). However, more realistic scenarios would expect DSMs on the basis of satellite data without pre-filtered vegetation (e.g. with support of cadastre information). As a part of GeoRaySAR, geometric knowledge is extracted from a DSM, which is decomposed to add a digital terrain model (DTM) and a normalized DSM (nDSM) including elevated scene objects. Using the height models, GeoRaySAR simulates separate layers representing different signal reflection types: single, double sig- nal reflections and a combination of both. For standard scenarios, * Corresponding author optical data from satellites is easier to access, such as WorldView- 2, compared to LiDAR data acquired from airborne sensors. Ac- quisition of optical data from satellites requires less planning, less man-power and is considerable cheaper than the acquisition of LiDAR data from airborne sensors. Therefore, extending the applicability of GeoRaySAR to use DSMs from high-resolution optical data is a crucial step toward realistic applications. Studies on the generation of DSMs with the usage of optical stereo images acquired with space borne sensors are presented in e.g. (Zhang and Gr¨ un, 2006) and (Hoja et al., 2005). These studies indicate that DSMs generated from space borne sensor can have a height accuracy between 1 to 3 m, depending on the structure of the study area. Based on image matching with em- phasis on tri-stereo data (Carl et al., 2013), DSMs have been gen- erated from high resolution WorldView-2 stereo images for ur- ban scenes, which resulted in few height outliers. (Carl et al., 2013) confirms that the geometric quality of DSMs generated from WorldView-2 data can be used for automated SAR image simulation and, based on that, the interpretation of urban scenes. This paper presents an extended approach for interpretation of ur- ban areas with the usage of GeoRaySAR, using an automatic pre- processing chain. The main objective of the paper is to preprocess DSMs generated from WorldView-2, a high resolution optical satellite, for identification of buildings in SAR images (acquired with the satellite TerraSAR-X). These DSMs, in comparison to the previously used manually filtered DSMs, need to be prepro- cessed in terms of noise reduction and removal of vegetation. For evaluation of the preprocessing and determining the limitations of GeoRaySAR, study areas consisting of diverse types of buildings and densities are chosen. The remainder of the paper is structured as follows, section 2 describes the method for processing the DSM to provide the input models for GeoRaySAR. The chosen study areas and used data The International Archives of the Photogrammetry, Remote Sensing and Spatial Information Sciences, Volume XLII-1/W1, 2017 ISPRS Hannover Workshop: HRIGI 17 – CMRT 17 – ISA 17 – EuroCOW 17, 6–9 June 2017, Hannover, Germany This contribution has been peer-reviewed. doi:10.5194/isprs-archives-XLII-1-W1-55-2017 55
Transcript of EXPLOITATION OF DIGITAL SURFACE MODELS GENERATED …

EXPLOITATION OF DIGITAL SURFACE MODELS GENERATED FROMWORLDVIEW-2 DATA FOR SAR SIMULATION TECHNIQUES
R. Ilehaga,∗, S. Auerb, P. d’Angelob
a Institute of Photogrammetry and Remote Sensing, Karlsruhe Institute of Technology (KIT), Englerstr. 7, 76131 Karlsruhe, Germany [email protected]
b Remote Sensing Technology Institute, German Aerospace Center (DLR), 82234 Oberpfaffenhofen, Germany -(stefan.auer, pablo.angelo)@dlr.de
KEY WORDS: Synthetic Aperture Radar, Digital Surface Models, Simulation, Urban areas
ABSTRACT:
GeoRaySAR, an automated SAR simulator developed at DLR, identifies buildings in high resolution SAR data by utilizing geometricknowledge extracted from digital surface models (DSMs). Hitherto, the simulator has utilized DSMs generated from LiDAR data fromairborne sensors with pre-filtered vegetation. Discarding the need for pre-optimized model input, DSMs generated from high resolutionoptical data (acquired with WorldView-2) are used for the extraction of building-related SAR image parts in this work. An automaticpreprocessing of the DSMs has been developed for separating buildings from elevated vegetation (trees, bushes) and reducing the noiselevel. Based on that, automated simulations are triggered considering the properties of real SAR images.Locations in three cities, Munich, London and Istanbul, were chosen as study areas to determine advantages and limitations related toWorldView-2 DSMs as input for GeoRaySAR. Beyond, the impact of the quality of the DSM in terms of building extraction is evaluatedas well as evaluation of building DSM, a DSM only containing buildings. The results indicate that building extents can be detected withDSMs from optical satellite data with various success, dependent on the quality of the DSM as well as on the SAR imaging perspective.
1. INTRODUCTION
One of the strengths of using SAR images as source of infor-mation is related to near-real time applications in the context ofunexpected events, e.g. earthquake, due to by the independenceof weather conditions and the time of the day. However, the in-terpretation of scenes covering urban areas acquired with SAR isoften a challenging task due to geometric distortion effects perti-nent to the imaging concept.
Various simulators have been developed to ease the interpretationof SAR images of urban areas, e.g. by taking into account theelectromagnetic and geometrical properties of buildings (Guidaet al., 2008) or by utilizing ray tracing (Hammer and Schulz,2011). GeoRaySAR is a simulator of the latter type, being de-veloped at DLR, which enables the identification of buildings inhigh resolution SAR data. To this end, prior knowledge aboutthe scene geometry has to be extracted for the automated predic-tion of building extents. The knowledge can be acquired fromeither 3D GIS models (Auer and Donaubauer, 2015) or fromDSMs (Tao et al., 2014). In (Tao et al., 2014) has prior knowl-edge been derived from DSMs based on LiDAR data (airbornesensor) that only contained man-made structures (i.e. vegetationhad been pre-filtered). However, more realistic scenarios wouldexpect DSMs on the basis of satellite data without pre-filteredvegetation (e.g. with support of cadastre information).
As a part of GeoRaySAR, geometric knowledge is extracted froma DSM, which is decomposed to add a digital terrain model (DTM)and a normalized DSM (nDSM) including elevated scene objects.Using the height models, GeoRaySAR simulates separate layersrepresenting different signal reflection types: single, double sig-nal reflections and a combination of both. For standard scenarios,
∗Corresponding author
optical data from satellites is easier to access, such as WorldView-2, compared to LiDAR data acquired from airborne sensors. Ac-quisition of optical data from satellites requires less planning,less man-power and is considerable cheaper than the acquisitionof LiDAR data from airborne sensors. Therefore, extending theapplicability of GeoRaySAR to use DSMs from high-resolutionoptical data is a crucial step toward realistic applications.
Studies on the generation of DSMs with the usage of opticalstereo images acquired with space borne sensors are presentedin e.g. (Zhang and Grun, 2006) and (Hoja et al., 2005). Thesestudies indicate that DSMs generated from space borne sensorcan have a height accuracy between 1 to 3 m, depending on thestructure of the study area. Based on image matching with em-phasis on tri-stereo data (Carl et al., 2013), DSMs have been gen-erated from high resolution WorldView-2 stereo images for ur-ban scenes, which resulted in few height outliers. (Carl et al.,2013) confirms that the geometric quality of DSMs generatedfrom WorldView-2 data can be used for automated SAR imagesimulation and, based on that, the interpretation of urban scenes.
This paper presents an extended approach for interpretation of ur-ban areas with the usage of GeoRaySAR, using an automatic pre-processing chain. The main objective of the paper is to preprocessDSMs generated from WorldView-2, a high resolution opticalsatellite, for identification of buildings in SAR images (acquiredwith the satellite TerraSAR-X). These DSMs, in comparison tothe previously used manually filtered DSMs, need to be prepro-cessed in terms of noise reduction and removal of vegetation. Forevaluation of the preprocessing and determining the limitations ofGeoRaySAR, study areas consisting of diverse types of buildingsand densities are chosen.
The remainder of the paper is structured as follows, section 2describes the method for processing the DSM to provide the inputmodels for GeoRaySAR. The chosen study areas and used data
The International Archives of the Photogrammetry, Remote Sensing and Spatial Information Sciences, Volume XLII-1/W1, 2017 ISPRS Hannover Workshop: HRIGI 17 – CMRT 17 – ISA 17 – EuroCOW 17, 6–9 June 2017, Hannover, Germany
This contribution has been peer-reviewed. doi:10.5194/isprs-archives-XLII-1-W1-55-2017 55

are introduced in section 3, while results of the processing chainare shown and discussed in section 4, followed by the conclusionof the paper in section 5.
2. METHODOLOGY
GeoRaySAR requires as input one SAR image meta file, includ-ing the parameters related to the image acquisition, and one DSM.GeoRaySAR produces as output three layers which represent di-rect signal response, signal double reflection and the combinationof both in one layer (high reflection levels are deactivated due tothe limited level of detail of the DSM). The ray tracing proce-dure, which relies on triangulated surface models derived fromthe DSM (pixels), can be conducted for different input model de-rived from the DSM, which provides the opportunity to separatebuildings and elevated vegetation.
The DSMs used in this study have been generated by utilizingthe method described in (Krauß, 2014), a modified version ofthe semi global matching approach (SGM) (Hirschmuller, 2008).Since the main objective in this study is to predict building ex-tents, elevated vegetation is excluded from the input to GeoRaySAR.This was done with an automatic chain for processing the DSMsgenerated from optical images by SGM.
The automatic preprocessing of the DSM consists of two steps,elevated vegetation filtering and noise reduction, and requires anorthorectified optical image and a DSM as input. The DSM andthe optical image, which is preferably from same sensor, have tooverlap each other, i.e. they have to cover the same scene, sharethe same spatial resolution and size in terms of number of pixels.A tiling process has been developed as an additional step for theprocessing of extended scenes. In sum, the steps highlighted inblue color in Figure 1 have been developed in the presented work.
2.1 Preprocessing
Elevated vegetation is separated from buildings to predict build-ing extents in SAR images. The extent of elevated vegetationwould be detected during the ray-tracing if left untouched in theDSM, since the GeoRaySAR simulates extents of all objects inthe DSM. Hence, by filtering out the elevated vegetation, theDSM scene is cleared with only buildings and ground parts (non-vegetated, vegetated) remaining.
Identifying elevated vegetation is done by calculating the normal-ized difference vegetation index (NDVI) and utilizing a nDSMto detect vegetational growth taller than a height threshold (seechapters 2.1.2 and 2.1.3). Grass is not separated from the DSMas it is considered as part of the ground surface. To reduce thenoise in the binary mask, morphological operations are applied(see chapter 2.1.4). Elevated vegetation is separated from build-ings in the DSM by using the binary mask and new height valuesare assigned to the affected pixels from the given DTM.
Detailed descriptions of the processing steps are presented in thefollowing subsections (see Figure 2 for an overview, exemplify-ing the procedure for the Alte Pinakothek in Munich). The mainobjective is to connect geometric information (raw DSM) withthe procedure of GeoRaySAR, while preparing the input modelin an unsupervised manner.
DSM and optical image
Tiling? Split
Vegetation filtering
Fuzzy classification
DTM and nDSM generation
Mask
Morphological operations
Replacement of values
Noise reduction
Preprocessed DSM
GeoRaySAR
Orbit meta file
Signal reflections
Tiles? Merge
Signal reflections
no
yes
yes
no
Figure 1. Work flow of the simulation chain, with the preprocess-ing and the tiling marked in blue.
2.1.1 Fuzzy Classification Using NDVI The well-known NDVIis derived from combining the red and near infrared band, oftenused to detect healthy vegetation. The idea is adopted in this workby calculating the NDVI, by either using the combination of thered and the red-edge band or the red and the infra-red band (de-pending on the availability). The choice of the band combinationcan be changed depending on the chosen sensor. Equation 1 ex-presses the utilized band combination with RE being the red-edgeband and R the red band.
NDV I =RE −R
RE +R(1)
Rule based fuzzy classification is utilized to classify the pixelsinto vegetation, using the same approach as in (Krauß et al., 2012);see Equation 2. Element x represents the NDVI value, c the lowerthreshold and d the upper threshold. The classification of vege-tation results in values ranging from 0 to 1, representing the cer-tainty that a pixel is vegetation or not. The thresholds used toclassify vegetation are c = 0.2 and d = 0.4. These thresholds werechosen empirically after comparing classification results with theusage of different thresholds. A layer containing the probabil-ity of a pixel being vegetation or not is produced following thisconcept.
Fuzzy xc,d =
0 if x < cx−cd−c
if c ≤ x ≤ d
1 if x > d
(2)
2.1.2 DTM and nDSM Generation To keep non-elevated veg-etation in the DSM, a nDSM had to be created. The reason to
The International Archives of the Photogrammetry, Remote Sensing and Spatial Information Sciences, Volume XLII-1/W1, 2017 ISPRS Hannover Workshop: HRIGI 17 – CMRT 17 – ISA 17 – EuroCOW 17, 6–9 June 2017, Hannover, Germany
This contribution has been peer-reviewed. doi:10.5194/isprs-archives-XLII-1-W1-55-2017
56

(a) (b)
(c) (d)
(e) (f)
(g) (h)
(i) (j)
(k)
Figure 2. Preprocessing steps, exemplified for Alte Pinakothekin Munich, Germany. A DSM generated from WorldView-2 data(a) and an optical image from WorldView-2 (b) are used as in-put to the preprocessing chain. The NDVI (c) is calculated todo the fuzzy classification (d). A DTM (e) and a nDSM (f) aregenerated. A binary mask (g) is determined to separate elevatedvegetation. Noise in the mask is reduced by the morphologicaloperators closing (h) and opening (i). Image (j) displays the re-placement of the height values and (k) the final DSM after noisereduction.
let grass remain in the DSM is to preserve ground informationto enable the interpretation of ground parts. In this study grasswas assumed to be vegetation with a maximum height of 20 cm.In contrast, elevated vegetation such as trees and bushes are ex-cluded from the DSM and stored in an individual nDSM model.
The method of (Arefi et al., 2011) is used to generate the DTM.Generation of the DTM was done by utilizing a gray-scale recon-struction, an iterative morphological transformation that classifiesthe pixels into ground or non-ground. Padding is added to ease
the identification of object boundaries close to the border of theimage. The size of the padding is set to three pixels, assigneda value of the median DSM height in the full scene. To removegaps in the resulting DTM, interpolation based on Delaunay tri-angulation is utilized, mentioned in (Arefi et al., 2011). After theremoval of the padding pixels, the gaps in the DTM are filled withvalues derived from a multilevel B-Spline interpolation. By sub-tracting the interpolated DTM from the DSM, the nDSM is de-rived. Finally, non-zero elements of the nDSM (relative heights)are assigned with the original DSM heights (absolute heights).
2.1.3 Separation of Elevated Vegetation By combining theinformation gained from the nDSM and the fuzzy classification, abinary mask is derived, assigning elevated vegetation with a pixelvalue of 0 and 1 otherwise. This is done by using the classifica-tion method described in (Krauß et al., 2012), but with a differentminimum height. Pixels that have a certainty of 50% being veg-etation and are taller than the minimum height are classified aselevated vegetation, as seen in Equation 3. Pixels that are consid-ered being elevated vegetation (v in Equation 3) received a pixelvalue of 0.
Mask x =
{0 if v ≥ 50% and nDSM ≥ 0.2 m1 if v < 50% and nDSM < 0.2 m
(3)
2.1.4 Morphological Operations, Gap Filling and Noise Re-duction For reducing the noise in the binary mask, two mor-phological operations, closing and opening, were used. Closingconsists of dilation, expanding the areas containing non-vegetationin this case, followed by erosion, contracting of the areas again.By performing closing, areas smaller than a fixed structure sizeare filled in with the pixel value 1. Opening consists of firstly exe-cuting erosion followed by dilation, which removes areas smallerthan a fixed structure size. The noise in the binary mask is re-duced by performing closing and opening. To reduce the noisefor larger areas, the window for morphological operations is setto nine times nine pixels.
DSM pixels with discarded elevated vegetation, i.e. pixels witha value of 0 in the binary mask, receive new height values fromthe corresponding DTM pixel. A median filter is used for noisereduction with a window size of nine times nine pixels. The de-cision for median filtering was driven by the need to retain thebuilding shapes.
2.1.5 Building DSM Based on the pre-filtered DSM and DTM,a building DSM is derived. The corresponding DSM pixels areidentified by analyzing the difference between the preprocessedDSM and a DTM (value > 0). The noise in the resulting binarymask is reduced by morphological operations (opening with 9x9window, dilation with 3x3 window). The final mask is used to ex-tract the building-related pixels from the pre-filtered DSM. In thecontext of ray tracing, only the remaining DSM pixels are usedfor triangulation to describe the scene geometry. Accordingly,SAR signal responses are only derived for building bodies.
2.2 TILING
The local incidence angle is assumed to be constant during theray-tracing, which does not correspond to reality. Moreover, whiledealing with larger scenes, the image simulation requires a con-siderable amount of computer memory. To overcome these as-pects, a tiling procedure is implemented, which introduces spatial
The International Archives of the Photogrammetry, Remote Sensing and Spatial Information Sciences, Volume XLII-1/W1, 2017 ISPRS Hannover Workshop: HRIGI 17 – CMRT 17 – ISA 17 – EuroCOW 17, 6–9 June 2017, Hannover, Germany
This contribution has been peer-reviewed. doi:10.5194/isprs-archives-XLII-1-W1-55-2017
57
sampling of the local signal incidence angle. The splitting of theDSM is based on the distance along the longest axis, which re-duces the deviation from the true signal incidence angle. Thethreshold for splitting the DSM is set to 1200 m for the casestudies presented below. Each tile is processed by the simula-tion chain, followed by the merging of the tiles to derive the fullscene. The resulting tiles may vary in size due to a variation ofmaximum heights in the tiles. To cope with this, the maximumand minimum coordinates along the two image axes among thetiles are identified, followed by the calculation of the size for themerged image. Then, an empty image layer is created and thepixel values are retrieved from the simulated tiles. The maximumintensity value is chosen in overlapping areas to keep the empha-sis on the building appearance in the image.
The spatial distance is used for splitting, inherently sampling thesignal incidence angle. If the tiling was based on the change ofthe incidence angle, one study area would be split into a differentnumber of tiles depending on the sensor perspective. At steeperangles, the angle difference increases faster, i.e. SAR imagestaken at steeper angles would be split into more tiles. The lo-cal scenes would differ unnecessarily in that case, which wouldhamper the comparison of simulated scenes with remarkable in-cidence angle differences.
3. STUDY AREAS AND DATA
The study areas consist of selected locations in the cities of Mu-nich, London and Istanbul. The three cities contain a variationof built up areas, such as densely packed quarters, narrow streetssurrounded by tall buildings and buildings of numerous sizes andtypes. This is of interest, since such a variation of study sceneshas not been used as input in GeoRaySAR earlier.
Data from WorldView-2 is used for the separation of elevatedvegetation and for the generation of the DSMs. The SAR imagesare acquired with TerraSAR-X, where the image meta files areused for extracting the sensor and image parameters. A DSMgenerated from LiDAR data for the scene of Munich is utilizedfor comparison with the preprocessed DSM based on WorldView-2, as seen in (Tao et al., 2014). The LiDAR data was acquiredApril 2003, with a vertical resolution of 0.1 m and a horizontalresolution of 1 m.
The images acquired from WorldView-2 were delivered with aresolution of 0.5 m for the panchromatic images and 2 m for themulti-spectral images. The DSMs had a resolution of 0.5 m andare generated prior to this study by using the modified versionof SGM (Krauß, 2014), matching several panchromatic imagescaptured at different viewing angles from the same orbit pass.Four images are used for DSM generation for Munich, five forLondon and three for Istanbul. The images were acquired 12thof July 2010 for Munich, 22nd of October 2011 for London and15th of July 2015 for Istanbul. The optical images used for thefuzzy classification were orthorectified.
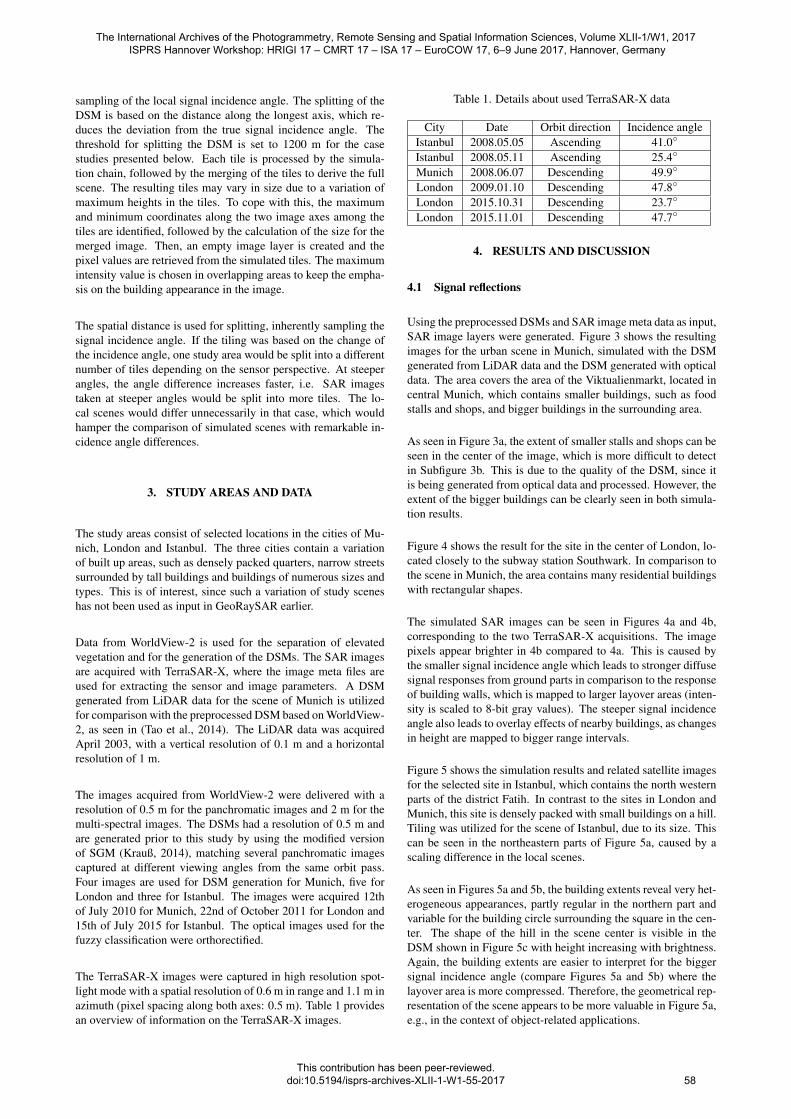
The TerraSAR-X images were captured in high resolution spot-light mode with a spatial resolution of 0.6 m in range and 1.1 m inazimuth (pixel spacing along both axes: 0.5 m). Table 1 providesan overview of information on the TerraSAR-X images.
Table 1. Details about used TerraSAR-X data
City Date Orbit direction Incidence angleIstanbul 2008.05.05 Ascending 41.0◦
Istanbul 2008.05.11 Ascending 25.4◦
Munich 2008.06.07 Descending 49.9◦
London 2009.01.10 Descending 47.8◦
London 2015.10.31 Descending 23.7◦
London 2015.11.01 Descending 47.7◦
4. RESULTS AND DISCUSSION
4.1 Signal reflections
Using the preprocessed DSMs and SAR image meta data as input,SAR image layers were generated. Figure 3 shows the resultingimages for the urban scene in Munich, simulated with the DSMgenerated from LiDAR data and the DSM generated with opticaldata. The area covers the area of the Viktualienmarkt, located incentral Munich, which contains smaller buildings, such as foodstalls and shops, and bigger buildings in the surrounding area.
As seen in Figure 3a, the extent of smaller stalls and shops can beseen in the center of the image, which is more difficult to detectin Subfigure 3b. This is due to the quality of the DSM, since itis being generated from optical data and processed. However, theextent of the bigger buildings can be clearly seen in both simula-tion results.
Figure 4 shows the result for the site in the center of London, lo-cated closely to the subway station Southwark. In comparison tothe scene in Munich, the area contains many residential buildingswith rectangular shapes.
The simulated SAR images can be seen in Figures 4a and 4b,corresponding to the two TerraSAR-X acquisitions. The imagepixels appear brighter in 4b compared to 4a. This is caused bythe smaller signal incidence angle which leads to stronger diffusesignal responses from ground parts in comparison to the responseof building walls, which is mapped to larger layover areas (inten-sity is scaled to 8-bit gray values). The steeper signal incidenceangle also leads to overlay effects of nearby buildings, as changesin height are mapped to bigger range intervals.
Figure 5 shows the simulation results and related satellite imagesfor the selected site in Istanbul, which contains the north westernparts of the district Fatih. In contrast to the sites in London andMunich, this site is densely packed with small buildings on a hill.Tiling was utilized for the scene of Istanbul, due to its size. Thiscan be seen in the northeastern parts of Figure 5a, caused by ascaling difference in the local scenes.
As seen in Figures 5a and 5b, the building extents reveal very het-erogeneous appearances, partly regular in the northern part andvariable for the building circle surrounding the square in the cen-ter. The shape of the hill in the scene center is visible in theDSM shown in Figure 5c with height increasing with brightness.Again, the building extents are easier to interpret for the biggersignal incidence angle (compare Figures 5a and 5b) where thelayover area is more compressed. Therefore, the geometrical rep-resentation of the scene appears to be more valuable in Figure 5a,e.g., in the context of object-related applications.
The International Archives of the Photogrammetry, Remote Sensing and Spatial Information Sciences, Volume XLII-1/W1, 2017 ISPRS Hannover Workshop: HRIGI 17 – CMRT 17 – ISA 17 – EuroCOW 17, 6–9 June 2017, Hannover, Germany
This contribution has been peer-reviewed. doi:10.5194/isprs-archives-XLII-1-W1-55-2017
58
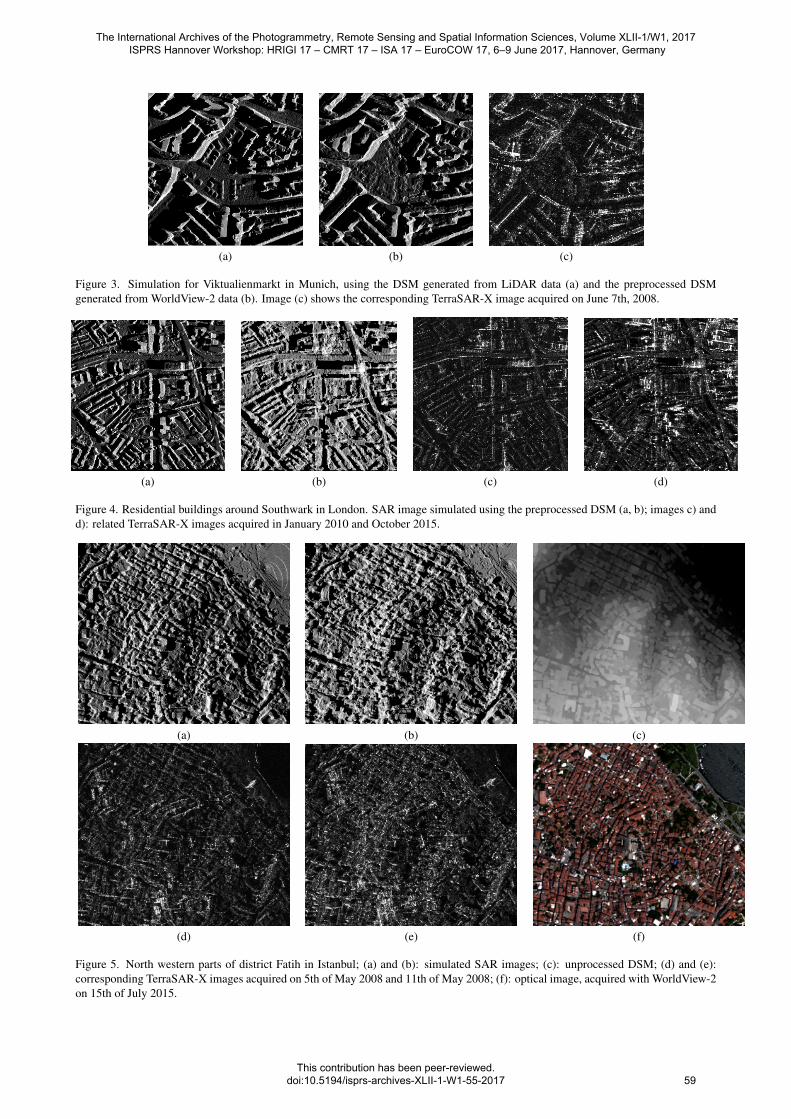
(a) (b) (c)
Figure 3. Simulation for Viktualienmarkt in Munich, using the DSM generated from LiDAR data (a) and the preprocessed DSMgenerated from WorldView-2 data (b). Image (c) shows the corresponding TerraSAR-X image acquired on June 7th, 2008.
(a) (b) (c) (d)
Figure 4. Residential buildings around Southwark in London. SAR image simulated using the preprocessed DSM (a, b); images c) andd): related TerraSAR-X images acquired in January 2010 and October 2015.
(a) (b) (c)
(d) (e) (f)
Figure 5. North western parts of district Fatih in Istanbul; (a) and (b): simulated SAR images; (c): unprocessed DSM; (d) and (e):corresponding TerraSAR-X images acquired on 5th of May 2008 and 11th of May 2008; (f): optical image, acquired with WorldView-2on 15th of July 2015.
The International Archives of the Photogrammetry, Remote Sensing and Spatial Information Sciences, Volume XLII-1/W1, 2017 ISPRS Hannover Workshop: HRIGI 17 – CMRT 17 – ISA 17 – EuroCOW 17, 6–9 June 2017, Hannover, Germany
This contribution has been peer-reviewed. doi:10.5194/isprs-archives-XLII-1-W1-55-2017
59
(a) (b)
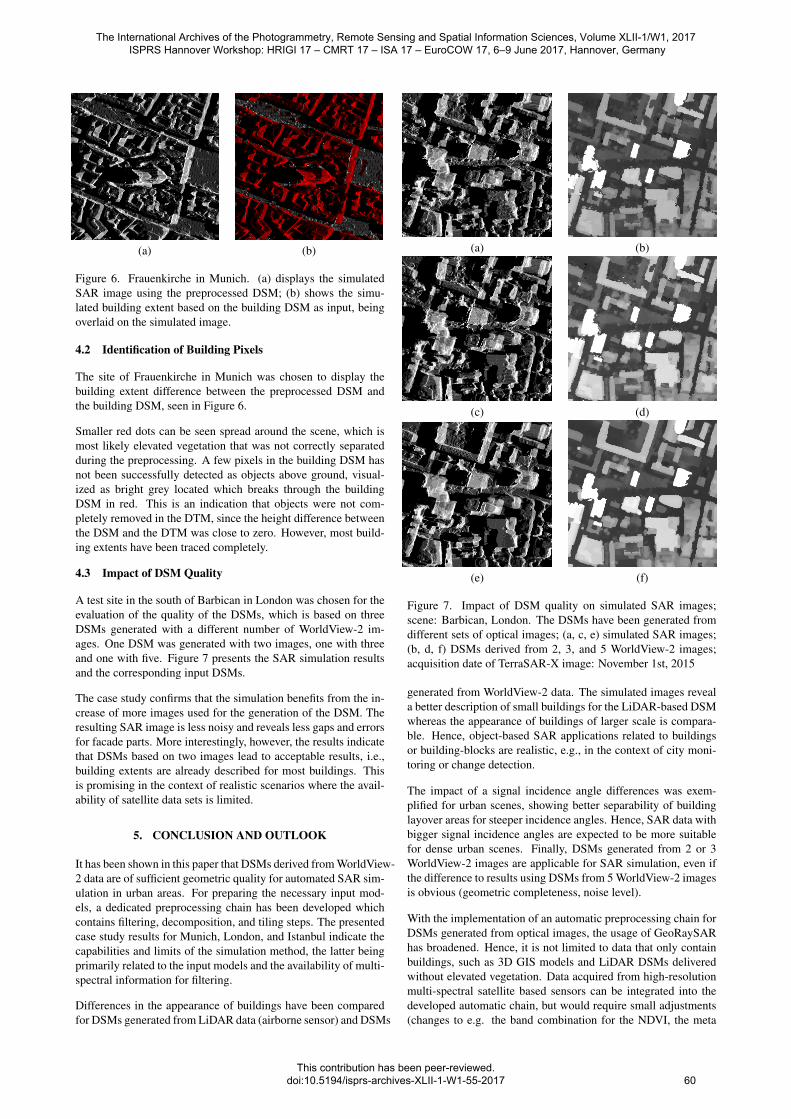
Figure 6. Frauenkirche in Munich. (a) displays the simulatedSAR image using the preprocessed DSM; (b) shows the simu-lated building extent based on the building DSM as input, beingoverlaid on the simulated image.
4.2 Identification of Building Pixels
The site of Frauenkirche in Munich was chosen to display thebuilding extent difference between the preprocessed DSM andthe building DSM, seen in Figure 6.
Smaller red dots can be seen spread around the scene, which ismost likely elevated vegetation that was not correctly separatedduring the preprocessing. A few pixels in the building DSM hasnot been successfully detected as objects above ground, visual-ized as bright grey located which breaks through the buildingDSM in red. This is an indication that objects were not com-pletely removed in the DTM, since the height difference betweenthe DSM and the DTM was close to zero. However, most build-ing extents have been traced completely.
4.3 Impact of DSM Quality
A test site in the south of Barbican in London was chosen for theevaluation of the quality of the DSMs, which is based on threeDSMs generated with a different number of WorldView-2 im-ages. One DSM was generated with two images, one with threeand one with five. Figure 7 presents the SAR simulation resultsand the corresponding input DSMs.
The case study confirms that the simulation benefits from the in-crease of more images used for the generation of the DSM. Theresulting SAR image is less noisy and reveals less gaps and errorsfor facade parts. More interestingly, however, the results indicatethat DSMs based on two images lead to acceptable results, i.e.,building extents are already described for most buildings. Thisis promising in the context of realistic scenarios where the avail-ability of satellite data sets is limited.
5. CONCLUSION AND OUTLOOK
It has been shown in this paper that DSMs derived from WorldView-2 data are of sufficient geometric quality for automated SAR sim-ulation in urban areas. For preparing the necessary input mod-els, a dedicated preprocessing chain has been developed whichcontains filtering, decomposition, and tiling steps. The presentedcase study results for Munich, London, and Istanbul indicate thecapabilities and limits of the simulation method, the latter beingprimarily related to the input models and the availability of multi-spectral information for filtering.
Differences in the appearance of buildings have been comparedfor DSMs generated from LiDAR data (airborne sensor) and DSMs
(a) (b)
(c) (d)
(e) (f)
Figure 7. Impact of DSM quality on simulated SAR images;scene: Barbican, London. The DSMs have been generated fromdifferent sets of optical images; (a, c, e) simulated SAR images;(b, d, f) DSMs derived from 2, 3, and 5 WorldView-2 images;acquisition date of TerraSAR-X image: November 1st, 2015
generated from WorldView-2 data. The simulated images reveala better description of small buildings for the LiDAR-based DSMwhereas the appearance of buildings of larger scale is compara-ble. Hence, object-based SAR applications related to buildingsor building-blocks are realistic, e.g., in the context of city moni-toring or change detection.
The impact of a signal incidence angle differences was exem-plified for urban scenes, showing better separability of buildinglayover areas for steeper incidence angles. Hence, SAR data withbigger signal incidence angles are expected to be more suitablefor dense urban scenes. Finally, DSMs generated from 2 or 3WorldView-2 images are applicable for SAR simulation, even ifthe difference to results using DSMs from 5 WorldView-2 imagesis obvious (geometric completeness, noise level).
With the implementation of an automatic preprocessing chain forDSMs generated from optical images, the usage of GeoRaySARhas broadened. Hence, it is not limited to data that only containbuildings, such as 3D GIS models and LiDAR DSMs deliveredwithout elevated vegetation. Data acquired from high-resolutionmulti-spectral satellite based sensors can be integrated into thedeveloped automatic chain, but would require small adjustments(changes to e.g. the band combination for the NDVI, the meta
The International Archives of the Photogrammetry, Remote Sensing and Spatial Information Sciences, Volume XLII-1/W1, 2017 ISPRS Hannover Workshop: HRIGI 17 – CMRT 17 – ISA 17 – EuroCOW 17, 6–9 June 2017, Hannover, Germany
This contribution has been peer-reviewed. doi:10.5194/isprs-archives-XLII-1-W1-55-2017
60

data import and naming convention). Hence, future studies withGeoRaySAR may extend simulations to further sensor data andexpand the study areas to other complex areas sites.
REFERENCES
Arefi, H., dAngelo, P., Mayer, H. and Reinartz, P., 2011. Itera-tive approach for efficient digital terrain model production fromCARTOSAT-1 stereo images. Journal of Applied Remote Sensing5, pp. 1–19.
Auer, S. and Donaubauer, A., 2015. Buildings in high resolu-tion SAR images - identification based on CityGML data. ISPRSAnnals of the Photogrammetry, Remote Sensing and Spatial In-formation Sciences pp. 9–16.
Carl, S., Barisch, S., Lang, F., d’ Angelo, P., Arefi, H. andReinartz, P., 2013. Operational generation of high resolutiondigital surface models from commercial tri-stereo satellite data.Photogrammetric Week 2013, Stuttgart, Germany pp. 261–269.
Guida, R., Iodice, A., Riccio, D. and Stilla, U., 2008. Model-based interpretation of high-resolution SAR images of buildings.IEEE Journal of Selected Topics in Applied Earth Observationsand Remote Sensing 1(2), pp. 107–109.
Hammer, H. and Schulz, K., 2011. SAR-simulation of large ur-ban scenes using an extended ray tracing approach. In: 2011 JointUrban Remote Sensing Event, pp. 289–292.
Hirschmuller, H., 2008. Stereo processing by semiglobal match-ing and mutual information. IEEE Transactions on Pattern Anal-ysis and Machine Intelligence 30(2), pp. 328–341.
Hoja, D., Reinartz, P. and Lehner, M., 2005. DSM generationfrom high resolution satellite imagery using additional informa-tion contained in existing DSM. ISPRS Workshop 2005 Han-nover, Germany.
Krauß, T., 2014. Six years operational processing of satellite datausing CATENA at DLR: Experiences and recommendations. KNKartographische Nachrichten - Journal of Cartography and Ge-ographic Information 64(2), pp. 74–80.
Krauß, T., Sirmacek, B., Arefi, H. and Reinartz, P., 2012. Fusingstereo and multispectral data from WorldView-2 for urban mod-eling. In: Algorithms and Technologies for Multispectral, Hyper-spectral, and Ultraspectral Imagery XVIII 2012, Baltimore, USA,pp. 1–15.
Tao, J., Auer, S., Palubinskas, G., Reinartz, P. and Bamler, R.,2014. Automatic SAR simulation technique for object identi-fication in complex urban scenarios. IEEE Journal of SelectedTopics in Applied Earth Observations and Remote Sensing 7(3),pp. 994–1003.
Zhang, L. and Grun, A., 2006. Multi-image matching for DSMgeneration from IKONOS imagery. IEEE Journal of Photogram-metry and Remote Sensing 60(3), pp. 195–211.
The International Archives of the Photogrammetry, Remote Sensing and Spatial Information Sciences, Volume XLII-1/W1, 2017 ISPRS Hannover Workshop: HRIGI 17 – CMRT 17 – ISA 17 – EuroCOW 17, 6–9 June 2017, Hannover, Germany
This contribution has been peer-reviewed. doi:10.5194/isprs-archives-XLII-1-W1-55-2017 61