Explaining the Gender Gap in Political...
25
Explaining the Gender Gap in Political Knowledge Mary-Kate Lizotte Stony Brook University Andrew H. Sidman John Jay College of Criminal Justice Much scholarship has noted that there are significant differences in the political behavior of women and men. Women, for example, are found to be more likely to identify as and vote for Democrats, less likely to hold conservative issue positions, and more likely to vote for incumbents. One of the more disturbing gender gaps occurs in political knowledge: Specifically, women are typically found to be less knowledgeable about politics and government than their male counterparts. We propose that much of the gap can be explained by theories of risk aversion, which imply that women are less likely to guess on questions for which they are uncertain. Using item response models, we demonstrate that failure to consider these gender-based differences leads to scales that significantly underestimate the political knowledge of women. Consistent with other work in this area, we find that accounting for the higher propensity of men to guess decreases the gender gap in knowledge by around 36%. I magine a situation in which two individuals, one man and one woman, are taking a public opinion survey. Both are asked a series of political knowledge questions. One of these questions asks them to list the five freedoms of the First Amendment. Though uncertain, the first individual takes a stab at it. The second individual, also uncertain, decides to choose the “don’t know” option instead of guessing. Assume that both individuals are of equivalent political sophistication. In this scenario, which individual is the man and which is the woman? In light of prior evidence from political knowledge research, the gender gap in Published by Cambridge University Press 1743-923X/09 $20.00 for The Women and Politics Research Section of the American Political Science Association. # 2009 The Women and Politics Research Section of the American Political Science Association. doi:10.1017/S1743923X09000130 127 Politics & Gender, 5 (2009), 127–151. Printed in the U.S.A.
Transcript of Explaining the Gender Gap in Political...

Explaining the Gender Gap inPolitical KnowledgeMary-Kate LizotteStony Brook University
Andrew H. SidmanJohn Jay College of Criminal Justice
Much scholarship has noted that there are significant differences in the political behavior ofwomen and men. Women, for example, are found to be more likely to identify as and votefor Democrats, less likely to hold conservative issue positions, and more likely to vote forincumbents. One of the more disturbing gender gaps occurs in political knowledge:Specifically, women are typically found to be less knowledgeable about politics andgovernment than their male counterparts. We propose that much of the gap can beexplained by theories of risk aversion, which imply that women are less likely to guess onquestions for which they are uncertain. Using item response models, we demonstrate thatfailure to consider these gender-based differences leads to scales that significantlyunderestimate the political knowledge of women. Consistent with other work in thisarea, we find that accounting for the higher propensity of men to guess decreases thegender gap in knowledge by around 36%.
Imagine a situation in which two individuals, one man and one woman,are taking a public opinion survey. Both are asked a series of political
knowledge questions. One of these questions asks them to list the fivefreedoms of the First Amendment. Though uncertain, the firstindividual takes a stab at it. The second individual, also uncertain,decides to choose the “don’t know” option instead of guessing. Assumethat both individuals are of equivalent political sophistication. In thisscenario, which individual is the man and which is the woman? In lightof prior evidence from political knowledge research, the gender gap in
Published by Cambridge University Press 1743-923X/09 $20.00 for TheWomen and Politics Research Section of theAmerican Political Science Association.# 2009 The Women and Politics Research Section of the American Political Science Association.doi:10.1017/S1743923X09000130
127
Politics & Gender, 5 (2009), 127–151. Printed in the U.S.A.

political knowledge, and risk aversion, the likelihood is greater that the firstindividual, the guesser, is the man while the second is the woman. Weargue that it is this propensity to guess under conditions of uncertaintythat consistently produces political knowledge scales that underestimatethe ability of women. The following discussion and analyses willdemonstrate that women are indeed more risk averse than men and,therefore, less likely to guess responses to questions for which they areuncertain of the answers. Not accounting for the increased likelihoodof women giving “don’t know” responses produces scales thatunderestimate the political knowledge of these respondents andexaggerates the gender gap in such knowledge.For normative reasons, public opinion matters in a democratic society.
Evidence in political science confirms that it matters to decision makers(Hill 1993; Holsti 1992; Holsti and Rosenau 1993; Powlick 1991, 1995;Zaller 1992, 1994). Political knowledge is clearly an important facet ofpublic opinion; without an informed public, opinion polls may losetheir importance to decision makers. Political knowledge can and doesinfluence public opinion, which in turn influences policymakers.Empirical evidence indicates that decision makers not only take intoaccount public opinion when making policy decisions but also seek topersuade the public to gain support of their policy ventures (Powlick 1991).Prior work on political knowledge has often revealed a significant gender
gap in which men appear to know more about politics than women (DelliCarpini and Keeter 1996; Garand, Guynan, and Fournet 2004; Gidengilet al. 2003; Kenski and Jamieson 2001; Mondak 1999; Verba, Burns, andSchlozman 1997). This gap has been demonstrated both in the UnitedStates and internationally, even when controlling for various demographics(Claibourn and Sapiro 2001). The gap exists across generations and,according to some studies, begins as early as adolescence (Hess and Torney1967; Jennings and Niemi 1981; Niemi and Junn 1999). Moreover, priorresearch has failed to explain the gender gap using a variety of factors. Thegap continues to be sizable even when controlling for age, race, vocabularyability, education, political efficacy, political interest, income, mediaexposure, and occupation (Garand, Guynan, and Fournet 2004; Mondakand Anderson 2004).A potential answer for the persistence of the gap in political knowledge lies
in how the concept is measured. As a measure of political sophistication,political knowledge scales have been included as dependent, independent,and moderating variables (Delli Carpini and Keeter 1996; Goren 1997;Neuman 1986; Pettey 1988; Price and Zaller 1993; Verba, Burns, and
128 MARY-KATE LIZOTTE AND ANDREW H. SIDMAN

Schlozman 1997; Zaller 1990, 1992). Yet debate continues as to the validityand reliabilityof thesemeasures. There are questions as towhich items shouldbe included (Delli Carpini and Keeter 1993; 1996), whether knowledge isgeneral or specific to particular political domains (Iyengar 1990; Zaller1992), and, most importantly for this article, the treatment of incorrect and“don’t know” responses (Mondak 1999, 2001; Mondak and Anderson2004; Mondak and Davis 2001).With this question comes the problem of what these responses indicate
about the respondent. Do incorrect responses indicate misinformation orguessing? Do “don’t know” responses indicate a complete lack ofknowledge or a fear of guessing wrong based on partial knowledge?Michael X. Delli Carpini and Scott Keeter (1996) argue that there is adifference between being misinformed and uninformed. Philip E.Converse (1964) also acknowledges that these may be different fromeach other, and the researcher should not simply lump them together inthe analysis. He created an ordinal scale that gave incorrect answershigher rank than “don’t know” responses. Others have disagreed with thisapproach, arguing that the difference is not indicative of politicalsophistication differences, but rather personality differences (Luskin1987; Mondak 1999). If it is the case that these types of answersfundamentally differ, as Jeffrey J. Mondak (1999) demonstrates, howshould researchers handle them? Some suggest discouraging guessing(Delli Carpini and Keeter 1993; 1996). Other work, however, has shownthat this has unintended consequences. In fact, knowledge tests thatdiscourage guessing are widely seen as being good measures of risktaking (Cronbach 1946; Sherriffs and Boomer 1954; Slakter 1969). Moresupport is found for encouraging guessing. Mondak (1999; 2001) andMondak and Belinda Creel Davis (2001) find that discouraging “don’tknow” responses generally results in higher scores on political knowledgescales.Piecing together the work on the gender gap in political knowledge and
the discussions of measurement problems, we may begin to see anexplanation for the size and persistence of the gap. Building on thetheory that personality differences (Luskin 1987; Mondak 1999) are, atleast in part, driving measurement error, we return to the explanationoffered at the outset. Specifically, risk aversion drives individuals underconditions of uncertainty to avoid risk. In the case of political knowledgescales, the “risk” lies in the possibility of answering questions incorrectly;thus, risk aversion should lead to a greater frequency of “don’t know”responses when respondents are unsure of the correct answers.
EXPLAINING THE GENDER GAP IN POLITICAL KNOWLEDGE 129
Furthermore, we contend that women display higher risk aversion,meaning that men are more likely to guess (Frazer and Macdonald2003; Kenski and Jamieson 2000) and receive “credit” on thosequestions they answer correctly. To quote Mondak and Mary R.Anderson, “Such a gender-based differential propensity to guess wouldmean that the gender gap stems at least partly from a source unrelated toknowledge” (2004, 496).
RISK AND RISK AVERSION
In the behavioral decision making and psychology literatures, there existsconceptual and definitional confusion in terms of the operationalizationof concepts such as risk, loss, and security. Lola A. Lopes (1987, 681–682) acknowledges the definitional differences of the meaning of risk
Technically, the word risk refers to situations in which a decision is madewhose consequences depend on the outcomes of future events havingknown probabilities. . . . But most of the time our knowledge ofprobabilities is not so exact. . . . When our knowledge of probabilities isvery inexact (or lacking entirely) we say that decisions are made underuncertainty or ignorance. Obviously, risk shades into ignorance and mostimportant decisions are made part way between poles.
As this quotation suggests, the literature has defined risk in many differentways. It is necessary, therefore, to be clear about the definition of riskutilized in the current discussion. Economists define risk as decisionmaking under uncertainty with known probabilities of outcomes(Kahneman and Tversky 1979; Tversky and Kahneman 1992). Risk, inthe economics framework, is not synonymous with loss; it includesdecisions involving gains as well. Other definitions of risk are closer topopular conceptions of the term. These other definitions, such as thoseused in psychology, define risk as being decision making with multipleoutcomes for which one or more of the outcomes entails loss, danger, ornegative consequences (Byrnes, Miller, and Schafer 1999). Thisdefinition is often used in the study of risk-taking behavior (Cooper et al.2003; Gullone and Moore 2000). Our work adopts this latter definition,which involves decision making under uncertainty with particularoutcomes having negative consequences.There is an abundance of evidence showing gender differences when it
comes to risk. Numerous studies show that women tend to be more risk
130 MARY-KATE LIZOTTE AND ANDREW H. SIDMAN

averse or that women are more likely to demonstrate risk-averse behavior.Several studies have found that women estimate a higher probability ofnegative events such as nuclear war (Gwartney-Gibbs and Lach 1991;Plous 1989). Similar findings exist for support of nuclear power forwhich women are more concerned about the safety risks (Brody 1984).Evidence of gender differences in risk assessments also extends toopinions concerning the environment (Bord and O’Connor 1997;Flynn, Slovic, and Mertz 1994). Moreover, prior work demonstrates thatgender differences emerge early, showing greater risk taking in malechildren and more risk aversion in female children (Ginsburg and Miller1982; Kass 1964; Slovic 1966), and these differences exist in self-reportedbehavior, observed behavior, and intellectual risk taking (Byrnes, Miller,and Schafer 1999).One may speculate about the causes of these differences in risk
assessment and risk taking. Some theorists contend that there exists asensation-seeking personality (Byrnes, Miller, and Schafer 1999); thisexplanation does not explicitly attempt to explain gender differences.Others argue for a risk-as-value hypothesis, in which risk taking isconsidered more masculine, to explain why men are more likely toexhibit risk-taking behavior. Jeffrey Arnett (1992) argues for asocialization and individual factors explanation. More specifically, Arnettargues that socialization, such as the risk-as-value hypothesis, andindividual factors, such as sensation seeking, could both help to explainobserved differences. The socialization aspect could be a viableexplanation if evidence shows that across cultures, men are more likely toengage in risk-taking behavior, while the individual factors explain whyall men do not engage in such behavior. Of course, it is also possiblethat these differences could be a result of evolution; the process ofnatural selection may have favored risk taking in men more so than it didin women. In particular, risk taking should be adaptive in competitivecontexts in which there is a large disparity between the rewards ofwinners and losers, but possibly maladaptive in other contexts.Regardless of why such gender differences in risk acceptance exist, we
propose that these differences will help to explain the gender gap inpolitical knowledge. In particular, because women are more likely to berisk averse, they are more likely to choose “don’t know” on questions forwhich they are uncertain as compared to their male, risk-seeking (orsimply non-risk-averse) counterparts who choose to guess. If politicalknowledge is our best indicator for political sophistication, about whichso much work is done, then it is important to ensure that we are
EXPLAINING THE GENDER GAP IN POLITICAL KNOWLEDGE 131

measuring real differences in knowledge instead of in risk. Especially sinceit is expected that the propensity to guess varies systematically (by gender),failure to correct for this expectation will produce different knowledgeestimates for respondents of identical ability (Mondak 2001; Mondakand Davis 2001). In particular, male respondents, on average, willappear more knowledgeable than female respondents not because theyare more knowledgeable but because they are more willing to guess(Mondak and Anderson 2004). Thus, the scales that we believe tappolitical knowledge also measure risk taking, reducing the validity ofthese knowledge scales (Mondak 2001; Mondak and Davis 2001).That women are more risk averse than men implies the following
questions. First, are women more likely than men to identify when theydo not, or believe they do not, know the answers to political knowledgequestions? Second, given a greater propensity for men to guess, what arethe implications for measures of knowledge that do not account for thisgender-based difference? Finally, what happens to the gender gap inpolitical knowledge once we account for this difference? In response tothese questions, we hypothesize the following:
H1: Being female will have a positive effect on the likelihood ofresponding “don’t know” to political knowledge questions.
H2: When not accounting for gender differences in measurementmodels, the mean knowledge scores for men will be significantlygreater than the mean knowledge scores for women.
H3: The mean scores for women derived from models that do accountfor gender differences will be significantly greater than the meanscores for women derived from models that do not account for suchdifferences.
H4: In measurement models that do account for gender differences, themean scores for men will not be significantly greater than the meanscores for women.
These hypotheses have been addressed in various forms, most pointedly byMondak and Anderson (2004). We build on this work in two significantways. First, we make use of 12 surveys conducted mostly between 1986and 2004, with an additional survey from 1972, including more than16,000 respondents. More importantly, the core of our analyses make useof three-parameter item response models, which are discussed in farmore detail in the “Scaling and Item Response Models” section. Thesemodels allow us to directly estimate knowledge for both women and
132 MARY-KATE LIZOTTE AND ANDREW H. SIDMAN
men while accounting for potentially elevated scores derived fromguessing.
THE “DON’T KNOW” RESPONSE AND MEASURINGPOLITICAL KNOWLEDGE
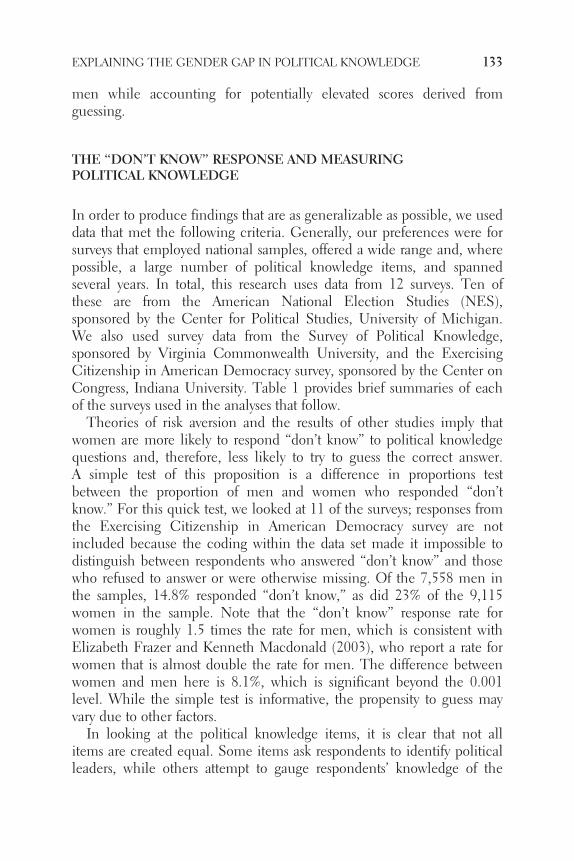
In order to produce findings that are as generalizable as possible, we useddata that met the following criteria. Generally, our preferences were forsurveys that employed national samples, offered a wide range and, wherepossible, a large number of political knowledge items, and spannedseveral years. In total, this research uses data from 12 surveys. Ten ofthese are from the American National Election Studies (NES),sponsored by the Center for Political Studies, University of Michigan.We also used survey data from the Survey of Political Knowledge,sponsored by Virginia Commonwealth University, and the ExercisingCitizenship in American Democracy survey, sponsored by the Center onCongress, Indiana University. Table 1 provides brief summaries of eachof the surveys used in the analyses that follow.Theories of risk aversion and the results of other studies imply that
women are more likely to respond “don’t know” to political knowledgequestions and, therefore, less likely to try to guess the correct answer.A simple test of this proposition is a difference in proportions testbetween the proportion of men and women who responded “don’tknow.” For this quick test, we looked at 11 of the surveys; responses fromthe Exercising Citizenship in American Democracy survey are notincluded because the coding within the data set made it impossible todistinguish between respondents who answered “don’t know” and thosewho refused to answer or were otherwise missing. Of the 7,558 men inthe samples, 14.8% responded “don’t know,” as did 23% of the 9,115women in the sample. Note that the “don’t know” response rate forwomen is roughly 1.5 times the rate for men, which is consistent withElizabeth Frazer and Kenneth Macdonald (2003), who report a rate forwomen that is almost double the rate for men. The difference betweenwomen and men here is 8.1%, which is significant beyond the 0.001level. While the simple test is informative, the propensity to guess mayvary due to other factors.In looking at the political knowledge items, it is clear that not all
items are created equal. Some items ask respondents to identify politicalleaders, while others attempt to gauge respondents’ knowledge of the
EXPLAINING THE GENDER GAP IN POLITICAL KNOWLEDGE 133

U.S. Constitution. We grouped the 122 knowledge items from the 12surveys into five topics.
1. Identification of U.S. politiciansExample: “Do you happen to know what job or political office JimWrightholds?”
2. Identification of foreign political leadersExample: “Do you happen to know what job or political office MargaretThatcher holds?”
3. Constitution and structure of governmentExample: “For how many years is a president of the United Stateselected — that is, how many years are there in one term of office?”
4. Current events and policyExample: “Do you happen to know which party had the most members inthe House of Representatives in Washington before the elections lastmonth?”
5. U.S. political historyExample: “Do you know about when the New Deal occurred?”
It was important to identify item topics because both men and women maybe more (or less) likely to hazard guesses on questions that fall under aparticular topic. For example, we might be less likely overall to observe
Table 1. Summaries of political knowledge surveys
Survey Year Respondents KnowledgeItems
National Election Studiesa 1972 1,113 51986 2,175 81988 1,775 91990 1,825 91992 2,167 81994 1,717 81996 1,463 61998 1,207 62000 1,555 62004 1,066 6
Survey of Political Knowledgeb 1989 610 39Exercising Citizenship in AmericanDemocracyc
2002 1,510 12
aAmerican National Election Studies, University of Michigan, Center for Political Studies.bSurvey of Political Knowledge, Virginia Commonwealth University, Survey Research Laboratory.cExercising Citizenship in American Democracy, Indiana University, Center on Congress.
134 MARY-KATE LIZOTTE AND ANDREW H. SIDMAN

“don’t know” responses to current events questions, especially questionsregarding party control of Congress. Having a 50–50 chance in thesequestions could provide a stronger incentive to guess than in questionsasking which offices certain foreign leaders hold.1 Different topics mayalso provoke differing propensities to guess, specifically in women; thusincluding more questions on a particular topic may produce a moreexaggerated gender gap. In addition to topics, we also consider thepossibility that the propensity to guess may be affected by time. Most ofthe data employed here come from election studies. Since politicalinterest tends to be greater in presidential election years, these yearsmight show smaller “don’t know” rates as opposed to nonpresidentialelection years.We therefore examine gender differences using a three-level hierarchical
model (multilevel model) with a dichotomous dependent variable coded 1if the respondent answered “don’t know,” 0 for a substantive answer, corrector otherwise. Individual factors (i) are nested within the five item types ( j)that are described in the topics list, which are nested within the 11 timepoints (t). The model is presented as follows:
Level 1 (Respondents)
P(Don0t Knowijt ! 1) ! p0jt " p1jt #Genderijt " 1ijt
Level 2 (Item Topics) Level 3 (Time Points)
p0jt ! b00t " r0jt b00t ! g000 " u00t [Intercept]
p1jt ! b10t " r1jt b10t ! g100 " u10t [Slope of Gender]
The reduced form of this model, which may be more readily understood, ispresented as
P(Don’t Knowijt ! 1) ! g000 " g100 #Genderijt " 1ijt
" r0jt " u00t " (r1jt #Genderijt)" (u10t #Genderijt)
Don’t Know is the dependent variable, as described. Gender is also adummy variable, scored 1 if the respondent is female, 0 if therespondent is male. In general, g represents coefficients, and 1, r, and u
1. In the interest of space, the knowledge items used are not presented here. A full list of these items,however, is available upon request.
EXPLAINING THE GENDER GAP IN POLITICAL KNOWLEDGE 135

represent random error components; g000 is the intercept, which variesrandomly both across topics, as modeled by r0jt, and across time, asmodeled by u00t. Thus, there could be a different intercept forrespondents answering current events questions in 1986 than there is forrespondents identifying U.S. leaders in 1994. In addition, g100 is theeffect of Gender, which also varies randomly across topics (r1jt) and time(u10t). Important for this analysis is the estimation of the coefficientsthemselves and the variance of these coefficients that can be explainedby topics and time. Results are presented in Table 2.Table 2 yields strong support for hypothesisH1, which posited that women
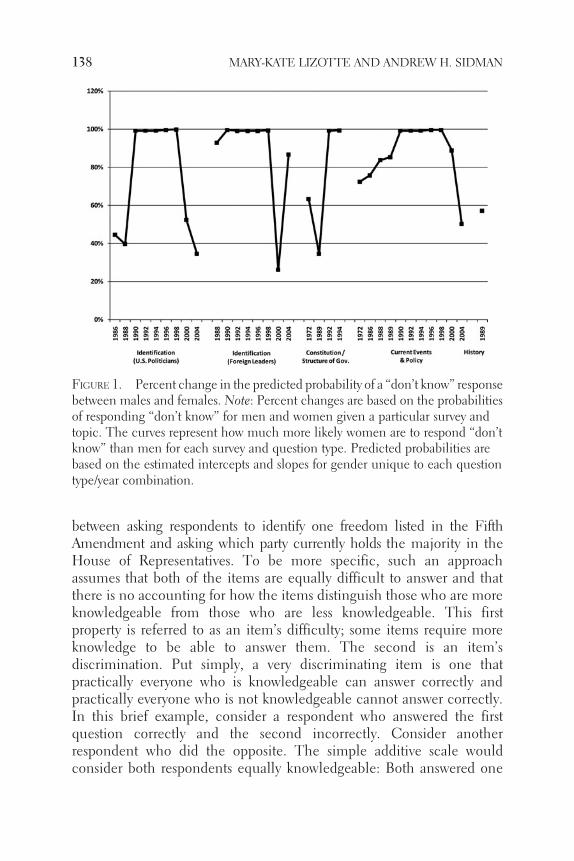
would be more likely to answer “don’t know.” The average effect of beingfemale is positive and highly significant. Looking first at the intercept, thereis significant variation over time (level 3), but not by topic (level 2). Thiscan be seen in the “Variance Components” panel of Table 2, whichreports a small, insignificant x2 for topic-level variance of the intercept anda large, very significant x2 for time-level variance. Regardless of topic, theintercepts are around –11 from 1990 through 1998 and –1 for all otheryears. It is most likely the case that our time level is picking up variation inhow the NES was administered in those years. The opposite is observed forthe effect of gender, which varies significantly across topics but not time.Thus, across time, the effect of gender is strong and significant, but ondifferent topics, women have a varied propensity to guess. Specifically,women are most likely to respond “don’t know” to current events–typequestions and least likely to respond “don’t know” to questions on theConstitution or structure of government. In order to more clearly presentthe gap between men and women in their likelihood of giving a “don’tknow” response, we offer Figure 1.Each point in Figure 1 represents the percent change in the predicted
probability of a “don’t know” response between men and women for aparticular topic on a particular survey.2 Years are presented on thehorizontal axis along with topics. As a reminder, 1989 represents the Surveyof Political Knowledge, and the remaining years are NES surveys. Eachpredicted probability is calculated for males and females, incorporating theyear and topic-specific variation in the intercepts and effects of gender. Atits lowest, women are still around 25% more likely to answer “don’t know”than men (identification of foreign leaders in 2000). At its highest (forseveral years and four of the five topics), women are 100%, or twice aslikely to respond “don’t know.” For the most part, regardless of time or
2. The percent change is calculated as ([P(DKFemale) 2 P(DKMale)]/P(DKMale)) # 100.
136 MARY-KATE LIZOTTE AND ANDREW H. SIDMAN

type,women are farmore likely to express or claim lackof knowledge on theseitems, very clear evidence that gender differences exist at least in thepropensity to give any answer at all. Given that “don’t know” responses areusually coded as incorrect, measurement models that do not account forgender-based differences to guess are likely to produce estimates of abilityor knowledge that are greater for men. Hypothesis H2 directly addressesthis possibility. To test hypothesis H2, we first need to derive a knowledgescale for men and women based on the items in each survey.
SCALING AND ITEM RESPONSE MODELS
There are different approaches to scaling items in order to place respondentson an underlying trait, like political knowledge. One could, for example,simply create an additive scale of correct responses. Simply, the more itemsa respondent answers correctly, the higher on the underlying trait therespondent is. This approach, however, assumes that all of the items areequally effective at predicting the trait. That is, there is no difference
Table 2. Multilevel model estimates predicting “don’t know” responses
Variable Coef. Std. ErrorGender (1 ! Female) 0.702** 0.046Intercept 25.820* 1.682
Variance Components Variance x2
Variation in intercept due to:Topic (level 2) 0.262 21.779Time (level 3) 28.909** 1,370.839
Variation in slope of gender due to:Topic (level 2) 0.027** 105.124Time (level 3) 0.002 6.590
Model statsObservationsItems 121,355Individuals 16,673Item types 5Time points 11
Percent correctly predicted 80.2%Percent reduction in error 10.5%
Note: As described in the text, variance components are estimated for the intercepts at levels 2 and 3 andthe effect of gender at levels 2 and 3. The only respondents not included are from the ExercisingCitizenship Survey. The coding of the data made it impossible to discern a “don’t know” responsefrom a missing response.* p, 0.01; ** p, 0.001.
EXPLAINING THE GENDER GAP IN POLITICAL KNOWLEDGE 137
between asking respondents to identify one freedom listed in the FifthAmendment and asking which party currently holds the majority in theHouse of Representatives. To be more specific, such an approachassumes that both of the items are equally difficult to answer and thatthere is no accounting for how the items distinguish those who are moreknowledgeable from those who are less knowledgeable. This firstproperty is referred to as an item’s difficulty; some items require moreknowledge to be able to answer them. The second is an item’sdiscrimination. Put simply, a very discriminating item is one thatpractically everyone who is knowledgeable can answer correctly andpractically everyone who is not knowledgeable cannot answer correctly.In this brief example, consider a respondent who answered the firstquestion correctly and the second incorrectly. Consider anotherrespondent who did the opposite. The simple additive scale wouldconsider both respondents equally knowledgeable: Both answered one
FIGURE 1. Percent change in the predicted probability of a “don’t know” responsebetween males and females. Note: Percent changes are based on the probabilitiesof responding “don’t know” for men and women given a particular survey andtopic. The curves represent how much more likely women are to respond “don’tknow” than men for each survey and question type. Predicted probabilities arebased on the estimated intercepts and slopes for gender unique to each questiontype/year combination.
138 MARY-KATE LIZOTTE AND ANDREW H. SIDMAN

question correctly. Common sense, however, might dictate that the firstrespondent is at least a little more knowledgeable, owing to the moredifficult nature of the first question. The ability to answer the firstquestion may also more easily distinguish someone who is moreknowledgeable from someone who is less knowledgeable. Guttmanscaling loosely addresses these properties. In this approach, items arerank ordered such that a respondent who answers the last (presumablemost difficult) question correctly should also have answered all previousquestions correctly. The underlying assumption here is that whenranked, each successive item is incrementally more difficult than theone preceding it.Given the importance of these characteristics, such as difficulty and
discrimination, scaling items has increasingly been done using itemresponse models.3 Rather than make assumptions regarding itemcharacteristics, these characteristics are empirically estimated. Eachitem is modeled as a logit (correct responses indicative of higherknowledge are coded as 1, 0 otherwise), with the item’s difficulty anddiscrimination included as parameters in the model. The most basicitem response model includes only the difficulty parameter and isreferred to as the one-parameter logit model. The two-parameter logit(2PL) model includes parameters for difficulty, denoted b, anddiscrimination, denoted a. Returning to the previous example, the 2PLwould identify the first respondent as more knowledgeable than thesecond because the first item is both more difficult and morediscriminating; thus, being able to answer it is indicative of higherknowledge. Because they empirically estimate these characteristics,item response models can provide for the more accurate scaling ofrespondents on a trait, like political knowledge, when there are a widevariety of items. Central to this work, however, are two additionalabilities of item response models.First, item responsemodels are not limited to twoparameters; there are also
three-parameter logit (3PL) models. This extra parameter is often referred toas the guessing parameter and provides a floor for the probability that an itemis answered correctly. Given our reliance on risk aversion and the differingpropensity of men and women to guess, we make extensive use of 3PLmodels. It is also important to note that some argue that the estimates of
3. We provide very basic information regarding item response theory. We refer readers who areinterested in reading more to: H. Jane Rogers, Hariharan Swaminathan, and Ronald K. Hambleton,Fundamentals of Item Response Theory (Thousand Oaks, CA: Sage Publications, 1991).
EXPLAINING THE GENDER GAP IN POLITICAL KNOWLEDGE 139

the 3PL are not consistent.We recognize these criticisms of the 3PL and takesteps to improve their estimation; specifically, all of the item response modelestimates are bootstrapped with 10,000 replication samples.4Second, item response models can also be jointly estimated for different
groups of respondents. In the item response literature, this is referred to asdifferential item functioning. As an example, consider that our FifthAmendment question is asked to a group of first year high school studentsand a group of constitutional lawyers. We would expect the item to havelarger difficulty and discrimination parameters for the high schoolfreshman than for the constitutional lawyers; that is, the parameterestimates are different for different groups of respondents. Naturally, thegroups focused on here are women and men. Accounting for differentialitem functioning means that the same item could have a differentdifficulty estimate, a different discrimination estimate, and, mostimportantly, a different guessing estimate for women and men. Foridentification purposes, all that is required for a set of items is that theparameter estimates be held constant between women and men for oneitem; parameters for all remaining items are allowed to vary between groups.
AN INITIAL ESTIMATE OF THE GENDER GAP IN KNOWLEDGE
In this section, we use the 3PL to generate political knowledge scales forrespondents in all 12 surveys that do not account for gender-baseddifferences. We do this in order to test hypothesis H2, which posited thatthe mean scores for men would be greater than the mean scores forwomen on scales that do not model gender-based differences. We callthis first set of 3PL models the constrained models — constrainedbecause the parameters of every item are forced to be equal betweenmen and women. Put another way, in this first set of models, we do notaccount for the possibility that the knowledge estimates for men couldbe inflated because of their greater propensity to guess. Use of theconstrained models will allow for an examination of how knowledgeestimates are typically derived for survey respondents and, moreimportantly, how these estimates change once we allow item parameters
4. Bootstrapping estimates the same model n times, each time on a different “subsample” of thecomplete data. Most often, as is the case here, the subsample is the same size as the full sample, butthe subsamples are drawn from the full sample with replacement. Parameter estimates, therefore, aremeans of the distribution of estimates — a distribution comprised of the estimates from each of then models.
140 MARY-KATE LIZOTTE AND ANDREW H. SIDMAN

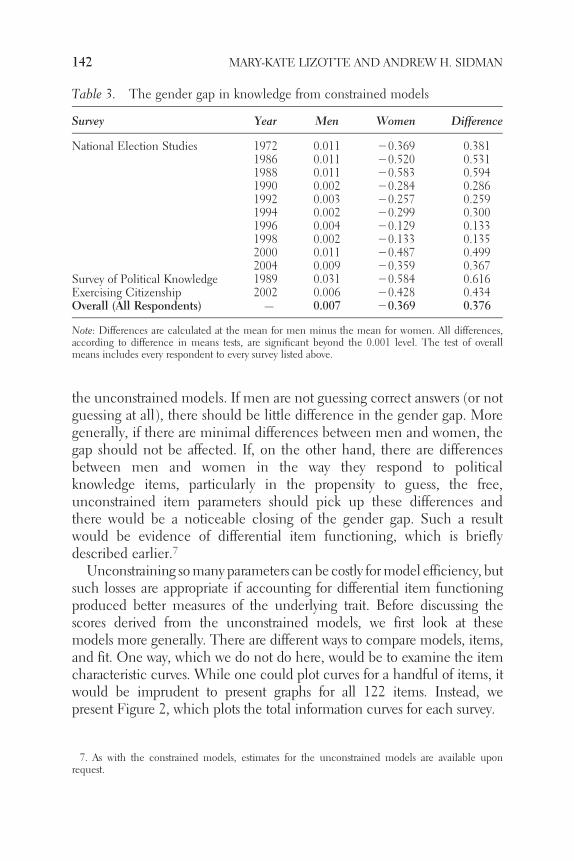
to differ between groups (men and women). Again, we estimated theconstrained 3PL models for all 10 NES surveys, the Survey of PoliticalKnowledge, and the Exercising Citizenship in American Democracysurvey.5 From these estimates, we derived ability scores in politicalknowledge bound at –5 and 5. The boundaries are arbitrary; what isimportant is that the scale is standardized with a mean of zero and astandard deviation of 1, which will allow comparisons in the followingsection. The mean political knowledge scores for men and women foreach survey are presented in Table 3. Consistent with prior research onthe gender gap, for every survey the difference between men and womenis positive (suggesting a higher mean for men) and significant, whichyields strong support for hypothesis H2.
ACCOUNTING FOR GENDER DIFFERENCES
Unequivocally, measuring political knowledge withmodels that assume nodifferences between men and women produces scales in which womenperform significantly worse than men. The gender gap in knowledge isalso persistent, existing at least in this research from 1972 through 2004.We demonstrate previously, however, that women are significantly lesslikely to guess the answers to questions to which they do not know theanswers. In most models of political knowledge, including the 3PLmodels discussed here, these “don’t know” responses are counted asincorrect, which clearly stacks the deck against women when gaugingtheir level of political knowledge (Mondak 2001; Mondak and Anderson2004; Mondak and Davis 2001). The persistence of the gender gap inknowledge has two possible explanations. The first we have already spentmuch time discussing and believe to be true: Men are more likely toguess and will get at least some answers correct. Women, on the otherhand, are getting no credit for their “don’t know” answers. The secondpossibility is that men are not guessing at all and simply are moreknowledgeable than women.In order to examine both of these possibilities, we estimate the same 3PL
models, only now the item parameters, including the guessing parameter,are allowed to vary between men and women.6 We call these 3PL models
5. To save space, the model estimates are not reproduced here, but are available upon request.6. As explained, for identification the parameters of one item cannot vary between groups. For each
survey, we constrain the parameters of the first item.
EXPLAINING THE GENDER GAP IN POLITICAL KNOWLEDGE 141
the unconstrained models. If men are not guessing correct answers (or notguessing at all), there should be little difference in the gender gap. Moregenerally, if there are minimal differences between men and women, thegap should not be affected. If, on the other hand, there are differencesbetween men and women in the way they respond to politicalknowledge items, particularly in the propensity to guess, the free,unconstrained item parameters should pick up these differences andthere would be a noticeable closing of the gender gap. Such a resultwould be evidence of differential item functioning, which is brieflydescribed earlier.7Unconstraining somany parameters can be costly formodel efficiency, but
such losses are appropriate if accounting for differential item functioningproduced better measures of the underlying trait. Before discussing thescores derived from the unconstrained models, we first look at thesemodels more generally. There are different ways to compare models, items,and fit. One way, which we do not do here, would be to examine the itemcharacteristic curves. While one could plot curves for a handful of items, itwould be imprudent to present graphs for all 122 items. Instead, wepresent Figure 2, which plots the total information curves for each survey.
Table 3. The gender gap in knowledge from constrained models
Survey Year Men Women Difference
National Election Studies 1972 0.011 20.369 0.3811986 0.011 20.520 0.5311988 0.011 20.583 0.5941990 0.002 20.284 0.2861992 0.003 20.257 0.2591994 0.002 20.299 0.3001996 0.004 20.129 0.1331998 0.002 20.133 0.1352000 0.011 20.487 0.4992004 0.009 20.359 0.367
Survey of Political Knowledge 1989 0.031 20.584 0.616Exercising Citizenship 2002 0.006 20.428 0.434Overall (All Respondents) — 0.007 20.369 0.376
Note: Differences are calculated at the mean for men minus the mean for women. All differences,according to difference in means tests, are significant beyond the 0.001 level. The test of overallmeans includes every respondent to every survey listed above.
7. As with the constrained models, estimates for the unconstrained models are available uponrequest.
142 MARY-KATE LIZOTTE AND ANDREW H. SIDMAN
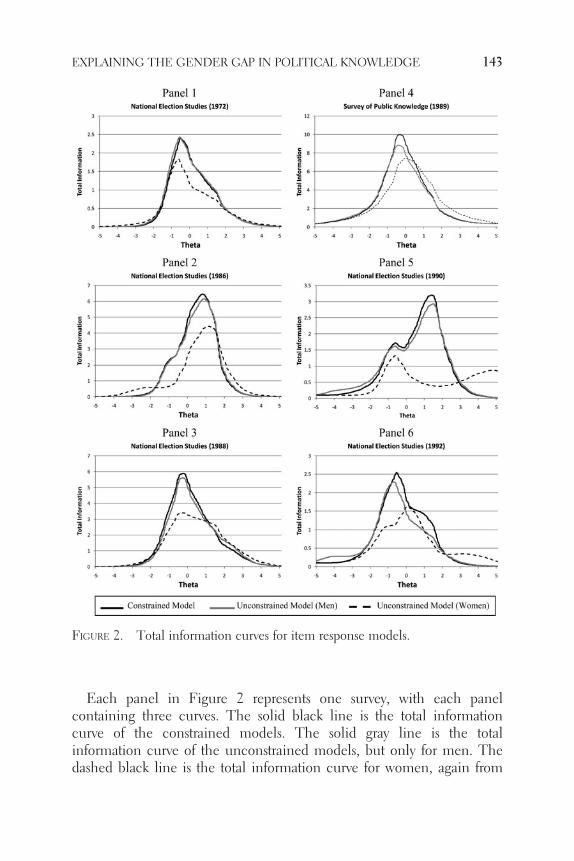
Each panel in Figure 2 represents one survey, with each panelcontaining three curves. The solid black line is the total informationcurve of the constrained models. The solid gray line is the totalinformation curve of the unconstrained models, but only for men. Thedashed black line is the total information curve for women, again from
FIGURE 2. Total information curves for item response models.
EXPLAINING THE GENDER GAP IN POLITICAL KNOWLEDGE 143
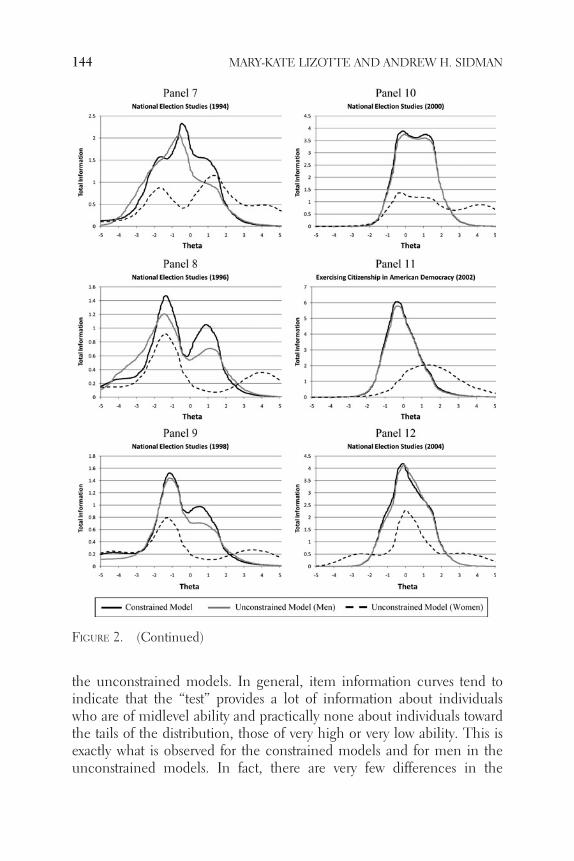
the unconstrained models. In general, item information curves tend toindicate that the “test” provides a lot of information about individualswho are of midlevel ability and practically none about individuals towardthe tails of the distribution, those of very high or very low ability. This isexactly what is observed for the constrained models and for men in theunconstrained models. In fact, there are very few differences in the
FIGURE 2. (Continued)
144 MARY-KATE LIZOTTE AND ANDREW H. SIDMAN

amount of information the surveys provide for the entire sample whenparameters are modeled as equal across groups and for men whenparameters are free. For women, there is a remarkably different story. Fornearly every survey, the unconstrained models provide more informationabout women, particularly at higher levels of knowledge, than theconstrained models. This suggests that allowing parameters to vary bygender is yielding no worse estimates of knowledge for men, but betterestimates of knowledge for women.Using scales derived from the unconstrained model will allow for testing
of hypothesesH3 andH4, which stated that the mean knowledge scores forwomen would be greater using the unconstrained models than using theconstrained models, and that the gender gap would be eliminated (nosignificant difference between women and men would exist) using theunconstrained models. These results are presented in Table 4, whichrepresents the knowledge estimates for women using the constrainedmodels from Table 3 and presents the knowledge estimates for men andwomen derived from the unconstrained models. Looking first at changeswithin women as a group (column 5), the unconstrained models, whichas explained earlier appear to better estimate political knowledgeparticularly for women, consistently produce larger estimates of politicalknowledge. Only the NES in 1972 and 1986 produced scales in whichwomen appear more knowledgeable when not accounting for genderdifferences. The remaining 10 surveys clearly show that politicalknowledge scales derived from the unconstrained models provideestimates of knowledge for women that are significantly greater; all of thedifferences are significant beyond the 0.001 level. These findingsdemonstrate strong support for H3.Lastly, we now turn to column 6, which is the gender gap itself — the
difference between men and women — and we see a much different gapthan was estimated using the constrained models. Hypothesis H4 statedthat knowledge scales derived from unconstrained models would show nosignificant differences between men and women. While this hypothesis isnot supported in full, for most of the surveys, with the exception of theNES in 1972 and 1986, the gap has narrowed appreciably. There issupport for hypothesis H4 looking at the NES in 1996 and 1998, wherethere are no significant differences between men and women, and for theNES in 1994, in which the gap is significant and negative, meaning thatwomen are gauged as more knowledgeable than men. To place thesechanges in perspective, the last two columns of Table 4 present thegender gap reported in Table 3, which was estimated from the constrained
EXPLAINING THE GENDER GAP IN POLITICAL KNOWLEDGE 145

Table 4. The gender gap in knowledge from unconstrained models
Year Women(Constrained)
Men(Unconstrained)
Women(Unconstrained)
Difference(WU2WC)
Gender Gap(Unconstrained)
Gender Gap(Constrained)
PercentChange inGender Gap
National Election Studies1972 20.369 0.013 20.396 20.027** 0.410** 0.381** !7.6%1986 20.520 0.007 20.643 20.124** 0.651** 0.531** !22.6%1988 20.583 0.013 20.506 0.077** 0.519** 0.594** 212.6%1990 20.284 0.002 20.116 0.169** 0.117** 0.286** 259.1%1992 20.257 0.003 20.060 0.197** 0.063* 0.259** 275.7%1994 20.299 0.001 0.107 0.405** 20.106* 0.300** 2135.3%1996 20.129 0.000 20.050 0.079** 0.051 0.133** 261.7%1998 20.133 0.001 20.055 0.077** 0.057 0.135** 257.8%2000 20.487 0.015 20.242 0.245** 0.257** 0.499** 248.5%2004 20.359 0.012 20.253 0.105** 0.265** 0.367** 227.8%Survey of Political Knowledge1989 20.584 0.017 20.328 0.256** 0.346** 0.616** 243.8%Exercising Citizenship in American Democracy2002 20.428 0.003 20.165 0.262** 0.169** 0.434** 261.1%Overall (All Respondents)— 20.369 0.006 20.233 0.136** 0.239** 0.376** 236.4%
Note: The table presents three difference columns. The first presents differences betweenmean knowledge scores for women based on the unconstrainedmodels andscores from the constrained models. The second presents the gender gap for the unconstrained models. The third represents the gender gap from the constrainedmodels originally presented in Table 3. The final column is the percent change in the gender gap when moving from constrained models to unconstrained models.*p, 0.01; ** p, 0.001.
146MARY-K
ATELIZ
OTTEAN
DAN
DREW
H.SID
MAN
models, and the change in the gender gap when we move from constrainedto unconstrained — that is, the change once we account for genderdifferences when deriving knowledge scales. Again, for the 1972 and 1986NES surveys, the gender gap does increase, with the largest increase,22.6%, in 1986. In subsequent surveys, the gap decreases. These dropsrange from 12.6% up to 135.3%, depending on the survey. Overall, simplyby accounting for gender-based differences in item responses, we are ableto explain 36.4% of the gender gap in political knowledge — a decreasein the gap that is consistent with Kenski and Jamieson (2000), where thegap is reduced between 20% and 40% when converting “don’t know”responses to substantive answers. Similarly, the decrease in the gap isconsistent with Frazer and Macdonald (2003), where the gap is reducedby 25%, and with Mondak and Anderson (2004), where the gap isreduced by almost 50%.
CONCLUSION
The existence of a gender gap in political knowledge is not a newphenomenon. Numerous studies have documented this gap, and thisresearch has identified a persistent gap dating back to at least 1972.Where many studies have failed to identify factors that explain this gap,we find success by accounting for a recognized psychological differencebetween men and women: acceptance of risk. Men are far more likely tohazard guesses than women, which leads to inflated estimates of theirpolitical knowledge relative to that of women. Other studies havedemonstrated the effectiveness of eliminating “don’t know” responses(Mondak 2001; Mondak and Anderson 2004; Mondak and Davis 2001;Prior and Lupia 2008). In this research, we also show the pitfalls offailing to account for these responses, but also demonstrate the use ofitem response models to account for the differing propensity of men toguess. Simply by accounting for differential item functioning, we areable to show that the gap is not as large as is estimated by mostconventional measures of political knowledge. Furthermore, the itemresponse models estimated here show no loss of information about menand provide more information about women, particularly at higher levelsof knowledge, as compared to models that do not account for genderdifferences. Comparing the two sets of models, we find that models thatdo account for gender differences produce knowledge estimates for
EXPLAINING THE GENDER GAP IN POLITICAL KNOWLEDGE 147
women that are much closer to and sometimes exceed the estimatesfor men.One result we find troubling is that even when we allow item parameters
to vary by gender, a significant gap still persists despite a closing of the gap.Our analysis is basic in that its primary concerns are to see if women aremore likely to say they do not know the answers to questions, to showthat models that do not account for this simple gender differenceproduce a significant gap in political knowledge, and to demonstrate thatthis gap narrows once these differences are modeled. Future endeavorsin this area will clearly need to synthesize theories of risk aversion,accounting for the propensity to guess, and more general theories ofpolitical knowledge. We recognize that differential item functioning hasnot fully discounted the effect of gender. Likewise, looking at factorssuch as education, political interest, and income, as previous studieshave done, has not explained away the role of gender in differences inlevels of political knowledge either. We believe that the fundamentalflaw in these studies is that they have tried to “close” the wrong gap.Especially for historical data, it may be the case that women have lowerpolitical efficacy, lower interest, lower income, and less education — allof which lead to a larger gap between men and women. While thesefactors alone have not diminished the significance of gender in assessingpolitical knowledge, including them in measurement models that moreaccurately estimate knowledge for women should go a long way towardachieving that goal.Looking toward the future, we agree strongly with the work of Mondak
(1999; 2001), Mondak and Davis (2001), and Prior and Lupia (2008).Surveys gauging political knowledge need to be designed to minimizethe desire to opt out of answering questions. Instructions encouragingguessing, multiple choice formats, extended time, and, whereappropriate, monetary incentives have all been shown in these studies todecrease the deleterious effects of the “don’t know” response. Removingthese effects is of the utmost importance for the study of the gender gapin knowledge, given their significant role in the underestimation ofpolitical knowledge among women.
REFERENCES
Arnett, Jeffrey. 1992. “Reckless Behavior in Adolescence: A Developmental Perspective.”Developmental Review 12: 339–73.
148 MARY-KATE LIZOTTE AND ANDREW H. SIDMAN

Bord, Richard J., and Robert E. O’Connor. 1997. “The Gender Gap in EnvironmentalAttitudes: The Case of Perceived Vulnerability to Risk.” Social Science Quarterly 78:830–40.
Brody, Charles J. 1984. “Differences by Sex in Support for Nuclear Power.” Social Forces63: 209–28.
Byrnes, James P., David C. Miller, and William D. Schafer. 1999. “Gender Differences inRisk Taking: A Meta-Analysis.” Psychological Bulletin 125: 367–83.
Claibourn, Michele, and Virginia Sapiro. 2001. “Gender Differences in Citizen-LevelDemocratic Citizenship: Evidence from the Comparative Study of ElectoralSystems.” Presented at the Annual Meeting of the Midwest Political ScienceAssociation, Chicago.
Converse, Philip E. 1964. “The Nature of Belief Systems in Mass Politics.” In Ideology andDiscontent, ed. David E. Apter. New York: Free Press.
Cooper, M. Lynne, Phillip K. Wood, Holly K. Orcutt, and Austin Albino. 2003.“Personality and the Predisposition to Engage in Risky or Problem Behaviors duringAdolescence.” Journal of Personality and Social Psychology 84: 390–410.
Cronbach, Lee J. 1946. “Response Sets and Test Validating.” Educational andPsychological Measurement 6: 475–94.
Delli Carpini, Michael X., and Scott Keeter. 1993. “Measuring Political Knowledge:Putting First Things First.” American Journal of Political Science 37: 1179–1206.
———. 1996. What Americans Know About Politics and Why It Matters. New Haven: YaleUniversity Press.
Flynn, James, Paul Slovic, and C. K. Mertz. 1994. “Gender, Race, and Perception ofEnvironmental Health Risks.” Risk Analysis 14: 1101–8.
Frazer, Elizabeth, and KennethMacdonald. 2003. “Sex Differences in Political Knowledgein Britain.” Political Studies 51: 76–83.
Garand, James C., Emily Guynan, and Monique Fournet. 2004. “The Gender Gap andPolitical Knowledge: Men and Women in National and State Politics.” Presented atthe Annual Meeting of the Southern Political Science Association, New Orleans.
Gidengil, Elisabeth, Andre, Blais, Neil Nevitte, and Richard Nadeau. 2003. “Women to theLeft? Gender Differences in Political Beliefs and Policy Preferences.” In Women andElectoral Politics in Canada, ed. Manon Tremblay and Linda Trimble. New York:Oxford University Press.
Ginsburg, Harvey J., and Shirley M. Miller. 1982. “Sex Differences in Children’s Risk-Taking Behavior.” Child Development 53: 426–28.
Goren, Paul. 1997. “Political Expertise and Issue Voting in Presidential Elections.” PoliticalResearch Quarterly 50: 387–412.
Gullone, Eleonora, and Susan Moore. 2000. “Adolescent Risk-Taking and the Five-FactorModel of Personality.” Journal of Adolescence 23: 393–407.
Gwartney-Gibbs, Patricia A., and Denise H. Lach. 1991. “Sex Differences in Attitudestoward Nuclear War.” Journal of Peace Research 28: 161–74.
Hess, Robert D., and Judith V. Torney. 1967. The Development of Political Attitudes inChildren. Chicago: Aldine.
Hill, Kevin A. 1993. “The Domestic Sources of Foreign Policymaking: CongressionalVoting and American Mass Attitudes toward South Africa.” International StudiesQuarterly 37: 195–214.
Holsti, Ole R. 1992. “Public Opinion and Foreign Policy: Challenger to the Almond-Lippmann Consensus — Mershon Series: Research Programs and Debates.”International Studies Quarterly 36: 439–66.
Holsti, Ole R., and James N. Rosenau 1993. “The Structure of Foreign Policy Beliefsamong American Opinion Leaders — After the Cold War.” Millennium 22: 235–78.
EXPLAINING THE GENDER GAP IN POLITICAL KNOWLEDGE 149
Iyengar, Shanto 1990. “Shortcuts to Political Knowledge: The Role of Selective Attentionand Accessibility.” In Information and Democratic Processes, ed. John A. Ferejohn andJames H. Kuklinski. Champaign: University of Illinois Press.
Jennings, M. Kent, and Richard G. Niemi. 1981.Generations and Politics: A Panel Study ofYoung Adults and Their Parents. Princeton: Princeton University Press.
Kahneman, Daniel, and Amos Tversky. 1979. “Prospect Theory: An Analysis of DecisionUnder Risk.” Econometrica 47: 263–91.
Kass, Norman. 1964. “Risk in Decision Making as a Function of Age, Sex, and ProbabilityPreference.” Child Development. 35: 577–82.
Kenski, Kate, and Kathleen Hall Jamieson. 2000. “The Gender Gap in PoliticalKnowledge: Are Women Less Knowledgeable than Men about Politics?” InEverything You Think You Know About Politics . . . And Why You’re Wrong, ed.Kathleen Hall Jamieson. New York: Basic Books.
———. 2001. “The 2000 Presidential Campaign and Differential Growths in Knowledge:Does the ‘Knowledge Gap’ Hypothesis Apply to Gender as Well as Education?”Presented at the Annual Meeting of the American Political Science Association,San Francisco.
Lopes, Lola L. 1987. “Between Hope and Fear: The Psychology of Risk.” In Research onJudgment and Decision Making, ed. William M. Goldstein and Robin M. Hogarth.Cambridge: Cambridge University Press.
Luskin, Robert C. 1987. “Measuring Political Sophistication.” American Journal of PoliticalScience 31: 856–99.
Mondak, Jeffery J. 1999. “Reconsidering the Measurement of Political Knowledge.”Political Analysis 8: 57–82.
———. 2001. “Developing Valid Knowledge Scales.” American Journal of Political Science(January): 224–38.
Mondak, Jeffrey J., and Mary R. Anderson. 2004. “The Knowledge Gap: A Reexaminationof Gender-Based Differences in Political Knowledge.” Journal of Politics 66: 492–512.
Mondak, Jeffery J., and Belinda Creel Davis. 2001. “Asked and Answered: KnowledgeLevels When We Won’t Take ‘Don’t Know’ for an Answer.” Political Behavior 23:199–224.
Niemi, Richard G., and Jane Junn. 1999. Civic Education: What Makes Students Learn.New Haven: Yale University Press.
Neuman, W. Russell. 1986. The Paradox of Mass Politics: Knowledge and Opinion in theAmerican Electorate. Cambridge, MA: Harvard University Press.
Pettey, Gary R. 1988. “The Interaction of the Individual’s Social Environment, Attentionand Interest, and Public Affairs Media Use on Political Knowledge Holding.”Communication Research 15: 265–81.
Plous, S. 1989. “Thinking the Unthinkable: The Effects of Anchoring on LikelihoodEstimates of Nuclear War.” Journal of Applied Social Psychology 19: 67–91.
Powlick, Philip J. 1991. “Attitudinal Bases for Responsiveness to Public Opinion amongForeign Policy Officials.” Journal of Conflict Resolution 35: 611–41.
Powlick, Philip J. 1995. “The Sources of Public Opinion for American Foreign PolicyOfficials.” International Studies Quarterly 39: 427–52.
Price, Vincent, and John Zaller. 1993. “Who Gets the News: Alternative Measures of NewsReception and Their Implications for Research.” Public Opinion Quarterly 57: 133–64.
Prior, Markus, and Arthur Lupia. 2008. “Money, Time, and Political Knowledge:Distinguishing Quick Recall and Political Learning Skills.” American Journal ofPolitical Science 52: 169–83.
Sherriffs, Alex C., and Donald S. Boomer. 1954. “Who Is Penalized by the Penalty forGuessing?” Journal of Educational Psychology 45: 81–90.
150 MARY-KATE LIZOTTE AND ANDREW H. SIDMAN

Slakter, Malcolm J. 1969. “Generality of Risk Taking on Objective Examinations.”Educational and Psychological Measurement 29: 115–28.
Slovic, Paul. 1966. “Risk-Taking in Children: Age and Sex Differences.” ChildDevelopment. 37: 169–76.
Tversky, Amos, and Daniel Kahneman. 1992. “Advances in Prospect Theory: CumulativeRepresentation of Uncertainty.” Journal of Risk and Uncertainty 5: 297–323.
Verba, Sidney, Nancy Burns, and Kay Lehman Schlozman. 1997. “Knowing and CaringAbout Politics: Gender and Political Engagement.” Journal of Politics 59: 1051–72.
Zaller, John R. 1990. “Political Awareness, Elite Opinion Leadership, and the Mass SurveyResponse.” Social Cognition 8: 125–53.
———. 1992. The Nature and Origins of Mass Opinion. Cambridge: Cambridge UniversityPress.
———. 1994. “Elite Leadership of Mass Opinion: New Evidence form The Gulf War.” InTaken by Storm: The Media, Public Opinion, and U.S. Foreign Policy in The GulfWar, ed. Lance Bennett and David Paletz. Chicago: University of Chicago Press.
EXPLAINING THE GENDER GAP IN POLITICAL KNOWLEDGE 151