Explaining Political Participation in East-Central Europe...
39
Explaining Political Participation in East-Central Europe: Social Capital, Democracy and the Communist Past Natalia Letki Nuffield College, Oxford OX1 1NF [email protected] Nuffield College Politics Working Paper 2003-W2 University of Oxford
Transcript of Explaining Political Participation in East-Central Europe...

Explaining Political Participation in East-Central Europe:
Social Capital, Democracy and the Communist Past
Natalia Letki Nuffield College, Oxford OX1 1NF
Nuffield College Politics Working Paper 2003-W2 University of Oxford

INTRODUCTION
Citizens’ participation in politics has been a central idea in research on
political systems, liberal democracy in particular, since the 1960s (Almond and Verba
1963, Verba et al. 1978, Parry et al. 1992). It is the core element of all definitions of
democracy (Dahl 1989), thus the decline of voting turnout and disengagement in
political groups is interpreted as the main malady of a modern, democratic state:
“where few take part in decisions there is little democracy” (Verba and Nie 1972: 1).
Political engagement is essential for the institutions’ credibility, but also for citizens’
capability to articulate their demands and hold their representatives to account:
“individual and otherwise quiet voices multiply and are amplified” (Putnam 2000:
338). Therefore, many stress that in new democracies, such as these of East-Central
Europe (ECE), development of a participatory, engaged approach to politics among
ordinary citizens is as important a goal as GDP growth or reform of bureaucracy, as
without it democracy cannot consolidate (Krishna 2002, Barnes and Simon 1998,
Paxton 2002).1
Active participation in public affairs is the main feature of the so-called ‘civic
community’. Although quoting de Tocqueville (1969) Putnam stresses that “not all
political activity deserves the label ‘virtuous’ or contributes to the commonweal”
(1993: 88), activities such as voting, discussing politics or membership in various
groups and parties deserve to be called ‘civic’ as they are oriented towards “shared
benefits” rather than self-interest. The decline of voting turnout and both interest in
1 The recent developments of the presidential election in Serbia (December 2002), where the
attempt to elect a president failed three times due to a very low turnout, are perhaps the best illustration
of the salience of political participation.
2

and discussion of politics are considered to be the main indicators (next to
membership in voluntary associations) of the “collapse” of the civic community, as
they represent the general decline of interest in and consideration for the ‘common
good’ and the ideals of democratic government (Putnam 2000).
Therefore, the question of what makes people participate in the political
process is not only interesting, but also salient – especially in the context of new
democracies. This paper presents an important contribution to the existing debate.
First, it tests the relevance of the recently popular explanations of political
participation, such as social capital (Krishna 2002, Brown and Uslaner 2002), in a
context other than that of established Western democracies. Second, it puts forward
and tests hypotheses specific to the context of new post-communist democracies that
have not been tested elsewhere: it looks at the influence of membership in a non-
democratic political group, such as Communist party, on participation in democratic
politics and analyzes the link between the development of democratic structures and
political engagement. The data used come from a survey conducted in 10 ECE
countries in the midst of transformation, 1993-1994.2 In the next section of the paper
we discuss the empirical indicators used to represent political participation in ECE.
Then, we explain the main hypotheses relating to the determinants of participation
and outline their empirical operationalisation. Later, we discuss the country levels of
2 The data used was collected as a part of the Economic and Social Research Council's East-
West Programme, Phase 2: Grant no. Y 309 25 3025 “Emerging Forms of Political Representation and
Participation in Eastern Europe”, Nuffield College, Oxford. The paper uses data from ten countries
included in the database: Belarus, Bulgaria, Czech Republic, Estonia, Hungary, Poland, Romania,
Russia, Slovak Republic and Ukraine. Surveys were carried out in the summer of 1993, with the
exception of Czech and Slovak Republics and Hungary, where it took place in the spring of 1994. For
the details concerning sampling methods and response rate see Appendix B.
3

political participation in ECE and then move to individual level analysis. We
conclude by discussing the results of our analysis.
CONCEPTUALIZING POLITICAL PARTICIPATION
In 1993-94, when the data used in this paper were collected, the opportunity to
influence political outcomes was a relative novelty for most citizens of ECE
countries. Before 1989 only protest forms of participation directed “against the state”
(strikes, protests, demonstrations) were available for expressing citizens’ opinions,
and even these were significantly limited under most of the ECE regimes. Therefore,
many scholars dealing with the ECE transformation feared the prevalence of apathy,
lack of interest and low participation in politics among citizens of post-communist
countries (Miller 1992). Others were concerned that the patterns of political
engagement created under the communism, such as protests and street
demonstrations, may destabilize the fragile, new democracies (Foley and Edwards
1996). It seems that the former concern was much more relevant: the “early
democratic movements no longer play a visible role. Therefore, the prospects of the
new regimes might be less sunny than people wanted to believe during the heydays of
the glorious revolution” (Thomassen and van Deth 1998: 140).
So, are citizens of new, post-communist democracies really politically
disengaged? We have four measures of political activism that are based on self-
reported participation: frequency of discussing politics, partisanship, voting in the
prospective parliamentary election and political party membership. Political
discussion does not involve high political competence. In fact, talking about politics
does not necessarily require more than passive interest in the subject. Using the
measure of talk about politics from our survey we are able to tell not only whether a
4

respondent discusses politics, but also how often this takes place. Respondents were
asked to name two people, apart from their spouse, with whom they talk about
politics most often and specify how often they do this3. The measure combines
information about both conversational partners, thus the score may range from ‘0’ for
not talking about politics at all to ‘6’ for always discussing politics with both persons
when the respondent meets them.
The concept of partisan identification is one of the key elements in the modern
electoral behavior research (Dalton 2000). Not only is support for a political party a
prerequisite of more demanding forms of participation, such as party membership4,
but also it reinforces basic types of political behavior such as voting and is, at least
implicitly, correlated with the discussion of politics. Both indicators are frequently
present in the research on political participation (Verba and Nie 1972, Verba et al.
1995, Parry et al. 1992). Our respondents were asked whether they consider
themselves as supporters of a political party, and if so, how strongly they support it.
They were also asked whether they are members of a political party.
Despite its popularity as an indicator and its purely political character, voting
is not the most obvious type of participation. This type of activity involves relatively
little input in terms of time, money and civic skills: it seems to be “the least
demanding form of political activity” (Brady et al. 1995: 283). Some authors also
stress its ‘ritualized’ character, enforced by the legal process and its relatively limited
character. On the other hand, it often happens to be the only available, and thus
3 The options ‘always when you meet this person’, ‘sometimes’ and ‘seldom’ were coded ‘3’,
‘2’ and ‘1’ respectively. Respondents who never discuss politics were assigned ‘0’.
4 For certainty, we tested this intuitive association between membership in and support for a
political party and found out that indeed, in all countries members were significantly stronger
supporters than non-members.
5

extremely important, indicator of participation (Verba et al. 1978). Another argument
for including voting in the model of political engagement is its ‘less unequal’
character than other forms of participation, precisely because of its ‘undemanding’
character as well as traditional, symbolic and, thus, ‘compulsory’ dimension (Lijphart
1997). In the light of these considerations, voting turnout should be a good indicator
of the ‘civicness’ of post-communist societies; especially that it refers to some of the
first free elections in the post-communist regimes.
The only measure of voting that we have for all ten countries refers to
prospective parliamentary elections. Respondents were asked to assume that there
was a parliamentary election the next day and identify the party for which they would
vote. As a result, they form three groups: those who had clear, crystallized political
preferences at the time of the survey, those who could not name a concrete party, but
were determined to vote and those, who knew they were not going to vote. Therefore,
we measure not only willingness to vote or not, but also a general orientation in
politics.
All of these political activities belong to so-called conventional participation:
we do not have any measures of non-conventional activities, such as protest.5 On the
other hand, they capture a variety of dimensions of political participation, from
inexpensive and “equal” types, such as political talk or voting, to activities involving
more resources, such as partisanship or party membership. Moreover, all of them are
relevant for the quality of a democratic system, as they are correlated with the
mechanisms of political representation (c.f. Almond and Verba 1963, Verba and Nie
5 Analysis of the link between social capital and non-conventional participation would be a
valuable and relevant complement of the investigation of the determinants of political engagement in
the context of East-Central Europe, as in mid-1990s protest activities were there extremely popular.
6
1972, Verba et al. 1995, Parry et al. 1992). Therefore, we believe that these four
variables provide us with a good and reliable measure of political engagement in new
post-communist democracies.
WHY DO PEOPLE PARTICIPATE IN POLITICS?
There exists a vast amount of literature investigating determinants of political
participation. The most popular interpretations refer to the individual’s resources and
to “socialization for participation” by means of involvement in civic groups and
initiatives. The first explanation assumes that those who have more resources, such as
knowledge, money or time, are more likely to participate in politics (Verba et. al
1995), and it has been tested in the context of post-communist democracies, pointing
to the lack of visible differences between them and established democracies (Barnes
and Simon 1998). Therefore, it will not be of primary interest to us.
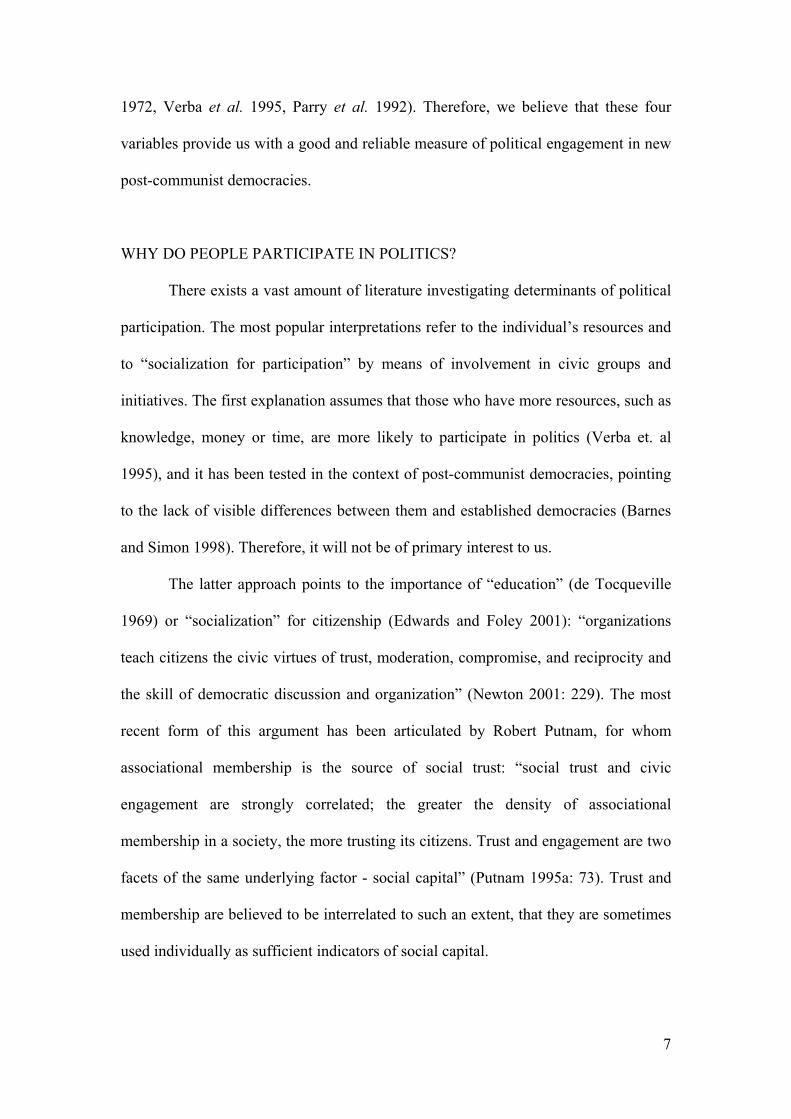
The latter approach points to the importance of “education” (de Tocqueville
1969) or “socialization” for citizenship (Edwards and Foley 2001): “organizations
teach citizens the civic virtues of trust, moderation, compromise, and reciprocity and
the skill of democratic discussion and organization” (Newton 2001: 229). The most
recent form of this argument has been articulated by Robert Putnam, for whom
associational membership is the source of social trust: “social trust and civic
engagement are strongly correlated; the greater the density of associational
membership in a society, the more trusting its citizens. Trust and engagement are two
facets of the same underlying factor - social capital” (Putnam 1995a: 73). Trust and
membership are believed to be interrelated to such an extent, that they are sometimes
used individually as sufficient indicators of social capital.
7

Social trust and membership in voluntary associations have been recognized
as important pre-conditions of a civic polity since Almond and Verba’s Civic Culture.
The “lack of interpersonal trust that is essential to cooperative public activity”
(DiFranceisco and Gitelman 1984: 610) has been identified as the main feature of
Soviet politics. 50 years of social (i.e. directed towards fellow citizens) and political
(i.e. directed towards the state institutions) distrust fostered by Communist regimes is
believed to make post-communist countries particularly prone to political instability,
especially when faced with economic hardships (Putnam 1993). Overcoming the
“legacy of distrust” seems therefore almost equally important an objective as
increasing GDP or reforming bureaucracy.
The context of post-communist countries creates a unique opportunity of
testing additional factors potentially determining political participation, that allow us
to develop the existing debate on the determinants and consequences of political
participation. First, many ECE citizens had been involved in pre-1989 politics, mostly
by means of Communist party membership. Despite the fact that this was not a
democratic organization, people who participated in it “fit the model of a
conventional activist” (Bahry and Silver 1990: 840). Therefore, we are interested in
the link between membership in Communist party and participation in new
democracies. Second, although the existence of the link between participation and the
quality of democracy has long been established, the causality of this relationship is
difficult to capture in the case of stable democratic systems. However, the transition
to democracy in ECE gives us an opportunity to test to what extent the experience of
democratic politics makes people more likely to participate in the future. Despite the
8

popular perception of ECE “refolutions”6 as resulting directly from the popular
movements, the instillation of democracy in the post-communist countries happened
largely as a result of elite bargaining, and its further development was strongly
influenced by the external actors, such at the EU or NATO (Welsh 1994, Letki 2002).
The introduction of democracy created the space for civic and political activism
unknown under Communism. Therefore, the question we may ask is: to what extent
did the introduction of democratic institutions and procedures have a positive
influence on citizens adopting the strategies and behaviors suitable for a democratic
system?
Below we outline in depth the implications of the three factors discussed
above (social capital, communist party membership and the democratic structures) for
the patterns of political participation. We also introduce empirical indicators used to
operationalise these concepts.
Social capital. The model of social capital propagated by Putnam (1993,
2000) implies that only trust resulting from interpersonal relations within voluntary
associations will be functional for the “civicness” of a given community. Although
voluntary associations could not operate under the Communist regime, some forms of
interpersonal trust must have existed in the communist states to assist citizens in the
situations of economic hardships and the lack of accountability of political
institutions (Letki and Evans 2002). Therefore, the present levels of trust in the new,
postcommunist democracies are most likely to reflect the mixture of pre- and post-
1990 experiences. However, following Putnam we expect that only trust produced
within voluntary associations will positively effect participation in the democratic
6 The term ‘refolution’ was coined by Garton Ash to describe reform introduced from above in response to pressures for revolution from below (Garton Ash 1990).
9

system. We will test for these effects using two indicators of social capital: social
trust and associational membership, and an interaction between them.
Our measure of social trust consists of five items combined together to form a
Likert-type scale. It therefore presents a significant improvement over the measures –
usually a single binary item – used by other authors (Putnam 1993, Inglehart 1997,
Dekker et al. 1997, Stolle and Rochon 1997). Our empirical operationalization of
social trust is based on five items that express individuals’ beliefs about trust and
norms of reciprocity that (because they imply trust, faith in co-operation, and reflect a
general vision of the norms and rules of social interactions) collectively constitute a
relatively broad and comprehensive measure of interpersonal trust (for the details of
the measure, see Appendix A).
Engagement in voluntary associations constitutes the second, behavioral,
component of social capital. Non-political engagement of this sort has proved to be
relevant to political pluralism, civic competence and the sense of civic efficacy, thus
confirming Almond and Verba’s conclusion that “membership in some associations,
even if the individual does not consider the membership politically relevant and even
if it does not involve his active participation, does lead to a more competent
citizenry” (1963: 322, see also Verba et al. 1978, 1995, Parry et al. 1992). The list of
associations that we use in the present paper includes business associations,
professional associations, farmers’ associations, church groups, local/community
groups, sports or social clubs, armed forces associations, ethnic organizations and
factory committees. Since the “original social capital view” claims that “social capital
translates directly into higher political participation” (Krishna 2002: 440), we will be
expecting a very strong influence of associational membership and the interaction
between membership and trust, representing “social capital”, on all forms of political
10

participation. However, we are expecting to find that social trust unrelated to
associational membership is irrelevant for explaining political engagement.
Communist party membership. The unique feature of the Communist system
in comparison with other authoritarian regimes was the mass participation of ordinary
citizens, especially in the form of a Communist party membership (Linz and Stepan
1996, Letki 2002). Types of values and so-called “covert participation” (DiFrancesco
and Gitelman 1984) learned under the communist system are not expected to be
beneficial for participation in a democracy: Communist party membership has been
recognized as one of the components of a “compliant activism” in the communist
politics, next to, for example, membership in people’s militia (Bahry and Silver
1990). However, existing research points to the lack of any significant influence of
Communist party membership on democratic values (Gibson et al. 1992). We might
also hypothesize that skills and civic resources learned under the non-democratic
political system can well be used in a democracy: party membership is a type of
conventional activism that socializes citizens to be interested and participate in
politics. Bahry and Silver confirm this intuition with the Soviet Interview Project, as
they found that “people who were more interested in politics, felt more influential …
were more likely to be party activists” (1990: 838). However, as authors
acknowledged, that survey was not thought to be representative of the Soviet
population, nor did it represent behavior in the communist ECE countries in general.
Therefore, it is important to reanalyze their findings using representative samples of
former communist states. When it comes to the hypothesized influence of the
Communist party membership on political participation in the new democracies, then
“our expectations … are ambiguous, if not contradictory” (Gibson et al 1992: 357).
On one hand, since party members were one of the main pillars of the communist
11

systems, we may expect them to be relatively reluctant to engage in the political
process under a democratic system. On the other hand, membership in a communist
party could be recognized as a type of “socialization for participation”. Thus, the
question we ask is: Is the fact that large numbers of ECE publics were involved in the
previous regime hampering the development of political participation suitable for
democratic polities?
Democracy. The cultural approach assumes that the political changes are
dependent upon cultural factors (Almond and Verba 1963, Inglehart 1990, 1997).
Civic, participatory culture is crucial for the emergence and consolidation of
democracies, thus “it is often asserted that democratization will continue to face
severe handicaps … in East Europe and Russia, given the strong legacy of
authoritarianism in the recent past” (Jackman and Miller 1996: 633). However, an
alternative explanation of the relationship between participatory culture and
democracy has been put forward and tested empirically (Schmitter and Karl 1991,
Muller and Seligson 1994). In this interpretation, the introduction and development of
a democratic system leads to the development of civic attitudes and behaviour.
Usually, the causality of the relationship between democracy and participation is
rather difficult to test, and the link between systemic changes and individual
behaviour is ignored in favour of aggregate level analysis (Inglehart 1997). However,
since our survey was conducted in the midst of systemic transformation, we can
easily test the impact of the change in democracy on political behaviour of ECE
citizens.
12

To capture the change of political systems in ECE we will use Tatu
Vanhanen’s Index of Democratisation.7 This indicator is based on two dimensions:
electoral competition and participation. The total score assigned to a given country
combines the information about the turnout rates for national elections, calculated as
a percentage of the total population and not just registered voting population, and the
degree of competition, defined as “the smaller parties’ share of the votes cast in
parliamentary or presidential elections, or both … It is calculated by subtracting the
percentage of the votes won by the larges party from 100” (Vanhanen 1997: 34).
Index of Democratisation “gets high values only if the values of both basic indicators
are high. If either of them is zero, the value of ID will also drop to zero” (Vanhanen
1997: 35).
We calculated the difference between the score countries in our sample had in
their first available post-1989 entry (1989 for Bulgaria, Czech and Slovak Republics,
Hungary, Poland, Romania and Russia, 1991 for Belarus, Estonia and Ukraine) and
the year of the survey: this variable should capture well ECE citizen’s exposure to the
democratic process.8 To measure the influence of the systemic characteristics, i.e. the
change of democracy, on individual level behaviour, we use a hierarchical model,
where individuals are nested within ten ECE countries. We expect to find a positive
influence of the change in the Vanhannen index on political participation.
Resources. Finally, following the more traditional approaches to participation,
we look at the effect of basic socio-economic characteristics, such as education and
7 Source: http://www.svt.ntnu.no/iss/data/vanhanen/.
8 For the scores, see Appendix A.
13

income9, as they represent the most basic resources: skills and money (Parry et al.
1992, Verba et al. 1995). We also look at gender and age, since they have been found
out to be the important predictors of political activism (Schlozman et al. 1995). These
socio-economic characteristics will not be of a major interest in this study: they will
be present in the analysis as controls more than operationalisation of an alternative
explanation of political participation.
LEVELS OF POLITICAL PARTICIPATION IN EAST-CENTRAL EUROPE
Before we move to explaining the determinants of political activism in ECE,
we shall analyze its general levels. Table 1 below presents the average values for
particular countries. It shows clearly that no type of political activism can be taken as
representative for general levels of political participation (or the country’s civicness).
For example, the low level of declared voting abstention in Estonia is not
accompanied by high levels of political discussion or partisanship. In Bulgaria party-
related activities seem to be very popular, but at the same time Bulgarians do not talk
about politics particularly often and quite a few of them declared electoral abstention.
[Table 1 about here]
Political discussion. As many as 41.5% of respondents said they never discuss
politics and only 10.1% always do, while 21.3 scored ‘4’ (on a scale from 0 to 6). The
9 This is a household monthly income. Coding of income was different in particular countries;
in most of them income was categorized, but the number of categories and their scope differed. To
make the data on income comparable, we were forced to recode it into three broad categories: below
average, average and above average. The lower and upper borders of the ‘average’ category were
defined as mean - 0.5*SD and mean + 0.5*SD respectively.
14

average score for the whole sample is 2.29. When we calculate the average frequency
of talking about politics for the particular countries, we can see that the differences
are not great, yet highly statistically significant (p<0.001). In fact, Poland and
Romania are the outliers: not only are levels of political discussion in these two
countries significantly lower than in the next lowest (Ukraine), but also they are
around half of those in the Slovak Republic and Belarus: in the latter two countries
roughly 30% claim to never discuss politics, while in Poland and Romania this figure
approaches a rather overwhelming 60%. The rank order does not seem to be
predictable by any characteristics of particular countries: it depends neither on the
stage of democratization nor the level of economic development. Also the timing of
parliamentary or presidential elections, which might be expected to enliven political
discussions, does not explain the rank order: Belarus, which had not even had free
elections by the time of the survey, scored significantly higher than Hungary, which
had parliamentary elections almost immediately before the survey was conducted, in
spring 1994.
Partisanship. The differences between particular countries are striking: in
Bulgaria and Romania more than 40% of the population considered themselves to be
supporters of a political party, while in Ukraine, Russia and Belarus this group was
less than 15%. Even in the context of the decreasing partisanship observed in recent
years in several Western countries (Dalton 2000, Schmitt 2002), the levels of
partisanship in the Czech Republic, Slovak Republic and Poland are rather
unimpressive, while in Estonia, Ukraine, Russia and Belarus they may be considered
alarming10.
10 In 1992-94 the proportion of “party identifiers” in seven developed Western democracies
ranged from 32% in Germany to 64% in the UK (Schmitt 2002).
15

However, the more interesting issue is what factors differentiate the levels of
support between particular countries so much. Although some countries seem to form
clusters predicable on the basis of their cultural and historic characteristics and
geographical location (e.g., the Czech and Slovak Republics and Poland or Ukraine,
Russia and Belarus), this does not explain the pattern of the level of support for a
political party very well. The advancement in the political and economic transition is
helpful for explaining the location of the ‘bottom’ cluster: the countries lagging
behind, such as Ukraine, Russia and Belarus do have the lowest levels of party
support, but at the same time Romania and Bulgaria, where the development of
democratic institutions was much less advanced than in the Czech Republic, Hungary
and Poland or even Slovak Republic, have a higher proportion of partisans than these
four countries. Moreover, the timing of the last and forthcoming parliamentary
elections or strength of post-communist parties do not explain systematically
countries’ rankings either.
Although such a ranking is definitely conditioned by numerous factors, one
might expect the experience of the free elections to play a particularly important role.
The bottom cluster of countries seems to be easily explainable: Belarus, Russia and
Ukraine had not had entirely free parliamentary elections by the time of a survey and
although democratic parties (such as the Ukrainian Democratic Block, the Popular
Front of Belarus or Democratic Russia) were allowed to take part in the 1990
elections, they did not win with the Communist Party candidates. Although Estonia
had free parliamentary elections, a significant part of the population – Russians – was
16

not politically represented. In fact, the Russian population of Estonia is much less
likely to support any political party11.
Voting. The most ‘undecided’ nations are, as one might expect, Ukraine and
Belarus: over 44% of respondents in these countries had no clear political
preferences, and over 32% also intended not to vote. The situation looks even worse
in Russia, where these proportions are reversed: 44% of respondents would not vote
in the parliamentary elections and 33.2% had no clear political preferences. This is
hardly surprising, as respondents in none of these countries had experienced free
parliamentary elections by the time of the survey.
If civicness was to be assessed on the basis of a combination of the
willingness to vote and party preferences, the Czech Republic would definitely have
to be assessed as the most civic nation. Romania would be comparable, as almost
70% of Romanians had crystallized party preferences12. With the exception of
Ukraine, Russia and Belarus, countries do not cluster in any systematic way; even the
Czech and Slovak Republics differ in terms of potential abstentions. Poland and
Slovakia, which were about to have parliamentary elections, had a lower proportion
of respondents with definite party preferences than, for example, Romania, and
Poland had a declared abstention rate as high as 25%.
Membership in a political party. The last type of political participation to be
examined here - membership in a political party - requires more political competence
11 This is another indication, along with the lower levels of political discussion, of their
withdrawal from a political life. The average level of party support among Estonians is 0.441, while
among Russians in Estonia it is only 0.069.
12 This is even more striking if one takes into account the emergence of Democratic NSF from
NSF and subsequent transformation of NSF into DP-NSF and of DNSF into PSDR that took place
recently before the survey.
17

as well as more resources (such as time and skills) than any of the activities analyzed
above, so the engagement in it may be expected to be much lower. Indeed, as Table 1
presents, in East-Central Europe very few people belong to political parties: although
in Bulgaria members of a political party constitute almost 8% of the sample, in some
other countries this figure is below (Ukraine and Estonia) or slightly above (Russia)
1%. These results are even more disappointing if one takes into account the fact that
almost 17% of the pooled sample reported membership in the Communist party in the
past, while only 2.6% are the members of the democratic parties established after the
transition.
EXPLAINING POLITICAL PARTICIPATION: MULTILEVEL ANALYSIS
The above analysis showed that indeed, the levels of political engagement in
the post-communist countries are rather low, but also that they are dramatically
differentiated across countries. Moreover, we have observed that the countries do not
cluster in terms of levels of political participation: a high score on one dimension may
be accompanied by a low score on the other. Therefore, we do not pool the indicators
together to create a combined measure of any sort, but instead look at each activity
independently. Table 2 below displays the results of regressions of the four types of
political participation on social trust, membership in social groups, socio-economic
characteristics and change on Vanhanen’s Index of Democratization. Three of the
presented models are logit models, while participation in political discussion is
explained by means of linear regression. In the case of voting, initial analysis showed
that the “don’t know” and “wouldn’t vote” categories do not differ in most respects,
thus we combined these categories.
18
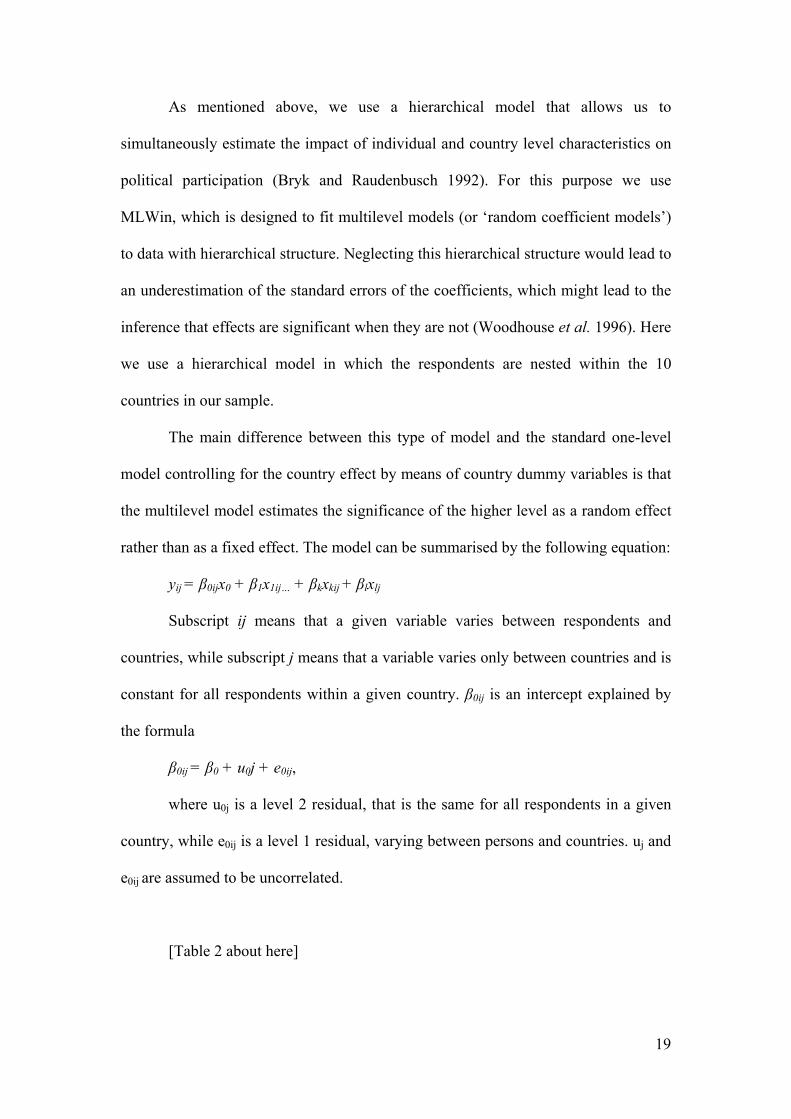
As mentioned above, we use a hierarchical model that allows us to
simultaneously estimate the impact of individual and country level characteristics on
political participation (Bryk and Raudenbusch 1992). For this purpose we use
MLWin, which is designed to fit multilevel models (or ‘random coefficient models’)
to data with hierarchical structure. Neglecting this hierarchical structure would lead to
an underestimation of the standard errors of the coefficients, which might lead to the
inference that effects are significant when they are not (Woodhouse et al. 1996). Here
we use a hierarchical model in which the respondents are nested within the 10
countries in our sample.
The main difference between this type of model and the standard one-level
model controlling for the country effect by means of country dummy variables is that
the multilevel model estimates the significance of the higher level as a random effect
rather than as a fixed effect. The model can be summarised by the following equation:
yij = β0ijx0 + β1x1ij… + βkxkij + βlxlj
Subscript ij means that a given variable varies between respondents and
countries, while subscript j means that a variable varies only between countries and is
constant for all respondents within a given country. β0ij is an intercept explained by
the formula
β0ij = β0 + u0j + e0ij,
where u0j is a level 2 residual, that is the same for all respondents in a given
country, while e0ij is a level 1 residual, varying between persons and countries. uj and
e0ij are assumed to be uncorrelated.
[Table 2 about here]
19

In the first step, we estimated the baseline models containing only individual-
level characteristics, but as adding the contextual variable does not affect their
coefficients, for simplicity we present only a final version of the model. However, it
should be mentioned that in all cases the level-2 variance was statistically significant,
which simply means that the levels of participation significantly differ across
countries. It should also be mentioned that following the convention, initially we
controlled for the change in the level of GDP in particular countries between 1989
and the year of a survey, but found no effect, therefore these models are not displayed
here either.
So, how well do our predictors of political participation do? Since three out of
four models presented here are non-linear, the interpretation of the fixed effects is not
straightforward. Therefore, in Figure 1 we display the influence of statistically
significant effects in percentages.
[Figure 1 about here]
Social capital. Social trust significantly influences talk about politics,
partisanship and voting. Since trust is a linear predictor, it is difficult to compare its
impact with that of other variables. However, we may say that a one-point increase on
the five-point social trust scale results in the increase of probability to engage in
political participation ranging from 1% (partisanship) to 3.4% (voting). In Figure 1
we present the influence of a maximum (5 point) increase: it translates into 6%
increase of the probability to support a political party or discuss politics and as much
as 18.6% increase of the probability to vote. However, since such a change is
virtually impossible for an individual to achieve, these numbers reflect the spread in
20

political activism between the least and most trusting respondents rather than the
actual influence of social trust on participation. Associations do worse as they are
statistically significant for explaining partisanship and voting only: association
members are 8.4% more likely to be party supporters than non-members and 19.7%
more likely to vote. The interaction term between social trust and associational
membership, that represents the core of Putnam’s hypothesis about social capital, is
relevant only for voting, but its effect is negative. Figure 1 presents the impact of a 5-
point increase on this scale: the most trusting association member is 12.2% less likely
to vote than the least trusting non-member. This is a truly puzzling finding especially
that this effect is almost as strong as the positive influence of social trust not related
to associational membership (18.6%).
Communist party membership is a statistically significant predictor in all four
models, and its influence is always positive. Moreover, the strength of this influence
is usually relatively high: being a Communist party member in the past increases the
probability of being a party member in a new democracy by 9.4%, probability of
being a party supporter by 5.6% and probability of voting by as much as 10.3%. In
the case of political discussion, Communist party membership can be rivaled only by
socio-economic predictors: the change of a “Communist party membership” variable
from 0 to 1 results in a 6% increase on the scale of political discussion.
Finally, how important is the change in the quality of democracy for political
participation? As we mentioned above, the levels of all four types of participation
discussed here are significantly differentiated among countries. But in the case of
political discussion this differentiation cannot be ascribed to the influence of the
process of democratization: the effect of the change of Vanhannen’s Index of
Democratization is statistically insignificant. However, when we look at party
21

membership and partisanship, the effect of the change in the levels of democracy is
clearly visible, and in both cases it is, as expected, positive. Since the scores on the
Index differ from -18.44 for Estonia to 42.63 for the Czech Republic, the coefficients
are rather small and difficult to interpret. However, we can easily make these results
more meaningful comparing particular countries. Belarus and Ukraine are two cases
that did not note any change in terms of democracy by the time of our survey (the
score for both is 0), so we will use them as our baseline. Therefore, we may say that if
Belarus and Ukraine experience a progress in terms of democracy similar to that
experienced by the Czech Republic, keeping all other factors constant, Belarussians
and Ukrainians would be 11% more likely to be party members and 14.9% more
likely to be party supporters. At the same time, if they experienced the regress similar
to Estonia, they would be 1.7% less likely to be party members and 4% less likely to
be party supporters (see Figure 2).
[Figure 2 about here]
Although in the case of voting the effect of change in democracy misses the
significance level, the coefficient is considerably larger than the standard error and it
tells us that Belarussians and Ukrainians, having experienced the “Czech
democratization”, would be as much as 21.2% more likely to vote and if they were
Estonians they would be 7.5% less likely to vote.
The analysis confirmed our initial intuition that particular types of
participation may relate somewhat differently to the independent factors we were
interested in. Only in the case of voting are all characteristics significant, and among
them membership in associations is by far the most important one. The impact of a
22

Communist party membership and socio-economic characteristics is much weaker,
but still relatively strong. The determinants of partisanship are very similar to those
of voting13, yet their predictive power is significantly weaker. Political party
membership seems to depend almost entirely, besides the socio-economic
characteristics, on the experience of membership in a Communist party. This effect is
not astonishing, as in most countries social-democratic or socialist parties are the
direct heirs of Communist parties in terms of human and physical resources. Finally,
political discussion seems to be much more dependent on socio-economic
characteristics (especially education) than group membership and trust. Moreover,
this is the only type of participation that is entirely independent from the change in
the level of democracy. We may explain this by referring to the fact that the
remaining three indicators are strongly related to political parties and electoral
process in a democratic system, while this one is much more general and could have
been (and was) practiced under the Communism.
CONCLUSIONS
Citizen participation in politics is said to be crucial for the development of a
strong, stable democracy, where the public’s interests are well represented in politics
and officials can be easily held to the account. The levels of participation in post-
communist countries in the mid-1990s were considered to be below what would be
necessary for a new democracy to stabilize and consolidate. This lack of political
activism in ECE after 1989 seemed in particular contrast with the mass movements in
some countries before 1989 and citizens’ wide participation in the Communist party
13 This could have been expected, as our measure of voting refers to the ability of pointing a
party respondent would vote for rather than to the general willingness to vote.
23

and system-related organizations. The major factors causing low levels of political
engagement are believed to be part of the Communist heritage: low levels of social
capital (interpersonal trust and membership in voluntary associations) and the anti-
democratic norms and attitudes learned through participation in the non-democratic
system. In turn, low levels of participation are likely to hamper the consolidation of
new democracies in ECE. In this paper we have analyzed all these factors and their
links with political participation. Below we recapitulate the findings:
First, we found that membership in a Communist party before 1989 is a very
good predictor of conventional political participation in the new ECE democracies,
and that its influence on participation in politics after 1989 is positive. Although we
suspected that the skills and general interest in politics learned under the non-
democratic regime may be relevant for participation in a democracy, the finding that
Communist party membership is consistently one of the main predictors was
relatively startling. This leads us to the conclusion that participation even in a non-
democratic organization can socialize for citizenship.
Second, when associational membership is a significant predictor, its power is
high, but this applies only to two out of four types of participation. The effect of
social trust, although relevant for explaining three out of four types of participation, is
usually small. An increase by 1 point on the social trust scale would mean that the
respondent would have to score 1 point higher on all five indicators used to create this
scale, which would be a relatively large change. At the same time, it would result in
the 1 to 3% increase of the dependent variables. We should also remember that this
trust is not the part of Putnam’s concept of social capital, as it is entirely independent
from membership in associations. The interaction term between social trust and
associational membership, which represents Putnam’s idea of reciprocal relationship
24

between these two elements, has very little predictive power, as it is significant for
explaining voting only, where its effect is negative, which is clearly inconsistent with
the social capital theory. Although one might argue that the above findings result
from the specificity of East-Central Europe, conclusions about the weak relationship
between political participation and social trust, similar to ours, were reached by
Dekker et al. (1997) who, despite narrowing the definition of political participation to
membership or volunteering in certain types of groups, such as political parties, trade
unions, environment, peace and animal rights movements etc., found that political
engagement is not related to generalized trust in most of the fourteen West-European
countries they investigated. Also Gibson’s extensive analysis of the networks and
various forms of trust in Russia show that “interpersonal trust actually has little to do
with attitudes toward democratic institutions and processes” (Gibson 2001: 51).
Defenders of the social capital thesis might argue that the link between social capital
and political participation is much more pronounced in democracies, as only under a
democratic government can voluntary associations generate trust. We tested this
argument by examining the slopes of the social capital variables across countries and
detected no significant differences, despite the varying levels of democracy.14
Finally, our analyses show that the exposure to the democratic processes and
development of democratic institutions has an important positive influence on
political participation related directly to a democratic system. The descriptive analysis
14 Following Seligman (2002) we believe that the lack of established Western democracies in
our sample does not make the results less robust. Quite the contrary: Seligman demonstrated
convincingly that “northern industrial cases” strongly bias any cross-country comparisons, blurring
region-specific patterns. Further, since we are interested in the influence of the change in democracy
(rather than levels of democracy) on political behavior, adding cases with stable levels of democracy
would result in decreasing the variance of the contextual variable.
25

of the levels of participation in particular East-Central European countries implies
that they are conditioned by numerous factors, such as the structure of party
competition, ethnic composition or simply the experience of elections. Obviously, the
lack of experience of free elections makes people less likely to have political
preferences (Russia, Belarus, Ukraine), the lack of civic rights to participate in the
electoral process has a naturally similar result (the Estonian Russian minority).
Extreme fragmentation of the political spectrum (Poland) makes it difficult for people
to actually choose a preferred party since “fragmented party systems are characterized
by ideological polarization, weak and unstable coalition governments, and bidding
wars” (Norris 1999: 224). Political context factors, such as the amount of political
conflict, clearly influence the levels of politicization (Schmitt 2002): thus in the
countries with clear and stable parliamentary majorities (Slovak and Czech
Republics, Hungary), reinforced additionally by the economic stability, partisanship
is less of an issue than in the countries where the political scene is dominated by two
main groups, each potentially capable of creating a majority (Romania, Bulgaria).
Vanhannen’s Index of Democratization captures the change in the openness of a
political system as well as institutional arrangements, and is sensitive to the party
competition patterns and minority policies. And we demonstrated that the change of
those conditions is very important for citizens’ willingness to engage in political
participation.
Summing up, we must argue for the limited usefulness of the concept of social
capital in explaining the levels and patterns of political activism in the democratizing
countries. The relevance of associational membership for political participatory
activities had been established long before the concept of social capital was
introduced to political science, and the ECE patterns do not diverge significantly from
26

those observed in Western democracies. Social trust has also been a part of a cultural
explanation since 1960s, while the novelty of the social capital argument lies in the
anticipated reciprocal connectedness of these two elements. However, as we
demonstrated above, this core idea of social capital is generally irrelevant for
explaining of political participation in ECE. In fact, participation in non-democratic
politics (Communist party membership) is far more important than social capital.
Therefore, our findings suggest that skills and attitudes gained from participation in
groups, such as voluntary associations or Communist party, and exposure to the
democratic political processes are far more important for the ‘civicness’ of a
community than whether its members’ trust each other.
27

APPENDIX A
Social trust
a) It is human nature to cooperate with other people.
b) Most people can be trusted.
c) If someone is in serious trouble, no one else cares about it.
d) If you are not always on your guard other people will take advantage of you.
e) A person cooperates with other people only when he or she sees it in his or her own
interest.
All of these items have an ‘agree-disagree’ format with five-point response
scales. For items a and b ‘strongly disagree’ is coded 1 and ‘strongly agree’ 5, while
for c, d and e the coding is reversed. ‘Don’t know’ responses are recoded to the mid-
point. Factor analysis detected two main dimensions (a, b as one positively-worded
dimension, and the remaining three as a second, negatively worded dimension) and
the reliability test for the 5 items indicated that Cronbach’s alpha is a rather low 0.54.
This results from the fact that the distribution of item a) is highly skewed (over 90%
of respondents agree with this item). However, when selecting the items to create a
composite measure of social trust we took into account not only the reliability of
particular items, but also their discriminating power: including a skewed item gives
“a good spread of scores and thus discriminates among individuals” (Martin et al.
1993: 3). We also performed additional tests to make sure that including item a) does
not distort the results. To balance the scale and avoid an acquiescence bias we used
all five items.
Vanhanen’s Index of Democracy
[Table A1 about here]
28

APPENDIX B: THE SURVEYS
The surveys used in this paper were undertaken in 1993-94 as part of an
ESRC funded research program on Eastern Europe “Emerging forms of political
representation and participation in Eastern Europe”, part of stage II of the ESRC's
East-West Program. The studies in each country were undertaken by researchers
based usually at the respective academies of science employing established teams of
interviewers and coders. The surveys were designed in and coordinated from Britain,
but with important contributions from collaborators in many of the countries studied.
Sampling frames and stratification procedures varied between countries: in
some countries census information was considered more reliable; in others electoral
records were preferred; in other random route procedures were adopted with a Kish
grid being used for final respondent selection. The sampling frame used in most
countries was the Electoral Register, although in some cases it was thought better to
use the Census, as some groups of the population were likely to be under-represented
among the electorate. The sampling methods used involved several stages of
selection. Typically, these took the form of: parliamentary constituencies stratified by
standard regions, population density and percentage owner-occupation, and selected
systematically with probability proportionate to the size of the electorate; polling
districts; addresses chosen with probability proportionate to their number of listed
electors; individuals - one at each address (or household) chosen by a random
selection procedure.
Table B.1 summarizes the main characteristics of the surveys. Each of the
strategies reported in Table B.1 was considered to be the most effective approach
within the countries in which it was adopted. As far as can be told, given the
fallibilities of official data, non-response biases are predictably like those in the West.
29

Compared to Census data non-respondents tend to be older and to have lower levels
of education (see below for an example). Non-response resulted mainly from non-
contacts and refusals.
[Table B.1 about here]
The items in the questionnaires were developed over several months with
extensive back-translation and cross-translation procedures, which were facilitated by
collective meetings in Britain and smaller meetings in many of the post-communist
countries studied. Items were pilot tested on 50-100 respondents in each country
prior to being finalized for use in the main surveys. All interviews were conducted
face-to-face in the respondents' homes. Interviewers were usually experienced and
were also given special training for some of the more difficult aspects of the interview
schedule. Local area supervisors carried out checks on the interviewers. Quality was
also checked in many countries using follow-up studies of approximately 10% of the
respondents' to the initial survey, who were randomly selected and re-interviewed a
few weeks later.
30

REFERENCES:
Almond, G. A. and Verba, S. (1963). The Civic Culture. Political Attitudes and Democracy in Five Nations, Princeton: Princeton University Press.
Bahry, D. and Silver, B. (1990). “Soviet Citizen Participation on the Eve of Democratization”, American Political Science Review 84, 821-47.
Barnes S.H. and J. Simon, (eds.) (1998). The Postcommunist Citizen, Budapest: Erasmus Foundation and IPS of HAS.
Brady, H. E., Verba, S. and Schlozman, K. L. (1995). “Beyond SES: A Resource Model of Political Participation”, American Political Science Review 89, 271-94.
Brown, M. and Uslaner, E. (2002). “Inequality, Trust, and Political Engagement”, Paper presented at the 2002 Annual Meeting of the American Political Science Association, Boston, MA, August 29 - September 1.
Bryk, A.S. and Raudenbush, S.W. (1993). Hierarchical Linear Models: Applications and Data Analysis Methods, Newbury Parl: Sage.
Dalton, R. (2000). “The decline of party identifications”, in: R. Dalton and M.P. Wattenberg (eds.), Parties Without Partisans. Political Change in Advanced Industrial Democracies, Oxford University Press.
Dekker, P., Koopmans, R. and van den Broek, A. (1997). “Voluntary Associations, Social Movements and Individual Political Behavior in Western Europe”, in J.W. van Deth (ed.), Private Groups and Public Life. Social Participation, Voluntary Associations and Political Involvement in Representative Democracies, London: Routlege.
DiFrancesco, W. and Gitelman, Z. (1984). “Soviet Political Culture and ‘Covert pParticipation’ in Policy Implementation”, American Political Science Review 78, 603-21.
Edwards, B. and Foley, M.W. (2001). “Civil Society and Social Capital: A Primer”, in B. Edwards, M. Foley and M. Diani (eds.), Beyond Tocqueville. Civil Society and the Social Capital Debate in Comparative Perspective, Hanover: Tufts University.
Foley, M. W. and Edwards, B. (1996). “The Paradox of Civil Society”, Journal of Democracy 7, 38-52.
Garton Ash, T. (1990). We the People: The Revolution of ’89 witnessed in Warsaw, Budapest, Berlin and Prague, Cambridge: Granta.
Gibson, J.L., Duch, R. and Tedin, K.L. (1992). “Democratic Values and the Transformation of the Soviet Union”, Journal of Politics 54, 329-71.
Gibson, J.L. (2001). “Social Networks, Civil Society, and the Prospects for Consolidating Russian’s Democratic Transition”, American Journal of Political Science 45.
Inglehart, R. (1997). Modernization and Postmodernization: Cultural, Economic, and Political Change in 43 Societies, Princeton: Princeton University Press.
31

Krishna, A. (2002). “Enhancing Political Participation in Democracies. What is the Role of Social Capital?”, Comparative Political Studies 35, 437-60.
Lehman, K., Burns, N., Verba, S. and Donahue, J. (1995). “Gender and Citizen Participation: Is There a Different Voice?”, American Journal of Political Science 39, 267-93.
Letki, N. (2002). “Lustration and Consolidation of Democracy”, Europe-Asia Studies 54, 529-52.
Letki, N. and Evans, G. (2002). “Social trust and responses to political and economic transformation in East-Central Europe”, Nuffield College Working Paper in Politics 2002-W9.
Lijphart, A. (1997). “Unequal Participation: Democracy’s Unresolved Dilemma”, American Political Science Review 91, 1-14.
Martin, J., Heath, A., Ashworth, K. and Jowell, R. (1993). “Development of a Short Quiz to Measure Political Knowledge”, CREST Working Paper No. 21.
Miller, R. F. (1993). The Developments of Civil Society in Communist Systems, Sydney: Ilen & Unwin.
Muller, E. N. and Seligson, M. A. (1994). “Civic Culture and Democracy: The Question of Causal Relationships”, American Political Science Review 88, 635-52.
Newton. K. (2001).”Social Capital and Democracy”, in B. Edwards, M. Foley and M. Diani (eds.), Beyond Tocqueville. Civil Society and the Social Capital Debate in Comparative Perspective, Hanover: Tufts University.
Norris, P. (1999). “Institutional explanations for political support”, in: Norris, P. (ed.), Critical Citizens: Global support for democratic government, Oxford: Oxford University Press.
Parry, G., Moyser, G. and Day, N. (1992). Political Participation and Democracy in Britain, Cambridge: Cambridge University Press.
Paxton, P. (2002). “Social Capital and Democracy: An Interdependent Relationship”, American Sociological Review 67, 254-77.
Putnam, R. (1993). Making Democracy Work: Civic Traditions in Modern Italy, Princeton: Princeton University Press.
Putnam, R. (2000). Bowling Alone. The Collapse and Revival of American Community, New York: Simon and Schuster.
Schlozman, K.L., Burns, N., Verba, S. and Donahue, J. (1995). “Gender and Citizen Participation: Is There a Different Voice?”, American Journal of Political Science 39, 267-93.
Schmitt, H. (2002). “Partisanship in Western Europe and the US Causes and Consequences”, paper presented at the Annual Meeting of the American Political Science Association, Boston MA, August 29 - September 1.
Schmitter, P.C. and Karl, T.L. (1991). “What Democracy Is … and Is Not”, Journal of Democracy 2, 75-88.
32

Seligson, M. A. (2002). “The Renaissance of Political Culture or the Renaissance of the Ecological Fallacy?”, Comparative Politics 34, 273-92.
Stolle, D. and Rochon, T.R. (1997). “The myth of American exceptionalism”, in J.W. van Deth, M. Maraffi, K. Newton and P.F. Whiteley (eds.), Social Capital and European Democracy, London: Routledge.
Thomassen, J. and Deth, J. van (1998). “Political Involvement and Democratic Attitudes”, in S.H. Barnes and J. Simon, (eds.), The Postcommunist Citizen, Budapest: Erasmus Foundation and IPS of HAS.
Tocqueville, Alexis de (1969). Democracy in America, New York: Anchor Books.
Vanhanen, Tatu (1997). Prospects of Democracy. A Study of 172 Countries, London: Routledge.
Verba, S. and Nie, N. H. (1972). Participation in America: Political Democracy and Social Equality, Harper Row Publishers.
Verba, S., Nie, N. H. and Kim, J.O. (1978). Participation and Political Equality: A Seven-Nation Comparison, Cambridge University Press.
Verba, S., L. L. Schlozman and H. E Brady (1995). Voice and Equality: Civic Volunteerism in American Politics, Cambridge: Harvard University Press.
Welsh, H. A. (1994) “Political Transition Processes in Central and Eastern Europe”, Comparative Politics 26, 379-394.
Woodhouse, G., Rabash, J., Goldstein, H. and Yang, M. (1996). “Introduction to multilevel modelling”, in G. Woodhouse (ed.), A guide for users of MLWin (pp. 9-57). London: Institute of Education.
33

Table 1. Levels of Political Participation in East-Central Europe
Political discussiona Partisanshipb Parliamentary election Political partiese
Votersc Non-votersd Belarus 2.73 10.5 17.1 38.0 1.8 Bulgaria 2.24 45.1 60.1 23.8 7.6 Czech Rep. 2.56 27.2 64.7 8.7 5.6 Estonia 2.34 17.2 53.9 13.8 0.7 Hungary 2.30 39.8 59.8 14.2 1.6 Poland 1.40 22.5 65.0 25.7 1.6 Romania 1.53 42.7 68.3 14.4 3.2 Russia 2.43 13.3 22.8 44.0 1.1 Slovak Rep. 2.90 26.7 61.1 17.2 4.8 Ukraine 2.22 14.6 23.0 32.8 0.6 a Average levels of reported political discussion (from 0 to 6). b Percentage of political party supporters. c Percentage of respondents declaring they know what party they would vote for in the prospective parliamentary election. d Percentage of respondents declaring they would not vote for in the prospective parliamentary election. e Percentage of political party members.
34

Table 2. Regressions of Political Participation on Trust, Associations, Communist Party Membership, Socio-Economic Background and Democracy, N1 = 13155, N2 = 10
(unstandardised coefficients, standard errors in parentheses)
Dependent Variable: Political
Discussiona Party
Membershipb Party Supportb Votingb Constant 2.340*** (0.340) -3.247*** (0.765) -1.867*** (0.363) -0.849 (0.445) Trust 0.150*** (0.031) 0.167 (0.102) 0.089* (0.037) 0.158*** (0.033) Associations 0.062 (0.192) 0.226 (0.499) 0.590** (0.213) 0.836*** (0.207) Trust & Associations Interaction 0.116 (0.063) 0.176 (0.163) -0.059 (0.071) -0.137* (0.068) Communist Party Membership 0.364*** (0.051) 1.352*** (0.114) 0.420*** (0.055) 0.454*** (0.055) Sex -0.488*** (0.037) -0.688*** (0.119) -0.371*** (0.043) -0.268*** (0.039) Age 18-29 30-44 0.329*** (0.051) 0.827*** (0.245) 0.415*** (0.065) 0.175*** (0.055) 45-59 0.421*** (0.055) 1.069*** (0.246) 0.619*** (0.068) 0.345*** (0.059) 60+ 0.346*** (0.061) 1.638*** (0.249) 0.925*** (0.074) 0.440*** (0.066) Education 1 2 0.507*** (0.061) 0.469* (0.215) 0.271*** (0.074) 0.171* (0.065) 3 0.791*** (0.065) 0.653** (0.225) 0.300*** (0.079) 0.276*** (0.070) 4 0.999*** (0.066) 0.733** (0.229) 0.424*** (0.080) 0.294*** (0.071) 5 1.296*** (0.068) 0.900*** (0.222) 0.423*** (0.082) 0.433*** (0.074) Income Below Average Average 0.328*** (0.045) 0.162 (0.139) 0.127* (0.054) 0.165*** (0.049) Above Average 0.621*** (0.059) 0.158 (0.177) 0.356*** (0.069) 0.415*** (0.064) Change in Democracy 0.002 (0.008) 0.035*** (0.008) 0.022** (0.007) 0.021 (0.012) Country Level Variance 0.217* (0.099) 0.189 (0.102) 0.207* (0.095) 0.588 (0.264) *** p < 0.001 ** p < 0.01 * p < 0.05 a Linear regression b Logit model
35
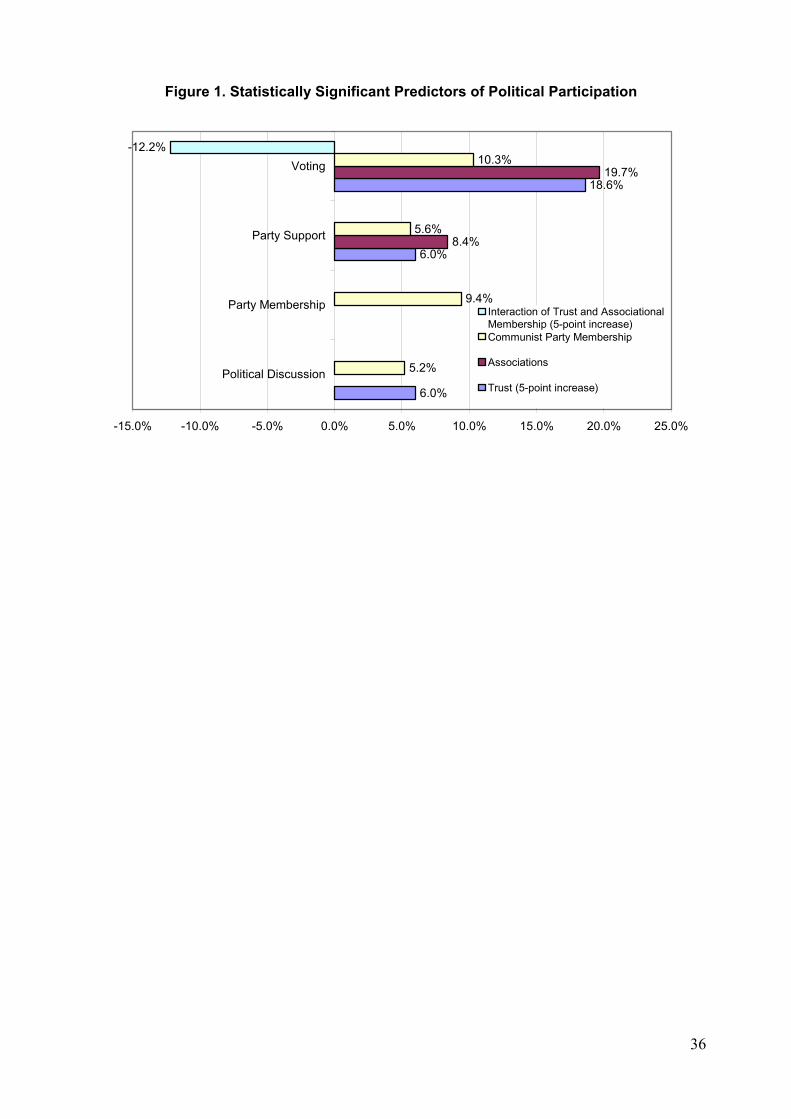
Figure 1. Statistically Significant Predictors of Political Participation
6.0%
6.0%
18.6%
8.4%
19.7%
5.2%
9.4%
5.6%
10.3%-12.2%
-15.0% -10.0% -5.0% 0.0% 5.0% 10.0% 15.0% 20.0% 25.0%
Political Discussion
Party Membership
Party Support
Voting
Interaction of Trust and AssociationalMembership (5-point increase)Communist Party Membership
Associations
Trust (5-point increase)
36

Figure 2. The Impact of the Change in Democracy on Political Participation (Belarus and Ukraine are the baseline)
-1.7%
11.0%
-4.0%
14.9%
-7.5%
21.2%
-10.0% -5.0% 0.0% 5.0% 10.0% 15.0% 20.0% 25.0%
Estonia
Czech Republic
VotingPartisanshipParty memberhsip
37

Table A1. Change of the Score on the Vanhannen’s Index of Democratization
Change 1989-1993 Belarus 0.00Bulgaria 40.48Czech R. 42.63Estonia -18.44Hungary 35.11Lithuania 0.76Poland 6.89Romania 26.1Russia 19.33Slovak R. 34.9Ukraine 0.00
38

Table B.1. Information on sampling and response rates for each survey SAMPLING FRAME
SAMPLING RESPONSE RATE
BULGARIA SUMMER 1993
adult pop (18+) 1992 census of households
two-step cluster 1. 211 census districts (from 42000) 2.random:12 households from each
names issued: 2532 non-contact: 517 refused: 83 achieved: 1932 Response rate: 0.76
CZECH REPUBLIC SPRING 1994
adult pop (18+) list of voters from 1992 in sampled localities
1. 8 regions 2. 182 sampling points (localities) from 13410 3. 2104 addresses, of which: 1681 random list sampling (electoral register): 423 random route + 111 quota
names issued: 2104 non-contact: 404 refused: 291 achieved: 1409+ 111 Response rate: 0.67
ESTONIA SUMMER 1993
adult pop (18+) 1989 census of households
1. 5 regions 2. 15 counties 3. 321 sampling points 4.random-route/household 5.Kish matrix/respondent
names issued: 2285 non-contact: 63 refused: 190 achieved: 2029 Response rate: 0.89
HUNGARY SPRING 1994
adult pop (20+) Central Register of Population (1992)
1. 12 counties representing regions 2. 78 sampling points 3. random selection of individuals
names issued: 1703 non-contact: 200 refused: 189 achieved: 1314 Response rate: 0.77
POLAND SUMMER 1993
adult pop (18+) Central Register of Individuals
1. 8 regions 2. 4 types of settlements
names issued: 2040 non-contact: 228 refused: 83 achieved: 1729 Response rate: 0.85
ROMANIA SUMMER 1993
adult pop (18+) Electoral Records
1. 4 provinces 2. 4 types of settlements 3. electoral constituencies (126 from 51 settlements)
names issued: 2000 non-contact: 334 refused: 45 achieved: 1621 Response rate: 0.81
RUSSIA SUMMER 1993
adult pop (18+) lists of 'privatization vouchers'
1. 10 regions 2. 56 settlements 3. indiv. from list of vouchers
names issued: 2420 non-contact: 264 refused: 126 achieved: 2030 Response rate: 0.84
SLOVAKIA SPRING 1994
adult pop (18+) list of voters from 1992 in sampled localities
1. 4 regions 2. 215 sampling points (localities) from 4191 3. 2014 addresses of which: 1100 first wave; 914 second wave. Random list sampling (electoral register) + 68 quota
names issued: 2014 non-contact: 338 refused: 233 achieved: 1443+ 68 Response rate: 0.75
UKRAINE SUMMER 1993
adult pop (18+) Housing Offices' residence list of individuals
1. 70 urban + 50 rural settlements 2. 7 types (only urban) - selection proportional to size of pop. in each type
names issued: 2984 non-contact: 220 refused: 227 achieved: 2537 Response rate: 0.85
Response rate = achieved/names issued.