…explained · KEY MESSAGES Food value chains stretch from the producers of necessary inputs (e.g....
12
Agriculture and Rural Development FARMER POSITION IN VALUE CHAINS This is part of a series of Briefs summarising the facts and addressing the policy relevance around the 9 proposed specific objectives of the future CAP. KEY MESSAGES Food value chains stretch from the producers of necessary inputs (e.g. seeds, fertilisers) to the EU’s 500 million consumers. Farming and related sectors provide large numbers of jobs, yet agriculture is characterised by a stagnant and low share of value added in the value chain, due to high input costs, variation in production and incorporation of new services. New innovative dynamics emerge in the supply chain, not only restricted to product and process but also organisational innovation along the chain, trig- gered by new emerging technologies and evolving consumer demands. The higher concentration of retailers and processors potentially places farmers at a weaker bargaining power within the value chain. Farmers need to respond to changing demand of consumers, which are channelled to them through the other actors of the chain. The future CAP aims at strengthening farmers’ position in value chains by strengthening cooperation among farmers, enhancing synergies within value chains, supporting the development of market driven production models, fostering research and innovation, increasing market transparency and ensuring effective mechanisms against Unfair Trading Practices (UTPs). This brief is based on contributions from: Mariusz Legowski, Natalia Brzezina, Pavel Ciaian, Marcelo Lima, Koen Mondelaers, Léon van de Pol, Fabien Santini, Alexander Stein. Disclaimer: The contents of the publication do not necessarily reflect the position or opinion of the European Commission. CAP SPECIFIC OBJECTIVES …explained – Brief No 3
Transcript of …explained · KEY MESSAGES Food value chains stretch from the producers of necessary inputs (e.g....

Agriculture
and Rural
Development
FARMER POSITION IN VALUE CHAINS
This is part of a series of Briefs summarising the facts and addressing the policy relevance around
the 9 proposed specific objectives of the future CAP.
KEY MESSAGES
Food value chains stretch from the producers of necessary inputs (e.g. seeds, fertilisers) to the EU’s 500 million consumers. Farming and related sectors provide large numbers of jobs, yet agriculture is characterised by a
stagnant and low share of value added in the value chain, due to high input costs, variation in production and incorporation of new services.
New innovative dynamics emerge in the supply chain, not only restricted to
product and process but also organisational innovation along the chain, trig-
gered by new emerging technologies and evolving consumer demands.
The higher concentration of retailers and processors potentially places farmers at a weaker bargaining power within the value chain. Farmers need to respond to changing demand of consumers, which are channelled to them
through the other actors of the chain.
The future CAP aims at strengthening farmers’ position in value chains by strengthening cooperation among farmers, enhancing synergies within value chains, supporting the development of market driven production models,
fostering research and innovation, increasing market transparency and ensuring effective mechanisms against Unfair Trading Practices (UTPs).
This brief is based on contributions from: Mariusz Legowski, Natalia Brzezina, Pavel Ciaian,
Marcelo Lima, Koen Mondelaers, Léon van de Pol, Fabien Santini, Alexander Stein.
Disclaimer: The contents of the publication do not necessarily reflect the position or opinion of the
European Commission.
CAP SPECIFIC OBJECTIVES
…explained
– Brief No 3
CAP OBJECTIVE 3 – IMPROVE IMBALANCES IN THE FOOD CHAIN
2
1. Food value chain trends and challenges
EU value chains are diverse and dynamic, enabling them to meet the various
consumers’ expectations, potentially helping producers increase value added.
The EU agri-food sector now competes at world market prices for most
products, leads the field in terms of product diversity and quality and achieves
the globe's highest agri-food export levels (worth over EUR 137 billion in
2018).1
CAP reforms played an important role in this development, leading to better
market orientation of agricultural production and increased competitiveness of
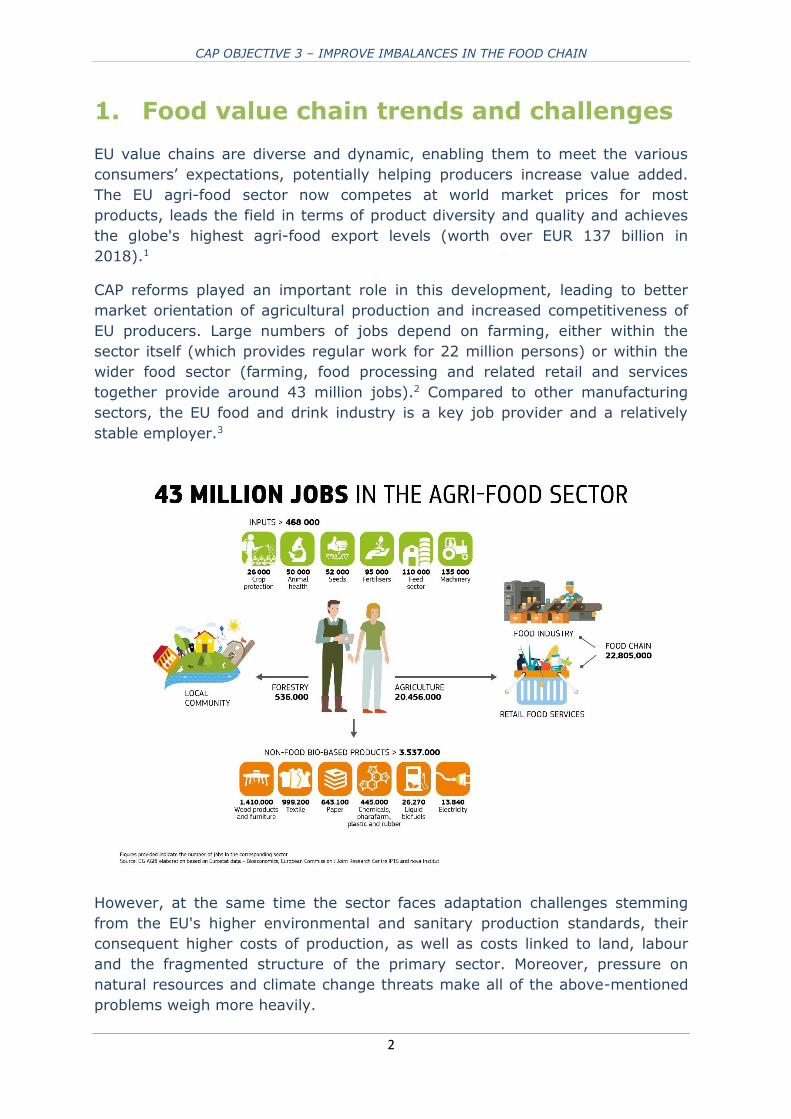
EU producers. Large numbers of jobs depend on farming, either within the
sector itself (which provides regular work for 22 million persons) or within the
wider food sector (farming, food processing and related retail and services
together provide around 43 million jobs).2 Compared to other manufacturing
sectors, the EU food and drink industry is a key job provider and a relatively
stable employer.3
However, at the same time the sector faces adaptation challenges stemming
from the EU's higher environmental and sanitary production standards, their
consequent higher costs of production, as well as costs linked to land, labour
and the fragmented structure of the primary sector. Moreover, pressure on
natural resources and climate change threats make all of the above-mentioned
problems weigh more heavily.

CAP OBJECTIVE 3 – IMPROVE IMBALANCES IN THE FOOD CHAIN
3
a. Power imbalance in agro-food value chains
There are clear bargaining power asymmetries with limited power for individual
farmers. Primary producers are expanding downstream in the chain only to a
limited extent (i.e. into processing or direct sales) - and are under-using
opportunities to increase their market power. There is a lack of vertical
integration under the control of the primary sector. In parallel, there is also
asymmetric price transmission along the chain, due inter alia but not only to
imbalances of power.
Concentration in the farming sector
Structural changes for agricultural producers have taken place since the mid-
20th century, but the concentration rate remains much lower compared to
downstream sectors. This is explained by reduced mobility of production
factors, such as land and to a lesser extent labour as well as limited access to
capital. Although structural changes are taking place at a rapid pace,
concentration in the farming sector remains very low. Upstream, the
development of input markets is also an important issue for the agricultural
sector. Various stakeholders have expressed for example their concern over the
increasing consolidation and the impact it may have on prices, innovation and
product choice, for example in the seed market.4
The EU food system is characterised by
high concentration in processing,
distribution and retail, with food mostly
distributed through supermarkets,
hypermarkets and discounters, which
account for 54% of total edible grocery
sales in the EU.5 In food processing,
the top three processing firms have a
market share above 50% in several
sub-sectors.6 The concentration ratio is
even higher at retail stage, reaching
80% in some Member States.
Even if this could help them protect their interests better, in some sectors and
Member States, there are barriers to more cooperation among farmers. The
reasons are, for instance, a lack of trust, insufficient knowledge of the potential
benefits of Producer Organisations (POs); perceiving each other as competitors,
wish to keep the control of their individual production and investment decisions
or for historical and cultural reasons.
CAP OBJECTIVE 3 – IMPROVE IMBALANCES IN THE FOOD CHAIN
4
While many producers join forces in producer organisations (POs) and other
collective organisations such as cooperatives, important differences remain
across Europe regarding farmers’ membership in such undertakings. Even in the
fruit and vegetables sector, with a relatively high organisation rate, only half of
the value of all marketable produce was marketed via POs in 2015.
EU cooperatives maintain a strong market presence in the EU food supply
chain. Cooperatives hold substantial shares in markets for agricultural products
in the Netherlands (83%), Finland (79%), Italy (55%), and France (50%).
Cooperatives account for a large share of the market for agricultural products in
some sectors but not in others. For example, the dairy sector is predominantly
organised in cooperatives (55%), while sugar and meat sectors have fewer
cooperatives (25% for sugar or pig meat).
The differences between sectors are mainly due to the characteristics of the
product and the production process. In the dairy as well as in the fruit and
vegetables sectors, cooperatives have an important market share, partly due to
the perishability of the product and thus the high transaction costs in trading
this product.
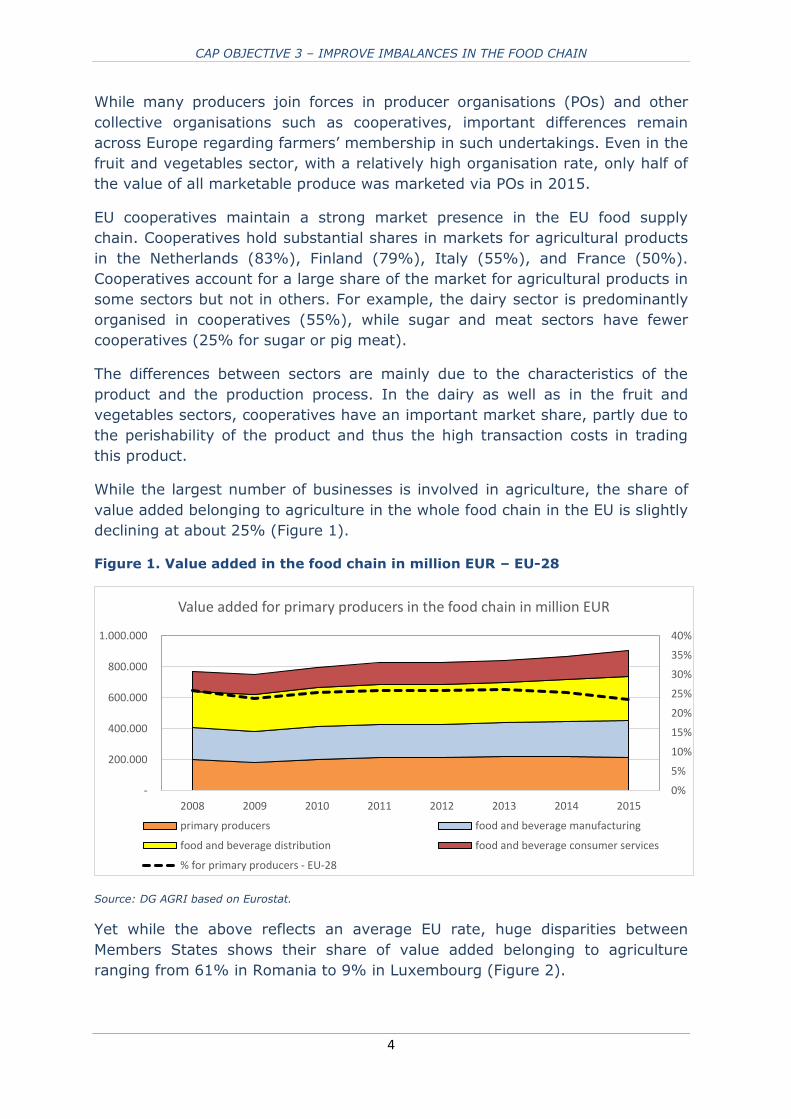
While the largest number of businesses is involved in agriculture, the share of
value added belonging to agriculture in the whole food chain in the EU is slightly
declining at about 25% (Figure 1).
Figure 1. Value added in the food chain in million EUR – EU-28
Source: DG AGRI based on Eurostat.
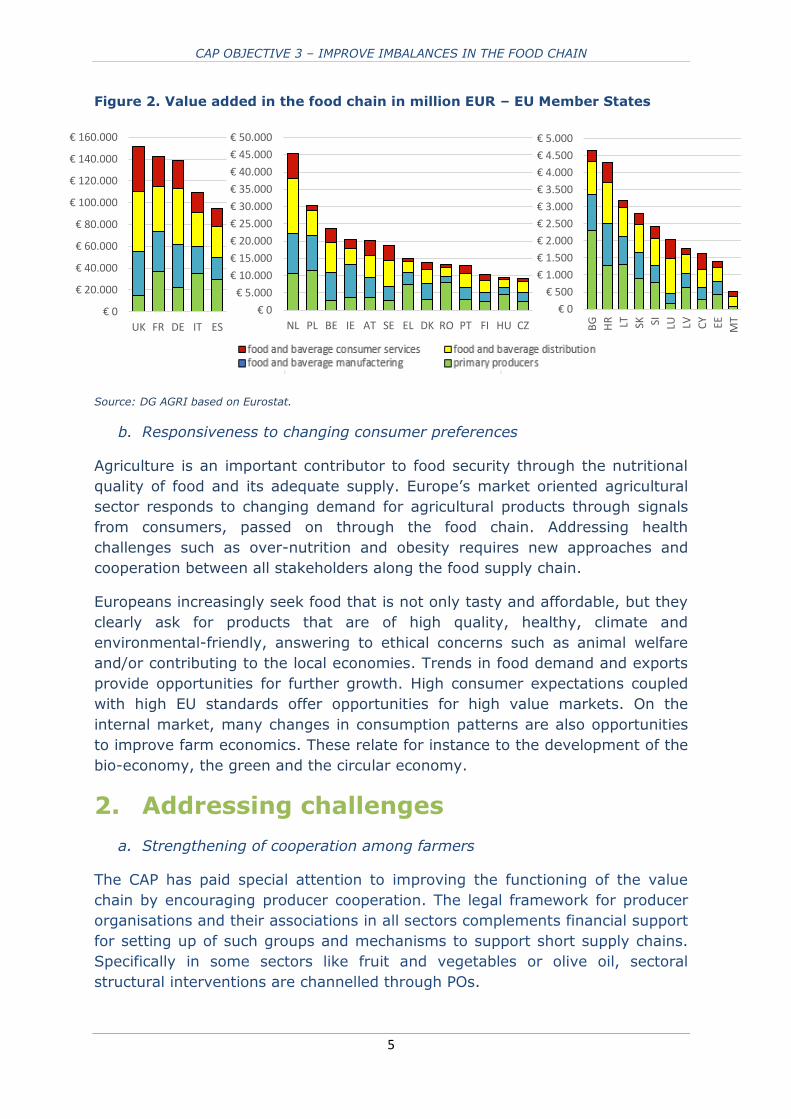
Yet while the above reflects an average EU rate, huge disparities between
Members States shows their share of value added belonging to agriculture
ranging from 61% in Romania to 9% in Luxembourg (Figure 2).
0%
5%
10%
15%
20%
25%
30%
35%
40%
-
200.000
400.000
600.000
800.000
1.000.000
2008 2009 2010 2011 2012 2013 2014 2015
Value added for primary producers in the food chain in million EUR
primary producers food and beverage manufacturing
food and beverage distribution food and beverage consumer services
% for primary producers - EU-28
CAP OBJECTIVE 3 – IMPROVE IMBALANCES IN THE FOOD CHAIN
5
Figure 2. Value added in the food chain in million EUR – EU Member States
Source: DG AGRI based on Eurostat.
b. Responsiveness to changing consumer preferences
Agriculture is an important contributor to food security through the nutritional
quality of food and its adequate supply. Europe’s market oriented agricultural
sector responds to changing demand for agricultural products through signals
from consumers, passed on through the food chain. Addressing health
challenges such as over-nutrition and obesity requires new approaches and
cooperation between all stakeholders along the food supply chain.
Europeans increasingly seek food that is not only tasty and affordable, but they
clearly ask for products that are of high quality, healthy, climate and
environmental-friendly, answering to ethical concerns such as animal welfare
and/or contributing to the local economies. Trends in food demand and exports
provide opportunities for further growth. High consumer expectations coupled
with high EU standards offer opportunities for high value markets. On the
internal market, many changes in consumption patterns are also opportunities
to improve farm economics. These relate for instance to the development of the
bio-economy, the green and the circular economy.
2. Addressing challenges
a. Strengthening of cooperation among farmers
The CAP has paid special attention to improving the functioning of the value
chain by encouraging producer cooperation. The legal framework for producer
organisations and their associations in all sectors complements financial support
for setting up of such groups and mechanisms to support short supply chains.
Specifically in some sectors like fruit and vegetables or olive oil, sectoral
structural interventions are channelled through POs.
€ 0
€ 20.000
€ 40.000
€ 60.000
€ 80.000
€ 100.000
€ 120.000
€ 140.000
€ 160.000
UK FR DE IT ES
€ 0
€ 5.000
€ 10.000
€ 15.000
€ 20.000
€ 25.000
€ 30.000
€ 35.000
€ 40.000
€ 45.000
€ 50.000
NL PL BE IE AT SE EL DK RO PT FI HU CZ
€ 0
€ 500
€ 1.000
€ 1.500
€ 2.000
€ 2.500
€ 3.000
€ 3.500
€ 4.000
€ 4.500
€ 5.000
BG
HR LT SK SI LU LV CY EE MT

CAP OBJECTIVE 3 – IMPROVE IMBALANCES IN THE FOOD CHAIN
6
With these measures, the EU wants to strengthen the bargaining power of
farmers and their possibilities to cooperate within the remits of Competition law
in order to improve the distribution of the value added generated in the food
supply chain. The post 2020 CAP legislative proposal largely maintains the
sectoral programmes, but adapts them to the new programming context and
new objectives. For example, increasing fruit and vegetable consumption is
explicitly proposed as an additional objective for the sectoral scheme. Also, the
proposals allows Member States to prepare specific interventions for all main EU
agricultural sectors in their strategic CAP plans.
b. Enhancing synergies within value chains
In order to ensure a well-functioning and competitive food supply chain and to
respond to requests made by other EU-institutions and civil society, the
Commission proposed in April 2018 a Directive on Unfair Trading Practices
(UTPs) in business-to-business relationships in the food supply chain. (Thus
defined are practices that grossly deviate from good commercial conduct, are
contrary to good faith and fair dealing and are unilaterally imposed by one
trading partner on its counterparty). With the proposal adopted by the Council
and the European Parliament in April 2019, Member States now have 24
months to transpose the Directive, and apply it six months thereafter.7
The Directive bans the most harmful business-to-business UTPs to protect small
and medium-sized (SME) suppliers in the food supply chain insofar as they sell
agricultural and food products to buyers that are not SMEs. Since some Member
States already have legislation tackling UTPs, the harmonisation of regulating of
UTPs across the EU still leaves Member States with the possibility to maintain
their existing measures if these exceed the level of protection of the Directive.
Market transparency is relevant for the proper functioning of the supply
chain. With a view to helping the EU agricultural sector to cope better with
market volatility and to interpret price signals, the Commission has established
market observatories covering the markets for milk, meat, sugar and arable
crops.8 Market observatories for wine and fruit and vegetables are in
preparation, while the Commission continues to provides market information on
other important sectors and aspects of EU agriculture. The aim of the
observatories is to provide the sectors with more transparency by disseminating
market data and short-term analyses in a timely manner. An interactive data
portal is currently also being developed on market information.9
As a result of more market oriented CAP (with the safety-nets when there is no
other recourse) more farmers, producer organisations and cooperatives as well
as other actors in the chain are progressively using futures markets for
commodity type agricultural products to protect them-selves against volatility
risks (grains, oilseeds, sugar, dairy products and recently liquid milk). The
volumes traded are still low but a growing interest for these contracts is
observed.10

CAP OBJECTIVE 3 – IMPROVE IMBALANCES IN THE FOOD CHAIN
7
Figure 3. Food supply chain index for EU-28 (index 2015 =100)
Source: EUROSTAT, Food Prices Monitoring Tool (prc_fsc_idx)
Blockchain and the food chain
Blockchain, connecting devices and enhancing the scope of the “Internet of
Things” (IoT) economy, is a promising technology for many areas such as
supply chains, recording land titles, insurance markets, or any other type of
transaction or record that can be translated in a digital form. It thus has high
potential to improve market transparency and efficiency of food supply
chains due to the full and near instant traceability beyond prices.11
Blockchain can trace instantaneously any number of characteristics attributes of
specific food products in their journey from farmers to consumers, allowing
every stakeholder in the supply chain to have a better picture of the food’s
journey across the whole supply chain (e.g. where each food item was grown,
handled, processed, stored, what inputs were used, etc). Blockchain technology
can provide cheaper access to information; can improve communication and
information flow (accuracy and speed) between players in the chain. Farmers
can potentially benefit from instant access to information about demand
conditions.
However, there are several challenges that must be addressed for adoption on a
wider scale in the supply chain. The technology is not yet fully mature and
regulatory framework might need to be adapted, to tackle issues of capacity,
validation time, scalability, confidentiality, security of the systems and
ownership of data/chains so that they reduce imbalances in the chain.
75
80
85
90
95
100
105
110
1152
00
5M
01
20
05
M0
6
20
05
M1
1
20
06
M0
4
20
06
M0
9
20
07
M0
2
20
07
M0
7
20
07
M1
2
20
08
M0
5
20
08
M1
0
20
09
M0
3
20
09
M0
8
20
10
M0
1
20
10
M0
6
20
10
M1
1
20
11
M0
4
20
11
M0
9
20
12
M0
2
20
12
M0
7
20
12
M1
2
20
13
M0
5
20
13
M1
0
20
14
M0
3
20
14
M0
8
20
15
M0
1
20
15
M0
6
20
15
M1
1
20
16
M0
4
20
16
M0
9
20
17
M0
2
20
17
M0
7
20
17
M1
2
20
18
M0
5
20
18
M1
0
Agricultural commodity price index Producer price index Harmonised index of consumer prices

CAP OBJECTIVE 3 – IMPROVE IMBALANCES IN THE FOOD CHAIN
8
c. Support the development of market driven production models
The level of prices and increasingly volatile markets also call for further efforts
on diversification of farm operations and sources of revenue. Rural development
policy and sectoral interventions are used to help farmers and the food industry
respond to consumer demands and develop new markets for organic products,
high quality food, bioenergy production, waste management, short supply
chain, local processing or any other specific segments as well as non-
agricultural activities. Some important examples of how farmers can benefit
from higher value added segments of production with the help of CAP policy
tools are described below.
Geographical indications
The EU is renowned for its high quality food products having specific
characteristics or farming attributes that distinguish them in the marketplace,
and particularly those labelled under registered geographical indications (GIs).
The quality and diversity of the Union's agricultural production is one of its
important strengths giving a competitive advantage to its producers and
making a major contribution to its living cultural and gastronomic heritage.
Product sold under GIs are estimated to represent around 5.7 % of EU food and
drink production, and 15 % of EU food and drink exports.12
Quality schemes can benefit the rural economy. This is particularly the case in
disadvantaged areas, in mountain areas and in the most remote regions where
the farming sector already takes a significant part of the economy and
production costs are high. They can create value for local communities through
products that are deeply rooted in tradition, culture and geography.
Organic production
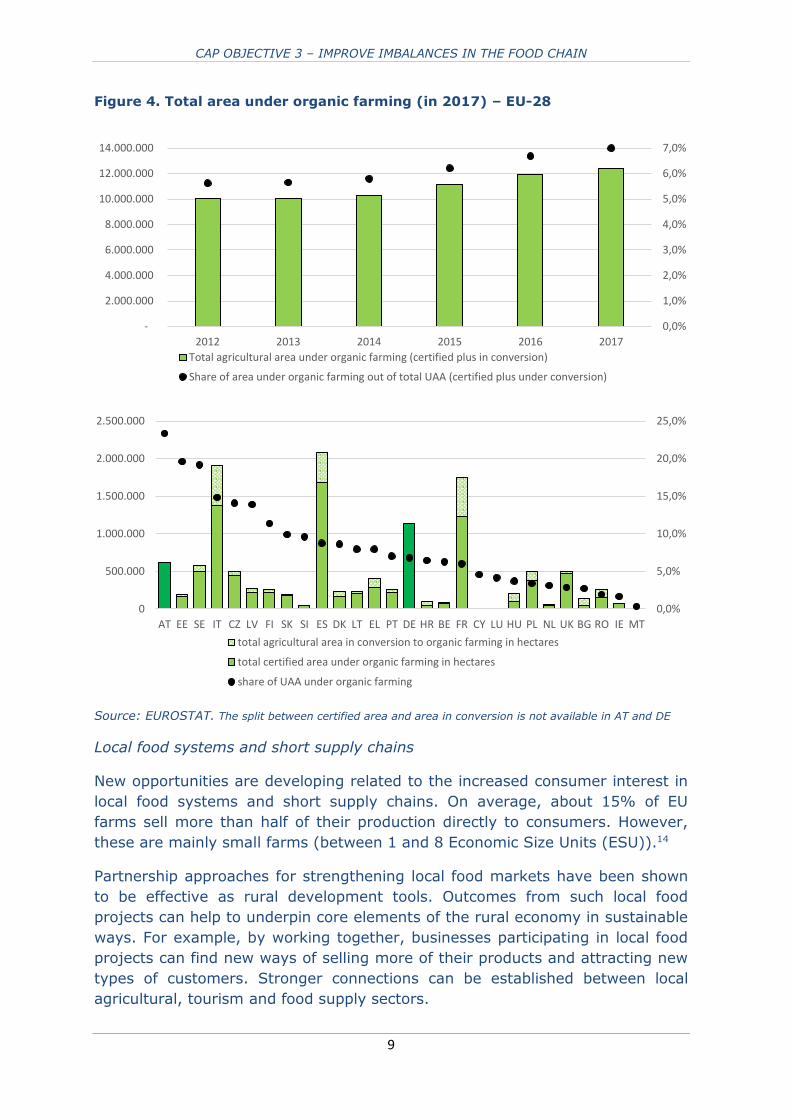
The European organic farming sector is characterised by continuous growth. It
also responds to the increasing demand for more “natural” food and
environmental concerns. It was found that, in particular for the unprocessed
products, the organic farmers’ share of the price formation represents a
proportion of between 9 % and 62 % of the retail prices compared to between
6 % and 40 % in the conventional supply chains.
This would indicate that, in general, more value added is created in organic
compared to conventional chains, but the price difference does not consider
increased costs and therefore only represents an approximate indication of the
value added.13
The Commission CAP post-2020 proposal strongly prioritises the commitment to
increase the level of environment and climate ambition. Organic production
plays a key role in this orientation, not just by responding to new consumer
trends but also by generating knowledge that enhances the understanding of
the benefits of more environmentally-friendly practises.
CAP OBJECTIVE 3 – IMPROVE IMBALANCES IN THE FOOD CHAIN
9
Figure 4. Total area under organic farming (in 2017) – EU-28
Source: EUROSTAT. The split between certified area and area in conversion is not available in AT and DE
Local food systems and short supply chains
New opportunities are developing related to the increased consumer interest in
local food systems and short supply chains. On average, about 15% of EU
farms sell more than half of their production directly to consumers. However,
these are mainly small farms (between 1 and 8 Economic Size Units (ESU)).14
Partnership approaches for strengthening local food markets have been shown
to be effective as rural development tools. Outcomes from such local food
projects can help to underpin core elements of the rural economy in sustainable
ways. For example, by working together, businesses participating in local food
projects can find new ways of selling more of their products and attracting new
types of customers. Stronger connections can be established between local
agricultural, tourism and food supply sectors.
0,0%
1,0%
2,0%
3,0%
4,0%
5,0%
6,0%
7,0%
-
2.000.000
4.000.000
6.000.000
8.000.000
10.000.000
12.000.000
14.000.000
2012 2013 2014 2015 2016 2017
Total agricultural area under organic farming (certified plus in conversion)
Share of area under organic farming out of total UAA (certified plus under conversion)
0,0%
5,0%
10,0%
15,0%
20,0%
25,0%
0
500.000
1.000.000
1.500.000
2.000.000
2.500.000
AT EE SE IT CZ LV FI SK SI ES DK LT EL PT DE HR BE FR CY LU HU PL NL UK BG RO IE MT
total agricultural area in conversion to organic farming in hectares
total certified area under organic farming in hectares
share of UAA under organic farming
CAP OBJECTIVE 3 – IMPROVE IMBALANCES IN THE FOOD CHAIN
10
Direct sales in the EU
Direct sales (from original producer to final customer) are the shortest supply
chains. There are significant differences between countries: while the share of
farms involved in direct sales is nearly 25% in Greece, 19% in Slovakia and
around 18% in Hungary, Romania and Estonia, it is less than 5% in Malta,
Austria and Spain. In France, 21% of farmers sell their products within short
supply chains, and half of those producing vegetables and honey are involved in
Short Food Supply Chains.15
Rural businesses can also obtain a variety of economic, social and
environmental benefits from ‘short-supply chains’. For instance, reducing the
number of businesses involved in a supply chain between the producer of a raw
material and the final customer can increase the share of value added received
by those involved and usually generates a higher employment multiplier than
longer and /or less local chains.
Fewer links can also provide cost savings for customers and makes it easier for
everyone to know where the raw materials come from. Short food supply chains
also to deliver important social benefits, relinking farmers to the consumers and
contributing to a revival of rural communities. They are often backed with
organic methods of production, but these may be at the expense of increased
transport-related carbon emissions if logistics are not well coordinated.
In addition, LEADER16 is an instrument that often funds the development of
short supply chains and local markets as part of their local development
strategies.
d. Foster research and innovation
Food and non-food supply chains operate in an increasingly complexity and
dynamic environment characterized by new consumer demands, new and
sometimes, game-changing technologies, changing structures and cooperation
modes. The use of new and innovative business models supporting eco-
innovations or connecting producers to consumers can generate higher income
for producers while improving the delivery of high quality and nutritious food at
affordable prices for consumers along with manifold other environmental and
social benefits.17
Therefore, the EU invests in research and innovation to improve
competitiveness of the European agro-food sector and to support transition
pathways towards sustainable, resilient, circular and efficient food supply
chains.18

CAP OBJECTIVE 3 – IMPROVE IMBALANCES IN THE FOOD CHAIN
11
3. Conclusions
Different stages in the value chain are subject to different types of pressure.
Agriculture is characterised by generating a fairly limited and slightly declining
share of value added in the food supply chain, due to increased input costs,
continuing market power imbalances and increasing layers of processing and
services that add value at downstream stages of the supply chain (e.g.
convenience foods).
The primary sector is fragmented. In the food supply chain, there are many
more farmers than processors and retailers, and farm businesses are generally
very small.
Concentration in the food processing industry and retail sectors is higher than in
the agricultural sector, endowing downstream actors with higher bargaining
power. Though this development is not problematic in itself and can lead to
efficiency gains in the chain, abuse of bargaining power might result in unfair
trading practices in the food chain and a lower efficiency of the chain than
potentially achievable.
A new dynamism is observed as different types of innovation in the supply
chain emerge, not restricted to product and processes but also organisational
innovation along the chain, triggered by emerging technologies and evolving
consumer demands. This implies that all actors, including regulators, will have
to adapt to the new technological context to ensure potential breakthroughs
benefit all actors in more efficient food chain.
The EU’s Common Agricultural Policy will continue providing measures that aim
to strengthen farmers’ position in a continuously evolving value chain, increase
market transparency, and ensure effective mechanisms against UTPs.
Endnotes 1 Factsheets on EU28 agri-food trade with the world, individual countries and selected regions
https://ec.europa.eu/agriculture/trade-analysis/statistics_en 2 The Commission Communication the future of food and farming
https://ec.europa.eu/agriculture/sites/agriculture/files/future-of-cap/future_of_food_and_ farming_communication_en.pdf

CAP OBJECTIVE 3 – IMPROVE IMBALANCES IN THE FOOD CHAIN
12
3 FoodDrinkEurope’s Data & Trends report 2018
https://www.fooddrinkeurope.eu/publication/data-trends-of-the-european-food-and-drink-
industry-2018/ 4 OECD (2018) Concentration in Seed Markets: Potential effects and policy responses, Paris:
OECD Publishing. 5 Impact assessment - Initiative to improve the food supply chain (unfair trading practices),
Proposal for a directive – COM(2018) 173/970778 https://ec.europa.eu/info/law/better-regulation/initiatives/ares-2017-3735471_en 6 Economic challenges facing EU agriculture (2017) https://ec.europa.eu/agriculture/sites/agriculture/files/consultations/cap-modernising/
eco_background_final_en.pdf
7 Proposal for a Directive of the European Parliament and of the Council on unfair trading practices in business-to-business relationships in the food supply chain. https://eur-lex.europa.eu/legal-content/EN/TXT/?uri=CELEX%3A52018PC0173
8 https://ec.europa.eu/agriculture/market-observatory_en 9 http://agridata.ec.europa.eu/extensions/DataPortal/home.html
10 https://ec.europa.eu/agriculture/sites/agriculture/files/markets-and-prices/market-
briefs/pdf/11_en.pdf 11 Emerging Opportunities for the Application of Blockchain in the Agri-food Industry
https://www.ictsd.org/sites/default/files/research/emerging_opportunities_for_the_application
_ofblockchain_in_the_agri-food_industry_final_0.pdf
12 Data & Trends, EU Food & Drink Industry (2018) https://www.fooddrinkeurope.eu/uploads/publications_documents/FoodDrinkEurope_Data_
and_Trends_2018_FINAL.pdf 13 Sanders, J et al. (2016) Distribution of the added value in the organic food chain. Study for
the European Commission. https://ec.europa.eu/agriculture/external-studies/2016-organic-food-chain_en
14 STRENGTH2FOOD https://www.strength2food.eu/ 15 Statistical Annex accompanying the IA of the future CAP proposal,
https://ec.europa.eu/agriculture/statistics/facts-and-figures_en
16 LEADER stands for the French acronym of Local Action Groups engaged through the Rural
Development Programme of the CAP.
17 SMARTCHAIN. https://cordis.europa.eu/project/rcn/215956_fr.html 18 http://ec.europa.eu/information_society/newsroom/image/document/2018-18/agri_
factsheets_10_value-chains_ok_1545CA43-91EF-2C1C-F18BDD2F658F9DB8_51897.pdf
For more information
https://ec.europa.eu/info/food-farming-fisheries/key-policies/common-agricultural-policy/future-cap_en#objectives
https://ec.europa.eu/agriculture/statistics/factsheets_en
https://ec.europa.eu/agriculture/index_en
https://www.fooddrinkeurope.eu/publication/data-trends-of-the-european-food-and-drink-industry-2018/