Expert Report of Dean Schillinger
18
SCHILLINGER REPORT CASE NO. 3:15-cv-03415 EMC n:\govlit\li2016\160121\01084178.docx 1 2 3 4 5 6 7 8 9 10 11 12 13 14 15 16 17 18 19 20 21 22 23 24 25 26 27 28 UNITED STATES DISTRICT COURT NORTHERN DISTRICT OF CALIFORNIA THE AMERICAN BEVERAGE ASSOCIATION, CALIFORNIA RETAILERS ASSOCIATION, CALIFORNIA STATE OUTDOOR ADVERTISING ASSOCIATION, Plaintiffs, vs. THE CITY AND COUNTY OF SAN FRANCISCO, Defendant. Case No. 3:15-cv-03415 EMC EXPERT REPORT OF DEAN SCHILLINGER Hearing Date: April 7, 2016 Time: 1:30 p.m. Place: Crtrm. 5, 17th Fl. Trial Date: None set ›ø#ª ÌÊÔÎÛ*™Û,ÌÏÔÎÛ¤”› ‹±*´3ª4¨ ÎÍÛÌ ⁄8¥ªº ,ÓÒÓÌÒÔÍ –ø>ª Ó ±? ÈÍ
Transcript of Expert Report of Dean Schillinger

SCHILLINGER REPORTCASE NO. 3:15-cv-03415 EMC
n:\govlit\li2016\160121\01084178.docx
1
2
3
4
5
6
7
8
9
10
11
12
13
14
15
16
17
18
19
20
21
22
23
24
25
26
27
28
UNITED STATES DISTRICT COURT
NORTHERN DISTRICT OF CALIFORNIA
THE AMERICAN BEVERAGEASSOCIATION, CALIFORNIA RETAILERSASSOCIATION, CALIFORNIA STATEOUTDOOR ADVERTISINGASSOCIATION,
Plaintiffs,
vs.
THE CITY AND COUNTY OF SANFRANCISCO,
Defendant.
Case No. 3:15-cv-03415 EMC
EXPERT REPORT OF DEAN SCHILLINGER
Hearing Date: April 7, 2016Time: 1:30 p.m.Place: Crtrm. 5, 17th Fl.
Trial Date: None set
›ø#ª ÌÊÔÎÛ*™Û,ÌÏÔÎÛ¤”› ‹±*´3ª4¨ ÎÍÛÌ ⁄8¥ªº ,ÓÒÓÌÒÔÍ –ø>ª Ó ±? ÈÍ

SCHILLINGER REPORTCASE NO. 3:15-cv-03415 EMC
1 n:\govlit\li2016\160121\01084178.docx
1
2
3
4
5
6
7
8
9
10
11
12
13
14
15
16
17
18
19
20
21
22
23
24
25
26
27
28
I. QUALIFICATIONS
1. I am a Professor of Medicine in Residence at the University of California at San
Francisco, with a specialty in a General Internal Medicine. From 1995-1999, I was director of the
Adult Medical Clinics at San Francisco General Hospital and Trauma Center (SFGH) and from 1999-
2003 I was the Director of Clinical Operations for the Department of Medicine at SFGH. I was the
Chief of Diabetes Prevention & Control for the California Department of Public Health from 2008-
2013. I have served on the Advisory Board of the US National Diabetes Education Program, a
partnership of the National Institutes of Health, the Centers for Disease Control and Prevention, and
more than 200 public and private organizations.
2. As a primary care physician for 25 years, I have a practice in which about 40% of my
patients have Type 2 diabetes (DM2) and about 25% have pre-diabetes (preDM), many of whom I
have been caring for on an ongoing basis for more than 20 years.
3. I am also a scholar in the field of diabetes care, diabetes patient education, diabetes
prevention, diabetes disparities, and health literacy. I have published more than 180 peer-reviewed
articles on these topics, and have received numerous national awards for this work, including from
CDC, NIH, and the American Public Health Association. As a leader in the field of health literacy and
diabetes, I have contributed to Institute of Medicine (now known as the National Academy of
Sciences) reports on Health Literacy, authoring seminal studies on the relationship between limited
health literacy on diabetes incidence, diabetes knowledge, diabetes-related communication, blood
sugar control, diabetes complications, and other health outcomes. I am the UCSF site director for a
National Institutes of Health Center for Type 2 Diabetes Translational Research, a program whose
goal is to promote the development of scientific evidence that can be translated into practice and
policy for the prevention and control of DM2. I received 2013 Everett Rogers Lifetime Achievement
Award from the American Public Health Association and the 2016 James Irvine Leadership Award for
my work in diabetes and health communication. My current CV is attached as Exhibit A.
4. To prepare this report, I reviewed the public health science and clinical research
immediately relevant to the question of whether sugar-sweetened beverages (SSBs) contribute to
obesity, Type 2 diabetes (DM2) and tooth decay, focusing on research conducted in the last 20 years. I
›ø#ª ÌÊÔÎÛ*™Û,ÌÏÔÎÛ¤”› ‹±*´3ª4¨ ÎÍÛÌ ⁄8¥ªº ,ÓÒÓÌÒÔÍ –ø>ª Ì ±? ÈÍ
SCHILLINGER REPORTCASE NO. 3:15-cv-03415 EMC
2 n:\govlit\li2016\160121\01084178.docx
1
2
3
4
5
6
7
8
9
10
11
12
13
14
15
16
17
18
19
20
21
22
23
24
25
26
27
28
also reviewed and synthesized the clinical guidelines and position statements of major medical, dental,
nutrition, and diabetes-related professional associations, as well as those of federal health agencies and
entities, such as the Centers for Disease Control and Prevention and the US Dietary Guidelines.
Finally, I have harnessed my own (1) clinical experience as a primary care physician and general
internist caring for patients with, or at risk of, obesity, DM2 and tooth decay; (2) public health
expertise in diabetes prevention and control; (3) extensive body of research in DM2, including its
prevention, management and its complications; and (4) knowledge as an international expert in the
field of health literacy and its relation to DM2. A list of the documents that I consulted is attached as
Exhibit B, but because my opinions are drawn from my cumulative experience, this list cannot be
exhaustive.
5. I have not previously provided expert testimony in any court. I am being compensated
at a rate of $400 per hour for all of my substantive work in this case. My compensation does not
depend on the conclusions I reach.
II. SUMMARY OF OPINIONS
6. The following is a summary of my opinions in this report: (1) Obesity and DM2 have
severe and widespread public health consequences; (2) There is a clear scientific consensus that SSB
consumption contributes to obesity, DM2, and tooth decay; (3) There is likewise a consensus in the
medical, dental, and public health fields that people should reduce their consumption of SSBs to
address obesity, DM2, and tooth decay; (4) There is widespread health illiteracy that contributes to
SSB consumption because people are unaware of known SSB risks; and (5) Dr. Kahn’s credentials are
limited.
III. THE PUBLIC HEALTH CONSEQUENCES OF OBESITY AND DIABETES ARESEVERE ANDWIDESPREAD NATIONALLY AND IN SAN FRANCISCO
7. As a primary care physician and former Medical Director of a large clinical operation
that had more than 150,000 medical visits during my tenure as director, I have observed first-hand the
cumulative adverse health consequences of SSB consumption on the health of San Franciscans,
including the resultant explosion of obesity rates and its myriad medical consequences, as well as the
unremitting damage to people’s oral health in the form of tooth decay and tooth loss. I have also seen
›ø#ª ÌÊÔÎÛ*™Û,ÌÏÔÎÛ¤”› ‹±*´3ª4¨ ÎÍÛÌ ⁄8¥ªº ,ÓÒÓÌÒÔÍ –ø>ª Ï ±? ÈÍ

SCHILLINGER REPORTCASE NO. 3:15-cv-03415 EMC
3 n:\govlit\li2016\160121\01084178.docx
1
2
3
4
5
6
7
8
9
10
11
12
13
14
15
16
17
18
19
20
21
22
23
24
25
26
27
28
the ravages of DM2 in good people, often young people, who didn’t know any better, and consumed
SSBs—ravages that include amputations, kidney failure requiring lifelong dialysis, heart attacks,
strokes, blindness, and premature death. The explosion of obesity in the US has been well-
characterized, as has the problem of tooth decay and cavities, so in this section I will spend only a little
time describing these public health phenomena. Rather, I will focus on the somewhat less well-known
DM2 epidemic, a disease that has been insidiously and steadily advancing, to the point where now it is
encroaching on our children’s health, devastating families and communities, and infringing on our
nation’s economic well-being.
A. Prevalence and Consequences of Obesity
8. In 2011-2012 in the US, 16.9% of 2- to 19-year-olds and 34.9% of adults aged 20 years
or older were obese.1 More than two-thirds of adults were either overweight or obese, nearly 35%
were obese, and about 6% were extremely obese. The prevalence of extreme (class III) obesity varied
by race/Hispanic origin, with the highest prevalence among non-Hispanic black adults (12.1%)
compared with 5.6% in non-Hispanic white adults, 0.9% in non-Hispanic Asian adults, and 5.8% in
Hispanic adults.2
9. Obesity rates are high locally as well. A 2011 report measured obesity rates among 5th,
7th and 9th graders and found that 32% of San Francisco youth were overweight or obese.3 In San
Francisco, 46.4% of adults are obese or overweight, including 61.7% of Hispanics and 51.3% of
African Americans.4
10. Obesity has serious consequences for mortality rates. For those who are extremely
obese, death rates from heart disease, diabetes and cancer were nearly doubled compared to people
classified as normal weight, even after adjusting for confounders such as smoking. Extreme obesity is
1 C Ogden et al, Prevalence of Childhood and Adult Obesity in the Unites States, 2011-2012.JAMA. 2014 Feb 26;311(8):806-814.2 Id.3 S Babey et al, A Patchwork of Progress: Changes in Overweight and Obesity Among California5th, 7th, and 9th Graders, 2005-2010, UCLA Center for Health Research Policy and CaliforniaCenter for Public Health Advocacy, Nov. 20114 San Francisco Health Improvement Partnership. California Health Interview Survey (November2015) Retrieved from http://www.sfhip.org/modules.php?op=modload&name=NS-Indicator&file=indicator&iid=19192667
›ø#ª ÌÊÔÎÛ*™Û,ÌÏÔÎÛ¤”› ‹±*´3ª4¨ ÎÍÛÌ ⁄8¥ªº ,ÓÒÓÌÒÔÍ –ø>ª Î ±? ÈÍ

SCHILLINGER REPORTCASE NO. 3:15-cv-03415 EMC
4 n:\govlit\li2016\160121\01084178.docx
1
2
3
4
5
6
7
8
9
10
11
12
13
14
15
16
17
18
19
20
21
22
23
24
25
26
27
28
associated with substantially elevated rates of total mortality, with most of the excess deaths due to
heart disease, cancer, and diabetes, and major reductions in life expectancy compared with normal
weight.5 As one prominent study recently put it, “as a result of the substantial rise in the prevalence of
obesity and its life-shortening complications such as diabetes, life expectancy at birth and at older ages
could level off or even decline within the first half of this century.”6
11. Obesity also has an immense economic impact. Research published in 2010 into the
economic impact of obesity reveals that the annual medical (direct) costs are $161 billion. The indirect
costs related to absenteeism and lost productivity, disability, and premature mortality total over $66
billion.7
B. Prevalence and Consequences of Type 2 Diabetes
12. Today, 14% of US adults (nearly 1 in 7) have Type 2 diabetes mellitus (DM2). In US
minority or low-socioeconomic sub-groups, more than 1 in 5 have DM2.8 Among individuals with
diabetes, about 85% are obese.9 In addition, nearly 40% of US adults now have pre-diabetes (preDM),
a condition in which the fasting blood sugar level is abnormally elevated, but has not yet surpassed the
DM2 threshold.10 These individuals are at high risk of transitioning to DM2 over the next 5-10 years.
Thus, nearly one half of US adults are especially vulnerable to acquiring DM2 or suffering its
complications.
13. Most shocking of all is the recent observation that DM2, once known as “adult-onset
diabetes” or, more colloquially, “Grandma’s disease,” is affecting younger and younger people. In
5 C Kitahara et al, Association Between Class III Obesity (BMI of 40-59 kg/m2) and Mortality: APooled Analysis of 20 Prospective Students. PLoS Medicine. 2014 Jul 8;11(7):e1001673.6 S.J. Olshansky et al., A Potential Decline in Life Expectancy in the United States in the 21stCentury, N. Engl. J. Med. 2005; 352:1138-1145.7 Ross A Hammond: The economic impact of obesity in the United States 2010. Diabetes MetabSyndr Obes. 2010 Aug 30;3:285-295.8 Menke A et al, Prevalence of and Trends in Diabetes Among Adults in the United States, 1988-2012, JAMA 2015;314(10):1021-10299 Centers for Disease Control and Prevention. Prevalence of Overweight and Obesity Among Adultswith Diagnosed Diabetes—United States, 1988–1994 and 1999–2002. MMWR Morb Mortal WklyRep. 2004;53:1066-106810 Menke A et al, Prevalence of and Trends in Diabetes Among Adults in the United States, 1988-2012, JAMA 2015;314(10):1021-1029
›ø#ª ÌÊÔÎÛ*™Û,ÌÏÔÎÛ¤”› ‹±*´3ª4¨ ÎÍÛÌ ⁄8¥ªº ,ÓÒÓÌÒÔÍ –ø>ª Í ±? ÈÍ

SCHILLINGER REPORTCASE NO. 3:15-cv-03415 EMC
5 n:\govlit\li2016\160121\01084178.docx
1
2
3
4
5
6
7
8
9
10
11
12
13
14
15
16
17
18
19
20
21
22
23
24
25
26
27
28
fact, among minority subgroups, the average age at diagnosis is now below age 50. Twenty-five years
ago, diagnosing a child with DM2 was nearly unheard of; children with diabetes uniformly had Type 1
diabetes, an autoimmune disease also known as “juvenile onset diabetes”. Now, a large CDC study
reveals that approximately one third of all new cases of diabetes in US youth reflect DM2; among
minority and lower income youth, over 1/2 to 2/3 of new cases reflect DM2.11
14. Another recent study revealed that the prevalence of DM and preDM in US teenagers
dramatically increased from 9% in 1999 to 23% in in 2008.12. Comparing 2001 to 2009, cases of DM2
among youth ages 10-19 have increased by over 30.5%.13
15. The implications of this dramatic shift in DM2 among youth are devastating: these
youth will face a lifetime managing a complex disease, attempting to ward off dread complications
that can strike them at the prime of their lives, when they should be raising a family and contributing
to society as members of the US workforce. In addition, recent research definitively shows that DM2
in youth is much harder to control than in adults.14
16. The effects of DM2 on mortality are significant. For individuals diagnosed between
ages 20-60, they experience an average of 5 -7 years of life lost.15 In addition, DM2 and its common
complications—amputations, kidney failure, vision loss—have significant effects on quality of life. It
is not an understatement to say that now, in every doctor’s office in America, there is a largely
invisible war being waged against DM2. To place this war metaphor in perspective, we have
calculated, based on US war veteran’s data and CDC statistics, that in the 10-year war in Iraq and
Afghanistan, 1,572 US soldiers lost a limb in combat. In that same period of time, approximately
730,000 US residents (and over 70,000 Californians) lost a limb to DM2, a nearly 500-fold
11 The SEARCH Study. National Diabetes Fact Sheet 2011. Retrieved fromhttp://www.cdc.gov/diabetes/pubs/pdf/ndfs_2011.pdf12 May et al., Prevalence of Cardiovascular Disease Risk Factors Among US Adolescents, 1999-2008. Pediatrics. 2012;129(6):1035-1041.13 Dabalea et al., Prevalence of Type 1 and Type 2 Diabetes Among Children and Adolescents From2001 to 2009. JAMA. 2014;311(17):1778-1786.14 TODAY Study Group et al, A Clinical Trial to Maintain Glycemic Control in Youth with Type 2Diabetes. N Engl J of Med. 2012 Jun 13;366(24):2247-2256.15 EW Gregg et al., Trends in Lifetime Risk and Years of Life Lost Due to Diabetes in the USA,1985-2011: A Modelling Study. Lancet Diabetes Endocrinol. 2014 Nov;2(11):867-874.
›ø#ª ÌÊÔÎÛ*™Û,ÌÏÔÎÛ¤”› ‹±*´3ª4¨ ÎÍÛÌ ⁄8¥ªº ,ÓÒÓÌÒÔÍ –ø>ª È ±? ÈÍ
SCHILLINGER REPORTCASE NO. 3:15-cv-03415 EMC
6 n:\govlit\li2016\160121\01084178.docx
1
2
3
4
5
6
7
8
9
10
11
12
13
14
15
16
17
18
19
20
21
22
23
24
25
26
27
28
difference.16, 17, 18 DM2 also results in more frequent hospitalizations. A recent UCLA study found
that in California, nearly 1 in 3 patients hospitalized in acute care facilities have diabetes.19
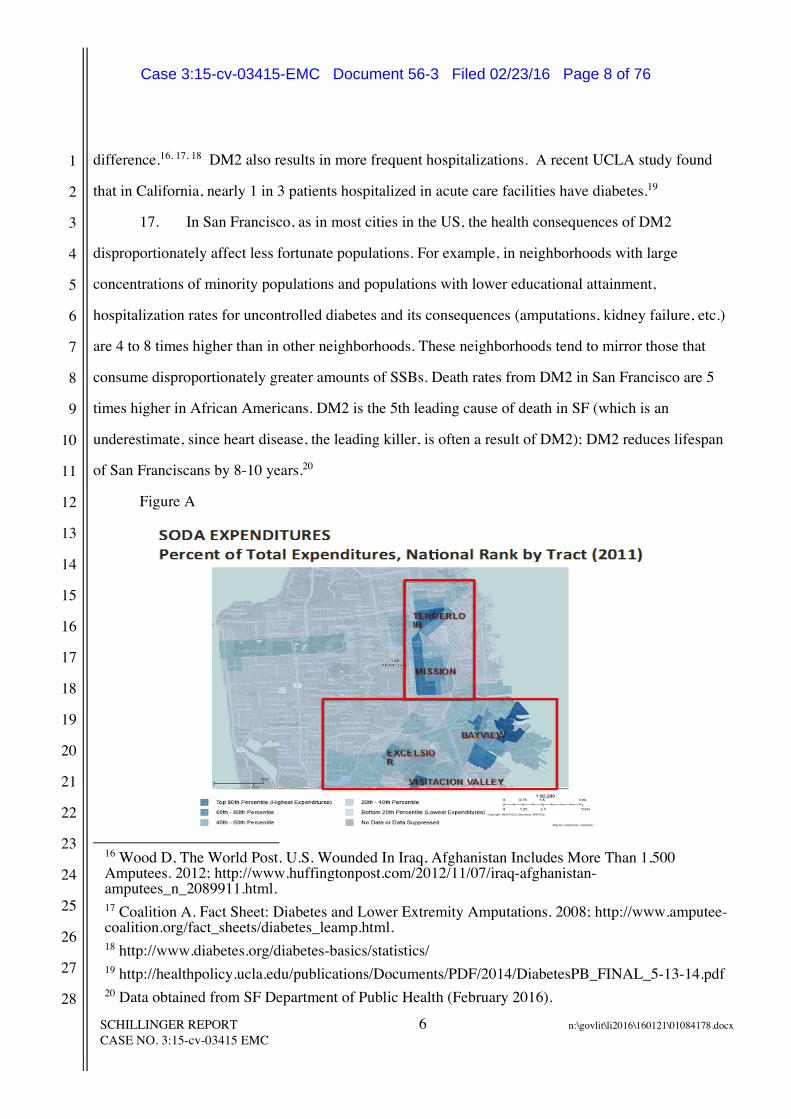
17. In San Francisco, as in most cities in the US, the health consequences of DM2
disproportionately affect less fortunate populations. For example, in neighborhoods with large
concentrations of minority populations and populations with lower educational attainment,
hospitalization rates for uncontrolled diabetes and its consequences (amputations, kidney failure, etc.)
are 4 to 8 times higher than in other neighborhoods. These neighborhoods tend to mirror those that
consume disproportionately greater amounts of SSBs. Death rates from DM2 in San Francisco are 5
times higher in African Americans. DM2 is the 5th leading cause of death in SF (which is an
underestimate, since heart disease, the leading killer, is often a result of DM2); DM2 reduces lifespan
of San Franciscans by 8-10 years.20
Figure A
16 Wood D, The World Post. U.S. Wounded In Iraq, Afghanistan Includes More Than 1,500Amputees. 2012; http://www.huffingtonpost.com/2012/11/07/iraq-afghanistan-amputees_n_2089911.html.17 Coalition A. Fact Sheet: Diabetes and Lower Extremity Amputations. 2008; http://www.amputee-coalition.org/fact_sheets/diabetes_leamp.html.18 http://www.diabetes.org/diabetes-basics/statistics/19 http://healthpolicy.ucla.edu/publications/Documents/PDF/2014/DiabetesPB_FINAL_5-13-14.pdf20 Data obtained from SF Department of Public Health (February 2016).
›ø#ª ÌÊÔÎÛ*™Û,ÌÏÔÎÛ¤”› ‹±*´3ª4¨ ÎÍÛÌ ⁄8¥ªº ,ÓÒÓÌÒÔÍ –ø>ª Ë ±? ÈÍ

SCHILLINGER REPORTCASE NO. 3:15-cv-03415 EMC
7 n:\govlit\li2016\160121\01084178.docx
1
2
3
4
5
6
7
8
9
10
11
12
13
14
15
16
17
18
19
20
21
22
23
24
25
26
27
28
Figure B
18. Aggregate data tends to obscure the qualitative experience of the burdens of DM2.
Authentic clinical narratives can help bring this qualitative experience to light; there is a long tradition
in clinical medicine of using narratives to enhance understanding and motivate changes that improve
patient outcomes. As such, attached as Exhibit C to this report are narratives describing three real
cases from my practice that demonstrate the burdens of DM2 in patients who were longtime SSB
consumers (and who were unaware of the hazards of SSB consumption until they had suffered its
consequences). These cases should be thought of archetypes of the interplay between the health
illiteracy so common in US society (see infra Section VI), the ubiquitous exposure to and intake of
SSBs, and the onset of the complications of DM2.
19. Like obesity, diabetes is a costly disease. In 2012, the American Diabetes Association
estimated that the total costs of diagnosed diabetes in the US rose to $245 billion in 2012, from $174
billion in 2007, a 41% increase over a five-year period.21 Of the $245 billion, $176 billion were from
direct medical costs and $69 billion from reduced productivity. People with diagnosed diabetes
incurred average medical expenditures of about $13,700 per year, of which about $7,900 was
21 American Diabetes Association. Economic Costs of Diabetes in the US in 2012. Diabetes Care.2013;36(4):1033-1046.
›ø#ª ÌÊÔÎÛ*™Û,ÌÏÔÎÛ¤”› ‹±*´3ª4¨ ÎÍÛÌ ⁄8¥ªº ,ÓÒÓÌÒÔÍ –ø>ª Á ±? ÈÍ
SCHILLINGER REPORTCASE NO. 3:15-cv-03415 EMC
8 n:\govlit\li2016\160121\01084178.docx
1
2
3
4
5
6
7
8
9
10
11
12
13
14
15
16
17
18
19
20
21
22
23
24
25
26
27
28
attributed to diabetes. People with diagnosed diabetes, on average, had medical expenditures
approximately 2.3 times higher than what expenditures would be in the absence of diabetes. For the
cost categories analyzed, care for people with diagnosed diabetes consumed more than 1 in 5 health
care dollars in the U.S., and more than half of that expenditure was directly attributable to diabetes.
20. A recent study in the American Heart Association journal found that SSBs are directly
related to 184,000 deaths per year worldwide, with over 25,000 deaths directly related to SSBs
occurring in the US per year. In the US (a high consumer of SSBs, ~1.3/day), among adults less than
45 years old, 9.6% of women’s deaths and 12.5% of men’s deaths were attributable to SSBs. Because
SSBs contribute to chronic diseases such as obesity and DM2, which have major impacts on
symptoms, disability and quality of life, these investigators also calculated the number of “disability-
adjusted life year” (DALYs), which are summary metrics that measure how many years of healthy life
are lost due to disability or death. In the US, a total of 831,754 DALYs are lost among adults, due just
to SSBs each year, representing over 1% of all US DALYs.22
IV. CONSUMING SSBs CONTRIBUTES TO OBESITY, DIABETES AND TOOTHDECAY
21. There is a clear scientific consensus that SSBs contribute to obesity and DM2 at a
minimum through a two-step process, whereby the effects of SSBs on DM2 act through an
intermediate step of excessive caloric intake and/or weight gain. Whether the effects of SSBs on DM2
are augmented by an additional single-step mechanism whereby fructose (a main ingredient of SSBs)
directly alters liver metabolism, blunts the satiety mechanisms in the brain (e.g. preventing the curbing
of appetite that normally accompanies a high calorie meal, as has been shown in numerous studies), or
fosters insulin resistance due to the high and rapid blood sugar spikes that accompany SSB
consumption, is the subject of continuing discussion. Dr. Kahn is referring to this additional one-step
process when he contends that it is debatable whether SSBs uniquely contribute to obesity and DM2.
But he does not identify any scientific debate, and there is none, over whether SSBs contribute to
obesity and DM2 through the two-step process.
22 Singh et al.; Global SSB-related morbidity and mortality, DOI:10.1161/CIRCULATIONAHA.114.010636 (2015).
›ø#ª ÌÊÔÎÛ*™Û,ÌÏÔÎÛ¤”› ‹±*´3ª4¨ ÎÍÛÌ ⁄8¥ªº ,ÓÒÓÌÒÔÍ –ø>ª Ô, ±? ÈÍ

SCHILLINGER REPORTCASE NO. 3:15-cv-03415 EMC
9 n:\govlit\li2016\160121\01084178.docx
1
2
3
4
5
6
7
8
9
10
11
12
13
14
15
16
17
18
19
20
21
22
23
24
25
26
27
28
22. The causal link between dietary sugars and tooth decay has long been firmly
established, and the basic biological mechanisms are well understood.23 In fact, the causal relationship
between sugar and tooth decay was definitively established as early as the 1930s, based on a
randomized controlled trial carried out in Sweden.24 We now understand that dietary sugars, including
in the form of SSBs, provide a substrate for oral bacteria that cause cavities to flourish and to generate
enamel-demineralizing acids.25 Modifying factors such as fluoride and dental hygiene would not be
needed if we tackled the single cause—added sugars.26 Quantitative analyses show a dose-response
relationship between the sugar or its monosaccharide intakes (such as fructose) and the progressive
lifelong development of cavities and resultant tooth loss. This results in a substantial dental health
burden throughout life.27 While processed starches have cavity-causing potential when accompanying
sucrose, human studies do not provide unequivocal data of their ability to cause cavities in the absence
of sugar.28
23. SSBs are the single largest source of added sugars in American diets. Moreover, the
link between SSB consumption and tooth decay is independently documented.29, 30 Finally,
23 US Department of Health and Human Services. Food and Drug Administration Select Committeeon GRAS Substances (SCOGS) Opinion: Sucrose. 2015<http://www.fda.gov/Food/IngredientsPackagingLabeling/GRAS/SCOGS/ucm260083.htm>; FDASugars Task Force Report -- III. Dental Caries. The Journal of Nutrition. 1986;116:S38-S43.24 Bo Krasse. The Vipeholm Dental Caries Study: Recollections and Reflections 30 Years Later.Journal of Dental Research. September 2001 80: 1785-1788.25 Marshall TA. Preventing dental caries associated with sugar-sweetened beverages. The Journal ofthe American Dental Association. 2013;144:1148-1152.26 Sheiham A and James WPT. Diet and Dental Caries: The Pivotal Role of Free SugarsReemphasized. Journal of Dental Research. October 2015 94: 1341-1347.27 Sheiham A and James WPT. A reappraisal of the quantitative relationship between sugar intakeand dental caries: the need for new criteria for developing goals for sugar intake. BMC public health.2014;14:863.28 Sheiham A and James WPT. Diet and Dental Caries: The Pivotal Role of Free SugarsReemphasized. Journal of Dental Research. October 2015 94: 1341-1347.29 S Park et al. Association of Sugar-Sweetened Beverages Intake during Infancy with Dental Cariesin 6-year olds. Clin Nutr Res 2015;4:9-17.30 E Bernabe et al, Sugar-sweetened beverages and dental caries in adults: A 4-year prospectivestudy. J. Dent. 2014;42:952-958.
›ø#ª ÌÊÔÎÛ*™Û,ÌÏÔÎÛ¤”› ‹±*´3ª4¨ ÎÍÛÌ ⁄8¥ªº ,ÓÒÓÌÒÔÍ –ø>ª ÔÔ ±? ÈÍ

SCHILLINGER REPORTCASE NO. 3:15-cv-03415 EMC
10 n:\govlit\li2016\160121\01084178.docx
1
2
3
4
5
6
7
8
9
10
11
12
13
14
15
16
17
18
19
20
21
22
23
24
25
26
27
28
community interventions to reduce exposure to and consumption of SSBs have shown dramatic
reductions in cavities,31 bolstering the causal link.
24. Tooth decay is the single most common chronic disease of childhood in the United
States and can lead to pain, infection, and tooth loss. In 2011–12, 58% of children ages 6–9 years had
dental caries in at least one primary or permanent tooth. In California, by the third grade, 71 percent of
students have experienced caries. Despite steady decreases in the incidence of cavities in San
Francisco over the past five years, tooth decay remains a prevalent local health problem that is
concentrated in the most disadvantaged neighborhoods. (See Figure C, below) In recent years, 35%
of San Francisco Unified School District (SFUSD) kindergartners had experienced caries and 22% had
untreated decay.32
Figure C33
25. The annual cost of tooth decay in the North America in 2010 was estimated to be $30
billion in lost productivity alone; an additional $120 billion was spent on treatment.34
31 G Maupomé et al., Dental Caries in American Indian Toddlers After a Community-BasedBeverage Intervention. Ethn Dis. 2010 Autumn;20(4):444-450.32 San Francisco Health Improvement Partnership, San Francisco Children’s Oral Health StrategicPlan: 2014-2017 (Nov. 2014). Available athttp://assets.thehcn.net/content/sites/sanfrancisco/Final_document_Nov_2014_20141126111021.pdf33 Id.34 S Listl et al., Global Economic Impact of Dental Diseases. J Dent Research. 2015Oct;94(10):1355-1361.
›ø#ª ÌÊÔÎÛ*™Û,ÌÏÔÎÛ¤”› ‹±*´3ª4¨ ÎÍÛÌ ⁄8¥ªº ,ÓÒÓÌÒÔÍ –ø>ª ÔÓ ±? ÈÍ

SCHILLINGER REPORTCASE NO. 3:15-cv-03415 EMC
11 n:\govlit\li2016\160121\01084178.docx
1
2
3
4
5
6
7
8
9
10
11
12
13
14
15
16
17
18
19
20
21
22
23
24
25
26
27
28
V. THERE IS A CONSENSUS IN THE MEDICAL, DENTAL, AND PUBLIC HEALTHESTABLISHMENTS THAT THE POPULATION SHOULD REDUCE SSBCONSUMPTION TO ADDRESS OBESITY, DIABETES, AND TOOTH DECAY
26. In response to the epidemic levels of obesity, DM2, and tooth decay in the US, an
overwhelming preponderance of medical, dental and public health professional entities and societies
now encourage the reduction or cessation of SSB consumption. These entities both encourage the
consistent counseling of patients regarding the hazards of SSBs and recommendations to reduce or
quit SSB consumption, as well as advocating for systems, policy, and environmental interventions to
reduce exposure to SSBs in schools, workplaces, neighborhoods, and communities.
27. A few of these organizations and their recommendations are discussed here. The
Centers for Disease Control published in 2010 a Guide to Strategies for Reducing the Consumption of
Sugar-Sweetened Beverages. In its 2016 Standards of Care, the American Diabetes Association (the
same entity for which Dr. Kahn previously served as Chief Science Officer until 2009) states: “People
with diabetes and those at risk should avoid SSBs in order to control weight and reduce their risk…”35
The American Diabetes Association’s “Diabetes Myths” webpage for consumers states: “The
American Diabetes Association recommends that people should avoid intake of sugar-sweetened
beverages to help prevent diabetes.36 The American Association of Diabetes Educators, in its 2015
document entitled, Healthy Eating: Priority Recommendation and Discussion Topics For Diabetes
Treatment and Prevention,37 includes in its first recommendation: “eliminate sugar-sweetened
beverages”. In the 2010 US Surgeon General’s Report, the Surgeon General recommends “Reducing
consumption of sodas and juices with added sugars” as a choice people can make to prevent obesity
and diabetes.38 In January 2016, The California Dental Association, in support of a bill to impose a
public health fee on SSBs, states that “CDA supports efforts to inform consumers of the scientifically
35 Diabetes Care Jan 2016, ADA Standards of Care36 http://www.diabetes.org/diabetes-basics/myths/. Last accessed February 2016.37 American Diabetes Association of Diabetes Educators. Healthy Eating. (April 29, 2015).Retrieved from https://www.diabeteseducator.org/docs/default-source/default-document-library/practice-synopsis-final_healthy-eating.pdf?sfvrsn=038 U.S. Department of Health and Human Services. The Surgeon General’s Vision for a Healthy andFit Nation. Rockville, MD: U.S. Department of Health and Human Services, Office of the SurgeonGeneral, January 2010, at 5.
›ø#ª ÌÊÔÎÛ*™Û,ÌÏÔÎÛ¤”› ‹±*´3ª4¨ ÎÍÛÌ ⁄8¥ªº ,ÓÒÓÌÒÔÍ –ø>ª ÔÌ ±? ÈÍ

SCHILLINGER REPORTCASE NO. 3:15-cv-03415 EMC
12 n:\govlit\li2016\160121\01084178.docx
1
2
3
4
5
6
7
8
9
10
11
12
13
14
15
16
17
18
19
20
21
22
23
24
25
26
27
28
proven health risks of SSB consumption... SSBs are the single largest source of added sugars in the
American diet and one of the most significant contributors to dental decay in children – the most
common chronic childhood disease, experienced by more than two-thirds of children in California.”39
The American Academy of Pediatrics recommends “minimiz[ing]” or “eliminat[ing]” consumption of
SSBs.40 The American Academy of Pediatric Dentistry encourages dentists to educate their patients to
increase public awareness of the negative effects of frequent SSB consumption on infant, child, and
adolescent nutrition, oral health, and general health including obesity.41
28. In addition, in my experience, it is now the standard of care that physicians and allied
health professionals, when counseling patients at risk of obesity or DM2, or when counseling parents
of children who are at risk of obesity or DM2, always carefully assess SSB consumption, and counsel
those who consume SSBs regularly to reduce or eliminate consumption due to the known hazards of
SSBs on weight gain and the acquisition of DM2. In the pediatric setting, 99% of pediatricians and
general practitioners provide counseling to either all children, or overweight or obese children,
regarding limiting or eliminating SSBs.42 In addition, CDC recommends screening and counseling
about sugar-sweetened beverage consumption as part of routine dental care.43
29. The FDA has proposed a rule that the nutrition facts panel display a percent daily
recommended value for added sugars to help people limit their consumption of added sugars to 10% of
daily calories or less, a limit recommended by the 2015 Dietary Guidelines Advisory Committee.
Numerous prominent public health organizations have endorsed this proposal, including the following:
Action for Healthy Food, American Diabetes Association (“The Association supports FDA’s proposal
to establish a DRV of 10 percent of total energy intake from added sugars””); American Heart
Association (“AHA is extremely pleased that the FDA has decided to expand its original proposal and
39 http://www.cda.org/advocacy/legislation/major-legislative-issues40 Barlow SE, Committee E. Expert committee recommendations regarding the prevention,assessment, and treatment of child and adolescent overweight and obesity: summary report.Pediatrics. 2007;120 Suppl 4:S164-92.41 http://www.aapd.org/assets/1/7/G_InfantOralHealthCare.pdf42 HR Wethington et al., Physician Practices Related to Use of BMI-For-Age and Counseling forChildhood Obesity Prevention: A Cross-Sectional Study. BMC Fam Pract. 2011 Aug 3;12:80.43 CDC, Guide to Strategies for Reducing the Consumption of SSBs, 2010, at 28.
›ø#ª ÌÊÔÎÛ*™Û,ÌÏÔÎÛ¤”› ‹±*´3ª4¨ ÎÍÛÌ ⁄8¥ªº ,ÓÒÓÌÒÔÍ –ø>ª ÔÏ ±? ÈÍ

SCHILLINGER REPORTCASE NO. 3:15-cv-03415 EMC
13 n:\govlit\li2016\160121\01084178.docx
1
2
3
4
5
6
7
8
9
10
11
12
13
14
15
16
17
18
19
20
21
22
23
24
25
26
27
28
require food manufacturers to declare the percent DV on the Nutrition Facts panel.)”; American
Institute for Cancer Research; The Prevention Institute (“the agency is appropriately relying upon
information from the 2015 Dietary Guidelines Advisory Committee report as well as the robust
science upon which that report is based regarding the health risks of added sugars. Ample scientific
research provides a basis for establishing a Daily Reference Value (DRV) for added sugars and for
requiring the declaration of a percent DV on labels to increase consumer understanding of added
sugars in foods.); the Center for Science in the Public Interest; the Center for Science and Democracy
at the Union of Concerned Scientists; Association of State Public Health Nutritionists; The Society for
Nutrition Education and Behavior; Association of State Public Health Nutritionists; the Nutrition
Policy Institute of theUniversity of California; and the Robert Wood Johnson Foundation. Societies
that were opposed to the new standards were nearly all non-scientific and non-health-related, but
commercial entities with financial conflicts of interest, and included the American Beverage
Assocation; National Confectioners Association; Corn Refiners Association; and Snack Food
Association.44
30. The 2015-2020 Dietary Guidelines for Americans (“2015-2020 USDG”), in accordance
with the advisory committee’s recommendation and the FDA’s percent daily value proposal,
recommends a limit of 10% of daily calories from added sugar. As the 2015-2020 USDG notes,
“Strong evidence from mostly prospective cohort studies but also randomized controlled trials has
shown that eating patterns that include lower intake of sources of added sugars are associated with
reduced risk of (cardiovascular disease) in adults, and moderate evidence indicates that these eating
patterns are associated with reduced risk of obesity, type 2 diabetes and some types of cancer in
adults.”
31. People who consume average amounts of SSBs exceed the 2015-2020 USDG’s added
sugar limit. Based on the 2015-2020 USDG, for a 12 year-old girl, whose daily calorie intake is 1600
calories, she should limit intake of added sugar to <160 calories. On average, 77% of girls aged 12-19
44 Comments to Docket No. FDA-2012-N-1210 are available at www.regulations.gov.
›ø#ª ÌÊÔÎÛ*™Û,ÌÏÔÎÛ¤”› ‹±*´3ª4¨ ÎÍÛÌ ⁄8¥ªº ,ÓÒÓÌÒÔÍ –ø>ª ÔÎ ±? ÈÍ

SCHILLINGER REPORTCASE NO. 3:15-cv-03415 EMC
14 n:\govlit\li2016\160121\01084178.docx
1
2
3
4
5
6
7
8
9
10
11
12
13
14
15
16
17
18
19
20
21
22
23
24
25
26
27
28
drink 1 or more SSBs per day. Among those who drink at least some SSBs, the average daily intake
for girls aged 12-19 is 286 calories of SSBs per day.45
32. Based on the 2015-2020 USDG, for a 20 year-old male, whose daily calorie intake is
2400 calories, he should limit intake of any added sugar to <240 calories. On average, 73% of males
aged 20-34 consume 1 or more sugary beverage daily. 20% of these young men consume more than
500 calories/day in SSBs. The average SSB intake for men in this age group is 338 calories per day46
33. Based on the 2015-2020 USDG, for a 51 year-old woman, whose daily calorie intake is
1600 calories, she should limit intake of added sugar to <160 calories. On average, 50% of adults 35 or
older consume 1 or more sugary drinks daily. On average, adults in this age group consume 236 SSB
calories daily, and 12% of them consume more than 500 calories/day in SSBs.47
34. Addressing consumption is critical. Decades of science and clinical experience
demonstrate that less than half of US adults, and fewer than a third of US children, engage in
recommended physical activity on a daily basis.48 And even this amount of exercise is insufficient to
expend the calories consumed with a SSB, as a 140 lb. person walking at 3 miles per hour for 30
minutes consumes approximately 95 calories.49 Further, there is no evidence that consumers’
consumption of high calorie SSBs prompt individuals to engage in compensatory exercise. In fact,
those who consume SSBs are also less likely to exercise.50, 51 Expending calories consumed from SSBs
through physical activity largely represents an illusory and unrealistic aspiration for the overwhelming
majority of Americans, and does not provide a practical remedy to the harms related to SSBs.
45 E. Han, L. Powell, Consumption Patterns of Sugar-Sweetened Beverages in the United States, JAcad Nutr Diet. 2013 January ; 113(1): 43–53.46 Id.47 Id.48 http://www.cdc.gov/physicalactivity/data/49 http://walking.about.com/library/cal/uccalc2.htm50 Schulze M et al. Sugar-Sweetened Beverages, Weight Gain, and Incidence of Type 2 Diabetes inYoung and Middle-Aged Women. JAMA 2004; 292(8):927-93451 Kvaavik E. et al. The stability of soft drinks intake from adolescence to adult age and theassociation between long-term consumption and lifestyle factors and body weight. Pub Health Nutr2005;8:149-57
›ø#ª ÌÊÔÎÛ*™Û,ÌÏÔÎÛ¤”› ‹±*´3ª4¨ ÎÍÛÌ ⁄8¥ªº ,ÓÒÓÌÒÔÍ –ø>ª ÔÍ ±? ÈÍ

SCHILLINGER REPORTCASE NO. 3:15-cv-03415 EMC
15 n:\govlit\li2016\160121\01084178.docx
1
2
3
4
5
6
7
8
9
10
11
12
13
14
15
16
17
18
19
20
21
22
23
24
25
26
27
28
35. A recent natural experiment involving the nation of Mexico provides support for the
notion that individuals who curb their SSB consumption will not simply replace this behavior with the
consumption of other liquid calories. After Mexico, which is the largest per capita consumer of SSBs
and the nation with the highest rate of DM2 in the world, levied a small tax on SSBs, purchases of
taxed beverages decreased by an average of 12%. Purchases of untaxed beverages increased by 4%,
mainly driven by an increase in purchases of bottled plain water.52 This study was unable to capture
Mexicans’ compensatory consumption of non-bottled sources, such as tap or well water (the primary
source of drinking water in Mexico). As such, these results significantly underestimate the degree to
which water replaced SSBs. The Mexico data indicate that, when people cut back on SSBs, to a
significant extent they do in fact choose less or non-caloric alternatives. This body of research in fact
demonstrates that, under the right circumstances, individual behavior regarding SSBs can change, and
that doing so can lead to salutary patterns of consumption that will reduce obesity, DM2 and tooth
decay.
36. Even if people replace some of their consumption of SSBs with caloric alternatives,
significant benefits are expected. A recent study modeled the number of cases of DM2 that would be
prevented in California were SSB consumption to decline by 20%.53 This model estimated that ~1/3
of the consumption of SSBs avoided would be replaced with water, 1/3 with diet drinks, and the final
1/3 with other caloric beverages, such as milk and juice. It found that SSB reductions would still be
associated with dramatic reductions in DM2 incidence, despite modest caloric compensation. In a
scenario in which Californians reduced SSB consumption by 20%, even if 1/3 of the calories avoided
by reducing SSBs were replaced by non-SSB sources, the study determined that over 22,000 new
cases of DM2 would be prevented over a 10 year, yielding a savings in healthcare costs over $1.6
billion USD. And nearly 55,000 new cases of DM2 over 10 years would be prevented in California
52 MA Colchero et al., Beverage Purchases from Stores in Mexico Under the Excise Tax on SugarSweetened Beverages: Observational Study. BMJ. 2016 Jan 6;352:h6704.53 TA Mekonnen et al., Health Benefits of Reducing Sugar-Sweetened Beverage Intake in High RiskPopulations of California: Results from the Cardiovascular Disease (CVD) Policy Model. PLoS One.2013 Dec 11;8(12):e81723.
›ø#ª ÌÊÔÎÛ*™Û,ÌÏÔÎÛ¤”› ‹±*´3ª4¨ ÎÍÛÌ ⁄8¥ªº ,ÓÒÓÌÒÔÍ –ø>ª ÔÈ ±? ÈÍ
SCHILLINGER REPORTCASE NO. 3:15-cv-03415 EMC
16 n:\govlit\li2016\160121\01084178.docx
1
2
3
4
5
6
7
8
9
10
11
12
13
14
15
16
17
18
19
20
21
22
23
24
25
26
27
28
were SSB consumption to decline by 50%, again assuming that 1/3 of calories would be substituted
from non-SSB sources. This would yield healthcare costs savings in California of over $4 billion.
VI. HEALTH ILLITERACY IN THE PUBLIC IS WIDESPREAD
37. In 2003, the US Department of Education carried out a large-scale assessment of adult
health literacy levels. They found that 36% of the US population has either “below basic” or only
“basic” health literacy, collectively known as health illiteracy.54 This means that this large group of
Americans is unprepared to make appropriate or informed decisions related to health, health behaviors
and healthcare on their own behalf, and for their children and dependents. Health illiteracy is a major
health problem in the US and has led the US Surgeon General, the Institute of Medicine and other
national bodies to call for urgent public health and civic action to better educate the public.55
38. At the San Francisco General Hospital Medicine Clinic, the clinical home of over 2300
patients with DM2 and about 2000 patients with pre-diabetes, my research group showed in a study
that nearly 50% of patients are health illiterate. Those who are most vulnerable to health illiteracy
include children and youth, minorities, and those with lower educational attainment.56
39. Health illiteracy is independently associated with obesity, DM2, and tooth decay.57, 58 A
recent study determined that health illiteracy is the strongest predictor of whether an individual
consumes SSBs.59 For example, those with the lowest level of health literacy consume about 240 more
calories from SSBs (about 10% of calories in adult males, the typical caloric value of a 16-ounce SSB)
54 National Center for Education Statistics. The Health Literacy of America’s Adults: Results fromthe 2003 National Assessment of Adult Literacy. (September 2006) Retrieved fromhttps://nces.ed.gov/naal/health.asp55 Office of the Surgeon Genearl (US, and Office of Disease Prevention and Health Promotion).Proceedings of the Surgeon General’s Workshop on Improving Health Literacy: September 7, 2006,National Institutes of Health, Bethesda, MD. (2006).56 National Center for Education Statistics. The Health Literacy of America’s Adults: Results fromthe 2003 National Assessment of Adult Literacy. (September 2006) Retrieved fromhttps://nces.ed.gov/naal/health.asp57 : Sudore R et al. Limited literacy in older people and disparities in health and healthcare access.Journal Am Ger Soc. 2006; 54: 770-76.58 AM Horowitz et al., Oral Health Literacy: A Pathway to Reducing Oral Health Disparities inMaryland. J Public Health Dent. 2012 Winter;72 Suppl 1:S26-30.59 J Zoellner et al., Health Literacy is Associated with Healthy Eating Index Scores and Sugar-Sweetened Beverage Intake: Findings from the Rural Lower Mississippi Delta. J Am Diet Assoc.2011 Jul;111(7):1012-1020.
›ø#ª ÌÊÔÎÛ*™Û,ÌÏÔÎÛ¤”› ‹±*´3ª4¨ ÎÍÛÌ ⁄8¥ªº ,ÓÒÓÌÒÔÍ –ø>ª ÔË ±? ÈÍ

›ø#ª ÌÊÔÎÛ*™Û,ÌÏÔÎÛ¤”› ‹±*´3ª4¨ ÎÍÛÌ ⁄8¥ªº ,ÓÒÓÌÒÔÍ –ø>ª ÔÁ ±? ÈÍ