EXPERIMENTS ON THE EFFECT OF SECULAR … MG/CA (CALCITE AND ARAGONITE SEAS) ON CALCAREOUS...
221
EXPERIMENTS ON THE EFFECT OF SECULAR VARIATION IN SEAWATER MG/CA (CALCITE AND ARAGONITE SEAS) ON CALCAREOUS BIOMINERALIZATION by Justin B. Ries A dissertation thesis submitted to the Johns Hopkins University in conformity with the requirements for the degree of Doctor of Philosophy Baltimore, Maryland March, 2005 © Justin B. Ries 2005 All rights reserved
Transcript of EXPERIMENTS ON THE EFFECT OF SECULAR … MG/CA (CALCITE AND ARAGONITE SEAS) ON CALCAREOUS...
EXPERIMENTS ON THE EFFECT OF SECULAR VARIATION IN SEAWATER MG/CA (CALCITE AND ARAGONITE SEAS) ON
CALCAREOUS BIOMINERALIZATION
by
Justin B. Ries
A dissertation thesis submitted to the Johns Hopkins University in conformity with the requirements for the degree of Doctor of Philosophy
Baltimore, Maryland March, 2005
© Justin B. Ries 2005 All rights reserved
ii
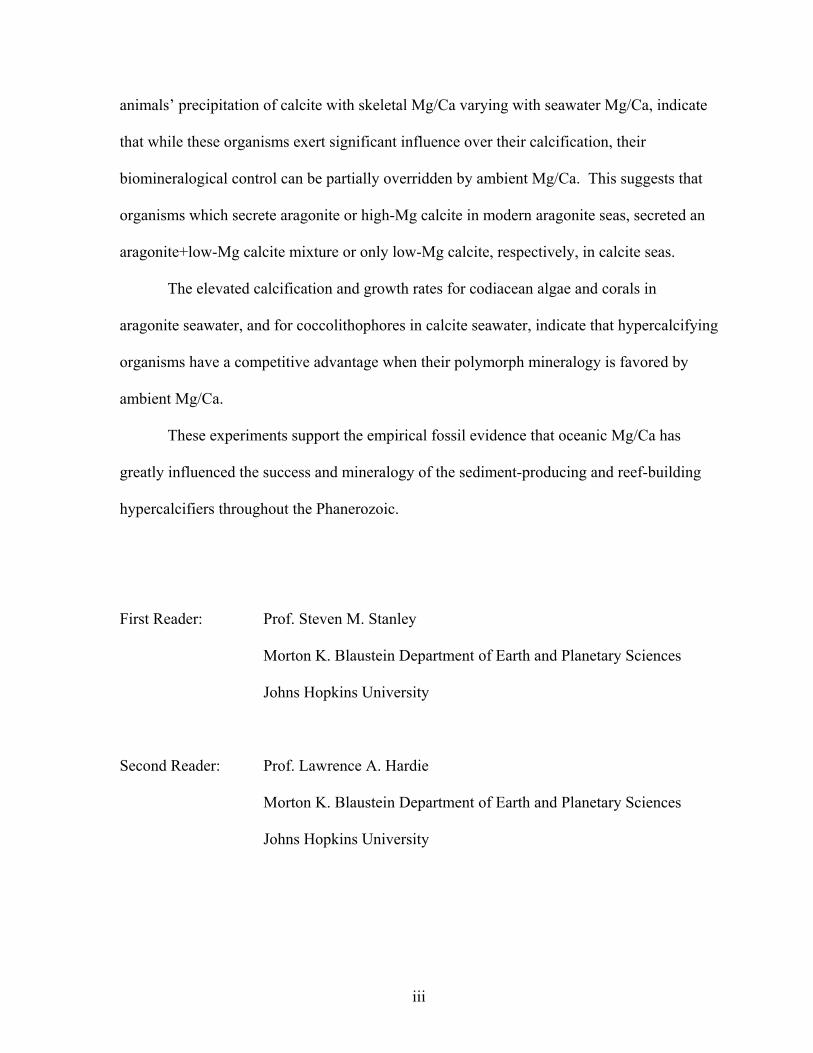
Abstract
The polymorph mineralogy of simple, hypercalcifying marine organisms has varied
in concert with abiotic CaCO3 precipitates throughout the Phanerozoic. This synchronicity is
caused by secular variation in the Mg/Ca ratio of seawater (mMg/Ca>2=aragonite+high-Mg
calcite; mMg/Ca<2=calcite), determined by the mixing rate of mid-ocean-ridge/large-
igneous-province hydrothermal brines and river water, driven primarily by the rate of ocean
crust production.
Here, I present experiments evaluating the effect of seawater Mg/Ca on the
biomineralization and growth of extant representatives of geologically significant calcifying
taxa which were subjected to the fluctuations in oceanic Mg/Ca responsible for the aragonite
and calcite seas of the Phanerozoic. Sediment-producing codiacean algae (aragonite) and
coccolithophores (low-high Mg-calcite); reef-building scleractinian corals (aragonite) and
coralline algae (high Mg-calcite); and reef-dwelling animals (high Mg-calcite) were grown in
artificial seawaters formulated over the range of mMg/Ca ratios (~1.0–5.2) which occurred
throughout these taxa’s history.
Codiacean algae and scleractinian corals exhibited higher rates of calcification and
growth in seawater favoring their aragonitic mineralogy (mMg/Ca>2), producing a
significant portion of their CaCO3 as calcite in the calcite seawater (mMg/Ca<2).
Coccolithophores showed higher calcification and growth rates, producing low-Mg calcite in
the calcite seawater. The coralline algae and reef-dwelling animals also varied their skeletal
Mg/Ca with seawater Mg/Ca.
The codiacean algae’s and scleractinian corals’ precipitation of both aragonite and
calcite in calcite seawater and the coccolithophores’, coralline algae’s and reef-dwelling
iii
animals’ precipitation of calcite with skeletal Mg/Ca varying with seawater Mg/Ca, indicate
that while these organisms exert significant influence over their calcification, their
biomineralogical control can be partially overridden by ambient Mg/Ca. This suggests that
organisms which secrete aragonite or high-Mg calcite in modern aragonite seas, secreted an
aragonite+low-Mg calcite mixture or only low-Mg calcite, respectively, in calcite seas.
The elevated calcification and growth rates for codiacean algae and corals in
aragonite seawater, and for coccolithophores in calcite seawater, indicate that hypercalcifying
organisms have a competitive advantage when their polymorph mineralogy is favored by
ambient Mg/Ca.
These experiments support the empirical fossil evidence that oceanic Mg/Ca has
greatly influenced the success and mineralogy of the sediment-producing and reef-building
hypercalcifiers throughout the Phanerozoic.
First Reader: Prof. Steven M. Stanley
Morton K. Blaustein Department of Earth and Planetary Sciences
Johns Hopkins University
Second Reader: Prof. Lawrence A. Hardie
Morton K. Blaustein Department of Earth and Planetary Sciences
Johns Hopkins University

iv
Acknowledgements
I thank my advisor, Steven Stanley, for providing guidance and support throughout
my graduate studies at Johns Hopkins. His creativity and enthusiasm for geology, and for
science in general, was both encouraging and inspirational. It has been a privilege working
with him. I thank Lawrence Hardie for teaching me the importance of scientific
experimentation, and for making sure I always kept my head down and eye on the ball. His
model of secular variation in seawater chemistry was, of course, the impetus for all of this. I
thank Matt Powell, Kenneth Livi, Clinton Conrad, Hope Jahren, Mark Koontz, Gary
Ostrander, Ron West, Steve Cairns, Tim Lowenstein, Roger Thomas, Jarek Stolarski, and the
EPS administration for their various indispensable contributions.
I thank my parents, Janet and Wayne Ries, for instilling in me the fascination with
nature which drives me as a scientist. I continually draw from the encouragement they have
offered throughout my life. I thank my grandfathers, John Polek and Edgar Ries, for
teaching me to always persevere. I thank my brother, Kenneth Ries, and sister, Lydia Ries,
for their always-insightful discourse on scientific subjects, and for their kindred perspectives.
Finally, I thank my wife, Amy, for her unwavering love and support throughout this whole
endeavor, for her profound contributions to the dissertation, itself, and for the many hours
she spent with me in the field, or, as it were, the sea.
Financial support for this research was provided by National Science Foundation
grants EAR-0447101 and EAR-0202849, Petroleum Research Fund grant 38468-AC2, The
David Elliot Fund, The Glassman Fund, The J. Brien Key Fund, The Howard Hughes
Medical Institute, and Sigma Xi.
v
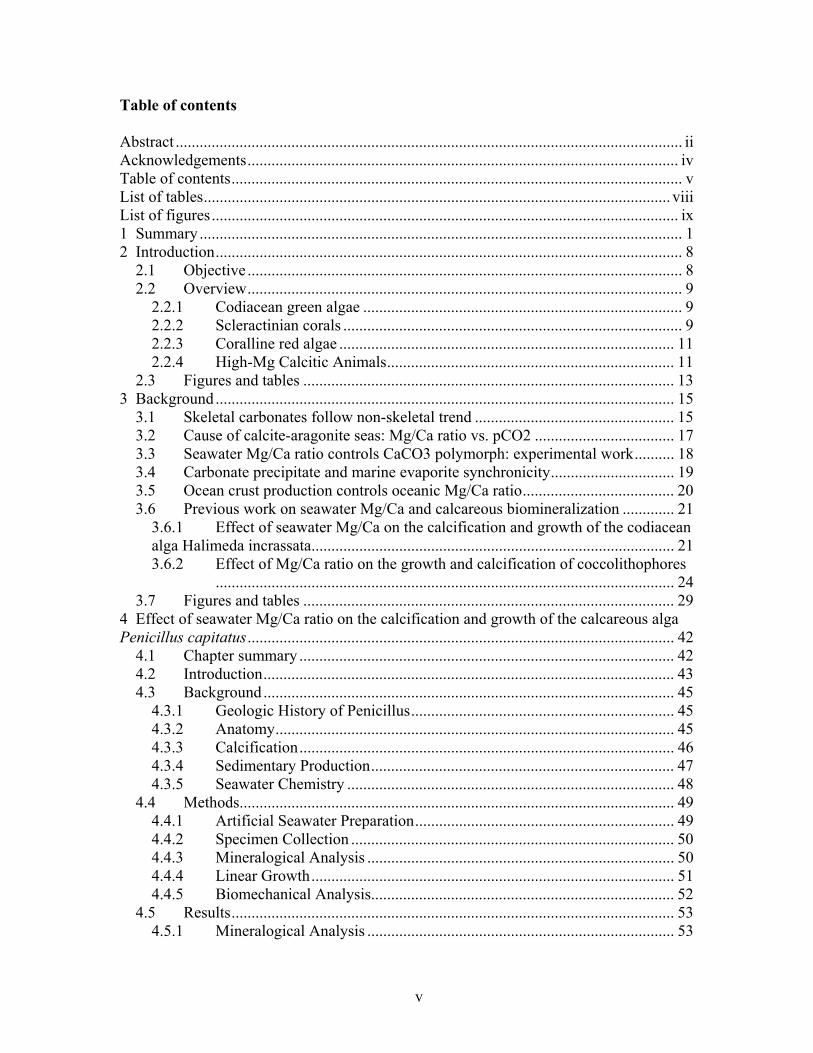
Table of contents
Abstract ............................................................................................................................... ii Acknowledgements............................................................................................................ iv Table of contents................................................................................................................. v List of tables..................................................................................................................... viii List of figures..................................................................................................................... ix 1 Summary ......................................................................................................................... 1 2 Introduction..................................................................................................................... 8
2.1 Objective ............................................................................................................. 8 2.2 Overview............................................................................................................. 9
2.2.1 Codiacean green algae ................................................................................ 9 2.2.2 Scleractinian corals ..................................................................................... 9 2.2.3 Coralline red algae .................................................................................... 11 2.2.4 High-Mg Calcitic Animals........................................................................ 11
2.3 Figures and tables ............................................................................................. 13 3 Background................................................................................................................... 15
3.1 Skeletal carbonates follow non-skeletal trend .................................................. 15 3.2 Cause of calcite-aragonite seas: Mg/Ca ratio vs. pCO2 ................................... 17 3.3 Seawater Mg/Ca ratio controls CaCO3 polymorph: experimental work.......... 18 3.4 Carbonate precipitate and marine evaporite synchronicity............................... 19 3.5 Ocean crust production controls oceanic Mg/Ca ratio...................................... 20 3.6 Previous work on seawater Mg/Ca and calcareous biomineralization ............. 21
3.6.1 Effect of seawater Mg/Ca on the calcification and growth of the codiacean alga Halimeda incrassata........................................................................................... 21 3.6.2 Effect of Mg/Ca ratio on the growth and calcification of coccolithophores ................................................................................................................... 24
3.7 Figures and tables ............................................................................................. 29 4 Effect of seawater Mg/Ca ratio on the calcification and growth of the calcareous algaPenicillus capitatus........................................................................................................... 42
4.1 Chapter summary .............................................................................................. 42 4.2 Introduction....................................................................................................... 43 4.3 Background....................................................................................................... 45
4.3.1 Geologic History of Penicillus.................................................................. 45 4.3.2 Anatomy.................................................................................................... 45 4.3.3 Calcification.............................................................................................. 46 4.3.4 Sedimentary Production............................................................................ 47 4.3.5 Seawater Chemistry .................................................................................. 48
4.4 Methods............................................................................................................. 49 4.4.1 Artificial Seawater Preparation................................................................. 49 4.4.2 Specimen Collection ................................................................................. 50 4.4.3 Mineralogical Analysis ............................................................................. 50 4.4.4 Linear Growth........................................................................................... 51 4.4.5 Biomechanical Analysis............................................................................ 52
4.5 Results............................................................................................................... 53 4.5.1 Mineralogical Analysis ............................................................................. 53
vi
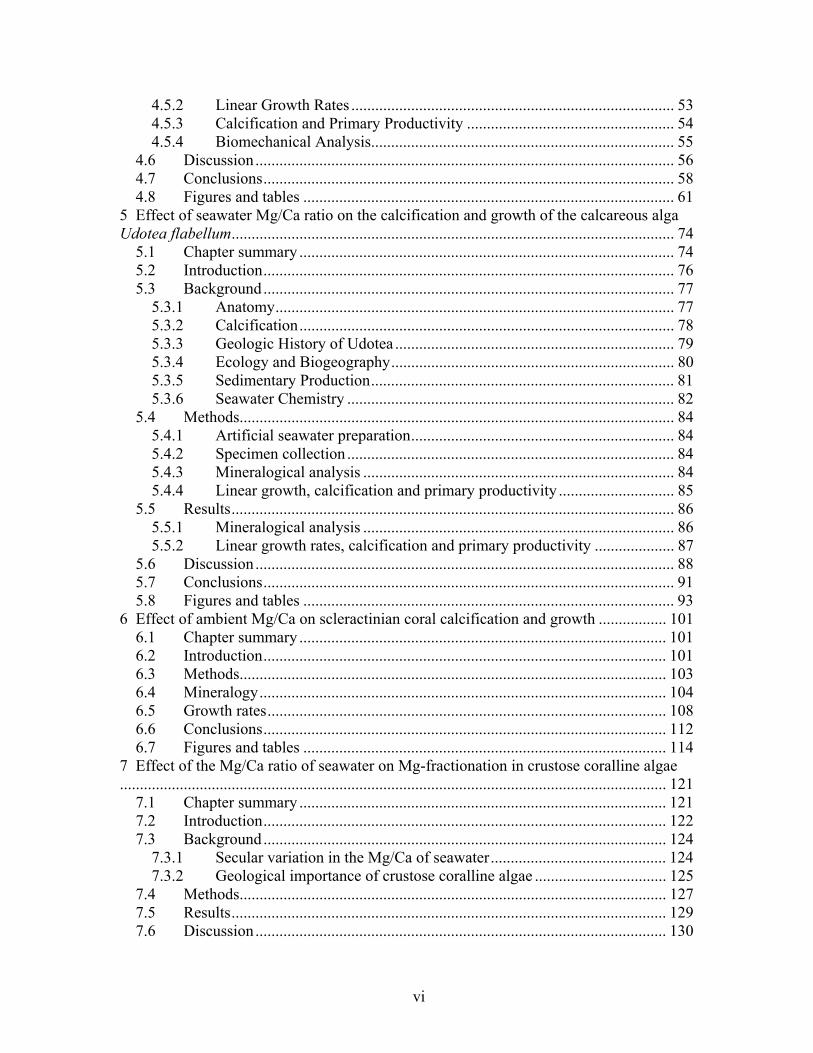
4.5.2 Linear Growth Rates ................................................................................. 53 4.5.3 Calcification and Primary Productivity .................................................... 54 4.5.4 Biomechanical Analysis............................................................................ 55
4.6 Discussion......................................................................................................... 56 4.7 Conclusions....................................................................................................... 58 4.8 Figures and tables ............................................................................................. 61
5 Effect of seawater Mg/Ca ratio on the calcification and growth of the calcareous alga Udotea flabellum............................................................................................................... 74
5.1 Chapter summary .............................................................................................. 74 5.2 Introduction....................................................................................................... 76 5.3 Background....................................................................................................... 77
5.3.1 Anatomy.................................................................................................... 77 5.3.2 Calcification.............................................................................................. 78 5.3.3 Geologic History of Udotea ...................................................................... 79 5.3.4 Ecology and Biogeography....................................................................... 80 5.3.5 Sedimentary Production............................................................................ 81 5.3.6 Seawater Chemistry .................................................................................. 82
5.4 Methods............................................................................................................. 84 5.4.1 Artificial seawater preparation.................................................................. 84 5.4.2 Specimen collection .................................................................................. 84 5.4.3 Mineralogical analysis .............................................................................. 84 5.4.4 Linear growth, calcification and primary productivity ............................. 85
5.5 Results............................................................................................................... 86 5.5.1 Mineralogical analysis .............................................................................. 86 5.5.2 Linear growth rates, calcification and primary productivity .................... 87
5.6 Discussion......................................................................................................... 88 5.7 Conclusions....................................................................................................... 91 5.8 Figures and tables ............................................................................................. 93
6 Effect of ambient Mg/Ca on scleractinian coral calcification and growth ................. 101 6.1 Chapter summary ............................................................................................ 101 6.2 Introduction..................................................................................................... 101 6.3 Methods........................................................................................................... 103 6.4 Mineralogy...................................................................................................... 104 6.5 Growth rates.................................................................................................... 108 6.6 Conclusions..................................................................................................... 112 6.7 Figures and tables ........................................................................................... 114
7 Effect of the Mg/Ca ratio of seawater on Mg-fractionation in crustose coralline algae ......................................................................................................................................... 121
7.1 Chapter summary ............................................................................................ 121 7.2 Introduction..................................................................................................... 122 7.3 Background..................................................................................................... 124
7.3.1 Secular variation in the Mg/Ca of seawater............................................ 124 7.3.2 Geological importance of crustose coralline algae ................................. 125
7.4 Methods........................................................................................................... 127 7.5 Results............................................................................................................. 129 7.6 Discussion....................................................................................................... 130
vii
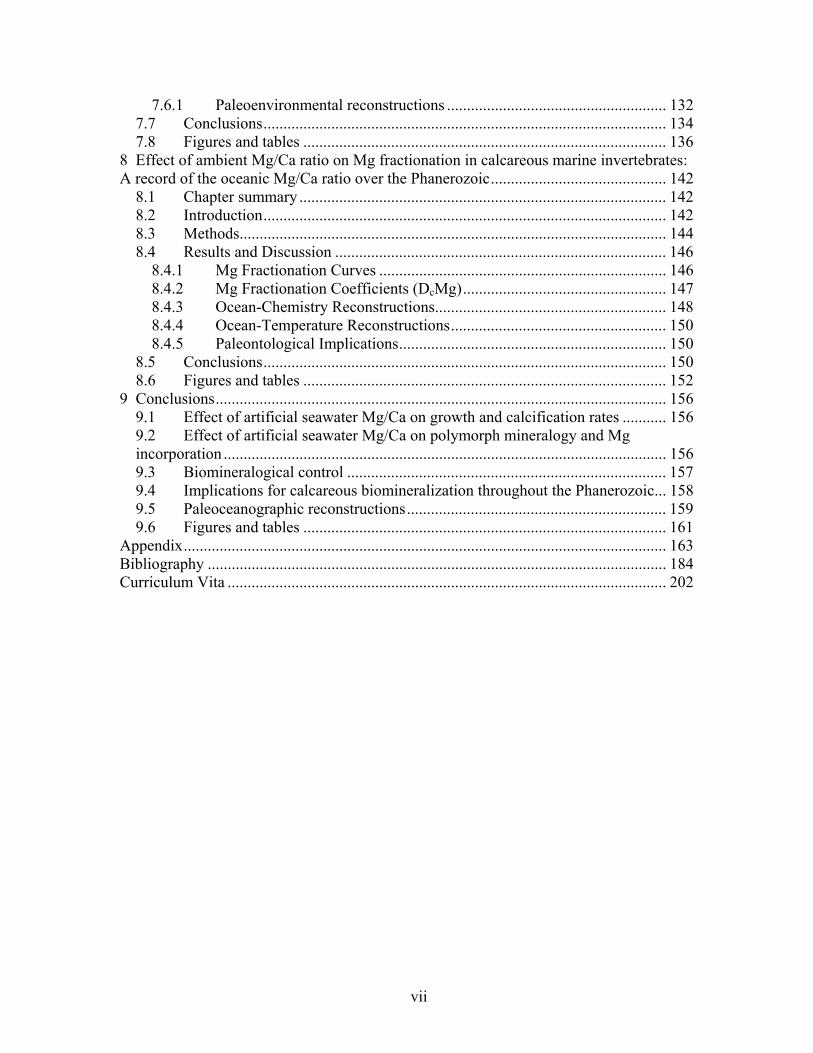
7.6.1 Paleoenvironmental reconstructions ....................................................... 132 7.7 Conclusions..................................................................................................... 134 7.8 Figures and tables ........................................................................................... 136
8 Effect of ambient Mg/Ca ratio on Mg fractionation in calcareous marine invertebrates: A record of the oceanic Mg/Ca ratio over the Phanerozoic............................................ 142
8.1 Chapter summary ............................................................................................ 142 8.2 Introduction..................................................................................................... 142 8.3 Methods........................................................................................................... 144 8.4 Results and Discussion ................................................................................... 146
8.4.1 Mg Fractionation Curves ........................................................................ 146 8.4.2 Mg Fractionation Coefficients (DcMg)................................................... 147 8.4.3 Ocean-Chemistry Reconstructions.......................................................... 148 8.4.4 Ocean-Temperature Reconstructions...................................................... 150 8.4.5 Paleontological Implications................................................................... 150
8.5 Conclusions..................................................................................................... 150 8.6 Figures and tables ........................................................................................... 152
9 Conclusions................................................................................................................. 1569.1 Effect of artificial seawater Mg/Ca on growth and calcification rates ........... 156 9.2 Effect of artificial seawater Mg/Ca on polymorph mineralogy and Mg incorporation ............................................................................................................... 1569.3 Biomineralogical control ................................................................................ 157 9.4 Implications for calcareous biomineralization throughout the Phanerozoic... 158 9.5 Paleoceanographic reconstructions................................................................. 159 9.6 Figures and tables ........................................................................................... 161
Appendix......................................................................................................................... 163 Bibliography ................................................................................................................... 184Curriculum Vita .............................................................................................................. 202

viii
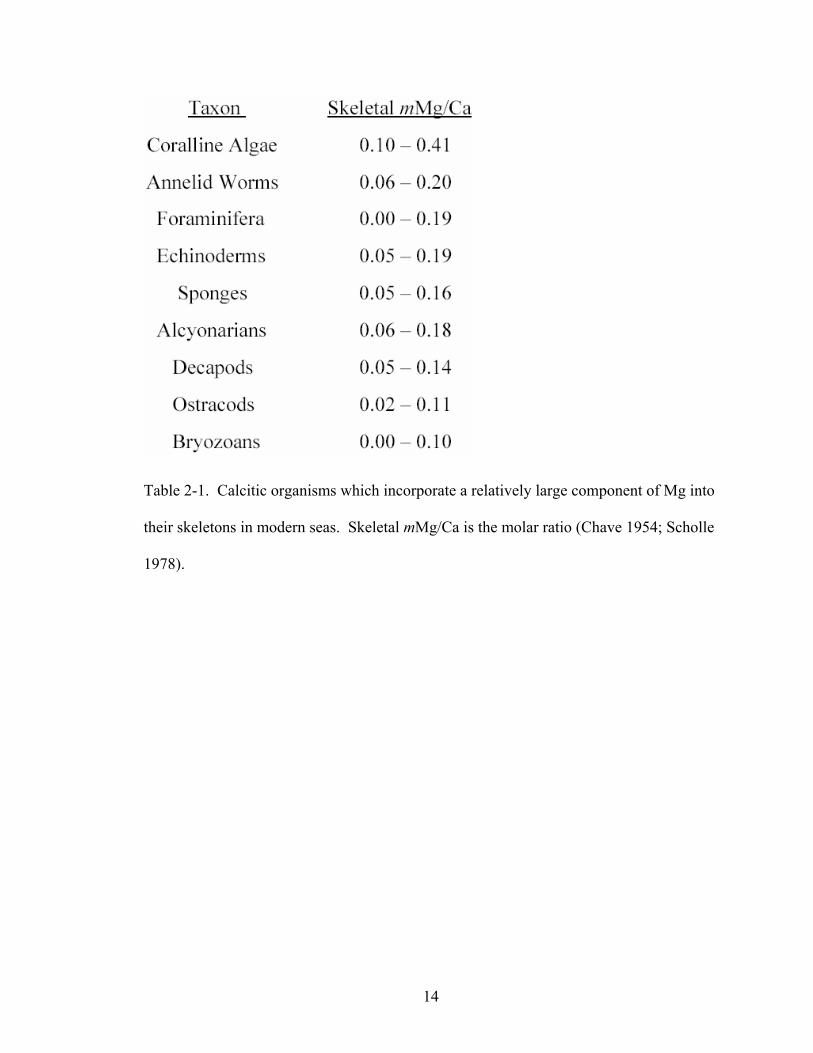
List of tables Table 2-1. Calcitic organisms which incorporate a relatively large component of Mg into
their skeletons in modern seas. Skeletal mMg/Ca is the molar ratio (Chave 1954; Scholle 1978). ........................................................................................................... 14
Table 4-1. Summary of mineralogy, linear growth, calcification, primary production, and thallus stiffness for Penicillus raised in the three seawater treatments. The latter four variables significantly (p < 0.01) decrease with reductions in ambient Mg/Ca, ultimately yielding the lowest values in the artificial seawater which supports calcite nucleation (molar Mg/Ca ~ 1.0). ................................................................................................ 72
Table 4-2. Linear regressions and statistics used to calculate stiffnesses of nine Penicillusthalli grown in the three seawater treatments. Stiffness decreases significantly (p < 0.001) with reductions in ambient Mg/Ca. ............................................................... 73
Table 5-1. Summary of mineralogy, linear growth, calcification and primary production for Udotea algae raised in the three artificial seawater treatments. Significantly, each of these variables decreases with reduced ambient Mg/Ca, ultimately yielding the lowest values in the artificial seawater which favors the nucleation of calcite over aragonite (molar Mg/Ca ~ 1.0). .............................................................................................. 100
Table 8-1. Algorithms relating Mg/CaSW, Mg/CaC, and seawater temperature for biotically and abiotically precipitated calcite.......................................................................... 155

ix
List of figures
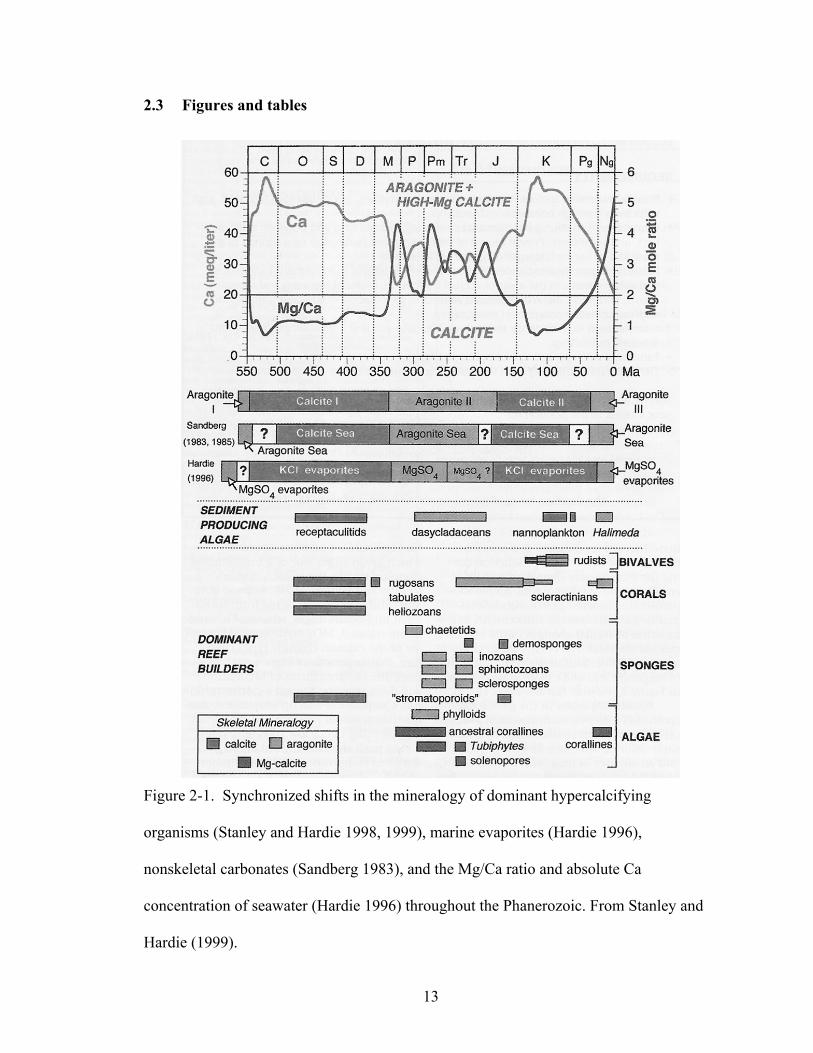
Figure 2-1. Synchronized shifts in the mineralogy of dominant hypercalcifying organisms (Stanley and Hardie 1998, 1999), marine evaporites (Hardie 1996), nonskeletal carbonates (Sandberg 1983), and the Mg/Ca ratio and absolute Ca concentration of seawater (Hardie 1996) throughout the Phanerozoic. From Stanley and Hardie (1999).................................................................................................................................... 13
Figure 3-1. Experimentally determined nucleation fields of CaCO3 polymorphs, as a function of the ionic strength and Mg/Ca mole ratio of seawater (temperature = 28º C, pressure = 1 atm). Black star represents values of modern seawater (SW). From Stanley and Hardie (1999). .................................................................................................... 29
Figure 3-2. Effect of changes in the rate of ocean crust production on global sea level, the flux of MOR hydrothermal brine, and the chemistry of seawater as predicted by Spencer and Hardie (1990) and Hardie (1996). A, high rate of ocean crust production; B, low rate of ocean crust production. Dark arrows are MOR brine paths; gray arrows are directions of seafloor spreading (thickness of arrows is proportional to magnitude of process; not to scale). From Stanley and Hardie (1999). ......................................... 30
Figure 3-3. Molar Mg/Ca ratios derived from fluid inclusions in ancient halite crystals. The fluid inclusion data confirm the historical oceanic Mg/Ca values predicted by Hardie’s (1996) mid-ocean ridge hydrothermal brine/river water flux model. From Lowenstein et al. (2001). .................................................................................................................. 31
Figure 3-4. Calcification for the H. incrassata algae over their first seven days of growth in the boundary (molar Mg/Ca = 2.5; white squares) and aragonite + high-Mg calcite (molar Mg/Ca = 5.2; black squares) artificial seawaters. Average calcification rates were derived from linear regressions fit to the time series using the least squares method. The solid black curve (y = 1.225x – 1.725, R2 = 0.98, SE = 0.086) indicates significantly (p < 0.01) higher rates of calcification in the aragonite + high-Mg artificial seawater. The broken black curve (y = 0.375x - 0.584, R2 =0.94, SE = 0.043) indicates significantly (p < 0.01) lower rates of calcification in the boundary artificial seawater.Algae grown in the calcite nucleation field (molar Mg/Ca = 1.0) failed to exhibit any measurable calcification. From Stanley et al. (in preparation). ............................... 32
Figure 3-5. Primary production for the H. incrassata algae over their first seven days of growth in the boundary (molar Mg/Ca = 2.5; white squares) and aragonite + high-Mg calcite (molar Mg/Ca = 5.2; black squares) artificial seawaters. Average primary production rates were derived from linear regressions fit to the time series using the least squares method. The solid black curve (y = 0.339x – 0.150, R2 = 0.99, SE = 0.006) indicates significantly (p < 0.01) higher rates of primary production in the aragonite + high-Mg artificial seawater. Broken black curve (y = 0.135x - 0.139, R2 = 0.96, SE = 0.012) indicates significantly (p < 0.01) lower rates of primary production in the boundary artificial seawater. Algae grown in the calcite nucleation field (molar Mg/Ca ~ 1.0) failed to exhibit any measurable primary production. From Stanley et al. (in preparation). .............................................................................................................. 33
Figure 3-6. Linear growth rates for H. incrassata algae grown in the three artificial seawater nucleation fields. Algae grown in the boundary (molar Mg/Ca = 2.5) and aragonite + high-Mg calcite (molar Mg/Ca = 5.2) nucleation fields exhibited respectively increasing rates of growth ± SE (0.24 ± 0.05 mm/d, 0.97 ± 0.09 mm/d). Algae grown in the calcite
x
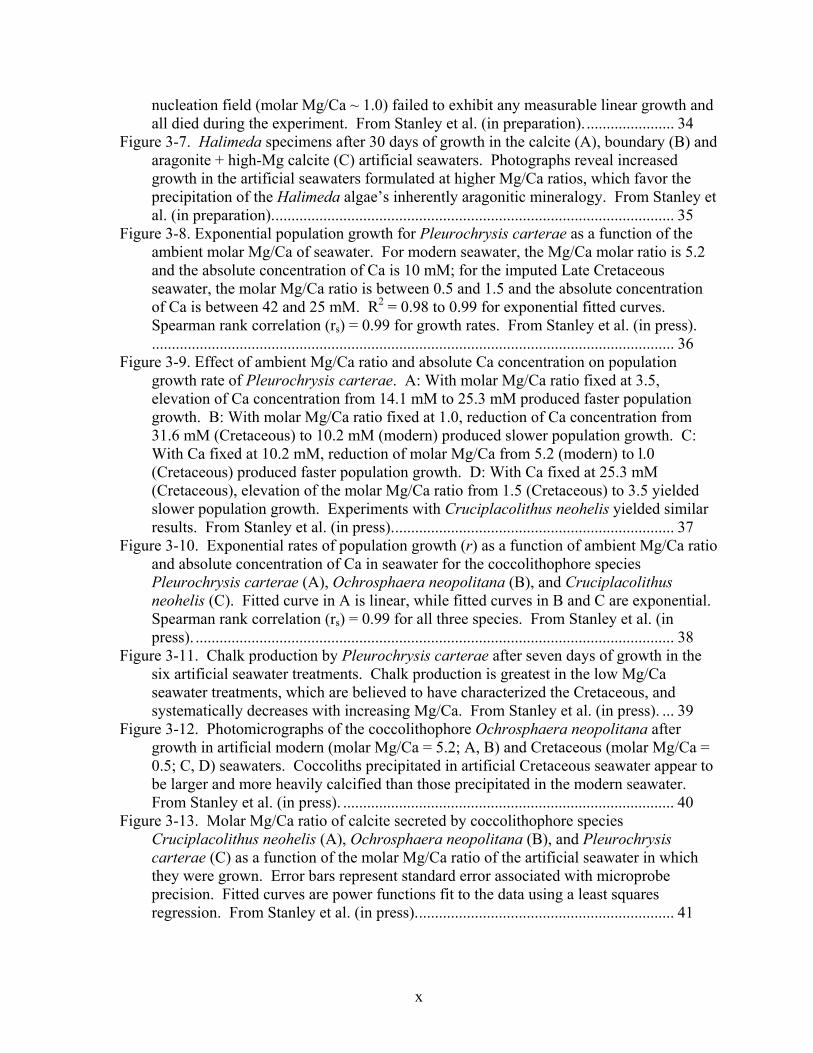
nucleation field (molar Mg/Ca ~ 1.0) failed to exhibit any measurable linear growth and all died during the experiment. From Stanley et al. (in preparation). ...................... 34
Figure 3-7. Halimeda specimens after 30 days of growth in the calcite (A), boundary (B) and aragonite + high-Mg calcite (C) artificial seawaters. Photographs reveal increased growth in the artificial seawaters formulated at higher Mg/Ca ratios, which favor the precipitation of the Halimeda algae’s inherently aragonitic mineralogy. From Stanley et al. (in preparation)..................................................................................................... 35
Figure 3-8. Exponential population growth for Pleurochrysis carterae as a function of the ambient molar Mg/Ca of seawater. For modern seawater, the Mg/Ca molar ratio is 5.2 and the absolute concentration of Ca is 10 mM; for the imputed Late Cretaceous seawater, the molar Mg/Ca ratio is between 0.5 and 1.5 and the absolute concentration of Ca is between 42 and 25 mM. R2 = 0.98 to 0.99 for exponential fitted curves.Spearman rank correlation (rs) = 0.99 for growth rates. From Stanley et al. (in press).................................................................................................................................... 36
Figure 3-9. Effect of ambient Mg/Ca ratio and absolute Ca concentration on population growth rate of Pleurochrysis carterae. A: With molar Mg/Ca ratio fixed at 3.5, elevation of Ca concentration from 14.1 mM to 25.3 mM produced faster population growth. B: With molar Mg/Ca ratio fixed at 1.0, reduction of Ca concentration from 31.6 mM (Cretaceous) to 10.2 mM (modern) produced slower population growth. C: With Ca fixed at 10.2 mM, reduction of molar Mg/Ca from 5.2 (modern) to l.0 (Cretaceous) produced faster population growth. D: With Ca fixed at 25.3 mM (Cretaceous), elevation of the molar Mg/Ca ratio from 1.5 (Cretaceous) to 3.5 yielded slower population growth. Experiments with Cruciplacolithus neohelis yielded similar results. From Stanley et al. (in press)....................................................................... 37
Figure 3-10. Exponential rates of population growth (r) as a function of ambient Mg/Ca ratio and absolute concentration of Ca in seawater for the coccolithophore species Pleurochrysis carterae (A), Ochrosphaera neopolitana (B), and Cruciplacolithus neohelis (C). Fitted curve in A is linear, while fitted curves in B and C are exponential. Spearman rank correlation (rs) = 0.99 for all three species. From Stanley et al. (in press). ........................................................................................................................ 38
Figure 3-11. Chalk production by Pleurochrysis carterae after seven days of growth in the six artificial seawater treatments. Chalk production is greatest in the low Mg/Ca seawater treatments, which are believed to have characterized the Cretaceous, and systematically decreases with increasing Mg/Ca. From Stanley et al. (in press). ... 39
Figure 3-12. Photomicrographs of the coccolithophore Ochrosphaera neopolitana after growth in artificial modern (molar Mg/Ca = 5.2; A, B) and Cretaceous (molar Mg/Ca = 0.5; C, D) seawaters. Coccoliths precipitated in artificial Cretaceous seawater appear to be larger and more heavily calcified than those precipitated in the modern seawater. From Stanley et al. (in press). ................................................................................... 40
Figure 3-13. Molar Mg/Ca ratio of calcite secreted by coccolithophore species Cruciplacolithus neohelis (A), Ochrosphaera neopolitana (B), and Pleurochrysis carterae (C) as a function of the molar Mg/Ca ratio of the artificial seawater in which they were grown. Error bars represent standard error associated with microprobe precision. Fitted curves are power functions fit to the data using a least squares regression. From Stanley et al. (in press)................................................................. 41
xi
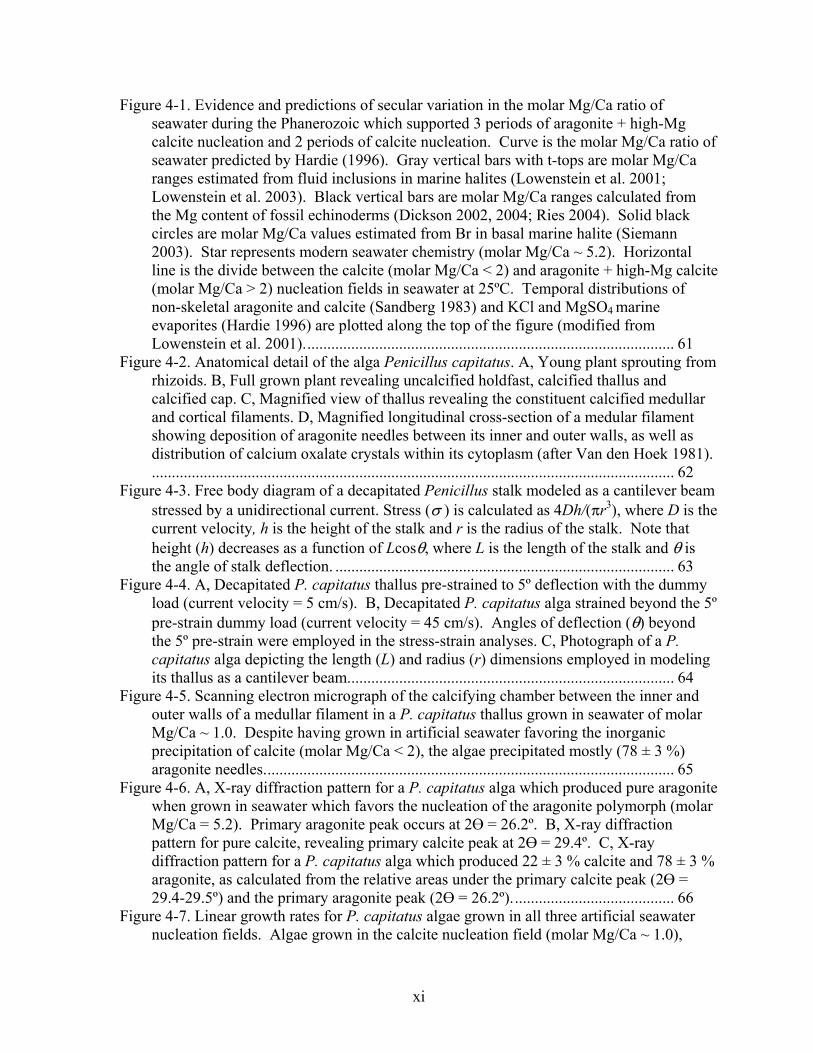
Figure 4-1. Evidence and predictions of secular variation in the molar Mg/Ca ratio of seawater during the Phanerozoic which supported 3 periods of aragonite + high-Mg calcite nucleation and 2 periods of calcite nucleation. Curve is the molar Mg/Ca ratio of seawater predicted by Hardie (1996). Gray vertical bars with t-tops are molar Mg/Ca ranges estimated from fluid inclusions in marine halites (Lowenstein et al. 2001; Lowenstein et al. 2003). Black vertical bars are molar Mg/Ca ranges calculated from the Mg content of fossil echinoderms (Dickson 2002, 2004; Ries 2004). Solid black circles are molar Mg/Ca values estimated from Br in basal marine halite (Siemann 2003). Star represents modern seawater chemistry (molar Mg/Ca ~ 5.2). Horizontal line is the divide between the calcite (molar Mg/Ca < 2) and aragonite + high-Mg calcite (molar Mg/Ca > 2) nucleation fields in seawater at 25ºC. Temporal distributions of non-skeletal aragonite and calcite (Sandberg 1983) and KCl and MgSO4 marine evaporites (Hardie 1996) are plotted along the top of the figure (modified from Lowenstein et al. 2001)............................................................................................. 61
Figure 4-2. Anatomical detail of the alga Penicillus capitatus. A, Young plant sprouting from rhizoids. B, Full grown plant revealing uncalcified holdfast, calcified thallus and calcified cap. C, Magnified view of thallus revealing the constituent calcified medullar and cortical filaments. D, Magnified longitudinal cross-section of a medular filament showing deposition of aragonite needles between its inner and outer walls, as well as distribution of calcium oxalate crystals within its cytoplasm (after Van den Hoek 1981).................................................................................................................................... 62
Figure 4-3. Free body diagram of a decapitated Penicillus stalk modeled as a cantilever beam stressed by a unidirectional current. Stress ( ) is calculated as 4Dh/( r3), where D is the current velocity, h is the height of the stalk and r is the radius of the stalk. Note that height (h) decreases as a function of Lcos , where L is the length of the stalk and is the angle of stalk deflection. ..................................................................................... 63
Figure 4-4. A, Decapitated P. capitatus thallus pre-strained to 5º deflection with the dummy load (current velocity = 5 cm/s). B, Decapitated P. capitatus alga strained beyond the 5º pre-strain dummy load (current velocity = 45 cm/s). Angles of deflection ( ) beyond the 5º pre-strain were employed in the stress-strain analyses. C, Photograph of a P.capitatus alga depicting the length (L) and radius (r) dimensions employed in modeling its thallus as a cantilever beam.................................................................................. 64
Figure 4-5. Scanning electron micrograph of the calcifying chamber between the inner and outer walls of a medullar filament in a P. capitatus thallus grown in seawater of molar Mg/Ca ~ 1.0. Despite having grown in artificial seawater favoring the inorganic precipitation of calcite (molar Mg/Ca < 2), the algae precipitated mostly (78 ± 3 %) aragonite needles....................................................................................................... 65
Figure 4-6. A, X-ray diffraction pattern for a P. capitatus alga which produced pure aragonite when grown in seawater which favors the nucleation of the aragonite polymorph (molar Mg/Ca = 5.2). Primary aragonite peak occurs at 2 = 26.2º. B, X-ray diffraction pattern for pure calcite, revealing primary calcite peak at 2 = 29.4º. C, X-ray diffraction pattern for a P. capitatus alga which produced 22 ± 3 % calcite and 78 ± 3 % aragonite, as calculated from the relative areas under the primary calcite peak (2 = 29.4-29.5º) and the primary aragonite peak (2 = 26.2º)......................................... 66
Figure 4-7. Linear growth rates for P. capitatus algae grown in all three artificial seawater nucleation fields. Algae grown in the calcite nucleation field (molar Mg/Ca ~ 1.0),

xii
which did not favor their aragonite mineralogy, maintained the slowest linear growth rates ± SE (0.14 ± 0.02 mm d-1). Algae grown in the boundary (molar Mg/Ca ~ 2.5) and aragonite + high-Mg calcite (molar Mg/Ca ~ 5.2) nucleation fields exhibited significantly (p < 0.01) increasing rates of growth (0.75 ± 0.07 and 1.00 ± 0.11 mm d-1,respectively). ............................................................................................................. 67
Figure 4-8. Calcification by P. capitatus algae of increasing age in the three seawater treatments. Average calcification rates were derived from linear regressions fit to the data using the least squares method. The solid gray (y = 0.697x - 9.050, R2 = 0.900, SE = 0.062), broken black (y = 0.424x - 6.749, R2 =0.615, SE = 0.065) and solid black (y =0.059x + 0.102, R2 = 0.215, SE = 0.034) curves correspond to P. capitatus algae raised in the molar Mg/Ca ~ 5.2, ~ 2.5 and ~ 1.0 treatments, respectively, and reveal average calcification rates decreasing significantly (p << 0.001) in that order. .................... 68
Figure 4-9. Primary productivity by P. capitatus algae of increasing age in the three seawater treatments. Average primary production rates were derived from linear regressions fit to the data using the least squares method. The solid gray (y = 0.8685x - 9.961, R2 = 0.856, SE = 0.095), broken black (y = 0.358x - 3.584, R2 = 0.754, SE = 0.039) and solid black (y = 0.152x – 1.224, R2 = 0.517, SE = 0.044) curves correspond to Penicillusraised in the molar Mg/Ca ~ 5.2, ~ 2.5 and ~ 1.0 treatments, respectively, and reveal primary production rates decreasing significantly (p << 0.001) in that order. ......... 69
Figure 4-10. Stress-strain data generated for the thalli of nine P. capitatus algae grown in the three seawater treatments. Stress-strain curves were generated by fitting linear regressions to the data using the least squares method. The solid gray, broken black and solid black curves correspond to Penicillus thalli grown in the molar Mg/Ca ~ 5.2, ~ 2.5 and ~ 1.0 artificial seawater treatments, respectively, and reveal thallus stiffnesses decreasing significantly (p < 0.001) in that order. Average stiffnesses were calculated from the slopes of these stress-strain curves............................................................. 70
Figure 4-11. Plot of ambient molar Mg/Ca vs. average thallus stiffness for three replicate sets of P. capitatus algae. Thallus stiffness is greatest in algae grown in seawater which supports its inherent aragonitic mineralogy (molar Mg/Ca ~ 5.2), least in seawater which supports calcite nucleation (molar Mg/Ca ~ 1.0) and intermediate in seawater near the nucleation field boundary (molar Mg/Ca ~ 2.5). Error bars are standard deviation.................................................................................................................... 71
Figure 5-1. Evidence and predictions of secular variation in the Mg/Ca of seawater throughout the Phanerozoic which supported 3 periods of aragonite/high-Mg calcite nucleation and 2 periods of calcite nucleation. Curve is molar Mg/Ca ratio predicted from established rates of ocean crust production (Hardie 1996). Black vertical bars are molar Mg/Ca ranges calculated from the Mg content of fossil echinoderms (Dickson 2002, 2004). Solid black circles are molar Mg/Ca values estimated from Br in basal marine halite (Siemann 2003). Gray vertical bars with t-tops are molar Mg/Ca ranges estimated from fluid inclusions in marine halites (Lowenstein et al. 2001; Lowenstein et al. 2003). Star represents modern seawater chemistry (molar Mg/Ca = ~5.2). Horizontal line divides the calcite (Mg/Ca < 2) and aragonite/high-Mg calcite (Mg/Ca > 2) nucleation fields in seawater of 25ºC. Intervals of abiotic aragonite (“A”) and calcite (“C”) precipitates (Sandberg 1983) and KCl and MgSO4 marine evaporites (Hardie 1996) are plotted along the top of the figure (modified from Lowenstein et al. 2001).93

xiii
Figure 5-2. Anatomical detail of the alga Udotea flabellum. A, Full grown plant revealing uncalcified holdfast, calcified thallus and calcified fan. B, Young alga. C, Vertical section of surface of fan showing cortex and individual utricles. D, Cortication of surface of thallus. D, Vertical section through cortical layer; u = utricle, p = utricle protrusions, f = filament, ow = outer filament wall, iw = inner filament wall, ol =organic layer within filament wall, CH = chimney system, PD = primary deposit, SD = secondary deposit, ICD = intercellular deposit (after Fritsch 1948; Böhm et al. 1978).................................................................................................................................... 94
Figure 5-3. A-B, Scanning electron micrographs of the calcifying chamber between the inner and outer walls of filaments within a U. flabellum alga grown in seawater of molar Mg/Ca ~ 1.0 (calcite seawater). Black arrows point to possible calcite crystals, interspersed among the more numerous aragonite needles. C-D, Scanning electron micrographs for a comparable region of a U. flabellum alga grown in seawater of molar Mg/Ca ~ 5.2 (aragonite seawater). Note absence of the purported calcite crystals identified in A-B. ...................................................................................................... 95
Figure 5-4. A, X-ray diffraction pattern for a U. flabellum alga which produced 100% aragonite when grown in seawater which favors the nucleation of the aragonite polymorph (molar Mg/Ca = 5.2). Primary aragonite peak occurs at 2 = 26.2º. B, X-ray diffraction pattern for pure calcite, revealing primary calcite peak at 2 = 29.4º. C, X-ray diffraction pattern for a U. flabellum alga which produced 25 ± 3 % calcite and 75 ± 3 % aragonite, as calculated from the respective areas beneath the primary calcite peak (2 = 29.4-29.5º) and the primary aragonite peak (2 = 26.2º)...................... 96
Figure 5-5. Linear growth rates for U. flabellum algae grown in the three artificial seawater nucleation fields. Algae grown in the calcite nucleation field (molar Mg/Ca ~ 1.0), which does not favor their aragonite mineralogy, maintained the slowest linear growth rates ± SE (0.70 ± 0.08 mm d-1). Algae grown in the boundary (Mg/Ca ~ 2.5) and aragonite/high-Mg calcite (Mg/Ca ~ 5.2) nucleation fields exhibited rates of linear growth (0.86 ± 0.09 and 0.96 ± 0.15 mm d-1, respectively) increasing significantly (p < 0.17) with ambient Mg/Ca. ....................................................................................... 97
Figure 5-6. Calcification by U. flabellum algae of increasing age in the three seawater treatments. Average calcification rates are the slopes of the least squares linear regressions through the data. The solid gray (y = 0.551x - 5.395, R2 = 0.88, SE = 0.044), broken black (y = 0.305x - 1.734, R2 = 0.87, SE = 0.030) and solid black (y = 0.116x - 0.665, R2 = 0.61, SE = 0.025) curves correspond to U. flabellum algae raised in the aragonite (molar Mg/Ca = 5.2), boundary (molar Mg/Ca = 2.5) and calcite (molar Mg/Ca = 1.0) seawater treatments, respectively, and reveal average primary production rates which decrease significantly (p << 0.001) in that order................................... 98
Figure 5-7. Primary productivity of U. flabellum algae of increasing age in the three seawater treatments. Average primary production rates are the slopes of the least squares linear regressions through the data. The solid gray (y = 0.383x – 2.738, R2 = 0.75, SE = 0.048), broken black (y = 0.138x + 0.241, R2 = 0.62, SE = 0.028) and solid black (y = 0.087x + 0.477, R2 = 0.32, SE = 0.034) curves correspond to U. flabellum algae raised in the aragonite (molar Mg/Ca = 5.2), boundary (molar Mg/Ca = 2.5) and calcite (molar Mg/Ca = 1.0) seawater treatments, respectively, and reveal average calcification rates which decrease significantly (p << 0.001) in that order. .......................................... 99
xiv
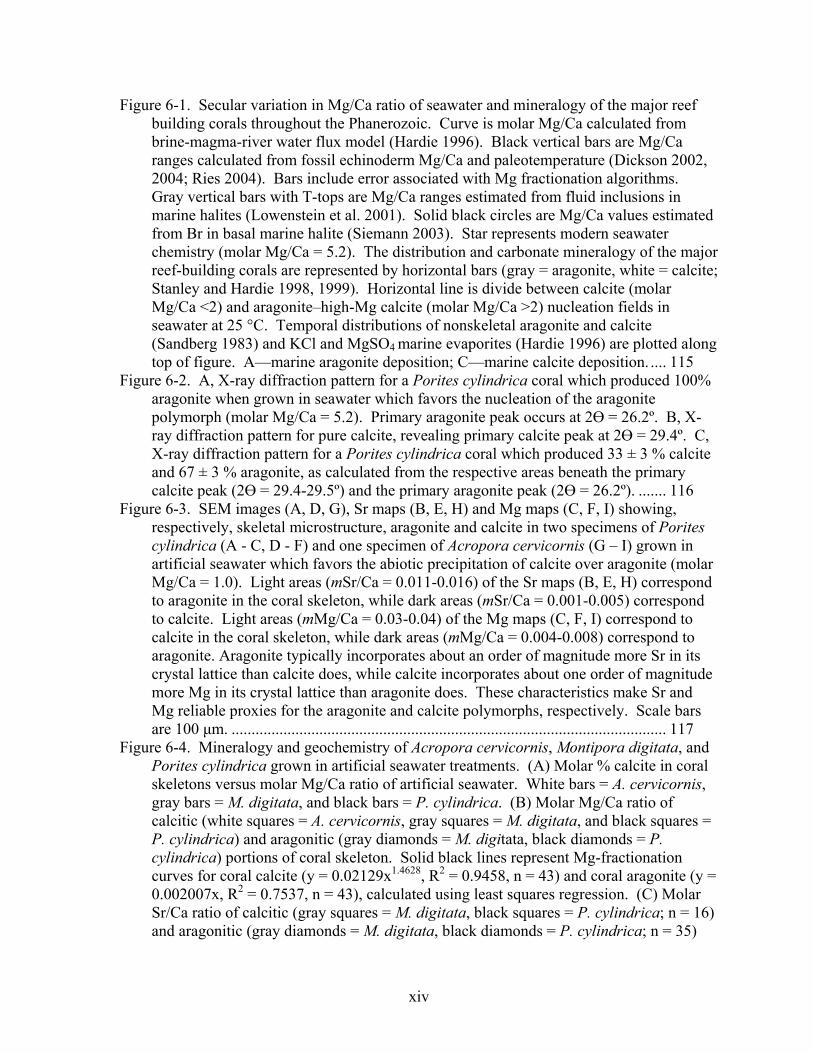
Figure 6-1. Secular variation in Mg/Ca ratio of seawater and mineralogy of the major reef building corals throughout the Phanerozoic. Curve is molar Mg/Ca calculated from brine-magma-river water flux model (Hardie 1996). Black vertical bars are Mg/Ca ranges calculated from fossil echinoderm Mg/Ca and paleotemperature (Dickson 2002, 2004; Ries 2004). Bars include error associated with Mg fractionation algorithms. Gray vertical bars with T-tops are Mg/Ca ranges estimated from fluid inclusions in marine halites (Lowenstein et al. 2001). Solid black circles are Mg/Ca values estimated from Br in basal marine halite (Siemann 2003). Star represents modern seawater chemistry (molar Mg/Ca = 5.2). The distribution and carbonate mineralogy of the major reef-building corals are represented by horizontal bars (gray = aragonite, white = calcite; Stanley and Hardie 1998, 1999). Horizontal line is divide between calcite (molar Mg/Ca <2) and aragonite–high-Mg calcite (molar Mg/Ca >2) nucleation fields in seawater at 25 °C. Temporal distributions of nonskeletal aragonite and calcite (Sandberg 1983) and KCl and MgSO4 marine evaporites (Hardie 1996) are plotted along top of figure. A—marine aragonite deposition; C—marine calcite deposition. .... 115
Figure 6-2. A, X-ray diffraction pattern for a Porites cylindrica coral which produced 100% aragonite when grown in seawater which favors the nucleation of the aragonite polymorph (molar Mg/Ca = 5.2). Primary aragonite peak occurs at 2 = 26.2º. B, X-ray diffraction pattern for pure calcite, revealing primary calcite peak at 2 = 29.4º. C, X-ray diffraction pattern for a Porites cylindrica coral which produced 33 ± 3 % calcite and 67 ± 3 % aragonite, as calculated from the respective areas beneath the primary calcite peak (2 = 29.4-29.5º) and the primary aragonite peak (2 = 26.2º). ....... 116
Figure 6-3. SEM images (A, D, G), Sr maps (B, E, H) and Mg maps (C, F, I) showing, respectively, skeletal microstructure, aragonite and calcite in two specimens of Porites cylindrica (A - C, D - F) and one specimen of Acropora cervicornis (G – I) grown in artificial seawater which favors the abiotic precipitation of calcite over aragonite (molar Mg/Ca = 1.0). Light areas (mSr/Ca = 0.011-0.016) of the Sr maps (B, E, H) correspond to aragonite in the coral skeleton, while dark areas (mSr/Ca = 0.001-0.005) correspond to calcite. Light areas (mMg/Ca = 0.03-0.04) of the Mg maps (C, F, I) correspond to calcite in the coral skeleton, while dark areas (mMg/Ca = 0.004-0.008) correspond to aragonite. Aragonite typically incorporates about an order of magnitude more Sr in its crystal lattice than calcite does, while calcite incorporates about one order of magnitude more Mg in its crystal lattice than aragonite does. These characteristics make Sr and Mg reliable proxies for the aragonite and calcite polymorphs, respectively. Scale bars are 100 µm. ............................................................................................................. 117
Figure 6-4. Mineralogy and geochemistry of Acropora cervicornis, Montipora digitata, and Porites cylindrica grown in artificial seawater treatments. (A) Molar % calcite in coral skeletons versus molar Mg/Ca ratio of artificial seawater. White bars = A. cervicornis,gray bars = M. digitata, and black bars = P. cylindrica. (B) Molar Mg/Ca ratio of calcitic (white squares = A. cervicornis, gray squares = M. digitata, and black squares = P. cylindrica) and aragonitic (gray diamonds = M. digitata, black diamonds = P.cylindrica) portions of coral skeleton. Solid black lines represent Mg-fractionation curves for coral calcite (y = 0.02129x1.4628, R2 = 0.9458, n = 43) and coral aragonite (y = 0.002007x, R2 = 0.7537, n = 43), calculated using least squares regression. (C) Molar Sr/Ca ratio of calcitic (gray squares = M. digitata, black squares = P. cylindrica; n = 16) and aragonitic (gray diamonds = M. digitata, black diamonds = P. cylindrica; n = 35)
xv
portions of coral skeleton. For seawater mMg/Ca < 2, mSr/Ca values are for calcitic portions of coral skeleton; for seawater mMg/Ca > 2, mSr/Ca values are for aragonitic portions of coral skeleton. Error bars correspond to instrument error plus specimen variation. Molar Mg/Ca < 2 = calcite seas; molar Mg/Ca > 2 = aragonite + high-Mg calcite seas. ............................................................................................................. 119
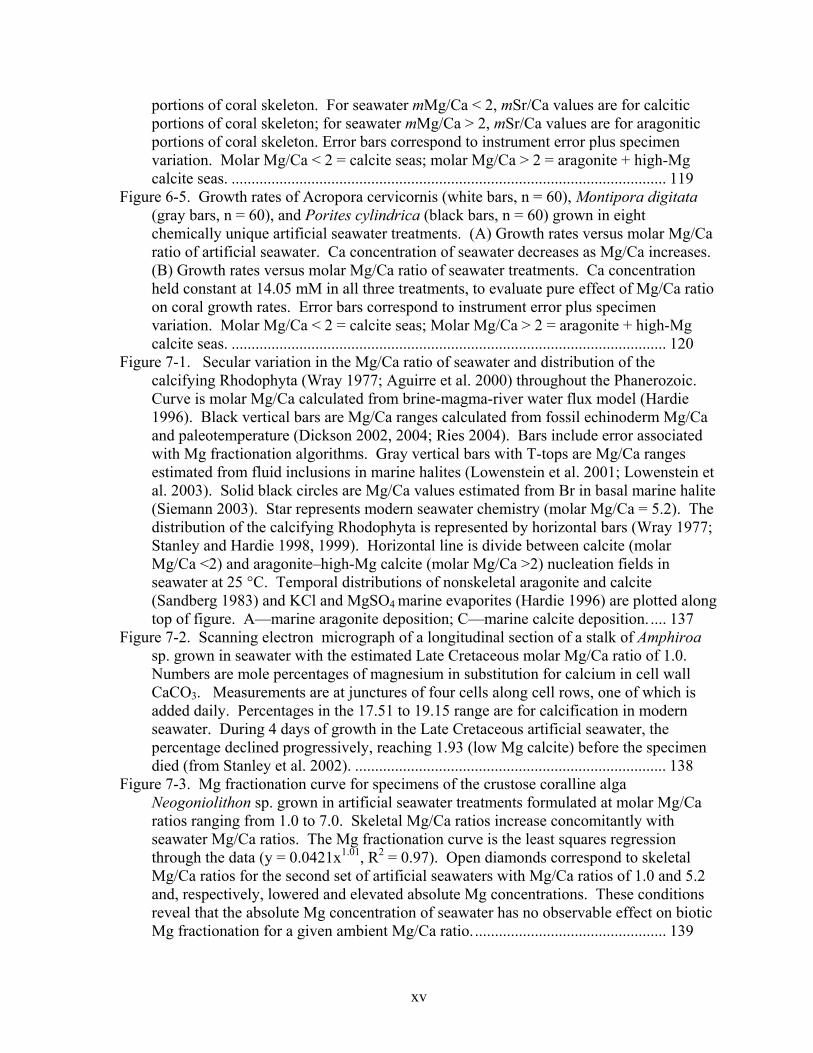
Figure 6-5. Growth rates of Acropora cervicornis (white bars, n = 60), Montipora digitata(gray bars, n = 60), and Porites cylindrica (black bars, n = 60) grown in eight chemically unique artificial seawater treatments. (A) Growth rates versus molar Mg/Ca ratio of artificial seawater. Ca concentration of seawater decreases as Mg/Ca increases. (B) Growth rates versus molar Mg/Ca ratio of seawater treatments. Ca concentration held constant at 14.05 mM in all three treatments, to evaluate pure effect of Mg/Ca ratio on coral growth rates. Error bars correspond to instrument error plus specimen variation. Molar Mg/Ca < 2 = calcite seas; Molar Mg/Ca > 2 = aragonite + high-Mg calcite seas. ............................................................................................................. 120
Figure 7-1. Secular variation in the Mg/Ca ratio of seawater and distribution of the calcifying Rhodophyta (Wray 1977; Aguirre et al. 2000) throughout the Phanerozoic. Curve is molar Mg/Ca calculated from brine-magma-river water flux model (Hardie 1996). Black vertical bars are Mg/Ca ranges calculated from fossil echinoderm Mg/Ca and paleotemperature (Dickson 2002, 2004; Ries 2004). Bars include error associated with Mg fractionation algorithms. Gray vertical bars with T-tops are Mg/Ca ranges estimated from fluid inclusions in marine halites (Lowenstein et al. 2001; Lowenstein et al. 2003). Solid black circles are Mg/Ca values estimated from Br in basal marine halite (Siemann 2003). Star represents modern seawater chemistry (molar Mg/Ca = 5.2). The distribution of the calcifying Rhodophyta is represented by horizontal bars (Wray 1977; Stanley and Hardie 1998, 1999). Horizontal line is divide between calcite (molar Mg/Ca <2) and aragonite–high-Mg calcite (molar Mg/Ca >2) nucleation fields in seawater at 25 °C. Temporal distributions of nonskeletal aragonite and calcite (Sandberg 1983) and KCl and MgSO4 marine evaporites (Hardie 1996) are plotted along top of figure. A—marine aragonite deposition; C—marine calcite deposition. .... 137
Figure 7-2. Scanning electron micrograph of a longitudinal section of a stalk of Amphiroasp. grown in seawater with the estimated Late Cretaceous molar Mg/Ca ratio of 1.0. Numbers are mole percentages of magnesium in substitution for calcium in cell wall CaCO3. Measurements are at junctures of four cells along cell rows, one of which is added daily. Percentages in the 17.51 to 19.15 range are for calcification in modern seawater. During 4 days of growth in the Late Cretaceous artificial seawater, the percentage declined progressively, reaching 1.93 (low Mg calcite) before the specimen died (from Stanley et al. 2002). .............................................................................. 138
Figure 7-3. Mg fractionation curve for specimens of the crustose coralline alga Neogoniolithon sp. grown in artificial seawater treatments formulated at molar Mg/Ca ratios ranging from 1.0 to 7.0. Skeletal Mg/Ca ratios increase concomitantly with seawater Mg/Ca ratios. The Mg fractionation curve is the least squares regression through the data (y = 0.0421x1.01, R2 = 0.97). Open diamonds correspond to skeletal Mg/Ca ratios for the second set of artificial seawaters with Mg/Ca ratios of 1.0 and 5.2 and, respectively, lowered and elevated absolute Mg concentrations. These conditions reveal that the absolute Mg concentration of seawater has no observable effect on biotic Mg fractionation for a given ambient Mg/Ca ratio................................................. 139
xvi
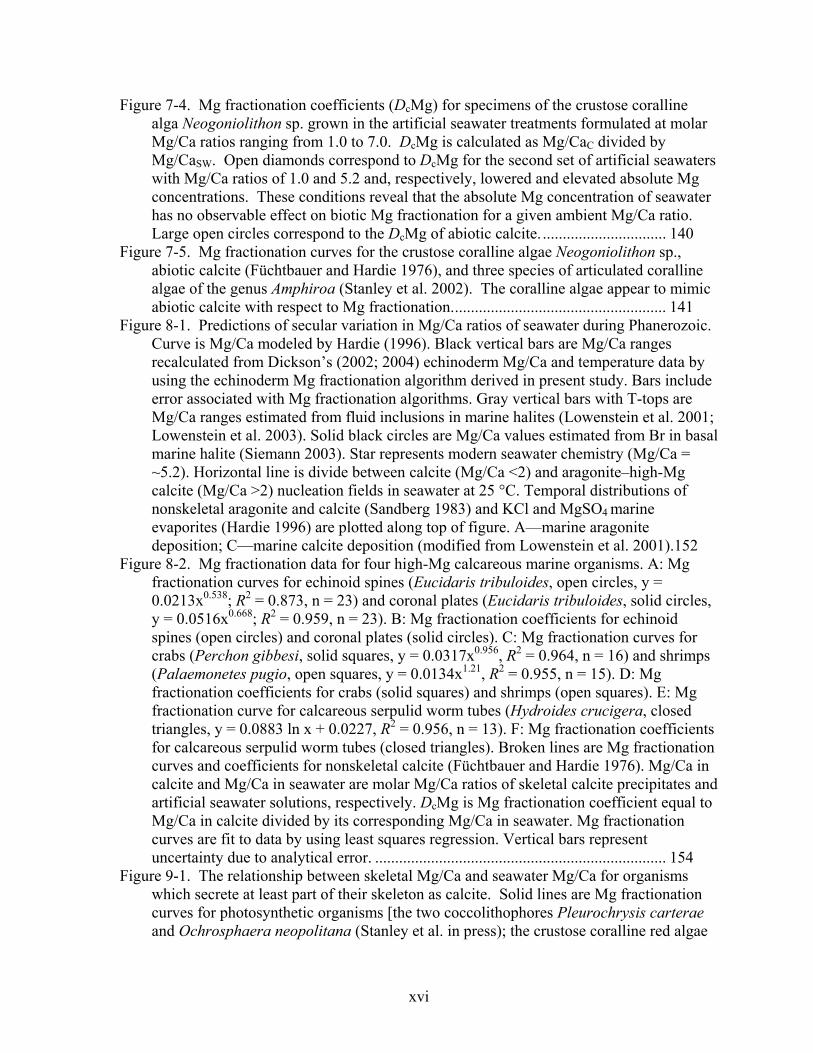
Figure 7-4. Mg fractionation coefficients (DcMg) for specimens of the crustose coralline alga Neogoniolithon sp. grown in the artificial seawater treatments formulated at molar Mg/Ca ratios ranging from 1.0 to 7.0. DcMg is calculated as Mg/CaC divided by Mg/CaSW. Open diamonds correspond to DcMg for the second set of artificial seawaters with Mg/Ca ratios of 1.0 and 5.2 and, respectively, lowered and elevated absolute Mg concentrations. These conditions reveal that the absolute Mg concentration of seawater has no observable effect on biotic Mg fractionation for a given ambient Mg/Ca ratio. Large open circles correspond to the DcMg of abiotic calcite. ............................... 140
Figure 7-5. Mg fractionation curves for the crustose coralline algae Neogoniolithon sp., abiotic calcite (Füchtbauer and Hardie 1976), and three species of articulated coralline algae of the genus Amphiroa (Stanley et al. 2002). The coralline algae appear to mimic abiotic calcite with respect to Mg fractionation...................................................... 141
Figure 8-1. Predictions of secular variation in Mg/Ca ratios of seawater during Phanerozoic. Curve is Mg/Ca modeled by Hardie (1996). Black vertical bars are Mg/Ca ranges recalculated from Dickson’s (2002; 2004) echinoderm Mg/Ca and temperature data by using the echinoderm Mg fractionation algorithm derived in present study. Bars include error associated with Mg fractionation algorithms. Gray vertical bars with T-tops are Mg/Ca ranges estimated from fluid inclusions in marine halites (Lowenstein et al. 2001; Lowenstein et al. 2003). Solid black circles are Mg/Ca values estimated from Br in basal marine halite (Siemann 2003). Star represents modern seawater chemistry (Mg/Ca = ~5.2). Horizontal line is divide between calcite (Mg/Ca <2) and aragonite–high-Mg calcite (Mg/Ca >2) nucleation fields in seawater at 25 °C. Temporal distributions of nonskeletal aragonite and calcite (Sandberg 1983) and KCl and MgSO4 marine evaporites (Hardie 1996) are plotted along top of figure. A—marine aragonite deposition; C—marine calcite deposition (modified from Lowenstein et al. 2001).152
Figure 8-2. Mg fractionation data for four high-Mg calcareous marine organisms. A: Mg fractionation curves for echinoid spines (Eucidaris tribuloides, open circles, y = 0.0213x0.538; R2 = 0.873, n = 23) and coronal plates (Eucidaris tribuloides, solid circles, y = 0.0516x0.668; R2 = 0.959, n = 23). B: Mg fractionation coefficients for echinoid spines (open circles) and coronal plates (solid circles). C: Mg fractionation curves for crabs (Perchon gibbesi, solid squares, y = 0.0317x0.956, R2 = 0.964, n = 16) and shrimps (Palaemonetes pugio, open squares, y = 0.0134x1.21, R2 = 0.955, n = 15). D: Mg fractionation coefficients for crabs (solid squares) and shrimps (open squares). E: Mg fractionation curve for calcareous serpulid worm tubes (Hydroides crucigera, closed triangles, y = 0.0883 ln x + 0.0227, R2 = 0.956, n = 13). F: Mg fractionation coefficients for calcareous serpulid worm tubes (closed triangles). Broken lines are Mg fractionation curves and coefficients for nonskeletal calcite (Füchtbauer and Hardie 1976). Mg/Ca in calcite and Mg/Ca in seawater are molar Mg/Ca ratios of skeletal calcite precipitates and artificial seawater solutions, respectively. DcMg is Mg fractionation coefficient equal to Mg/Ca in calcite divided by its corresponding Mg/Ca in seawater. Mg fractionation curves are fit to data by using least squares regression. Vertical bars represent uncertainty due to analytical error. ......................................................................... 154
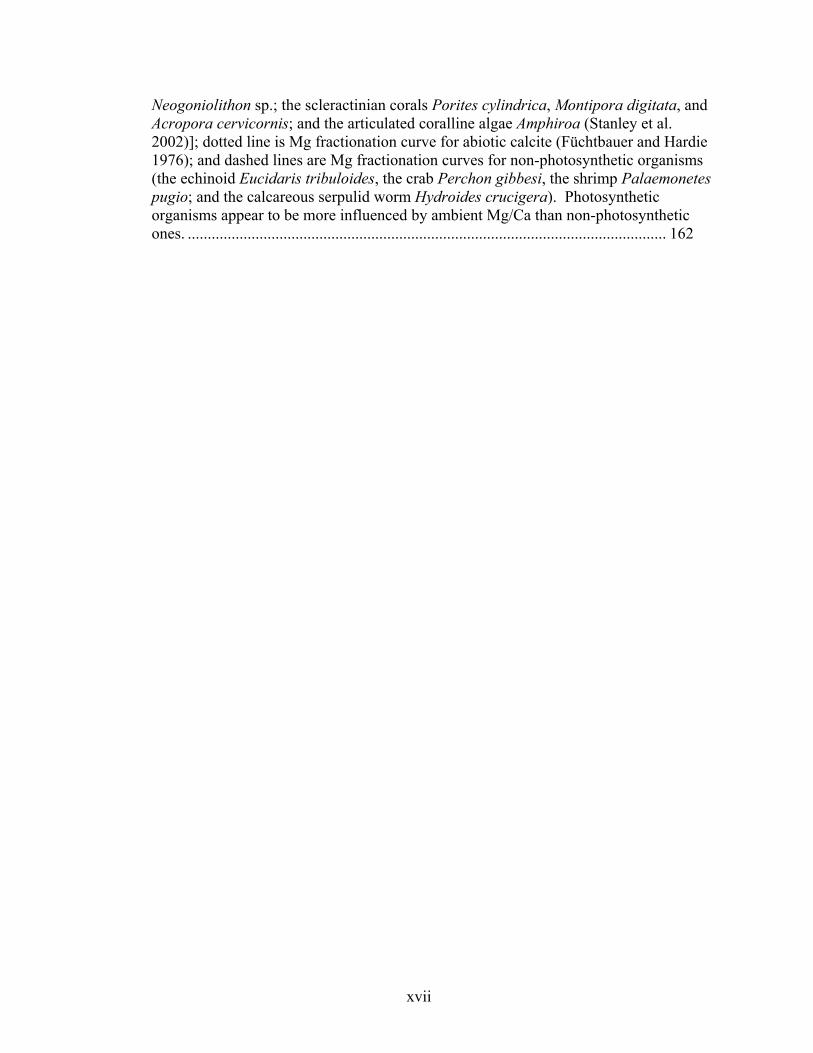
Figure 9-1. The relationship between skeletal Mg/Ca and seawater Mg/Ca for organisms which secrete at least part of their skeleton as calcite. Solid lines are Mg fractionation curves for photosynthetic organisms [the two coccolithophores Pleurochrysis carteraeand Ochrosphaera neopolitana (Stanley et al. in press); the crustose coralline red algae
xvii
Neogoniolithon sp.; the scleractinian corals Porites cylindrica, Montipora digitata, and Acropora cervicornis; and the articulated coralline algae Amphiroa (Stanley et al. 2002)]; dotted line is Mg fractionation curve for abiotic calcite (Füchtbauer and Hardie 1976); and dashed lines are Mg fractionation curves for non-photosynthetic organisms (the echinoid Eucidaris tribuloides, the crab Perchon gibbesi, the shrimp Palaemonetespugio; and the calcareous serpulid worm Hydroides crucigera). Photosynthetic organisms appear to be more influenced by ambient Mg/Ca than non-photosynthetic ones. ........................................................................................................................ 162

1
1 Summary
The science of paleo-ocean chemistry is unique in that it connects the fields of
plate tectonics, marine geochemistry, paleontology and sedimentology. The research
presented here explores a critical aspect of the geochemistry-paleontology link: the
relationship between seawater Mg/Ca and calcium carbonate biomineralization.
Sandberg (1983) observed that the primary mineralogy of ooids and early marine
cements has alternated between three aragonite and two calcite intervals over the
Phanerozoic Eon. Stanley and Hardie (1998; 1999) observed that important reef-building
and sediment-producing organisms have shifted mineralogy in phase with these non-
skeletal carbonates. Hardie (1996) interprets these shifts in carbonate mineralogy as
responses to secular variations in the Mg/Ca ratio of seawater caused by fluctuations in
the mixing rate of mid-ocean-ridge (MOR)/large-igneous-province (LIP) hydrothermal
brines and average river water, which is primarily driven by changes in the global rate of
ocean crust production. As upwelling MOR/LIP basalt interacts with marine brine, the
basalt is converted to greenstone, thereby removing Mg2+ and SO42– from seawater and
releasing Ca2+ and K+ to it. The rate of MOR/LIP ocean-crust production controls the
rates of this ion exchange and, therefore, the relative concentrations of these ions in
seawater (Spencer and Hardie 1990).
Hardie (1996) used this model to calculate Mg/Ca ratios for the entire
Phanerozoic from historical rates of ocean crust production (inferred from eustatic sea
level change). Füchtbauer and Hardie (1976; 1980) showed experimentally that for earth
surface temperatures and pressures, seawater with Mg/Ca mole ratios greater than 2
precipitate aragonite + high-Mg calcite (molar Mg/Ca in calcite >0.04), while Mg/Ca
2
mole ratios less than 2 precipitate only low-Mg calcite (molar Mg/Ca in calcite <0.04).
The combination of these carbonate nucleation fields with Hardie’s (1996) Phanerozoic
Mg/Ca curve accurately predicts Sandberg’s (1983) and Stanley and Hardie’s (1998;
1999) variation in non-skeletal and skeletal carbonates. Hardie’s oceanic Mg/Ca model
is further supported by synchronized transitions between MgSO4 and KCl evaporites
(Hardie 1996; Lowenstein et al. 2003), fluid inclusions (Lowenstein et al. 2001;
Lowenstein et al. 2003) and Br (Siemann 2003) in marine halite, and the Mg/Ca ratios of
fossil echinoderms (Dickson 2002, 2004).
Stanley and Hardie (1998; 1999) found that the carbonate mineralogy of simple,
hypercalcifying organisms has varied in concert with Sandberg’s aragonite and calcite
seas over the Phanerozoic. During the first calcite sea of the Phanerozoic (middle
Paleozoic), calcitic corals (tabulate, heliolitid and rugose), and stromatoporoids (possibly
calcitic) were the dominant reef builders, while receptaculitids (possibly calcitic) were
the dominant sediment producers. During the Phanerozoic’s second aragonite sea (late
Paleozoic-early Mesozoic), the reefs were dominated by aragonitic groups of sponges,
scleractinian corals and phylloid algae and high-Mg calcitic red algae, while aragonitic
dasycladaceans were the dominant algal sediment producers. During the second calcite
sea (Mid-Jurassic-Late Paleogene) the largely calcitic rudist bivalves replaced the
aragonitic scleractinian corals as major reef builders, while calcitic nannoplankton
(coccolithophores) became major chalk producers. Finally, during the third aragonite
sea, which includes the modern ocean, aragonitic scleractinian corals and high-Mg
calcitic red algae again dominate reef construction and aragonitic codiacean green algae
control sediment production.
3
The synchronicity that Stanley and Hardie (1998; 1999) observed between
skeletal and non-skeletal carbonates is most evident for the geologically important reef-
building and sediment producing algae, probably because these organisms’
characteristically rapid calcification permits them to exercise only limited
biomineralogical control.
Here, I present experiments evaluating the effect of seawater Mg/Ca on the
biomineralization of extant representatives of calcifying taxa that have been subjected to
the alternating calcite and aragonite seas of the Phanerozoic. Aragonite secreting
codiacean algae (Stanley et al. in preparation) and scleractinian corals and calcite-
secreting coccolithophores (Stanley et al. in press), coralline algae, and reef-dwelling
animals were grown in artificial seawaters formulated over the range of Mg/Ca ratios to
which their calcifying ancestors would have been subjected. These organisms’
calcification and growth rates and/or mineralogy and geochemistry were evaluated after
growth in the various ambient Mg/Ca conditions
The aragonite-secreting codiacean algae (Penicillus capitatus, Udotea flabellum
and Halimeda incrassata (Stanley et al. in preparation)) and scleractinian corals (Porites
cylindrica, Montipora digitata, and Acropora cervicornis) exhibited higher rates of
growth and calcification when grown in seawater of Mg/Ca ratios which favored their
aragonitic mineralogy. Furthermore, both the normally aragonitic algae and corals
produced approximately one-quarter and one-third, respectively, of their CaCO3 as low-
Mg calcite when grown in the artificial calcite seawater (molar Mg/Ca < 2).
The coccolithophores (Pleurochrysis carterae, Ochrosphaera neopolitana, and
Cruciplacolithus neohelis (Stanley et al. in press)) exhibited higher rates of growth and

4
calcification in seawater of ambient Mg/Ca ratios which favored their calcitic
mineralogy. While the coccolithophores produced the calcite polymorph in all of the
ambient Mg/Ca conditions, two of the three species exhibited skeletal Mg/Ca ratios
which increased proportionally with the Mg/Ca ratio of the artificial seawater in which
they were grown.
The coralline algae (Neogoniolithon sp.) and reef-dwelling animals (the echinoid
Eucidaris tribuloides, the crab Perchon gibbesi, the shrimp Palaemonetes pugio, and the
calcareous serpulid worm Hydroides crucigera) also produced the calcite polymorph in
all of the ambient Mg/Ca conditions. And like two of the three species of
coccolithophores, they incorporated Mg into their skeletons in proportion to the Mg/Ca
ratio of the artificial seawater.
The elevated rates of calcification and growth observed for the codiacean algae
and scleractinian corals grown in the artificial aragonite seawater (molar Mg/Ca > 2), and
for the coccolithophores grown in the artificial calcitic seawaters (molar Mg/Ca < 2),
support the empirical evidence in the fossil record (Stanley and Hardie 1998, 1999) that
oceanic Mg/Ca was an important factor in determining the success of these organisms as
dominant sediment producers and reef builders during aragonite and calcite seas,
respectively. The elevated productivity and calcification of the coccolithophores in the
artificial calcite seawater is particularly significant given its occurrence in the
experimental conditions (molar Mg/Ca = 1) which deviated most from those to which
modern coccolithophores are accustomed (molar Mg/Ca = 5.2).
It is reasonable, if not expected, that the precipitation of aragonite by the algae
and corals in the low-Mg calcite nucleation field, and the coccolithophores precipitation
5
of Mg calcite in the aragonite nucleation field, will proceed at a slower rate than it does in
seawater which favors the organisms’ inherent skeletal mineralogies. It appears that such
reduced rates of calcification will liberate less CO2 for photosynthesis (Borowitzka and
Larkum 1976; Borowitzka 1977), thereby resulting in the concomitant reductions in
linear growth and primary productivity observed when these autotrophic organisms are
grown in mineralogically unfavorable seawater. This apparent link between calcification
and growth suggests that photosynthetic calcifiers would have been most influenced by
variations in the Mg/Ca ratio of seawater.
The precipitation of a mostly aragonitic skeleton by codiacean algae and
scleractinian corals in seawater which favors the abiotic precipitation of calcite suggests
that these organisms exert significant control over their biomineralization. However, the
precipitation of one-quarter of the algae’s CaCO3 and one-third of the coral’s CaCO3 as
the calcite polymorph in calcite seawater (as opposed to the normal aragonite polymorph)
suggests that these organisms’ biomineralogical control is somewhat limited and can be
at least partially overridden by ambient seawater chemistry.
The correlation observed between skeletal Mg/Ca and seawater Mg/Ca for the
coccolithophores, the calcitic portions of the scleractinian corals, the coralline algae, and
the reef-dwelling animals supports the assertion that the skeletal Mg/Ca of organisms
which secrete high-Mg calcite in modern seas has varied in synchronicity with oceanic
Mg/Ca throughout the Phanerozoic (Stanley and Hardie 1998, 1999). Therefore, the Mg
content of well-preserved fossils of such organisms may be an archive of oceanic Mg/Ca
throughout the Phanerozoic. Likewise, the reconstruction of ancient seawater
temperatures from skeletal Mg/Ca ratios must correct for the effect of secular variation in
6
the Mg/Ca ratio of seawater. Mg fractionation algorithms which define skeletal Mg/Ca
as a function of seawater Mg/Ca and temperature (Chave 1954) were derived for the
organisms evaluated in these experiments. Oceanic Mg/Ca ratios calculated from the Mg
content of fossil echinoderms (Dickson 2002, 2004), established paleotemperature data
(Golonka et al. 1994), and the echinoid Mg fractionation algorithm are in general
agreement with other estimates of oceanic Mg/Ca throughout the Phanerozoic.
The secretion of low-Mg calcite by each of these organisms in the artificial calcite
seawater (molar Mg/Ca < 2) suggests that these organisms, which secrete high-Mg calcite
in modern aragonite seas, would have secreted low-Mg calcite in ancient calcite seas,
such as those shown to have existed during the middle Paleozoic and mid-Late
Cretaceous. The wide range of organisms which exhibit this proportionality between
skeletal- and seawater Mg/Ca suggests that this is a universal trend for organisms which
secrete high Mg calcite in modern seas.
The influence of seawater Mg/Ca on skeletal Mg/Ca revealed through the
experiments suggests that while these organisms are capable of specifying precipitation
of the calcite polymorph, even in seawater which favors the abiotic precipitation of
aragonite, their biomineralogical control is limited in its ability to regulate Mg
incorporation in that calcite. However, the deviation of many of these organisms’ Mg
fractionation patterns from that of abiotic calcite, combined with variations in Mg
fractionation observed between genera, species and even anatomical components within
an individual, suggests that these organisms are exerting some biological control over this
process.
7
While Chave (1954) correlated taxonomic complexity with temperature-driven
Mg fractionation in calcifying organisms, a similar correlation could not be
unequivocally established here for seawater Mg/Ca-driven Mg fractionation. However,
the photosynthetic organisms (coccolithophores, corals, and coralline algae) generally
appear to be more influenced by ambient Mg/Ca than the non-photosynthetic organisms
(echinoids, crabs, shrimp and calcareous serpulid worms). This elevated susceptibility of
photosynthetic organisms to ambient Mg/Ca suggests that autotrophic calcification
induces the precipitation of CaCO3 through the removal of CO2, and therefore resembles
abiotic calcification to a greater extent than the more regulated heterotrophic
calcification, which controls calcification to varying degrees via ionic pumping and
organic mineral templates.
8
2 Introduction
2.1 Objective
The topic of changing seawater chemistry throughout the Phanerozoic is a
particularly exciting one because it links the typically disparate fields of plate tectonics,
aqueous geochemistry, paleontology and sedimentology (Stanley and Hardie 1998, 1999;
Montañez 2002; Stanley et al. 2002; Ries 2004). The purpose of the research presented
here is to explore a critical aspect of the geochemistry-paleontology link: the relationship
between seawater Mg/Ca and carbonate biomineralization.
Stanley and Hardie (1998; 1999) found that the carbonate mineralogy of simple,
hypercalcifying organisms has varied in concert with Sandberg’s (1983) aragonite and
calcite seas over the Phanerozoic (Figure 2-1). They further assert that hypercalcifying
reef builders (corals, sponges and algae) and carbonate sediment producers (algae) are
dominant generally when their CaCO3 polymorph mineralogy is favored by the Mg/Ca
ratio of seawater. Here, I evaluate Stanley and Hardie’s (1998, 1999) assertions by
conducting experiments which explore the effects of seawater Mg/Ca on the
biomineralization of extant representatives of the calcifying taxa that have been subjected
to the alternating calcite and aragonite seas of the Phanerozoic.
These experiments address the effect of seawater Mg/Ca on: (1) algae which
secrete aragonite in modern seas (three codiacean green algae Penicillus capitatus,
Udotea flabellum and Halimeda incrassata (Stanley et al. in preparation)); (2) algae
which secrete calcite in modern seas (the coralline red algae Neogoniolithon sp. and the
three coccolithophores Pleurochrysis carterae, Ochrosphaera neopolitana, and
Cruciplacolithus neohelis (Stanley et al. in press)): (3) animals which secrete aragonite in
9
modern seas (the scleractinian corals Porites cylindrica, Montipora digitata, and
Acropora cervicornis); and (4) animals which secrete calcite in modern seas (the echinoid
Eucidaris tribuloides, the crab Perchon gibbesi, the shrimp Palaemonetes pugio and the
calcareous serpulid worm Hydroides crucigera). The experiments on the codiacean
green algae, the coccolithophores, and the scleractinian corals address mineralogy, Mg-
incorporation, calcification rates and growth rates, while the experiments on the coralline
algae and calcite-secreting animals focus solely on mineralogy and Mg incorporation.
2.2 Overview
2.2.1 Codiacean green algae
Codiacean green algae have been primary sediment producers in tropical marine
environments since the late Paleogene shift to Aragonite III seas. Stanley and Hardie
(1998; 1999) hypothesized that the dominance of these simple aragonitic hypercalcifiers
was permitted by the transition to an Mg/Ca mole ratio (>2) in the oceans which fosters
the precipitation of their primary skeletal mineral—aragonite.
Specimens of Penicillus capitatus and Udotea flabellum were grown in artificial
seawaters formulated at molar Mg/Ca ratios of 1.0, 2.5 and 5.2, which correspond to
calcite seawater, a boundary seawater, and aragonite seawater, respectively. Growth
rates and calcification rates were determined for the algae through direct measurement;
CaCO3 polymorph mineralogy was determined through x-ray diffraction. Additionally,
thallus stiffnesses were calculated for the Penicillus capitatus specimens by subjecting
them to a hydraulic stress-strain biomechanical analysis.
2.2.2 Scleractinian corals
10
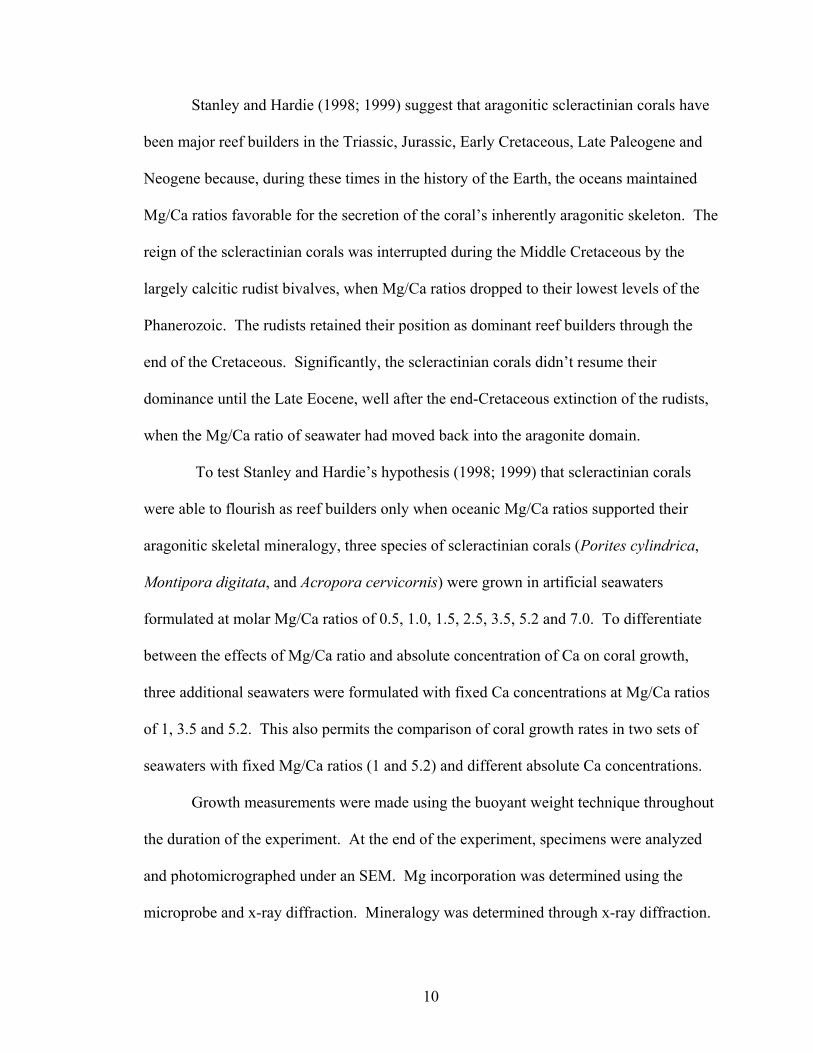
Stanley and Hardie (1998; 1999) suggest that aragonitic scleractinian corals have
been major reef builders in the Triassic, Jurassic, Early Cretaceous, Late Paleogene and
Neogene because, during these times in the history of the Earth, the oceans maintained
Mg/Ca ratios favorable for the secretion of the coral’s inherently aragonitic skeleton. The
reign of the scleractinian corals was interrupted during the Middle Cretaceous by the
largely calcitic rudist bivalves, when Mg/Ca ratios dropped to their lowest levels of the
Phanerozoic. The rudists retained their position as dominant reef builders through the
end of the Cretaceous. Significantly, the scleractinian corals didn’t resume their
dominance until the Late Eocene, well after the end-Cretaceous extinction of the rudists,
when the Mg/Ca ratio of seawater had moved back into the aragonite domain.
To test Stanley and Hardie’s hypothesis (1998; 1999) that scleractinian corals
were able to flourish as reef builders only when oceanic Mg/Ca ratios supported their
aragonitic skeletal mineralogy, three species of scleractinian corals (Porites cylindrica,
Montipora digitata, and Acropora cervicornis) were grown in artificial seawaters
formulated at molar Mg/Ca ratios of 0.5, 1.0, 1.5, 2.5, 3.5, 5.2 and 7.0. To differentiate
between the effects of Mg/Ca ratio and absolute concentration of Ca on coral growth,
three additional seawaters were formulated with fixed Ca concentrations at Mg/Ca ratios
of 1, 3.5 and 5.2. This also permits the comparison of coral growth rates in two sets of
seawaters with fixed Mg/Ca ratios (1 and 5.2) and different absolute Ca concentrations.
Growth measurements were made using the buoyant weight technique throughout
the duration of the experiment. At the end of the experiment, specimens were analyzed
and photomicrographed under an SEM. Mg incorporation was determined using the
microprobe and x-ray diffraction. Mineralogy was determined through x-ray diffraction.
11
2.2.3 Coralline red algae
Coralline red algae, and their purported calcifying ancestors, flourished during
Aragonite seas II and III, where they secreted primarily high-Mg calcite. Stanley and
Hardie (1998; 1999) predict that simple taxa which secrete high Mg-calcite in modern
seas (molar Mg/Ca ~5.2; Table 2-1) would have secreted low-Mg calcite in ancient seas
of lower Mg/Ca ratios.
To test this prediction, encrusting coralline red algae were grown over the range
of seawater Mg/Ca ratios believed to have occurred throughout their existence (Hardie
1996). The amount of Mg incorporated into their skeletal calcite was determined from the
d-spacing of their calcite crystal lattice, obtained through x-ray diffraction.
2.2.4 High-Mg Calcitic Animals
Stanley and Hardie (1998; 1999) hypothesize that organisms which secrete high
Mg-calcite in modern seas (molar Mg/Ca ~5.2; Table 2-1) would have secreted low-Mg
calcite in ancient seas of lower Mg/Ca ratios. Füchtbauer and Hardie (1976; 1980)
showed experimentally that the amount of magnesium incorporated into non-skeletal
calcite is proportional to the ambient Mg/Ca ratio as well as to the temperature of the
precipitating solution. Therefore, if simple organisms merely induce the precipitation of
calcite, one would expect such skeletal carbonate to behave the same as Füchtbauer and
Hardie’s non-skeletal calcite, with respect to the incorporation of Mg. The application of
this phenomenon to skeletal carbonates is further supported by Chave’s (1954) work
showing that the Mg/Ca ratio in the skeletons of many high-Mg calcite organisms is in
fact variable for a given organism, as it increases with ambient temperature.
12
Four animals which secrete high-Mg calcite in modern seas (the echinoid
Eucidaris tribuloides, the crab Perchon gibbesi, the shrimp Palaemonetes pugio and the
calcareous serpulid worm Hydroides crucigera) were grown in artificial seawaters
formulated at Mg/Ca ratios believed to have existed throughout the animals’ histories.
The Mg/Ca of the calcite secreted by the animals grown in the artificial seawaters was
determined using a microprobe. Mg fractionation curves were derived for the organisms
and the Mg content of fossil echinoderms was used to reconstruct oceanic Mg/Ca
throughout the Phanerozoic.
Chave (1954) also showed that the effect of temperature on skeletal Mg is greatest
for taxonomically simple organisms. The experiments presented here test whether the
effect of seawater Mg/Ca on skeletal Mg incorporation is comparably related to
taxonomic complexity.
13
2.3 Figures and tables
Figure 2-1. Synchronized shifts in the mineralogy of dominant hypercalcifying
organisms (Stanley and Hardie 1998, 1999), marine evaporites (Hardie 1996),
nonskeletal carbonates (Sandberg 1983), and the Mg/Ca ratio and absolute Ca
concentration of seawater (Hardie 1996) throughout the Phanerozoic. From Stanley and
Hardie (1999).
14
Table 2-1. Calcitic organisms which incorporate a relatively large component of Mg into
their skeletons in modern seas. Skeletal mMg/Ca is the molar ratio (Chave 1954; Scholle
1978).
15
3 Background
3.1 Skeletal carbonates follow non-skeletal trend
Stanley and Hardie (1998; 1999) found that the carbonate mineralogy of simple,
hypercalcifying organisms has varied in concert with Sandberg’s (1983) aragonite and
calcite seas over the Phanerozoic. This synchronicity is most evident in the reef building
and sediment producing taxa. To avoid confusion, Sandberg’s three aragonite sea
intervals will be referred to as Aragonite I, II and III and his two calcite sea intervals will
be referred to as Calcite I and II.
Stanley and Hardie (1998; 1999) suggest that certain taxa have been able to
function as major reef builders and sediment producers only when their mineralogy is
favored by the Mg/Ca ratio of seawater (Figure 2-1). In Calcite I (early-middle
Paleozoic), calcitic tabulate, heliolitid and rugose corals, and stromatoporoids (possibly
calcitic) were the dominant reef builders, while receptaculitids (possibly calcitic) were
the dominant sediment producers. As the Mg/Ca ratio increased in the middle
Mississippian to cause the onset of Aragonite II (late Paleozoic-early Mesozoic),
aragonitic groups of sponges, scleractinian corals and phylloid algae, and high-Mg
calcitic red algae, became major reef builders, while aragonitic dasycladaceans were
important algal sediment producers The Mg/Ca ratio then dropped again in the mid-
Jurassic, shifting the marine realm to Calcite II (middle Jurassic-late Paleogene). During
the peak of Calcite II (highest Ca2+ concentrations) in the mid-Cretaceous, the largely
calcitic rudist bivalves replaced the aragonitic scleractinian corals as major reef builders,
while calcitic nannoplankton (coccolithophores) became important chalk producers.
Furthermore, as the absolute concentration of Ca2+ fell during the Cenozoic, the

16
morphology of individual coccoliths became less robustly calcified (Stanley and Hardie
1998, 1999). The most recent increase in seawater Mg/Ca, occurring in the late
Paleogene, has advanced the oceans into Aragonite III, where aragonitic scleractinian
corals and high-Mg calcitic red algae once again dominate reef construction and
aragonitic green algae, such as Halimeda, Penicillus, and Udotea, control sediment
production.
Stanley and Hardie (1998; 1999) investigated mineralogical trends in organisms
which were hypercalcifiers and/or exhibited weak control over their calcification.
Hypercalcifying organisms, defined either as individuals which produce massive calcium
carbonate skeletons (usually of a higher taxa) or populations which produce excessive
calcium carbonate material (e.g., reefs or sediment producers), probably require favorable
seawater chemistry (i.e., Mg/Ca ratios which support their inherent mineralogy) to
hypercalcify. Since hypercalcification is typically a warm-water phenomenon, most of
the organisms analyzed in this study are warm-adapted taxa. Organisms which exhibit
only minor control over their calcification, typically taxonomically simple organisms, are
also most likely to require favorable seawater chemistry to calcify. For example, Chave
(1954) showed that the degree of correlation between skeletal Mg/Ca and temperature is
inversely related to biological complexity. Therefore, one would expect the relationship
between calcification rate and seawater Mg/Ca to be comparably linked to biological
complexity.
Van de Poel and Schlager (1994) had previously recognized a weak
correspondence between skeletal and non-skeletal carbonates over the Mesozoic-
Cenozoic interval. However, they were unable to illustrate that the shifts they observed
17
were first-order changes in primary skeletal mineralogy, rather than second order
oscillations imprinted upon Sandberg’s (1975) one-time unidirectional shift from calcite
to aragonite seas. Stanley and Hardie (1998; 1999) suggest the reason Van de Poel and
Schlager’s skeletal data reveal only a weak correspondence with the non-skeletal data is
because the former included the skeletal remains of taxa whose biomineralization is not
strongly influenced by seawater chemistry, such as foraminifera and mollusks.
Sandberg (1975) originally suggested that the Phanerozoic Eon exhibited only a
single transition (now known to be incorrect) from “calcite seas” to “aragonite seas,”
which occurred during the Cenozoic Era. Milliken and Pigott (1977) pointed to a similar
shift during the Carboniferous. Wilkinson (1979), using the relative diversities and
biomasses of various taxa, suggested a corresponding one-time shift in the dominant
mineralogy of calcareous marine organisms. However, Wilkinson’s erroneous
mineralogical assessments of several groups of organisms and failure to distinguish
between high-Mg and low-Mg calcite rendered his conclusions invalid.
3.2 Cause of calcite-aragonite seas: Mg/Ca ratio vs. pCO2
Sandberg (1975) suggested that his observed single shift from calcite to aragonite
seas was caused by an increase in the Mg/Ca ratio of seawater in the Mesozoic, which
had resulted from the selective removal of calcium ions from the ocean via flourishing
calcareous nannoplankton and planktonic foraminifera. As more ancient oolite and early
marine cement data became available, Sandberg abandoned the single-shift hypothesis in
favor of the currently accepted four-fold shift in carbonate mineralogy, consisting of 3
aragonite intervals (Late Precambrian to Early Cambrian; Late Mississippian to Late
Triassic/Early Jurassic; Early/Middle Cenozoic to the present) and two calcite intervals

18
(Cambrian to Late Mississippian; Late Triassic/Early Jurassic to Early/Middle Cenozoic)
(Sandberg 1983; Lasemi and Sandberg 2000). This oscillating trend in carbonate
mineralogy also caused him to abandon his hypothesis that Mg/Ca ratios have been
driven by planktonic removal of calcium ions in favor of Mackenzie and Pigott’s (1981)
hypothesis that the observed mineralogical shifts were driven by tectonically induced
shifts in atmospheric pCO2.
However, the pCO2 hypothesis is problematic given that the range of pCO2 values
required to cause the calcite-aragonite saturation conditions necessary to precipitate the
observed distribution of calcite and aragonite seas would have had to have been an order
of magnitude greater than the pCO2 of today (Stanley and Hardie 1998, 1999). Estimates
from computer modeling (Berner 1997) and from isotopic evidence from biomarkers
(Freeman and Hayes 1992) and pedogenic carbonates (Ehrlinger 1995) suggest pCO2
values were only twice that of modern values during the necessary intervals.
Furthermore, the rate of ocean crust production is probably not a first order control of
atmospheric pCO2 (Berner 1997). Therefore, it seems unlikely that atmospheric pCO2
could be the link explaining the synchronicity of carbonate mineralogy and rates of ocean
crust production (inferred from first order changes in eustatic sea level).
3.3 Seawater Mg/Ca ratio controls CaCO3 polymorph: experimental work
Experimental work by Leitmeier (1910; 1915), Lippman (1960), Müller et al.
(1972) and Folk (1974) have shown that the precipitation of aragonite and high-Mg
calcite rather than calcite is caused by elevated concentrations on Mg2+. Füchtbauer and
Hardie (1976; 1980) showed that in laboratory experiments on the system MgCl2—
CaCl2—Na2CO3—H2O, the precipitation of calcite versus high-Mg calcite and aragonite

19
is determined by the solution’s Mg/Ca ratio, ionic strength and temperature (Figure 3-1).
The experiments yielded an Mg/Ca mole ratio value of ~2 (± 0.5) as the boundary
between the low-Mg calcite (molar Mg/Ca < 0.04) and aragonite + high-Mg calcite
(molar Mg/Ca > 0.04) nucleation fields for chloride solutions under laboratory conditions
approximating modern values of ionic strength (I = 0.7), temperature (28ºC), pressure (1
atm total pressure) and atmospheric pCO2. Morse et al. (1997) have subsequently shown
that for temperatures between 6º and 35ºC, the carbonate polymorph precipitated (calcite
vs. aragonite + high-Mg calcite) will be determined by the Mg/Ca ratio of the solution,
rather than atmospheric pCO2. These results are in excellent agreement with Müller et
al.’s (1972) carbonate nucleation fields (Mg/Ca vs. salinity) that were determined from
observations of natural lakes.
Experiments have also shown that the percentage of Mg incorporated into non-
skeletal calcite precipitates increases in proportion to both the Mg/Ca ratio and
temperature of the solution (Kitano and Kanamori 1966; Glover and Sippel 1967; Katz
1973; Füchtbauer and Hardie 1976; 1980; Devery and Ehlmann 1981; Mucci and Morse
1983; Rimstidt et al. 1998) Rushdi et al. (1992) also suggest that low-Mg calcite is
favored for molar Mg/Ca ratios less than 2.
3.4 Carbonate precipitate and marine evaporite synchronicity
Hardie (1996) observed that the timing of Sandberg’s transitions between
aragonite and calcite seas are in phase with transitions between MgSO4 and KCl marine
evaporites, respectively, throughout the Phanerozoic. Hardie concluded that the
synchronicity of these mineralogical shifts must have been caused by shifts in seawater
chemistry which would have influenced both carbonate precipitates and marine
20
evaporites simultaneously. Atmospheric pCO2 does not explain the parallel
mineralogical shifts because (1) it is unlikely, though not impossible, that pCO2 values
ever reached the 10-fold increase from current conditions necessary to control the
mineralogy of carbonates and (2) pCO2 cannot control the mineralogy of marine
evaporites.
3.5 Ocean crust production controls oceanic Mg/Ca ratio
Spencer and Hardie (1990) showed that the natural factors which control seawater
chemistry are river water (input), mid-ocean ridge hydrothermal brine (input), CaCO3
precipitation (output) and SiO2 precipitation (output) (Figure 3-2). Using mid-ocean
ridge/river water flux ratios to calculate ancient seawater chemistry, Spencer and Hardie
showed that small changes in the mid-ocean ridge flux can cause changes in the Mg/Ca,
Na/K and Cl/SO4 ratios of seawater that could result in the observed synchronized shifts
in limestone and marine evaporite mineralogy.
Hardie (1996) later proposed that such minor changes in mid-ocean ridge flux
could be caused by changes in the rate of ocean crust production. Mid-ocean ridge basalt
is converted to greenstone as it comes in contact with brine, thereby releasing Ca2+ and
K2+ to the seawater and removing Mg2+ and SO42- from it. Therefore, the mid-ocean
ridges act as massive ion exchange systems where high rates of ocean crust production
result in relatively high concentrations of Ca2+ and low concentrations of Mg2+ in
seawater (low Mg/Ca ratios). Using historical rates of ocean crust production (inferred
from first order eustatic sea level changes), Hardie (1996) used his ocean chemistry
model to predict ancient Mg/Ca ratios. The combination of these historical Mg/Ca values
with Füchtbauer and Hardie’s (1976; 1980) experimentally determined carbonate
21
polymorph nucleation fields predicts a pattern of aragonite and calcite seas over the
Phanerozoic which closely resembles Sandberg’s (1983) pattern observed in the geologic
record.
Hardie’s (1996) Phanerozoic Mg/Ca curve can also be combined with
empirically derived brine evaporite models to predict a temporal pattern of late stage
evaporites over the Phanerozoic (Figure 2-1). Elevated rates of ocean crust production,
which cause gypsum stage CaCl2 brines, would result in the dominance of KCl late stage
evaporites. Depressed rates of ocean crust production, which cause gypsum stage MgSO4
brines, would result in the dominance of MgSO4 late stage evaporites. Hardie’s model
predicts a pattern of late stage marine evaporites which agrees very well with the pattern
observed in the rock record over the Phanerozoic. The ability of the model to predict the
synchronized variation in the mineralogies of both late stage marine evaporites as well as
non-skeletal and skeletal carbonates suggests that the principal assumptions of the model
are correct. Hardie’s model of oceanic Mg/Ca is further supported by the empirical
record of oceanic Mg/Ca ratios derived from fluid inclusions (Lowenstein et al. 2001;
Lowenstein et al. 2003; Figure 3-3) and Br (Siemann 2003) in marine halite and the
skeletal Mg/Ca ratios of fossil echinoderms (Dickson 2002, 2004).
3.6 Previous work on seawater Mg/Ca and calcareous biomineralization
3.6.1 Effect of seawater Mg/Ca on the calcification and growth of the codiacean alga
Halimeda incrassata (Stanley et al. in preparation)
The Halimeda alga, like Penicillus and Udotea, has flourished over the last 30
million years and been a major carbonate sediment producer in shallow tropical seas.
Stanley and Hardie (1998; 1999) assert that the success of the Halimeda algae over this
22
interval was initiated and sustained by the molar Mg/Ca ratio of seawater rising above
two in the Oligocene and then remaining in the aragonite/high-Mg calcite nucleation field
through to the present. Experiments were conducted to evaluate the effect of ambient
Mg/Ca on the calcification rate, primary productivity and the linear growth rate of the
eco- and geologically important Halimeda alga (Stanley et al. in preparation).
The Halimeda incrassata algae were collected from the Florida Bay and the back-
reef lagoon of Caye Caulker, Belize. Sixty young, comparably-sized specimens were
grown for 80 days in three artificial seawater treatments (twenty specimens in each
treatment) formulated at molar Mg/Ca ratios of 1.0, 2.5, and 5.8, corresponding to
seawater chemistries which have existed throughout the Phanerozoic (Hardie 1996). All
other variables, including the sum of the molar concentrations of Mg and Ca, were held
constant among the aquaria. The experimental conditions were identical to those
employed in the previously discussed experiments on Penicillus and Udotea.
Calcification and primary production rates were calculated from the seven most
recently-produced daily growth segments of each alga, at the end of the eighty-day
experiment. These segments, when analyzed in sequence, provide a seven-day time
series of calcification and productivity for the alga. The growth segments were
desiccated in an oven at 100º C for four hours, after which their dry masses were
determined. The organic matter in the specimens was then combusted at 400 ºC for four
hours. The remaining CaCO3 material was then measured and recorded as the gross
calcification. The difference between their original dry mass and their gross calcification
was recorded as their gross primary production (i.e., amount of organic material removed
via combustion). The ages (in days) of the growth segments were plotted against their
23
respective gross calcification (Figure 3-4) and gross primary production (Figure 3-5).
The slopes of the least squares linear regressions through the calcification and primary
production time-series represents the rates of calcification and primary production for an
idealized growth segment over their initial seven days of growth. The algae were
photographed weekly throughout the eighty-day duration of the experiment. Linear
growth rates were determined from the series of photographs (Figure 3-6).
The highest rate of calcification (1.225 ± 0.086 mg/d; Figure 3-4, Appendix A),
primary production (0.339 ± 0.006 mg/d; Figure 3-5, Appendix A), and linear growth
(0.97 ± 0.09 mm/d; Figure 3-6, Appendix B) occurred in the artificial aragonite seawater
of molar Mg/Ca = 5.2. Significantly slower (p < 0.01) rates of calcification (0.375 ±
0.043 mg/d; Figure 3-4), primary production (0.135 ± 0.012 mg/d; Figure 3-5) and linear
growth (0.24 ± 0.05 mm/d; Figure 3-6) were observed in the boundary seawater of molar
Mg/Ca = 2.5. No calcification or growth of the Halimeda specimens occurred in the
artificial calcite seawater of molar Mg/Ca = 1.0, as they all died during the experiment.
Photographs of the specimens in the three artificial seawater treatments, taken after just
30 days of growth, illustrate the effect of ambient Mg/Ca on the algae (Figure 3-7).
The experiments suggest that Halimeda algae calcify slower in the boundary and
calcitic seawaters because the Mg/Ca ratios of these seawaters do not support the abiotic
precipitation of the algae’s inherently aragonitic mineralogy. However, this does not
explain why primary productivity and linear growth rates would have also decreased.
The answer may concern CO2. The precipitation of CaCO3 releases CO2 to the seawater
adjacent to the algae. It has been suggested that this CO2 fertilizes the photosynthesis and
growth of the algae. Therefore, reduced rates of calcification would result in the reduced

24
liberation of CO2 which would slow the algae’s rate of photosynthesis, resulting in the
observed reductions in primary production and linear growth.
The results of these experiments support Stanley and Hardie’s (1998; 1999)
hypothesis that the dominant ecological and sedimentological roles of these codiacean
algae in Recent tropical seas is due to the Mg/Ca ratio of seawater supporting the algae’s
aragonitic mineralogy during this time. It appears that producing aragonite in calcite
seawater would have reduced the competitiveness of these algae, via reduced growth
rates, made them more susceptible to predation, via reduced calcification and stiffness,
and reduced their overall contribution to carbonate sedimentation.
3.6.2 Effect of Mg/Ca ratio on the growth and calcification of coccolithophores
(Stanley et al. in press)
Stanley and Hardie (1998; 1999) have attributed the massive, coccolithic chalk
deposits of the Late Cretaceous (Hattin 1988) to the low oceanic Mg/Ca ratios (Hardie
1996) shown to have existed during that time, which would have naturally favored the
calcitic mineralogy of the coccolithophores. Experiments have been conducted to
evaluate the effect of ambient Mg/Ca on the geochemistry (skeletal Mg/Ca ratio),
calcification and growth rate of these calcifying nannoplankton (Stanley et al. in press).
Coccolithophore strains (CCMP645, CCMP2119, CCMP298) of Pleurochrysis
carterae, Ochrosphaera neopolitana, and Cruciplacolithus neohelis were acquired from
the Provasoli-Guillard National Center for Culture of Marine Phytoplankton (P-G
CCMP). The cultures were each grown for 15 days in 500 mL artificial seawaters
(contained in 1 L beakers) formulated at molar Mg/Ca ratios of 0.5, 1.0, 1.5, 2.5, 3.5, and
5.2, thereby encompassing the range of values (Hardie 1996) believed to have existed
25
throughout the coccolithophores' existence. To differentiate between the effects of
Mg/Ca ratio and absolute concentration of Ca on the coccolithophores, three additional
seawaters were formulated with fixed Ca concentrations at Mg/Ca ratios of 1, 3.5 and 5.2.
The basic seawater composition, excluding variations in Mg and Ca, was
formulated at modern values (Bidwell and Spotte 1985). The sum of the molar
concentrations of Mg and Ca in each treatment was equal to that of modern seawater,
except for those with fixed Ca concentrations, in which cases the salinities of these
seawaters were maintained at modern values by adjusting the NaCl concentration.
Each beaker was irradiated with a single 120V, 25-watt aquarium lamp at an
elevation of 15 cm above the surface of the water. The beakers were partially immersed
in a freshwater bath maintained at 25 ± 0.5º C by three electrical heaters and kept in
circulation by aeration. The Pleurochrysis carterae and Cruciplacolithus neohelis
cultures were fertilized with 8.8 x 10⁻⁴ moles/L nitrogen (as nitrate), 2.3 x 10⁻⁴ moles/L
phosphorus (as phosphate), and 1.45 x 10⁻⁵ moles/L iron (as Fe3+), as specified by the P-
G CCMP f/2 culture medium. The Ochrosphaera neopolitana culture was fertilized with
3.5 x 10⁻⁵ moles/L nitrogen (as nitrate), 9.2 x 10⁻⁶ moles/L phosphorus (as phosphate),
and 5.8 x 10⁻⁷ moles/L iron (as Fe3+), as specified by the P-G CCMP f/50 culture
medium.
Population densities of the cultures were measured daily over the initial 6-7 day
period of exponential population growth. 15 mL of artificial seawater was removed from
the upper portion of the solution after gentle stirring with a sterilized glass rod had
homogenized the culture. The density of the culture population was measured with a
26
Hach 2100P turbidimeter. The sample was then returned to the beaker. The turbidimeter
was calibrated (linearly) with hemocytometer counts at different population densities.
At the completion of the experiments, the cultures were concentrated by
centrifuge and washed four times (10 s each time) in a 50:50 ethyl alcohol:distilled water
solution. The alcohol from the suspended culture was then removed through evaporation
in a drying oven at 100º C over a 2 h period, and the residual chalk was weighed.
The Mg/Ca ratio of the calcite secreted by the coccolithophores was determined
through EDS analysis by a JEOL 8600 Superprobe microprobe (beam current = 0.02 µÅ;
accelerating potential = 15 kV; count time = 15s; beam diameter = 1-2 µm).
Photomicrographs of the coccolithophores were also obtained in the SEM.
Coccolithophore populations were washed four times (10 s each time) in a 50:50 ethyl
alcohol:distilled water solution, allowed to dry on cylindrical carbon SEM mounts, and
then carbon coated in preparation for SEM/microprobe analysis.
Exponential growth curves were fitted to the population data using a least squares
regression (Figure 3-8, Figure 3-9, Appendix C). The exponents in the functions which
define these growth curves are the cultures’ exponential rates of population growth.
These growth rates are plotted against the Mg/Ca ratio of the seawater in which the
cultures were grown (Figure 3-10, Appendix C).
The rate of population growth for each of the three species of coccolithophore
was greatest in the artificial seawaters which favored the nucleation of calcite (molar
Mg/Ca < 2) and least in the artificial seawater which favored the nucleation of aragonite
+ high-Mg calcite (molar Mg/Ca > 2) (Figure 3-10). In fact, the rate of population
growth systematically decreased as the Mg/Ca ratio of the ambient seawater increased.
27
Experiments which held the Mg/Ca ratio constant over varying Ca concentrations (Figure
3-9A, B), and the concentration of Ca constant over varying Mg/Ca ratios (Figure 3-9C,
D), revealed that population growth rates increase with increasing absolute
concentrations of Ca, as well as with decreasing ambient Mg/Ca ratios.
Chalk production significantly increased as the Mg/Ca of the ambient SW
decreased (Figure 3-11, Appendix D), thereby producing the greatest amount of chalk in
the artificial calcite seawater, which is believed to have characterized the late Cretaceous,
when coccolithophores were producing massive chalk deposits. These results are
consistent with the population data obtained from the daily turbidimeter measurements
(Figure 3-10).
SEM photomicrographs revealed more heavily calcified coccoliths for
coccolithophores grown in the low Mg/Ca seawater treatments, which kinetically favor
the nucleation of the coccolithophores' inherently calcitic skeleton (Figure 3-12). Such
an increased rate of calcification liberates more CO2, which probably stimulates
photosynthesis by the coccolithophores, thereby resulting in the elevated growth rates
observed in the artificial seawaters favoring the precipitation of the algae’s inherently
calcitic skeleton.
The Mg/Ca ratios of the calcitic coccoliths secreted by the Pleurochrysis carterae
and Ochrosphaera neopolitana (Figure 3-13B, C, Appendix E) coccolithophores were
directly correlated with the Mg/Ca ratio of their ambient seawater. The Cruciplacolithus
neohelis coccolithophores, however, produced low-Mg calcite regardless of their ambient
Mg/Ca (Figure 3-13A, Appendix E). These results are particularly intriguing given that

28
all coccolithophores are conventionally believed to secrete exclusively low-Mg calcite in
modern seas.
The results of these experiments show that for three species of extant
coccolithophores, rates of calcification and growth are limited by the Mg/Ca ratio and
absolute Ca concentration of the ambient seawater. It appears that the increased rate of
calcification in the low Mg/Ca and high Ca seawater conditions releases more CO2 which
stimulates photosynthesis in the algae, thereby resulting in the concomitant increases in
population growth rates. Furthermore, two of the three species of coccolithophores
incorporated Mg into their calcitic coccoliths in proportion to the Mg/Ca ratio of the
seawater in which they were grown. While these coccolithophores are able to dictate the
precipitation of intricately structured calcitic coccoliths, their mineralogical control
appears to be limited in its capacity to control Mg-incorporation in the calcite crystal
lattice. The third species, however, which precipitates low-Mg calcite regardless of
ambient Mg/Ca, is apparently able to regulate such Mg incorporation.
These results support the assertions that: (1) the low Mg/Ca ratio and high Ca
concentration of Cretaceous seawater enabled coccolithophores to produce massive chalk
deposits during this time and, conversely, (2) the high Mg/Ca ratio and low Ca
concentration of modern seawater prevents chalk production by most extant species
(Stanley and Hardie 1998, 1999). Furthermore, the correlation between skeletal Mg/Ca
and ambient Mg/Ca for two of the three species of coccolithophores suggests that the
mineralogy (low-Mg calcite vs. high-Mg calcite) of many of these calcareous
nannoplankton has varied significantly throughout their geological history.
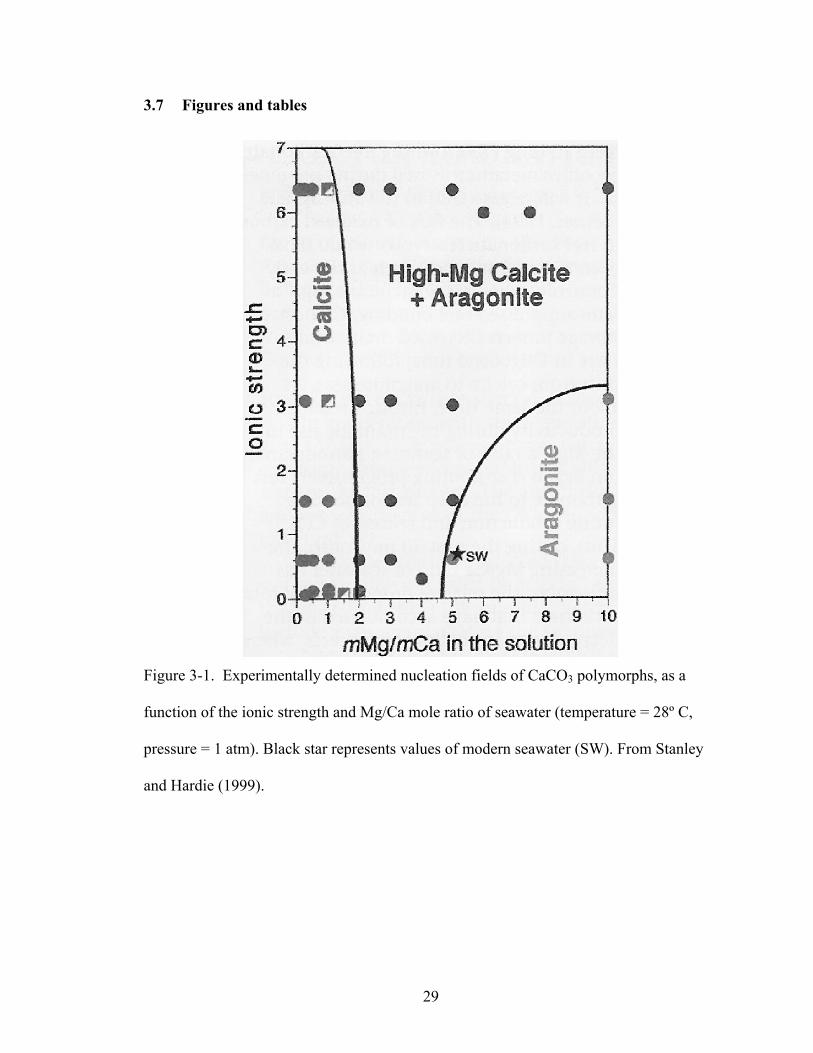
29
3.7 Figures and tables
Figure 3-1. Experimentally determined nucleation fields of CaCO3 polymorphs, as a
function of the ionic strength and Mg/Ca mole ratio of seawater (temperature = 28º C,
pressure = 1 atm). Black star represents values of modern seawater (SW). From Stanley
and Hardie (1999).

30
Figure 3-2. Effect of changes in the rate of ocean crust production on global sea level,
the flux of MOR hydrothermal brine, and the chemistry of seawater as predicted by
Spencer and Hardie (1990) and Hardie (1996). A, high rate of ocean crust production; B,
low rate of ocean crust production. Dark arrows are MOR brine paths; gray arrows are
directions of seafloor spreading (thickness of arrows is proportional to magnitude of
process; not to scale). From Stanley and Hardie (1999).

31
Figure 3-3. Molar Mg/Ca ratios derived from fluid inclusions in ancient halite crystals.
The fluid inclusion data confirm the historical oceanic Mg/Ca values predicted by
Hardie’s (1996) mid-ocean ridge hydrothermal brine/river water flux model. From
Lowenstein et al. (2001).
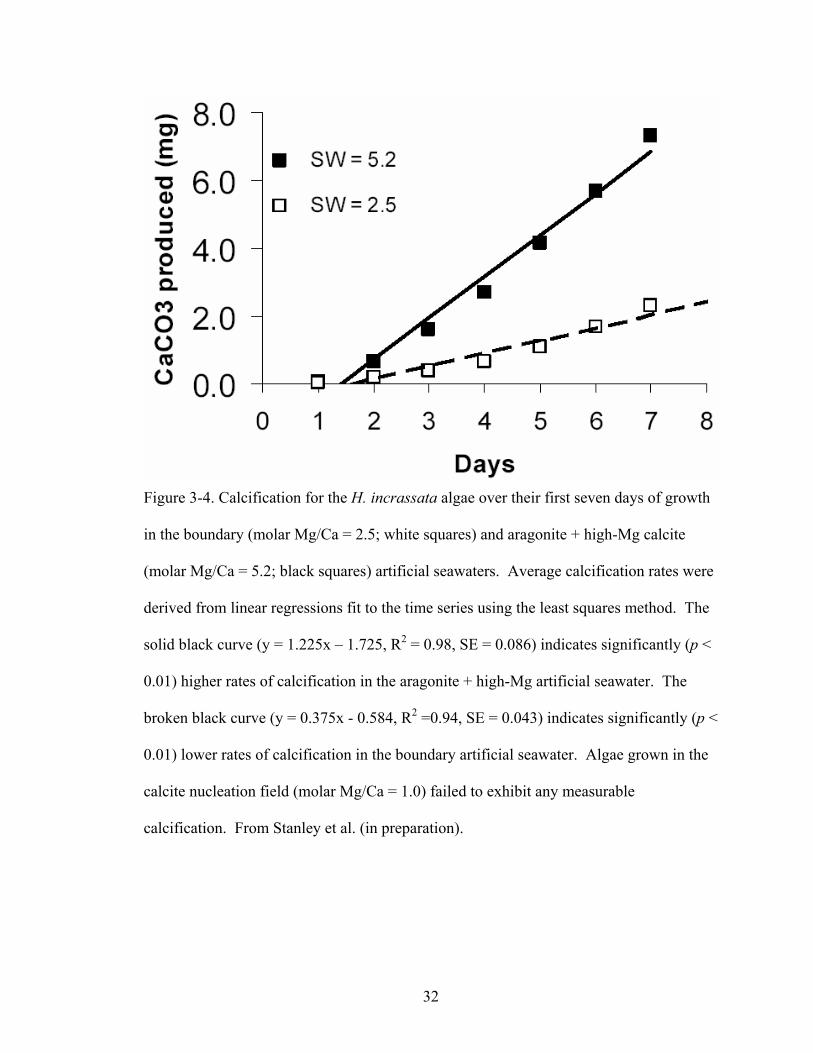
32
Figure 3-4. Calcification for the H. incrassata algae over their first seven days of growth
in the boundary (molar Mg/Ca = 2.5; white squares) and aragonite + high-Mg calcite
(molar Mg/Ca = 5.2; black squares) artificial seawaters. Average calcification rates were
derived from linear regressions fit to the time series using the least squares method. The
solid black curve (y = 1.225x – 1.725, R2 = 0.98, SE = 0.086) indicates significantly (p <
0.01) higher rates of calcification in the aragonite + high-Mg artificial seawater. The
broken black curve (y = 0.375x - 0.584, R2 =0.94, SE = 0.043) indicates significantly (p <
0.01) lower rates of calcification in the boundary artificial seawater. Algae grown in the
calcite nucleation field (molar Mg/Ca = 1.0) failed to exhibit any measurable
calcification. From Stanley et al. (in preparation).
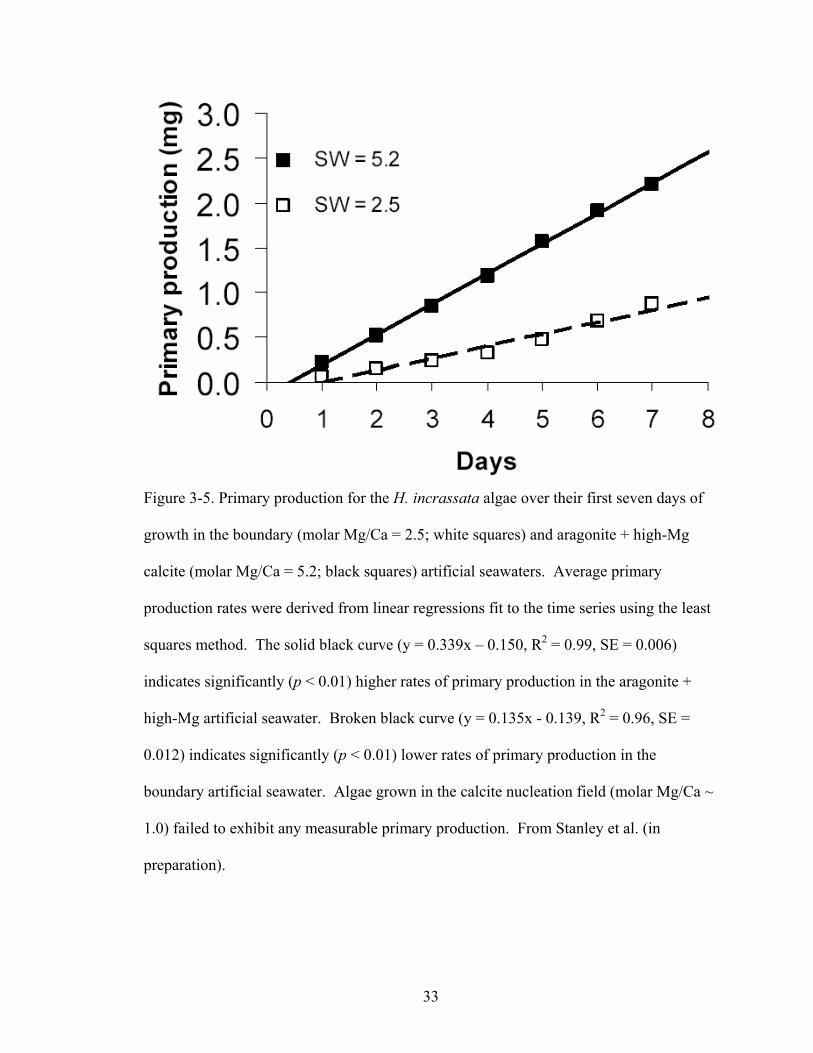
33
Figure 3-5. Primary production for the H. incrassata algae over their first seven days of
growth in the boundary (molar Mg/Ca = 2.5; white squares) and aragonite + high-Mg
calcite (molar Mg/Ca = 5.2; black squares) artificial seawaters. Average primary
production rates were derived from linear regressions fit to the time series using the least
squares method. The solid black curve (y = 0.339x – 0.150, R2 = 0.99, SE = 0.006)
indicates significantly (p < 0.01) higher rates of primary production in the aragonite +
high-Mg artificial seawater. Broken black curve (y = 0.135x - 0.139, R2 = 0.96, SE =
0.012) indicates significantly (p < 0.01) lower rates of primary production in the
boundary artificial seawater. Algae grown in the calcite nucleation field (molar Mg/Ca ~
1.0) failed to exhibit any measurable primary production. From Stanley et al. (in
preparation).
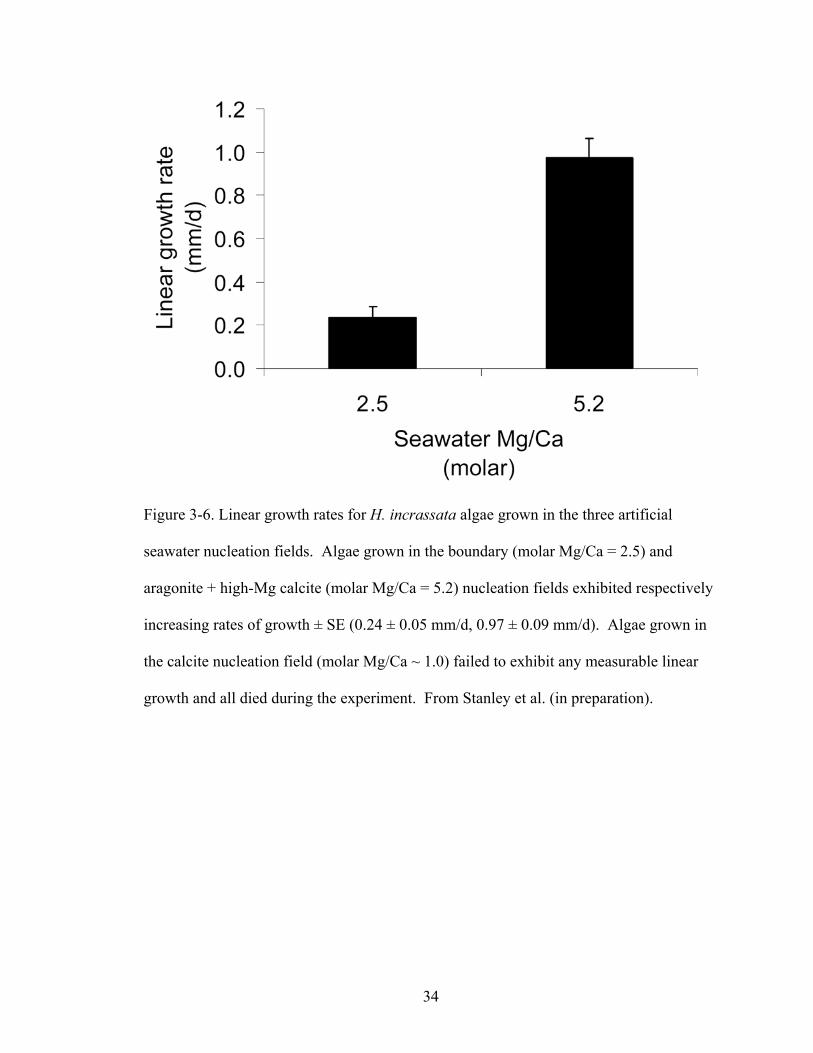
34
Figure 3-6. Linear growth rates for H. incrassata algae grown in the three artificial
seawater nucleation fields. Algae grown in the boundary (molar Mg/Ca = 2.5) and
aragonite + high-Mg calcite (molar Mg/Ca = 5.2) nucleation fields exhibited respectively
increasing rates of growth ± SE (0.24 ± 0.05 mm/d, 0.97 ± 0.09 mm/d). Algae grown in
the calcite nucleation field (molar Mg/Ca ~ 1.0) failed to exhibit any measurable linear
growth and all died during the experiment. From Stanley et al. (in preparation).
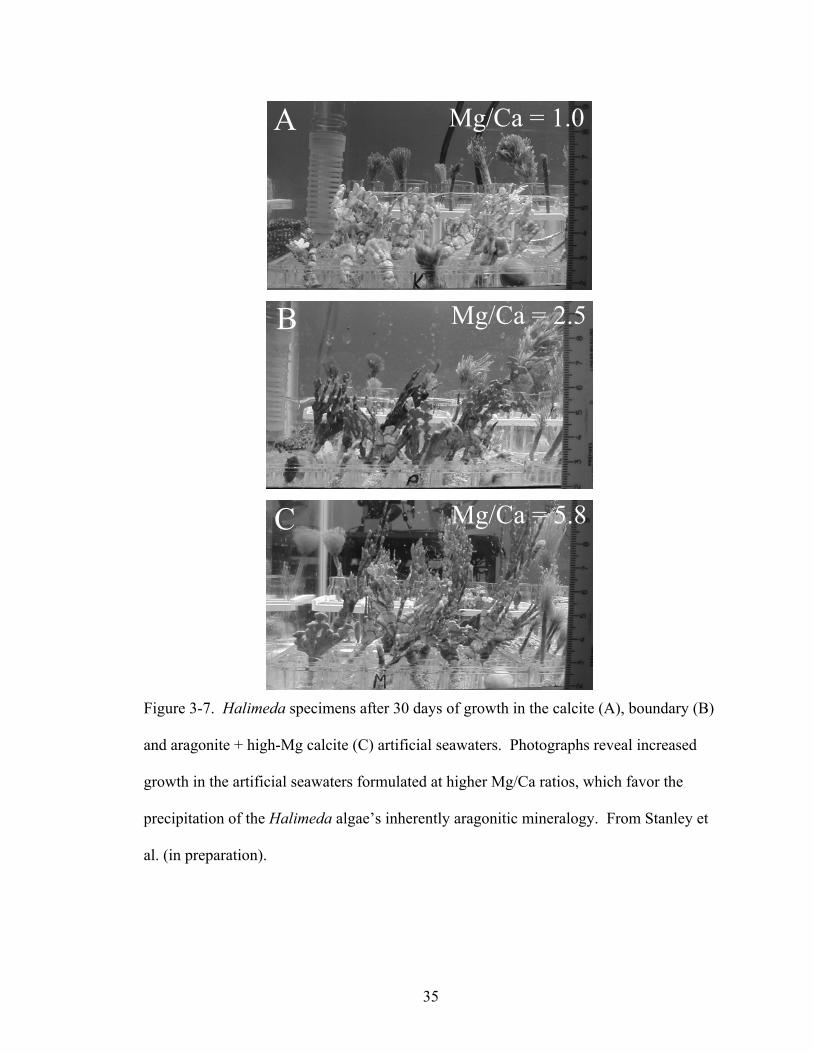
35
Figure 3-7. Halimeda specimens after 30 days of growth in the calcite (A), boundary (B)
and aragonite + high-Mg calcite (C) artificial seawaters. Photographs reveal increased
growth in the artificial seawaters formulated at higher Mg/Ca ratios, which favor the
precipitation of the Halimeda algae’s inherently aragonitic mineralogy. From Stanley et
al. (in preparation).
Mg/Ca = 1.0 A
Mg/Ca = 2.5 B
Mg/Ca = 5.8 C
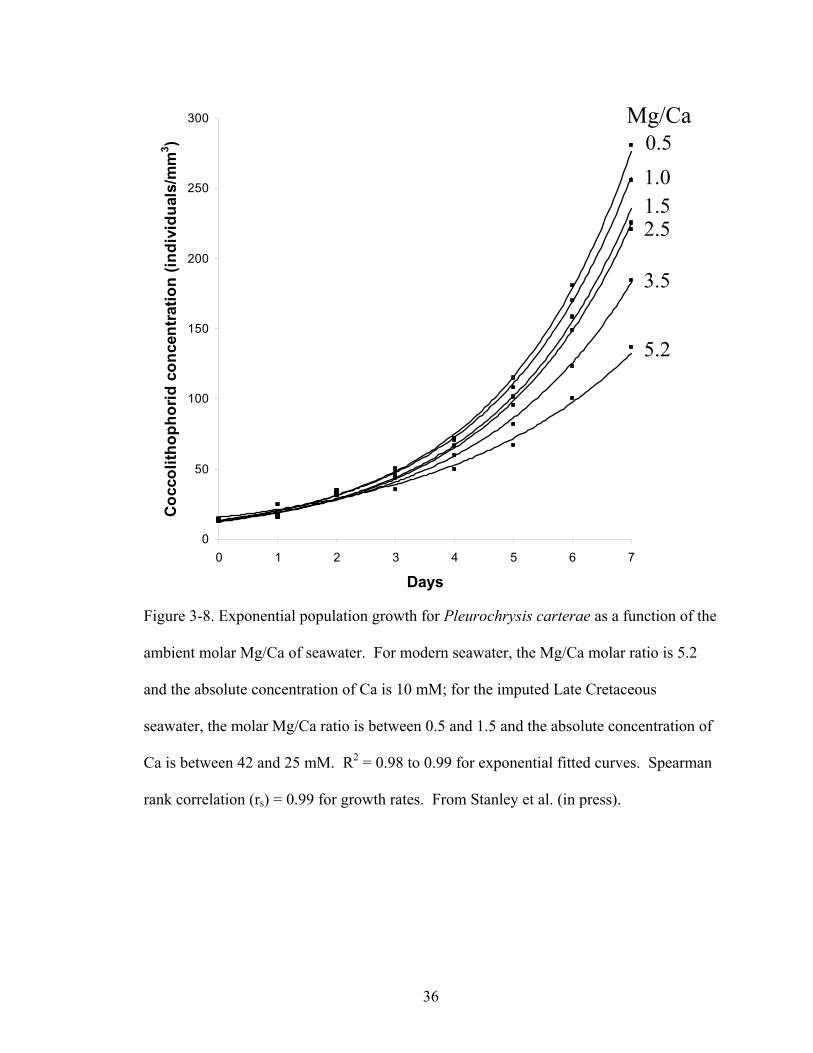
36
Figure 3-8. Exponential population growth for Pleurochrysis carterae as a function of the
ambient molar Mg/Ca of seawater. For modern seawater, the Mg/Ca molar ratio is 5.2
and the absolute concentration of Ca is 10 mM; for the imputed Late Cretaceous
seawater, the molar Mg/Ca ratio is between 0.5 and 1.5 and the absolute concentration of
Ca is between 42 and 25 mM. R2 = 0.98 to 0.99 for exponential fitted curves. Spearman
rank correlation (rs) = 0.99 for growth rates. From Stanley et al. (in press).
0
50
100
150
200
250
300
0 1 2 3 4 5 6 7
Days
Coc
colit
hoph
orid
con
cent
ratio
n (in
divi
dual
s/m
m3 ) 0.5
1.01.52.5
3.5
5.2
Mg/Ca
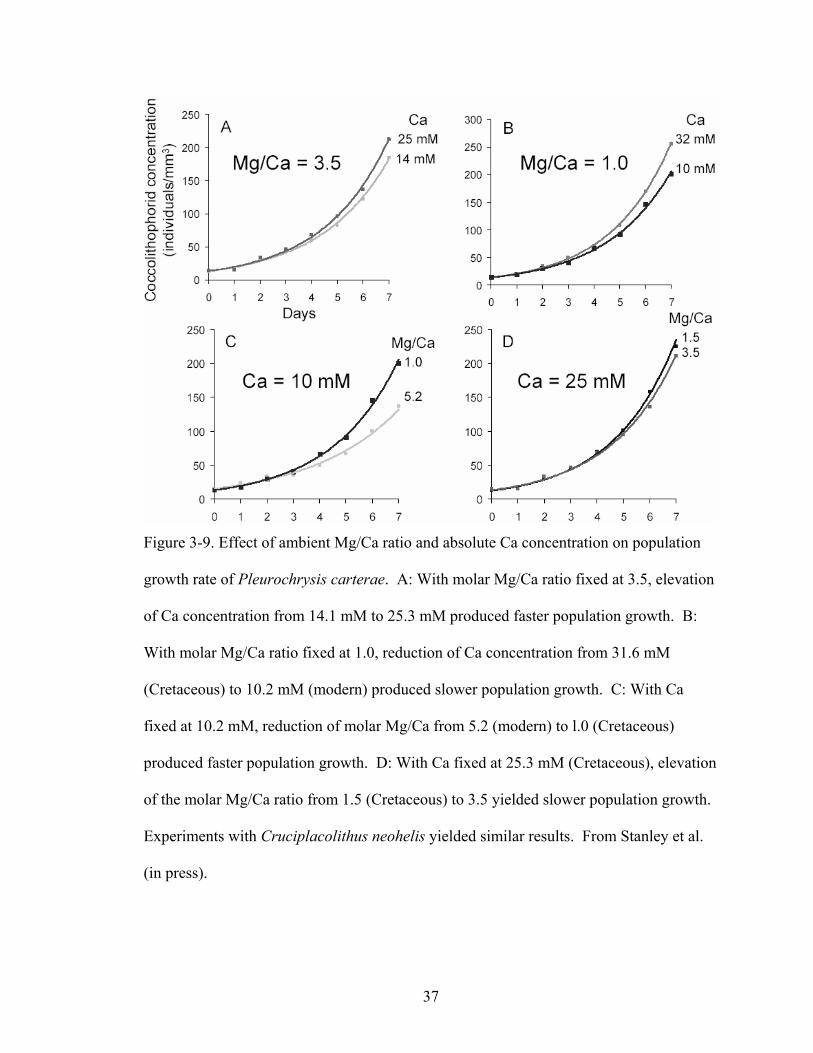
37
Figure 3-9. Effect of ambient Mg/Ca ratio and absolute Ca concentration on population
growth rate of Pleurochrysis carterae. A: With molar Mg/Ca ratio fixed at 3.5, elevation
of Ca concentration from 14.1 mM to 25.3 mM produced faster population growth. B:
With molar Mg/Ca ratio fixed at 1.0, reduction of Ca concentration from 31.6 mM
(Cretaceous) to 10.2 mM (modern) produced slower population growth. C: With Ca
fixed at 10.2 mM, reduction of molar Mg/Ca from 5.2 (modern) to l.0 (Cretaceous)
produced faster population growth. D: With Ca fixed at 25.3 mM (Cretaceous), elevation
of the molar Mg/Ca ratio from 1.5 (Cretaceous) to 3.5 yielded slower population growth.
Experiments with Cruciplacolithus neohelis yielded similar results. From Stanley et al.
(in press).

38
Figure 3-10. Exponential rates of population growth (r) as a function of ambient Mg/Ca
ratio and absolute concentration of Ca in seawater for the coccolithophore species
Pleurochrysis carterae (A), Ochrosphaera neopolitana (B), and Cruciplacolithus
neohelis (C). Fitted curve in A is linear, while fitted curves in B and C are exponential.
Spearman rank correlation (rs) = 0.99 for all three species. From Stanley et al. (in press).
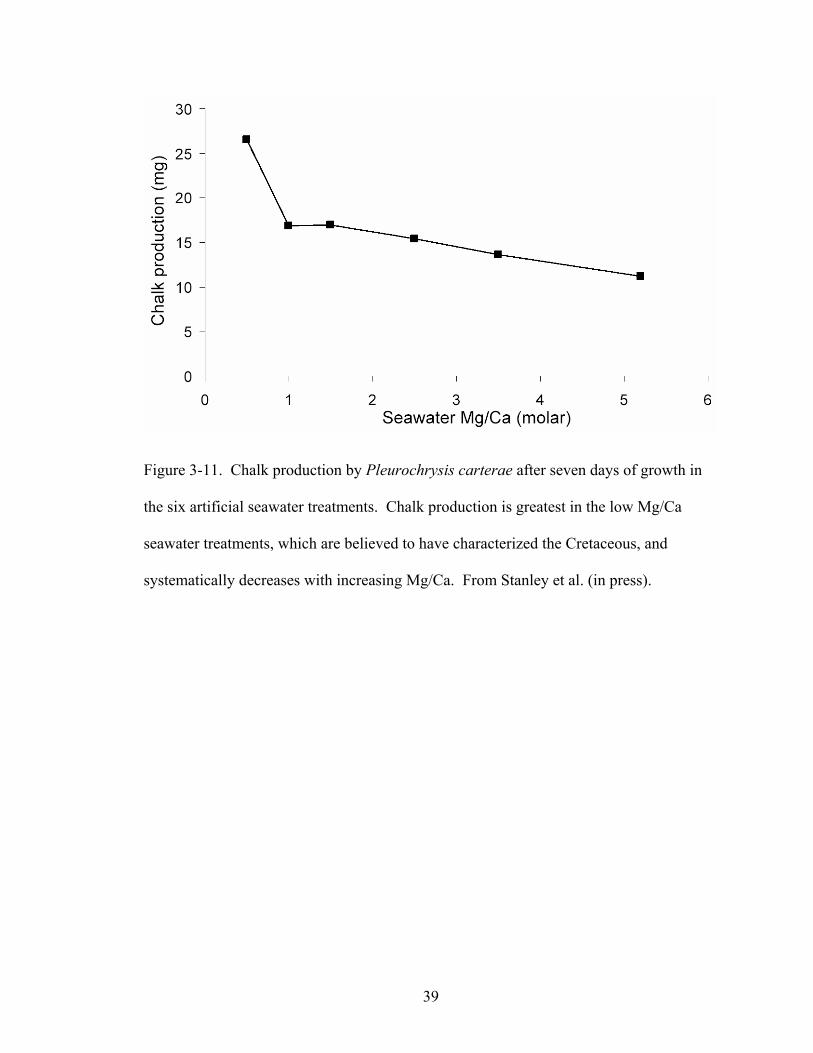
39
Figure 3-11. Chalk production by Pleurochrysis carterae after seven days of growth in
the six artificial seawater treatments. Chalk production is greatest in the low Mg/Ca
seawater treatments, which are believed to have characterized the Cretaceous, and
systematically decreases with increasing Mg/Ca. From Stanley et al. (in press).
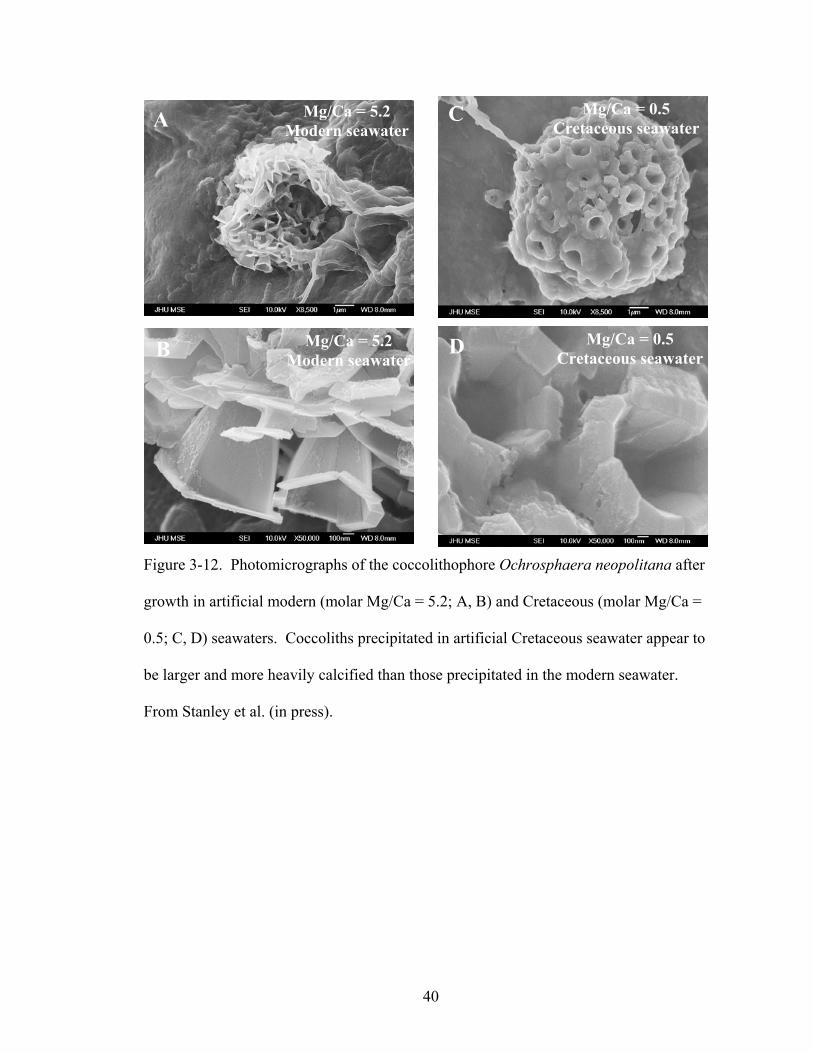
40
Figure 3-12. Photomicrographs of the coccolithophore Ochrosphaera neopolitana after
growth in artificial modern (molar Mg/Ca = 5.2; A, B) and Cretaceous (molar Mg/Ca =
0.5; C, D) seawaters. Coccoliths precipitated in artificial Cretaceous seawater appear to
be larger and more heavily calcified than those precipitated in the modern seawater.
From Stanley et al. (in press).
Mg/Ca = 5.2 Modern seawater A
Mg/Ca = 5.2 Modern seawater B
Mg/Ca = 0.5 Cretaceous seawater
C
Mg/Ca = 0.5 Cretaceous seawater D
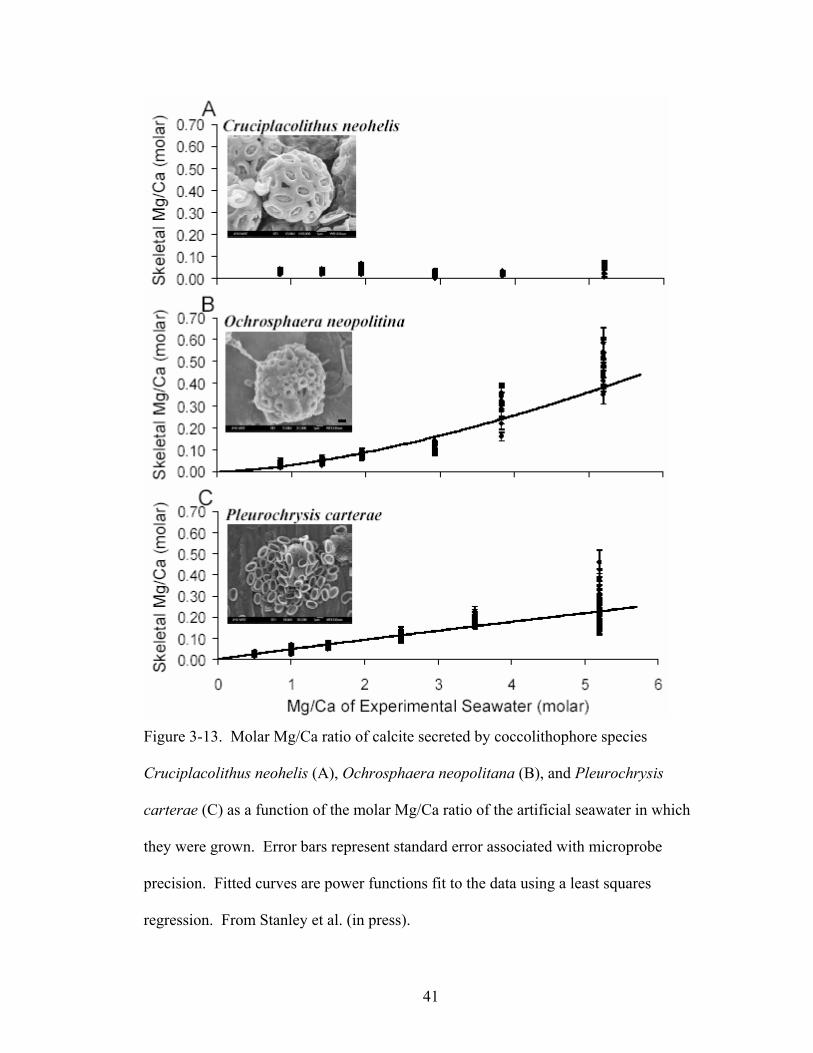
41
Figure 3-13. Molar Mg/Ca ratio of calcite secreted by coccolithophore species
Cruciplacolithus neohelis (A), Ochrosphaera neopolitana (B), and Pleurochrysis
carterae (C) as a function of the molar Mg/Ca ratio of the artificial seawater in which
they were grown. Error bars represent standard error associated with microprobe
precision. Fitted curves are power functions fit to the data using a least squares
regression. From Stanley et al. (in press).
42
4 Effect of seawater Mg/Ca ratio on the calcification and growth of the calcareous
alga Penicillus capitatus
4.1 Chapter summary
Stanley and Hardie (1998; 1999) have shown that secular variation in the Mg/Ca
ratio of seawater throughout the Phanerozoic (Figure 4-1) would have subjected the
aragonite-producing codiacean algae to at least three transitions between the low-Mg
calcite (molar Mg/Ca < 2) and aragonite + high-Mg calcite (molar Mg/Ca > 2) nucleation
fields in the oceans, since their origin in the Ordovician (Roux 1991). They assert that
major sediment production by codiacean algae in Recent tropical seas is permitted by the
Mg/Ca ratio of modern seawater (molar Mg/Ca ~ 5.2) remaining within the
aragonitic/high-Mg calcite nucleation field (molar Mg/Ca > 2). In the present study,
experiments were conducted to determine the effects of ambient Mg/Ca on the
mineralogy, growth rate, primary productivity, calcification rate, and biomechanics of the
codiacean alga Penicillus capitatus.
P. capitatus was grown in three artificial seawater treatments which mimic
ancient seawater of differing Mg/Ca ratios, corresponding to the low-Mg calcite
nucleation field (molar Mg/Ca ~ 1.0), a “boundary field” (molar Mg/Ca ~ 2.5) and the
aragonite + high-Mg calcite nucleation field (molar Mg/Ca ~ 5.2). Significantly, P.
capitatus maintained a mostly aragonitic mineralogy in all three seawater treatments.
However, linear growth rates, primary productivity, calcification and thallus stiffness
decreased with reductions in ambient Mg/Ca. That the P. capitatus alga precipitates
approximately three-quarters of its CaCO3 as aragonite in the seawater treatment which
favors the inorganic precipitation of low-Mg calcite suggests that the alga dictates the
43
precipitation of that polymorph, either by pumping cations to create an internal aragonite
nucleation field (molar Mg/Ca > 2) or by employing organic templates which specify the
nucleation of the aragonite polymorph (Borowitzka 1984). However, the alga’s
precipitation of one-quarter of its CaCO3 as low-Mg calcite suggests that its
mineralogical control is limited and can be partially overridden by the Mg/Ca ratio of
ambient seawater. The reduced calcification of P. capitatus grown in the low-Mg calcite
and boundary nucleation fields is probably due to the inherent difficulty of precipitating
aragonite from seawater which does not naturally support its nucleation. The decreased
rates of linear growth and primary production are probably caused by reductions in CO2
available for photosynthesis due to the reduction in calcification (Borowitzka and
Larkum 1977). The observed decrease in thallus stiffness is probably due to the
reductions in calcification and primary productivity observed in P. capitatus grown in the
low-Mg calcite and boundary nucleation fields.
The present study suggests that aragonitic algae would have been handicapped in
oceans characterized by Mg/Ca ratios which did not support their inherent mineralogy.
Producing aragonite in seawater outside of the aragonite + high-Mg calcite nucleation
field would probably have reduced the competitiveness of these algae, made them more
susceptible to predation and reduced their contribution to carbonate sedimentation. These
findings support Stanley and Hardie’s (1998; 1999) assertion that the dominant
ecological and sedimentological roles of codiacean algae in Recent tropical seas is
permitted by a Mg/Ca ratio of seawater that supports the algae’s aragonitic mineralogy
during this time.
4.2 Introduction
44
The topic of changing seawater chemistry throughout the Phanerozoic is a
particularly exciting one because it links the typically disparate fields of plate tectonics,
aqueous geochemistry, and paleontology (Stanley and Hardie 1998, 1999; Montañez
2002; Stanley et al. 2002; Ries et al. 2004). The purpose of the research presented in this
manuscript is to explore a critical aspect of the geochemistry-paleontology link: the
relationship between seawater Mg/Ca and carbonate biomineralization.
Stanley and Hardie (1998; 1999) demonstrated that the mineralogies of the major
reef building and sediment producing marine organisms have tracked transitions in the
mineralogy of ooids and marine cements, the so-called “calcite- and “aragonite seas”
(Sandberg 1983; Figure 4-1). They further assert that the role of aragonitic algae as
dominant sediment producers in Recent tropical seas is permitted by the Mg/Ca ratio of
seawater remaining in the aragonite nucleation field (molar Mg/Ca > 2).
The present study evaluates this relationship identified by Stanley and Hardie
experimentally, by growing modern aragonite producing algae, Penicillus capitatus, in
artificial seawaters which encompass the range of Mg/Ca ratios believed to have existed
throughout the Phanerozoic (Hardie 1996). Significantly, the algae still produced the
majority of their CaCO3 (approximately three-quarters) as aragonite in the seawater
treatment which favored the inorganic precipitation of calcite (molar Mg/Ca < 2).
However, the linear growth, calcification, primary productivity and thallus stiffness of
these algae were significantly lower when grown in this calcite seawater.
Impairment of such important physiological attributes of the algae during times
when the seawater Mg/Ca ratio did not support their aragonitic mineralogy would
probably have decreased their competitiveness, made them more susceptible to predation
45
and reduced their contribution to carbonate sedimentation. These findings support
Stanley and Hardie’s (1998; 1999) empirical evidence that the major marine calcifiers
have been greatly influenced by the Mg/Ca ratio of seawater over the Phanerozoic. This
work compliments other experiments by Stanley et al. (2002) and Ries (2004) which
demonstrate that calcareous organisms which produce high-Mg calcite in modern
“aragonite seawater” (molar Mg/Ca ~ 5.2), such as coralline algae, echinoids, serpulid
worms, crabs and shrimp, produce low-Mg calcite in artificial “calcite seawater” (molar
Mg/Ca ~ 1.0).
4.3 Background
4.3.1 Geologic History of Penicillus
The codiacean algae have existed since at least the Ordovician (Chuvashov and
Riding 1984; Flügel 1991; Mamet 1991; Riding and Guo. 1991; Roux 1991), as
evidenced by the Ordovician alga Dimorphosiphon demonstrating a level of organization
like that of the modern Halimeda (Mu 1991). Unlike Halimeda, whose geologic history
since the Cretaceous is revealed through its easily preserved plates, Penicillus rapidly
disaggregates into inconspicuous needles which are generally unidentifiable at the
organismal level. As a result, the geologic history of Penicillus is relatively unknown.
Elliot (1978) claimed that species of Ovulites, existing between the Cretaceous and the
Eocene, resembled Penicillus in their morphology and ecology. This is consistent with
the Penicillus ultrastructure bearing close resemblance to that of Halimeda (Mu 1991),
which is believed to have also existed since the Cretaceous (Elliot 1978).
4.3.2 Anatomy
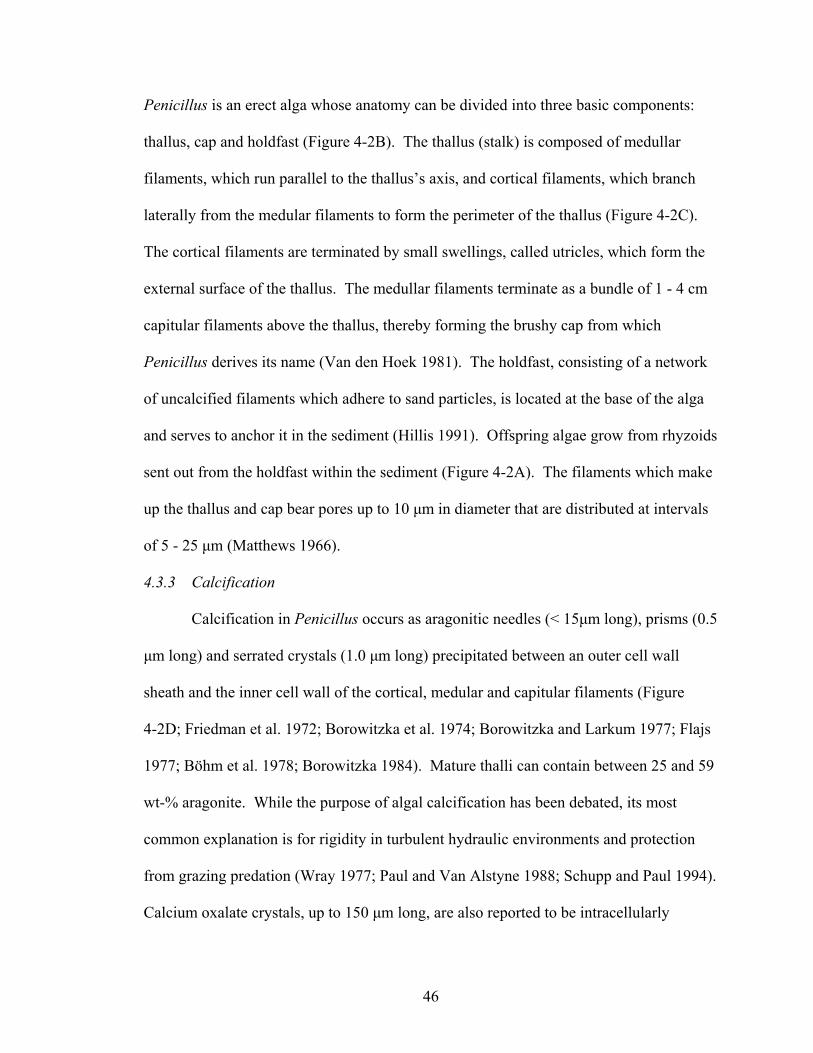
46
Penicillus is an erect alga whose anatomy can be divided into three basic components:
thallus, cap and holdfast (Figure 4-2B). The thallus (stalk) is composed of medullar
filaments, which run parallel to the thallus’s axis, and cortical filaments, which branch
laterally from the medular filaments to form the perimeter of the thallus (Figure 4-2C).
The cortical filaments are terminated by small swellings, called utricles, which form the
external surface of the thallus. The medullar filaments terminate as a bundle of 1 - 4 cm
capitular filaments above the thallus, thereby forming the brushy cap from which
Penicillus derives its name (Van den Hoek 1981). The holdfast, consisting of a network
of uncalcified filaments which adhere to sand particles, is located at the base of the alga
and serves to anchor it in the sediment (Hillis 1991). Offspring algae grow from rhyzoids
sent out from the holdfast within the sediment (Figure 4-2A). The filaments which make
up the thallus and cap bear pores up to 10 µm in diameter that are distributed at intervals
of 5 - 25 µm (Matthews 1966).
4.3.3 Calcification
Calcification in Penicillus occurs as aragonitic needles (< 15µm long), prisms (0.5
µm long) and serrated crystals (1.0 µm long) precipitated between an outer cell wall
sheath and the inner cell wall of the cortical, medular and capitular filaments (Figure
4-2D; Friedman et al. 1972; Borowitzka et al. 1974; Borowitzka and Larkum 1977; Flajs
1977; Böhm et al. 1978; Borowitzka 1984). Mature thalli can contain between 25 and 59
wt-% aragonite. While the purpose of algal calcification has been debated, its most
common explanation is for rigidity in turbulent hydraulic environments and protection
from grazing predation (Wray 1977; Paul and Van Alstyne 1988; Schupp and Paul 1994).
Calcium oxalate crystals, up to 150 µm long, are also reported to be intracellularly
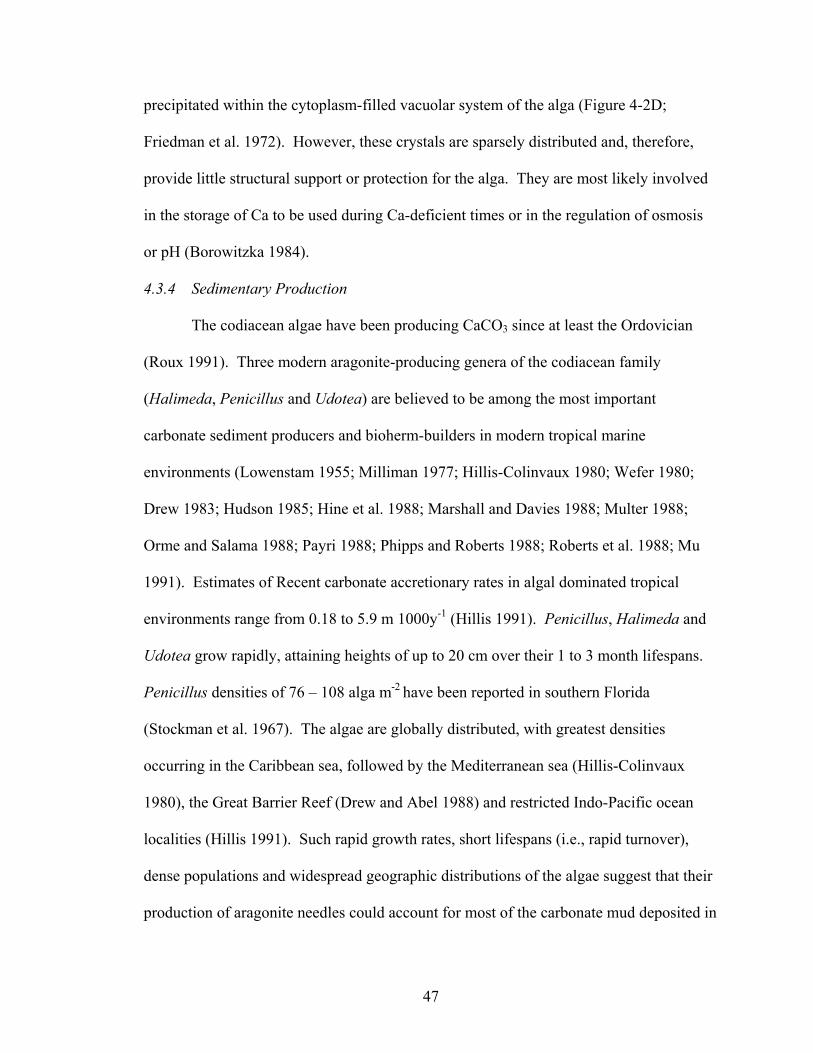
47
precipitated within the cytoplasm-filled vacuolar system of the alga (Figure 4-2D;
Friedman et al. 1972). However, these crystals are sparsely distributed and, therefore,
provide little structural support or protection for the alga. They are most likely involved
in the storage of Ca to be used during Ca-deficient times or in the regulation of osmosis
or pH (Borowitzka 1984).
4.3.4 Sedimentary Production
The codiacean algae have been producing CaCO3 since at least the Ordovician
(Roux 1991). Three modern aragonite-producing genera of the codiacean family
(Halimeda, Penicillus and Udotea) are believed to be among the most important
carbonate sediment producers and bioherm-builders in modern tropical marine
environments (Lowenstam 1955; Milliman 1977; Hillis-Colinvaux 1980; Wefer 1980;
Drew 1983; Hudson 1985; Hine et al. 1988; Marshall and Davies 1988; Multer 1988;
Orme and Salama 1988; Payri 1988; Phipps and Roberts 1988; Roberts et al. 1988; Mu
1991). Estimates of Recent carbonate accretionary rates in algal dominated tropical
environments range from 0.18 to 5.9 m 1000y-1 (Hillis 1991). Penicillus, Halimeda and
Udotea grow rapidly, attaining heights of up to 20 cm over their 1 to 3 month lifespans.
Penicillus densities of 76 – 108 alga m-2 have been reported in southern Florida
(Stockman et al. 1967). The algae are globally distributed, with greatest densities
occurring in the Caribbean sea, followed by the Mediterranean sea (Hillis-Colinvaux
1980), the Great Barrier Reef (Drew and Abel 1988) and restricted Indo-Pacific ocean
localities (Hillis 1991). Such rapid growth rates, short lifespans (i.e., rapid turnover),
dense populations and widespread geographic distributions of the algae suggest that their
production of aragonite needles could account for most of the carbonate mud deposited in
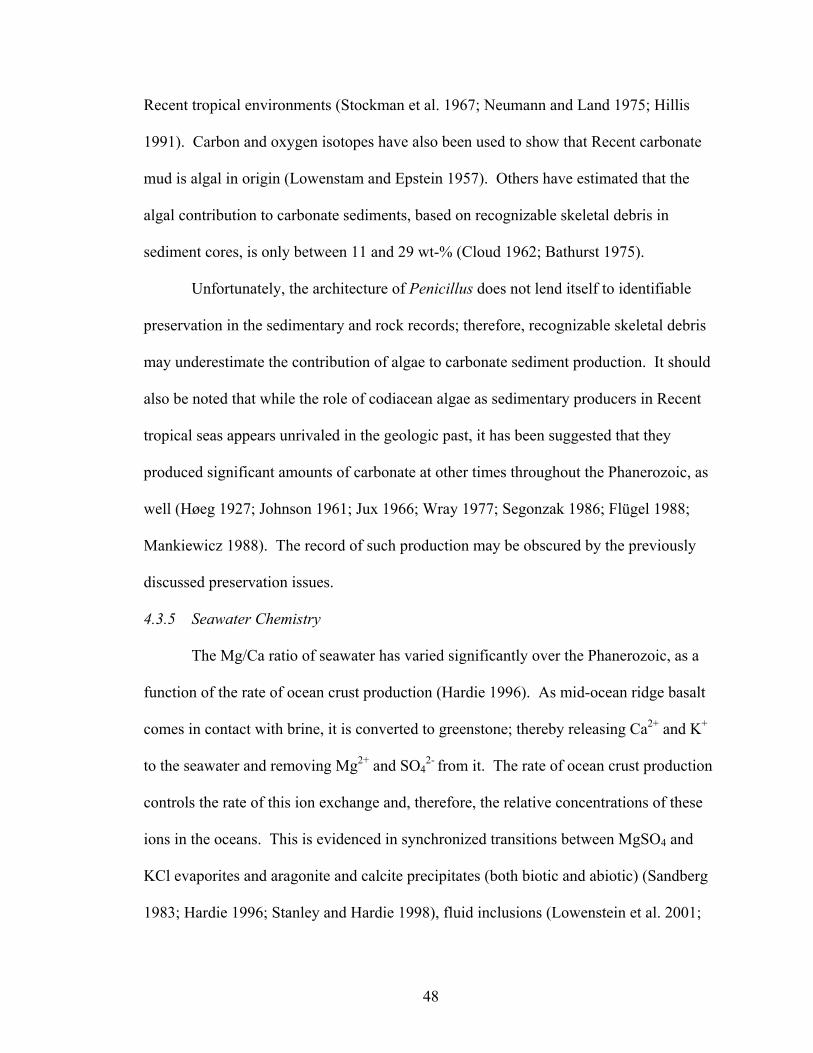
48
Recent tropical environments (Stockman et al. 1967; Neumann and Land 1975; Hillis
1991). Carbon and oxygen isotopes have also been used to show that Recent carbonate
mud is algal in origin (Lowenstam and Epstein 1957). Others have estimated that the
algal contribution to carbonate sediments, based on recognizable skeletal debris in
sediment cores, is only between 11 and 29 wt-% (Cloud 1962; Bathurst 1975).
Unfortunately, the architecture of Penicillus does not lend itself to identifiable
preservation in the sedimentary and rock records; therefore, recognizable skeletal debris
may underestimate the contribution of algae to carbonate sediment production. It should
also be noted that while the role of codiacean algae as sedimentary producers in Recent
tropical seas appears unrivaled in the geologic past, it has been suggested that they
produced significant amounts of carbonate at other times throughout the Phanerozoic, as
well (Høeg 1927; Johnson 1961; Jux 1966; Wray 1977; Segonzak 1986; Flügel 1988;
Mankiewicz 1988). The record of such production may be obscured by the previously
discussed preservation issues.
4.3.5 Seawater Chemistry
The Mg/Ca ratio of seawater has varied significantly over the Phanerozoic, as a
function of the rate of ocean crust production (Hardie 1996). As mid-ocean ridge basalt
comes in contact with brine, it is converted to greenstone; thereby releasing Ca2+ and K+
to the seawater and removing Mg2+ and SO42- from it. The rate of ocean crust production
controls the rate of this ion exchange and, therefore, the relative concentrations of these
ions in the oceans. This is evidenced in synchronized transitions between MgSO4 and
KCl evaporites and aragonite and calcite precipitates (both biotic and abiotic) (Sandberg
1983; Hardie 1996; Stanley and Hardie 1998), fluid inclusions (Lowenstein et al. 2001;
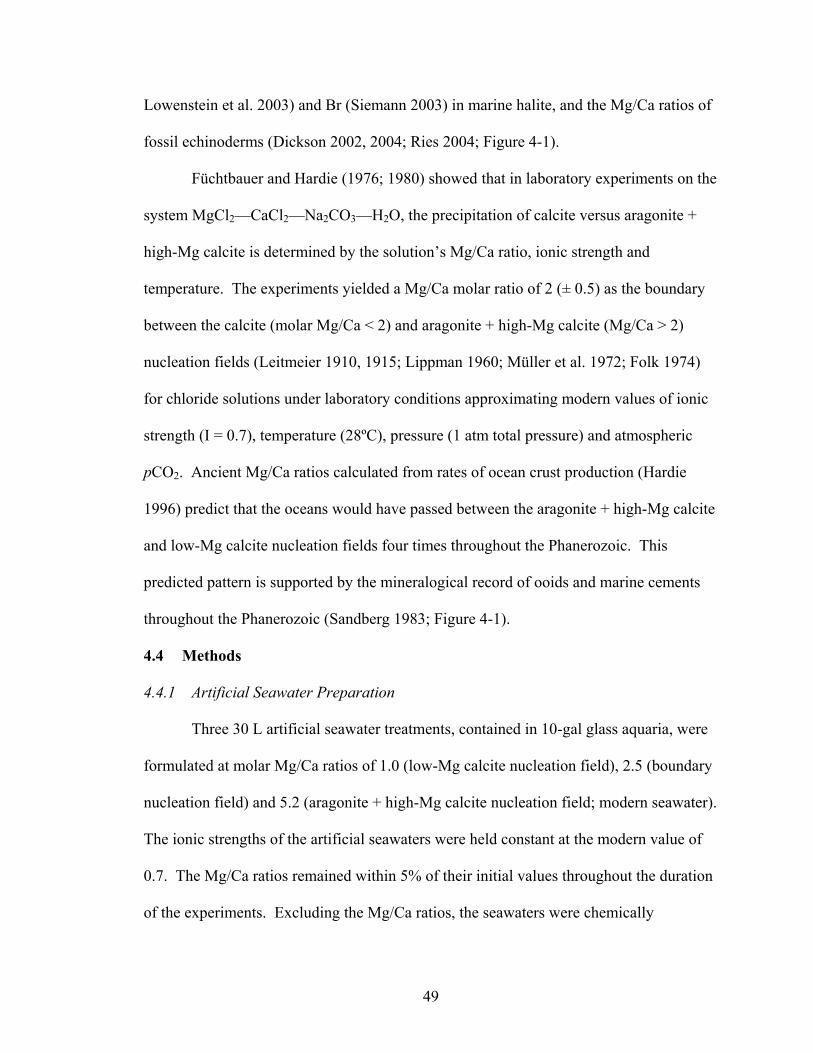
49
Lowenstein et al. 2003) and Br (Siemann 2003) in marine halite, and the Mg/Ca ratios of
fossil echinoderms (Dickson 2002, 2004; Ries 2004; Figure 4-1).
Füchtbauer and Hardie (1976; 1980) showed that in laboratory experiments on the
system MgCl2—CaCl2—Na2CO3—H2O, the precipitation of calcite versus aragonite +
high-Mg calcite is determined by the solution’s Mg/Ca ratio, ionic strength and
temperature. The experiments yielded a Mg/Ca molar ratio of 2 (± 0.5) as the boundary
between the calcite (molar Mg/Ca < 2) and aragonite + high-Mg calcite (Mg/Ca > 2)
nucleation fields (Leitmeier 1910, 1915; Lippman 1960; Müller et al. 1972; Folk 1974)
for chloride solutions under laboratory conditions approximating modern values of ionic
strength (I = 0.7), temperature (28ºC), pressure (1 atm total pressure) and atmospheric
pCO2. Ancient Mg/Ca ratios calculated from rates of ocean crust production (Hardie
1996) predict that the oceans would have passed between the aragonite + high-Mg calcite
and low-Mg calcite nucleation fields four times throughout the Phanerozoic. This
predicted pattern is supported by the mineralogical record of ooids and marine cements
throughout the Phanerozoic (Sandberg 1983; Figure 4-1).
4.4 Methods
4.4.1 Artificial Seawater Preparation
Three 30 L artificial seawater treatments, contained in 10-gal glass aquaria, were
formulated at molar Mg/Ca ratios of 1.0 (low-Mg calcite nucleation field), 2.5 (boundary
nucleation field) and 5.2 (aragonite + high-Mg calcite nucleation field; modern seawater).
The ionic strengths of the artificial seawaters were held constant at the modern value of
0.7. The Mg/Ca ratios remained within 5% of their initial values throughout the duration
of the experiments. Excluding the Mg/Ca ratios, the seawaters were chemically
50
formulated at normal marine values (Bidwell and Spotte 1985). The seawater treatments
were fertilized with 20.0 mg/L NaNO3, 1.3 mg/L NaH2PO4.H2O, and 0.025 mL/L EDTA,
all within the normal range for nearshore tropical marine waters (Spotte 1979). All three
treatments were continuously filtered with Millennium 2000 Wet-Dry Multi-filters (rate
of filtration = 600 L/hour), maintained at 25 ± 1ºC using 50-Watt electric heaters and
provided with 10 hours/day of identical irradiance (19 Watts).
4.4.2 Specimen Collection
Young P. capitatus were collected from the Florida Bay and the back-reef lagoon
of Caye Caulker, Belize. Specimens were stored in plastic bags filled with natural
seawater from these locations and transported by plane to the laboratory at Johns Hopkins
University the following day. After transport, the algae were placed in a holding tank of
normal salinity for 7 days. The algae were acclimated to the artificial seawater
treatments in stages, being moved every 3 days to seawater treatments of successively
lower Mg/Ca ratios, so as to minimize any chemical shock they may experience.
4.4.3 Mineralogical Analysis
Three P. capitatus specimens were grown from equal-sized parent algae for 60
days in each of the three seawater treatments (for a total of nine specimens). After
growth, the organisms were removed from the seawater treatments, briefly washed with
distilled water and sectioned parallel to their thallus axes. The sectioned specimens were
dried in an oven for 4 hours at 100ºC. The three specimens from each of the seawater
treatments were secured on carbon mounts with carbon paint, and carbon coated for 10
sec. The filaments comprising the P. capitatus specimens were thoroughly examined in a
JEOL 8600 scanning electron microscope for CaCO3 precipitates. Portions of the thalli
51
and accompanying mineral precipitates were photomicrographed in the SEM. The
specimens were then ground to a fine powder and analyzed individually in an x-ray
diffractometer to determine carbonate polymorph mineralogy. The proportion of calcite-
to-aragonite was calculated as the ratio of the area under the primary calcite peak (2 =
29.4 – 29.5º) to the area under the primary aragonite peak (2 = 26.2º).
4.4.4 Linear Growth
Forty equal-sized parent algae were grown for 60 days in each of the three
seawater treatments (for a total of 120 specimens). The P. capitatus specimens were
photographed every seven days. Linear growth of the parent and offspring algae was
measured from the weekly photographs. Average linear growth rates were calculated for
the algae over the weeks that they exhibited measurable linear growth.
Calcification and Primary Productivity
Twenty equal-sized parent algae were grown for 80 days in each of the three
seawater treatments (for a total of 60 specimens). The first appearances of offspring
algae were noted throughout the experiment. After 80 days, the offspring were harvested
and their ages determined relative to the date of their first appearance. The offspring
algae were oven-dried at 100ºC for 24 hours to remove all water content, after which the
dry weight of the specimens was determined. The specimens were then baked in an oven
at 450ºC for four hours to combust all organic matter. The weight of the residual
carbonate material was determined and then recorded as their total calcification. The
difference between the weight of the residual carbonate material and the original dry-
weight was recorded as their primary productivity (i.e., organic matter removed by
combustion).
52
4.4.5 Biomechanical Analysis
The mechanical stiffness of the Penicillus thallus can be quantified as the slope of
its stress-strain curve during elastic deformation experienced under varying flow regimes
in a unidirectional current tank. The cylindrical shape of the P. capitatus thallus (Figure
4-3) suggests that its stress can be modeled using a variation on the basic formula of
beam theory (Wainwright et al. 1976; Baumiller and Ausich 1996),
= My/I, (1)
where is stress, M is the bending moment, y is the distance of the outermost fiber in
longitudinal cross-section and I is the second moment of area (Appendix F). Strain can
be approximated by the angle of deflection of the thallus when subjected to the current
stress.
Three replicate sets of P. capitatus, containing three specimens each (nine total),
were grown for 60 days in the three artificial seawater treatments formulated at the
various Mg/Ca ratios. Each of the P. capitatus specimens was photographed and
measured after growth (Figure 4-4C). The algae were decapitated, clamped with vice
grips at their holdfasts and secured to the bottom of a unidirectional current tank with an
ordinary house brick. The current tank is an oval plexiglass loop which circulates water
using a revolving paddle wheel which can be adjusted to produce varying current
velocities.
Since stress-strain analyses of beams typically require an initial dummy unit-load to
bring the material into a state of tension (Gaylord and Gaylord 1990), the P. capitatus
thalli were pre-stressed with a current velocity sufficient to attain an initial deflection of
5º (Figure 4-4A). Once this initial deflection was achieved, the current velocities were
53
increased in increments of 5 cm/s until the thalli exhibited plastic deformation, as
stiffness (stress/strain) is only calculated over the range of non-plastic (elastic)
deformation. The deflection was photographed after each increase in current velocity
(Figure 4-4B).
4.5 Results
4.5.1 Mineralogical Analysis
SEM images of the Penicillus specimens raised in the three seawater treatments of
varying Mg/Ca illustrate that all specimens precipitated the majority of their CaCO3 as
aragonite needles (Figure 4-5). However, x-ray diffraction of the powdered specimens
revealed that algae grown in the artificial calcite seawater (molar Mg/Ca = 1) produced
22 ± 3 % of their CaCO3 as low-Mg calcite (4 ± 0.4 % MgCO3) and 78 ± 3 % as aragonite
(Figure 4-6), while specimens grown in the artificial aragonite seawaters produced their
CaCO3 exclusively as aragonite (Table 4-1).
The aragonite needles ranged from 1 to 4 µm in length and were bundled in
apparently random arrangements in a 10 µm-thick zone between the outer walls of the
capitular, medular and cortical filaments (Figure 4-5). The two-dimensional perspective
of the SEM made it nearly impossible to quantitatively differentiate between the crystal
arrangements of the Penicillus raised in the three seawater treatments. However, the
aragonite needles produced by all of them were of approximately the same size and
shape.
4.5.2 Linear Growth Rates
Linear growth rates increased significantly (p < 0.01) with seawater Mg/Ca
(Figure 4-7; Appendix G). Penicillus grown in the lowest, intermediate and highest
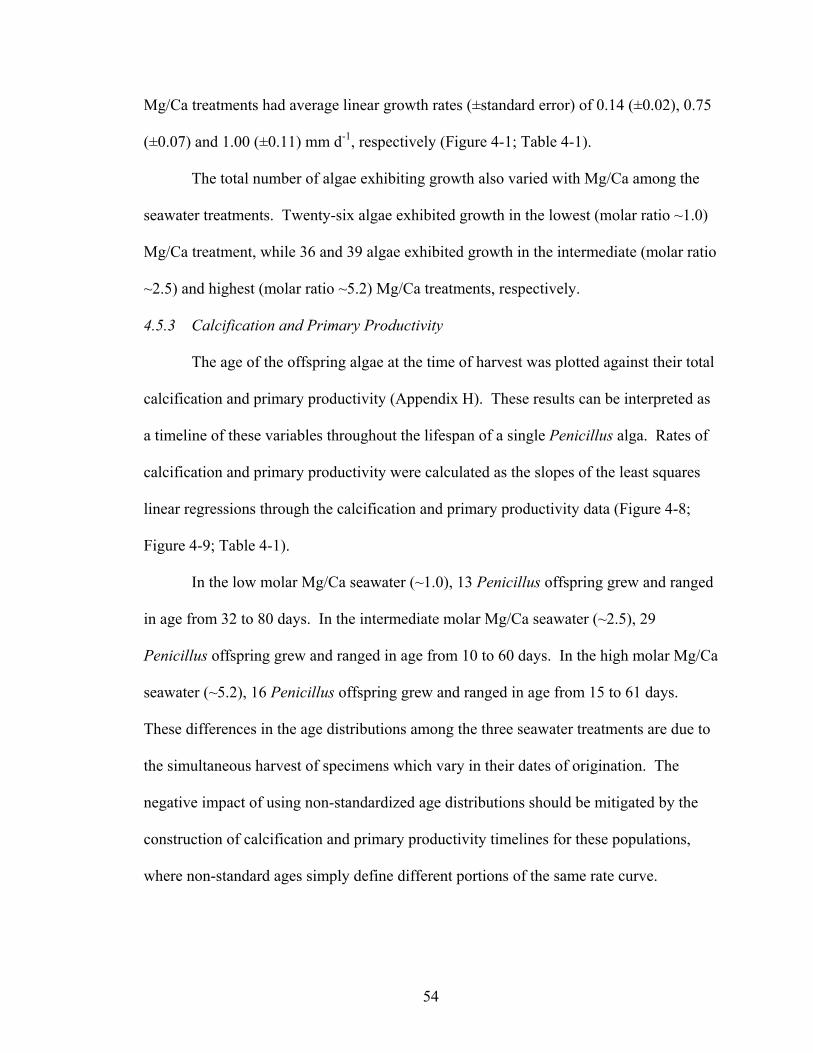
54
Mg/Ca treatments had average linear growth rates (±standard error) of 0.14 (±0.02), 0.75
(±0.07) and 1.00 (±0.11) mm d-1, respectively (Figure 4-1; Table 4-1).
The total number of algae exhibiting growth also varied with Mg/Ca among the
seawater treatments. Twenty-six algae exhibited growth in the lowest (molar ratio ~1.0)
Mg/Ca treatment, while 36 and 39 algae exhibited growth in the intermediate (molar ratio
~2.5) and highest (molar ratio ~5.2) Mg/Ca treatments, respectively.
4.5.3 Calcification and Primary Productivity
The age of the offspring algae at the time of harvest was plotted against their total
calcification and primary productivity (Appendix H). These results can be interpreted as
a timeline of these variables throughout the lifespan of a single Penicillus alga. Rates of
calcification and primary productivity were calculated as the slopes of the least squares
linear regressions through the calcification and primary productivity data (Figure 4-8;
Figure 4-9; Table 4-1).
In the low molar Mg/Ca seawater (~1.0), 13 Penicillus offspring grew and ranged
in age from 32 to 80 days. In the intermediate molar Mg/Ca seawater (~2.5), 29
Penicillus offspring grew and ranged in age from 10 to 60 days. In the high molar Mg/Ca
seawater (~5.2), 16 Penicillus offspring grew and ranged in age from 15 to 61 days.
These differences in the age distributions among the three seawater treatments are due to
the simultaneous harvest of specimens which vary in their dates of origination. The
negative impact of using non-standardized age distributions should be mitigated by the
construction of calcification and primary productivity timelines for these populations,
where non-standard ages simply define different portions of the same rate curve.
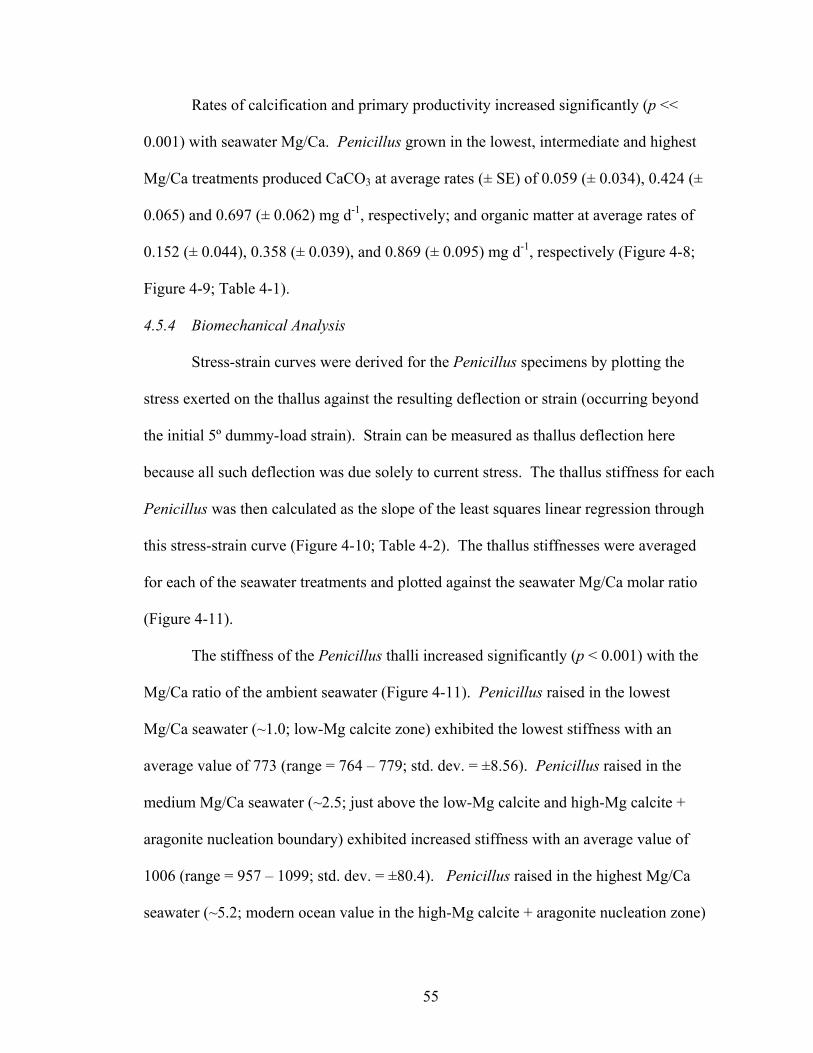
55
Rates of calcification and primary productivity increased significantly (p <<
0.001) with seawater Mg/Ca. Penicillus grown in the lowest, intermediate and highest
Mg/Ca treatments produced CaCO3 at average rates (± SE) of 0.059 (± 0.034), 0.424 (±
0.065) and 0.697 (± 0.062) mg d-1, respectively; and organic matter at average rates of
0.152 (± 0.044), 0.358 (± 0.039), and 0.869 (± 0.095) mg d-1, respectively (Figure 4-8;
Figure 4-9; Table 4-1).
4.5.4 Biomechanical Analysis
Stress-strain curves were derived for the Penicillus specimens by plotting the
stress exerted on the thallus against the resulting deflection or strain (occurring beyond
the initial 5º dummy-load strain). Strain can be measured as thallus deflection here
because all such deflection was due solely to current stress. The thallus stiffness for each
Penicillus was then calculated as the slope of the least squares linear regression through
this stress-strain curve (Figure 4-10; Table 4-2). The thallus stiffnesses were averaged
for each of the seawater treatments and plotted against the seawater Mg/Ca molar ratio
(Figure 4-11).
The stiffness of the Penicillus thalli increased significantly (p < 0.001) with the
Mg/Ca ratio of the ambient seawater (Figure 4-11). Penicillus raised in the lowest
Mg/Ca seawater (~1.0; low-Mg calcite zone) exhibited the lowest stiffness with an
average value of 773 (range = 764 – 779; std. dev. = ±8.56). Penicillus raised in the
medium Mg/Ca seawater (~2.5; just above the low-Mg calcite and high-Mg calcite +
aragonite nucleation boundary) exhibited increased stiffness with an average value of
1006 (range = 957 – 1099; std. dev. = ±80.4). Penicillus raised in the highest Mg/Ca
seawater (~5.2; modern ocean value in the high-Mg calcite + aragonite nucleation zone)

56
exhibited the greatest stiffness with an average value of 1307 (range = 1221 – 1439; std.
dev. = ±116).
4.6 Discussion
It is significant that the P. capitatus algae grown in the low-Mg calcite nucleation
field still precipitated most of their CaCO3 as aragonite needles (78 ± 3 %). The kinetics
of CaCO3 precipitation from seawater dictate that the abiotic precipitation of aragonite
should occur only when the molar Mg/Ca ratio is greater than two, while calcite
precipitation should occur only when the molar Mg/Ca ratio is less than two (Leitmeier
1910, 1915; Lippman 1960; Müller et al. 1972; Folk 1974; Füchtbauer and Hardie 1976;
Füchtbauer and Hardie 1980). It therefore seems reasonable that the biologically-
mediated precipitation of aragonite in the low-Mg calcite nucleation field will proceed at
a slower rate than it would in the aragonite + high-Mg calcite nucleation field. This
explains why the calcification rate of Penicillus was greatest in the aragonite + high-Mg
calcite nucleation field, lower in the boundary field and lowest in the low-Mg calcite
nucleation field. However, this does not explain why linear growth and primary
productivity were also reduced in seawater treatments of decreased Mg/Ca. The answer
may concern CO2.
It has been shown that the codiacean algae Udotea and Halimeda will increase
primary productivity (photosynthesis) when subjected to elevated levels of CO2 (Reiskind
et al. 1988; 1989):
CO2 + H2O CH2O + O2. (2)
Furthermore, the precipitation of CaCO3 releases CO2 to the ambient seawater:
2HCO3 + Ca CaCO3 + CO2 + H2O. (3)
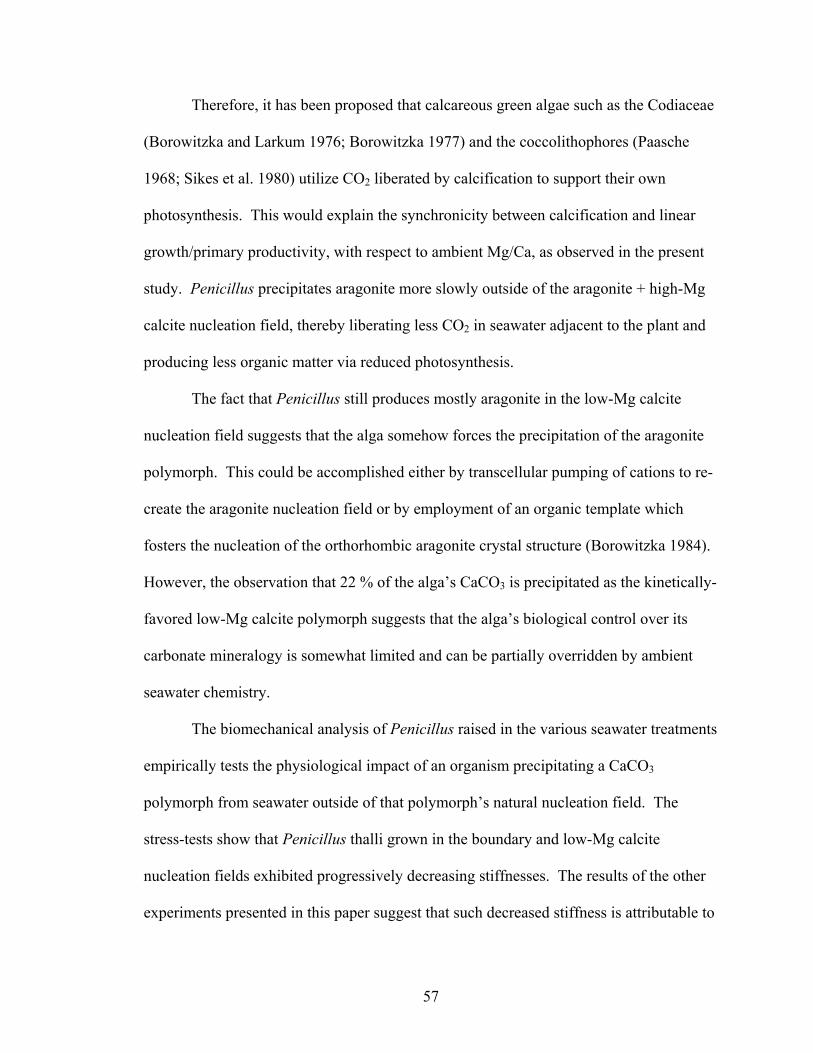
57
Therefore, it has been proposed that calcareous green algae such as the Codiaceae
(Borowitzka and Larkum 1976; Borowitzka 1977) and the coccolithophores (Paasche
1968; Sikes et al. 1980) utilize CO2 liberated by calcification to support their own
photosynthesis. This would explain the synchronicity between calcification and linear
growth/primary productivity, with respect to ambient Mg/Ca, as observed in the present
study. Penicillus precipitates aragonite more slowly outside of the aragonite + high-Mg
calcite nucleation field, thereby liberating less CO2 in seawater adjacent to the plant and
producing less organic matter via reduced photosynthesis.
The fact that Penicillus still produces mostly aragonite in the low-Mg calcite
nucleation field suggests that the alga somehow forces the precipitation of the aragonite
polymorph. This could be accomplished either by transcellular pumping of cations to re-
create the aragonite nucleation field or by employment of an organic template which
fosters the nucleation of the orthorhombic aragonite crystal structure (Borowitzka 1984).
However, the observation that 22 % of the alga’s CaCO3 is precipitated as the kinetically-
favored low-Mg calcite polymorph suggests that the alga’s biological control over its
carbonate mineralogy is somewhat limited and can be partially overridden by ambient
seawater chemistry.
The biomechanical analysis of Penicillus raised in the various seawater treatments
empirically tests the physiological impact of an organism precipitating a CaCO3
polymorph from seawater outside of that polymorph’s natural nucleation field. The
stress-tests show that Penicillus thalli grown in the boundary and low-Mg calcite
nucleation fields exhibited progressively decreasing stiffnesses. The results of the other
experiments presented in this paper suggest that such decreased stiffness is attributable to
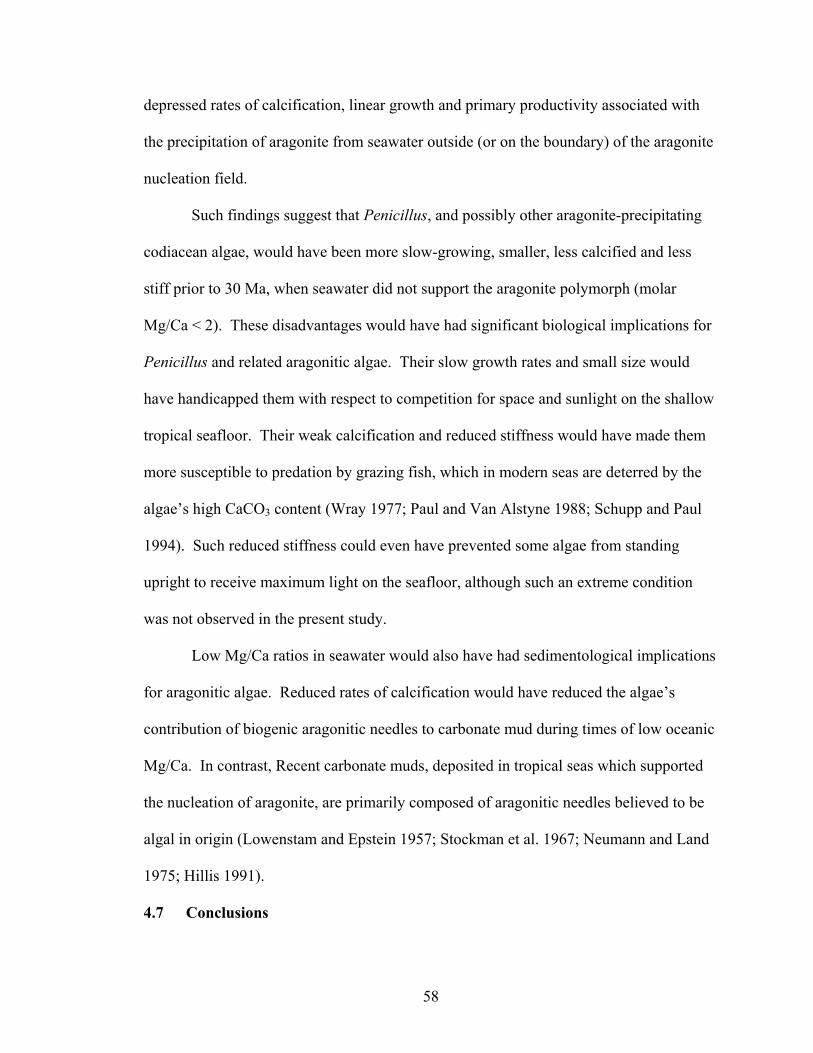
58
depressed rates of calcification, linear growth and primary productivity associated with
the precipitation of aragonite from seawater outside (or on the boundary) of the aragonite
nucleation field.
Such findings suggest that Penicillus, and possibly other aragonite-precipitating
codiacean algae, would have been more slow-growing, smaller, less calcified and less
stiff prior to 30 Ma, when seawater did not support the aragonite polymorph (molar
Mg/Ca < 2). These disadvantages would have had significant biological implications for
Penicillus and related aragonitic algae. Their slow growth rates and small size would
have handicapped them with respect to competition for space and sunlight on the shallow
tropical seafloor. Their weak calcification and reduced stiffness would have made them
more susceptible to predation by grazing fish, which in modern seas are deterred by the
algae’s high CaCO3 content (Wray 1977; Paul and Van Alstyne 1988; Schupp and Paul
1994). Such reduced stiffness could even have prevented some algae from standing
upright to receive maximum light on the seafloor, although such an extreme condition
was not observed in the present study.
Low Mg/Ca ratios in seawater would also have had sedimentological implications
for aragonitic algae. Reduced rates of calcification would have reduced the algae’s
contribution of biogenic aragonitic needles to carbonate mud during times of low oceanic
Mg/Ca. In contrast, Recent carbonate muds, deposited in tropical seas which supported
the nucleation of aragonite, are primarily composed of aragonitic needles believed to be
algal in origin (Lowenstam and Epstein 1957; Stockman et al. 1967; Neumann and Land
1975; Hillis 1991).
4.7 Conclusions
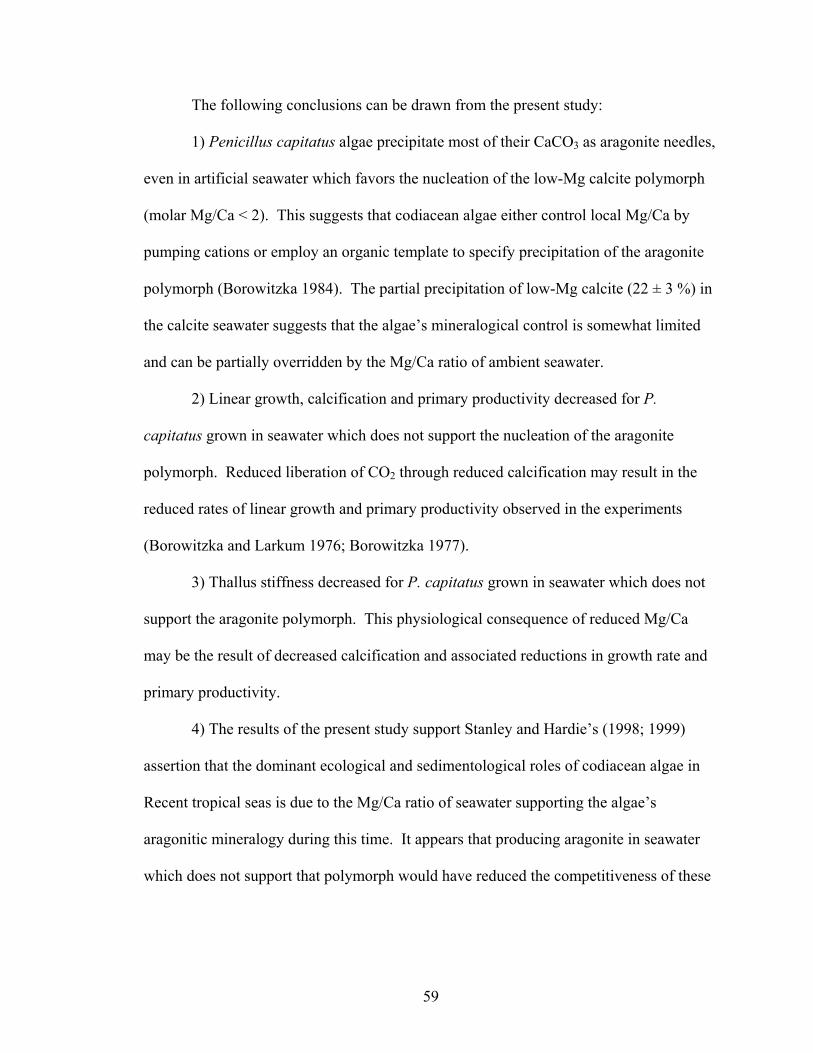
59
The following conclusions can be drawn from the present study:
1) Penicillus capitatus algae precipitate most of their CaCO3 as aragonite needles,
even in artificial seawater which favors the nucleation of the low-Mg calcite polymorph
(molar Mg/Ca < 2). This suggests that codiacean algae either control local Mg/Ca by
pumping cations or employ an organic template to specify precipitation of the aragonite
polymorph (Borowitzka 1984). The partial precipitation of low-Mg calcite (22 ± 3 %) in
the calcite seawater suggests that the algae’s mineralogical control is somewhat limited
and can be partially overridden by the Mg/Ca ratio of ambient seawater.
2) Linear growth, calcification and primary productivity decreased for P.
capitatus grown in seawater which does not support the nucleation of the aragonite
polymorph. Reduced liberation of CO2 through reduced calcification may result in the
reduced rates of linear growth and primary productivity observed in the experiments
(Borowitzka and Larkum 1976; Borowitzka 1977).
3) Thallus stiffness decreased for P. capitatus grown in seawater which does not
support the aragonite polymorph. This physiological consequence of reduced Mg/Ca
may be the result of decreased calcification and associated reductions in growth rate and
primary productivity.
4) The results of the present study support Stanley and Hardie’s (1998; 1999)
assertion that the dominant ecological and sedimentological roles of codiacean algae in
Recent tropical seas is due to the Mg/Ca ratio of seawater supporting the algae’s
aragonitic mineralogy during this time. It appears that producing aragonite in seawater
which does not support that polymorph would have reduced the competitiveness of these
60
algae, made them more susceptible to predation and reduced their contribution to
carbonate sedimentation.

61
4.8 Figures and tables
Figure 4-1. Evidence and predictions of secular variation in the molar Mg/Ca ratio of
seawater during the Phanerozoic which supported 3 periods of aragonite + high-Mg
calcite nucleation and 2 periods of calcite nucleation. Curve is the molar Mg/Ca ratio of
seawater predicted by Hardie (1996). Gray vertical bars with t-tops are molar Mg/Ca
ranges estimated from fluid inclusions in marine halites (Lowenstein et al. 2001;
Lowenstein et al. 2003). Black vertical bars are molar Mg/Ca ranges calculated from the
Mg content of fossil echinoderms (Dickson 2002, 2004; Ries 2004). Solid black circles
are molar Mg/Ca values estimated from Br in basal marine halite (Siemann 2003). Star
represents modern seawater chemistry (molar Mg/Ca ~ 5.2). Horizontal line is the divide
between the calcite (molar Mg/Ca < 2) and aragonite + high-Mg calcite (molar Mg/Ca >
2) nucleation fields in seawater at 25ºC. Temporal distributions of non-skeletal aragonite
and calcite (Sandberg 1983) and KCl and MgSO4 marine evaporites (Hardie 1996) are
plotted along the top of the figure (modified from Lowenstein et al. 2001).
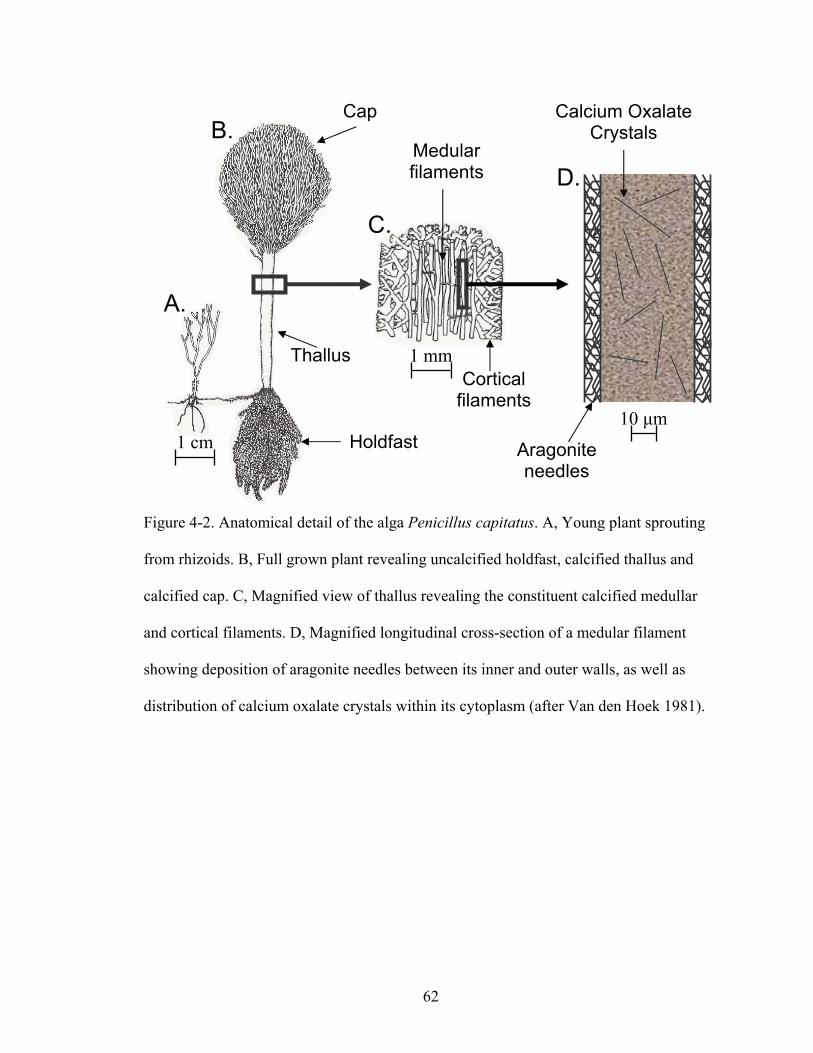
62
Figure 4-2. Anatomical detail of the alga Penicillus capitatus. A, Young plant sprouting
from rhizoids. B, Full grown plant revealing uncalcified holdfast, calcified thallus and
calcified cap. C, Magnified view of thallus revealing the constituent calcified medullar
and cortical filaments. D, Magnified longitudinal cross-section of a medular filament
showing deposition of aragonite needles between its inner and outer walls, as well as
distribution of calcium oxalate crystals within its cytoplasm (after Van den Hoek 1981).
1 cm
1 mm
10 µm
A.
B.
D.
C.
Holdfast
Thallus
Cap Calcium Oxalate Crystals
Aragoniteneedles
Corticalfilaments
Medularfilaments

63
Figure 4-3. Free body diagram of a decapitated Penicillus stalk modeled as a cantilever
beam stressed by a unidirectional current. Stress ( ) is calculated as 4Dh/( r3), where D
is the current velocity, h is the height of the stalk and r is the radius of the stalk. Note
that height (h) decreases as a function of Lcos , where L is the length of the stalk and is
the angle of stalk deflection.

64
Figure 4-4. A, Decapitated P. capitatus thallus pre-strained to 5º deflection with the
dummy load (current velocity = 5 cm/s). B, Decapitated P. capitatus alga strained
beyond the 5º pre-strain dummy load (current velocity = 45 cm/s). Angles of deflection
( ) beyond the 5º pre-strain were employed in the stress-strain analyses. C, Photograph of
a P. capitatus alga depicting the length (L) and radius (r) dimensions employed in
modeling its thallus as a cantilever beam.
dummy load = 5ºcurrent = 5 cm/s
= straincurrent = 45 cm/s
L2r
A.
C.
B.
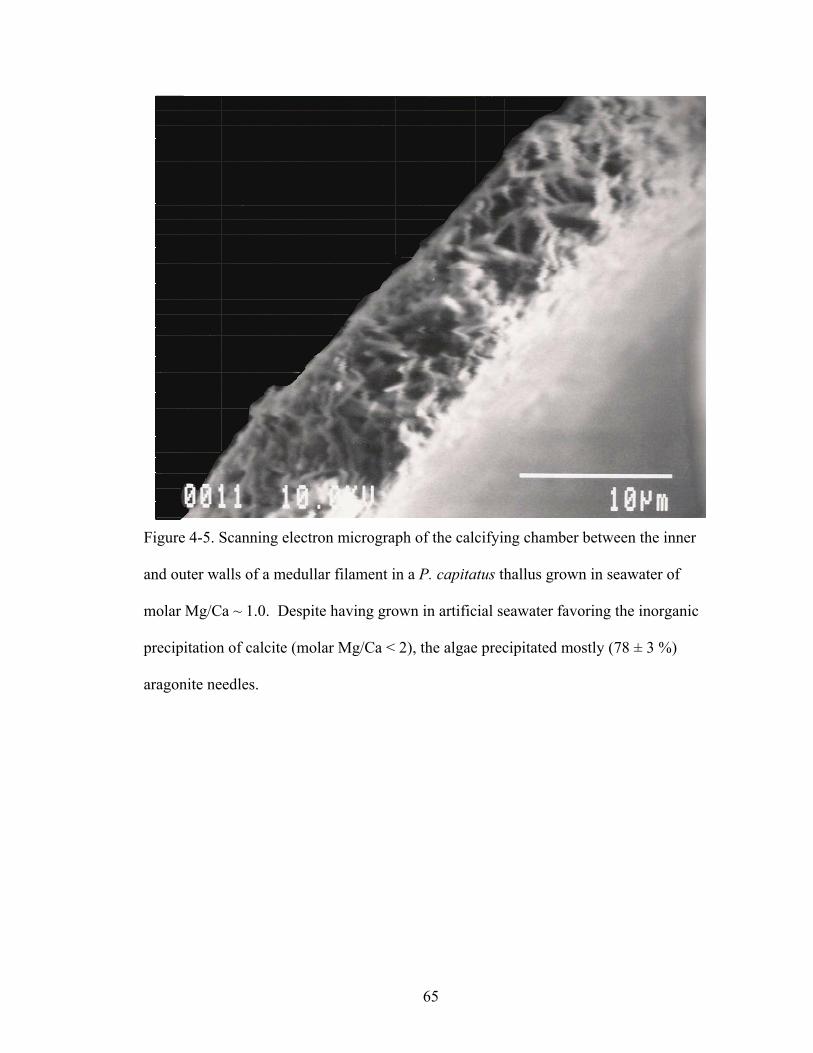
65
Figure 4-5. Scanning electron micrograph of the calcifying chamber between the inner
and outer walls of a medullar filament in a P. capitatus thallus grown in seawater of
molar Mg/Ca ~ 1.0. Despite having grown in artificial seawater favoring the inorganic
precipitation of calcite (molar Mg/Ca < 2), the algae precipitated mostly (78 ± 3 %)
aragonite needles.

66
Figure 4-6. A, X-ray diffraction pattern for a P. capitatus alga which produced pure
aragonite when grown in seawater which favors the nucleation of the aragonite
polymorph (molar Mg/Ca = 5.2). Primary aragonite peak occurs at 2 = 26.2º. B, X-ray
diffraction pattern for pure calcite, revealing primary calcite peak at 2 = 29.4º. C, X-ray
diffraction pattern for a P. capitatus alga which produced 22 ± 3 % calcite and 78 ± 3 %
aragonite, as calculated from the relative areas under the primary calcite peak (2 = 29.4-
29.5º) and the primary aragonite peak (2 = 26.2º).
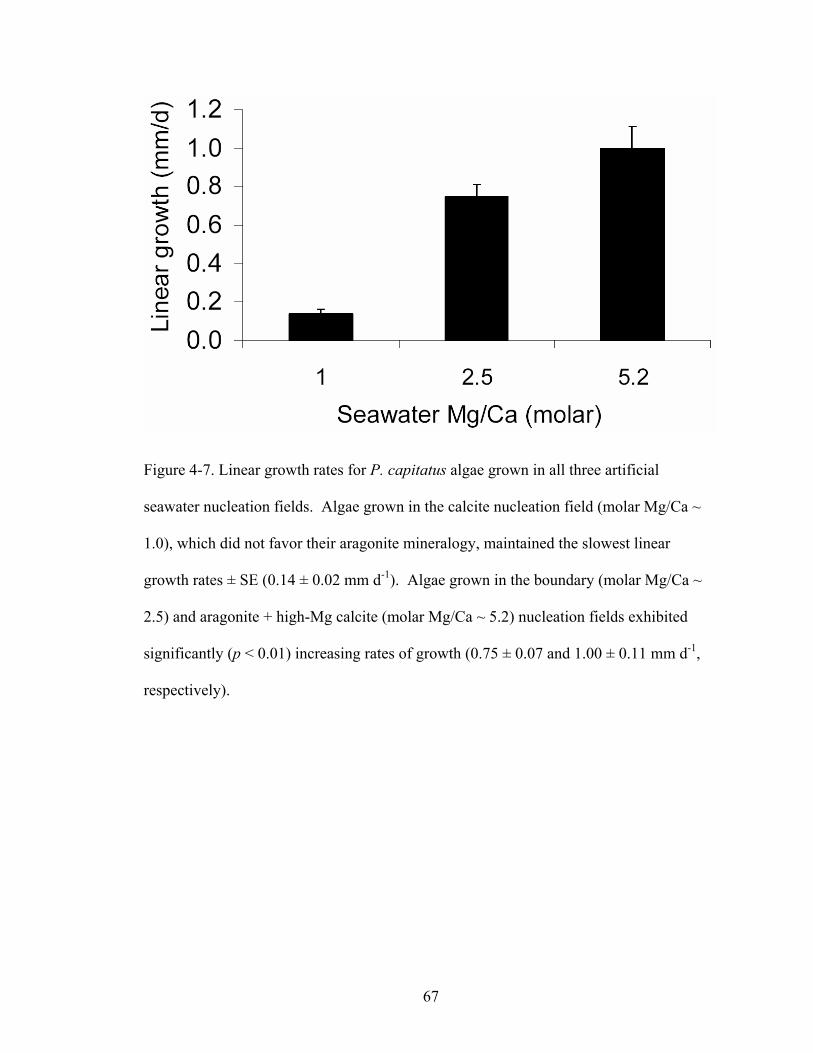
67
Figure 4-7. Linear growth rates for P. capitatus algae grown in all three artificial
seawater nucleation fields. Algae grown in the calcite nucleation field (molar Mg/Ca ~
1.0), which did not favor their aragonite mineralogy, maintained the slowest linear
growth rates ± SE (0.14 ± 0.02 mm d-1). Algae grown in the boundary (molar Mg/Ca ~
2.5) and aragonite + high-Mg calcite (molar Mg/Ca ~ 5.2) nucleation fields exhibited
significantly (p < 0.01) increasing rates of growth (0.75 ± 0.07 and 1.00 ± 0.11 mm d-1,
respectively).
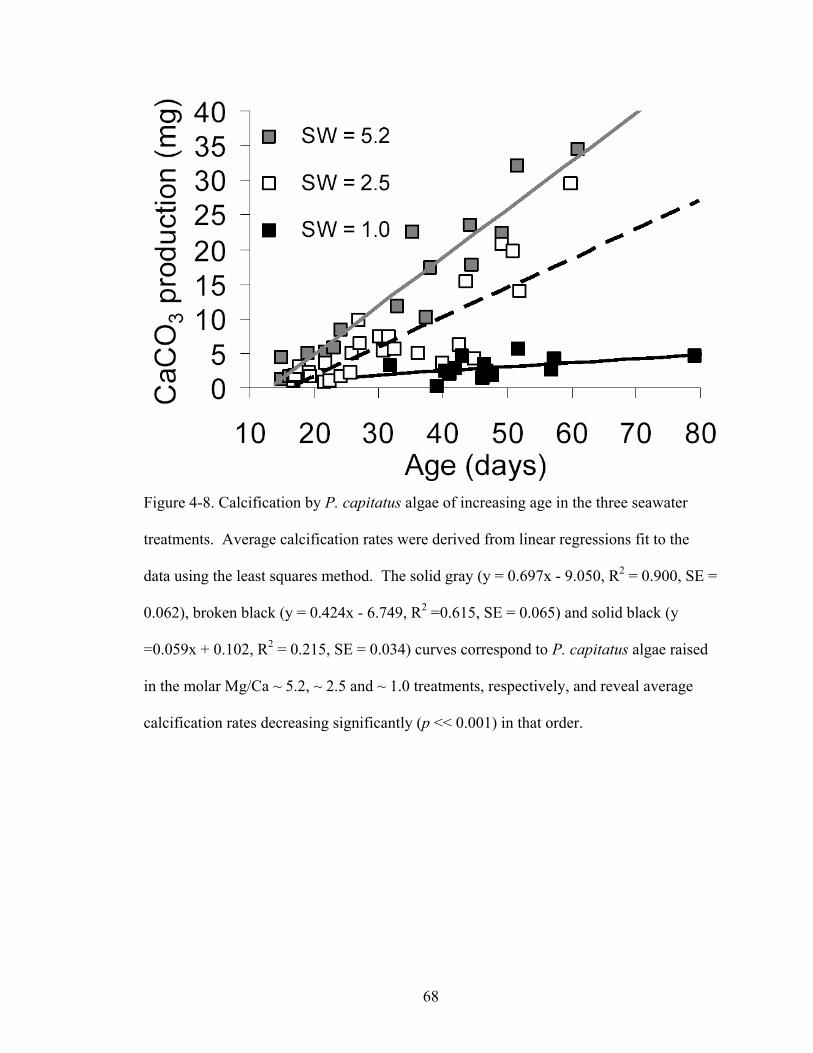
68
Figure 4-8. Calcification by P. capitatus algae of increasing age in the three seawater
treatments. Average calcification rates were derived from linear regressions fit to the
data using the least squares method. The solid gray (y = 0.697x - 9.050, R2 = 0.900, SE =
0.062), broken black (y = 0.424x - 6.749, R2 =0.615, SE = 0.065) and solid black (y
=0.059x + 0.102, R2 = 0.215, SE = 0.034) curves correspond to P. capitatus algae raised
in the molar Mg/Ca ~ 5.2, ~ 2.5 and ~ 1.0 treatments, respectively, and reveal average
calcification rates decreasing significantly (p << 0.001) in that order.
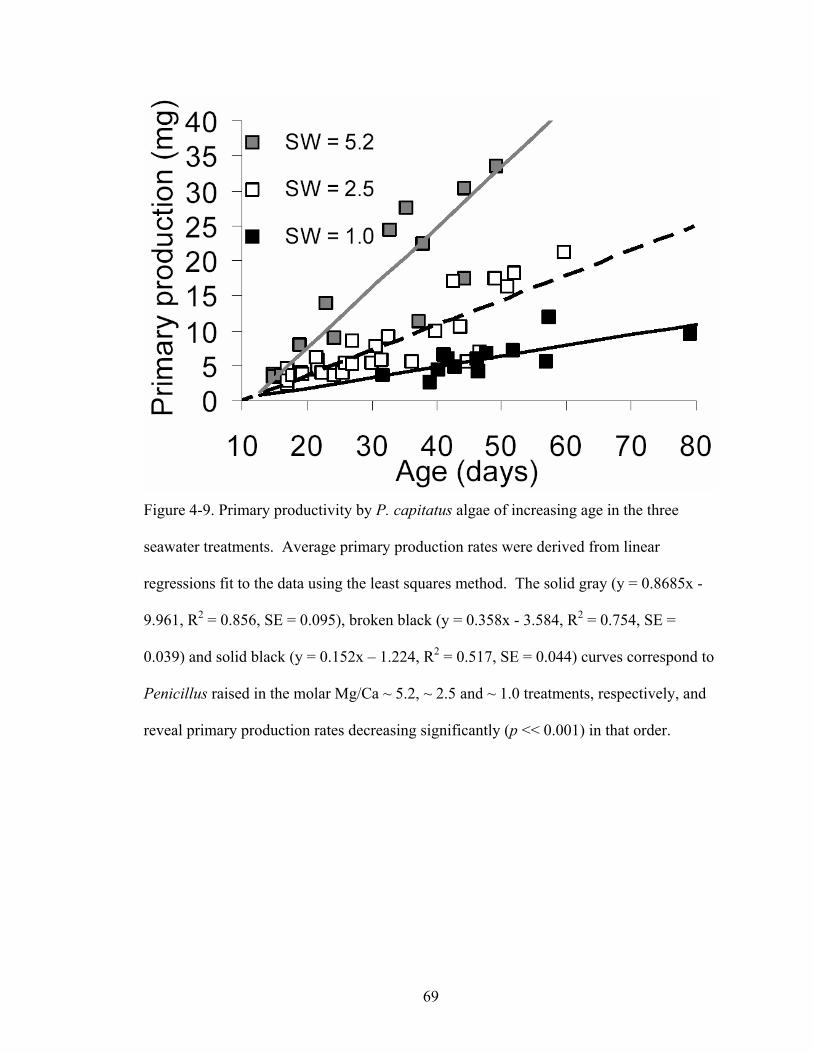
69
Figure 4-9. Primary productivity by P. capitatus algae of increasing age in the three
seawater treatments. Average primary production rates were derived from linear
regressions fit to the data using the least squares method. The solid gray (y = 0.8685x -
9.961, R2 = 0.856, SE = 0.095), broken black (y = 0.358x - 3.584, R2 = 0.754, SE =
0.039) and solid black (y = 0.152x – 1.224, R2 = 0.517, SE = 0.044) curves correspond to
Penicillus raised in the molar Mg/Ca ~ 5.2, ~ 2.5 and ~ 1.0 treatments, respectively, and
reveal primary production rates decreasing significantly (p << 0.001) in that order.
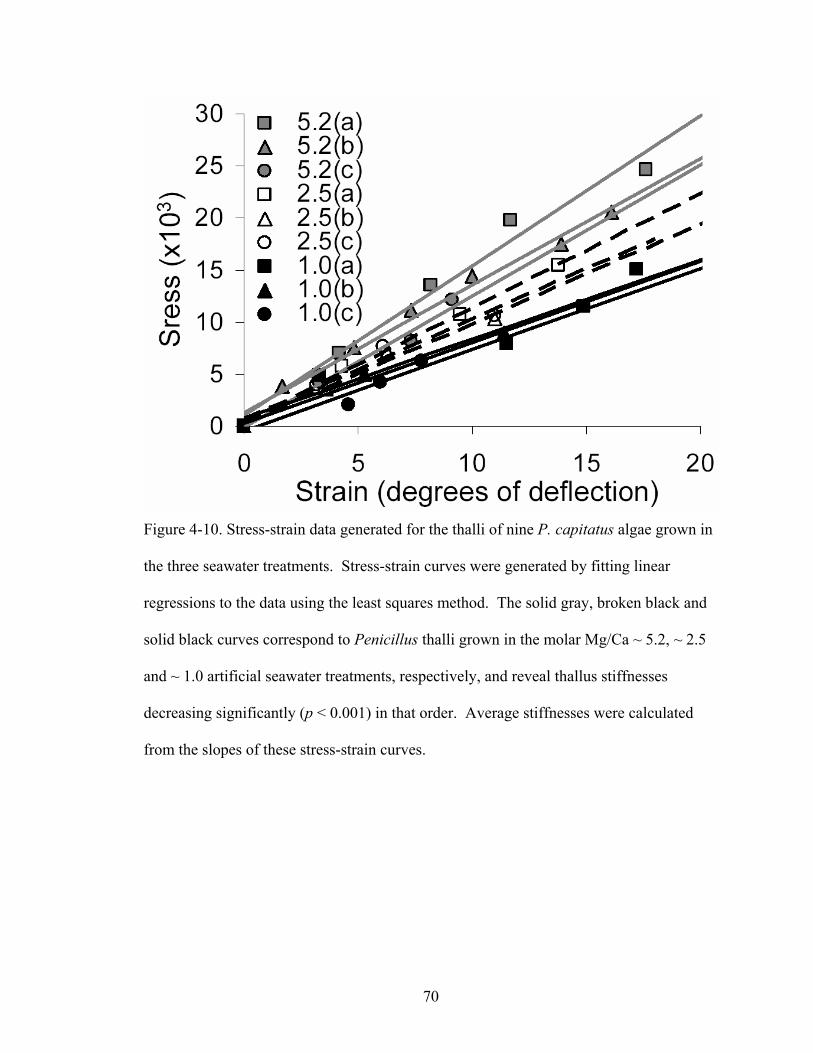
70
Figure 4-10. Stress-strain data generated for the thalli of nine P. capitatus algae grown in
the three seawater treatments. Stress-strain curves were generated by fitting linear
regressions to the data using the least squares method. The solid gray, broken black and
solid black curves correspond to Penicillus thalli grown in the molar Mg/Ca ~ 5.2, ~ 2.5
and ~ 1.0 artificial seawater treatments, respectively, and reveal thallus stiffnesses
decreasing significantly (p < 0.001) in that order. Average stiffnesses were calculated
from the slopes of these stress-strain curves.
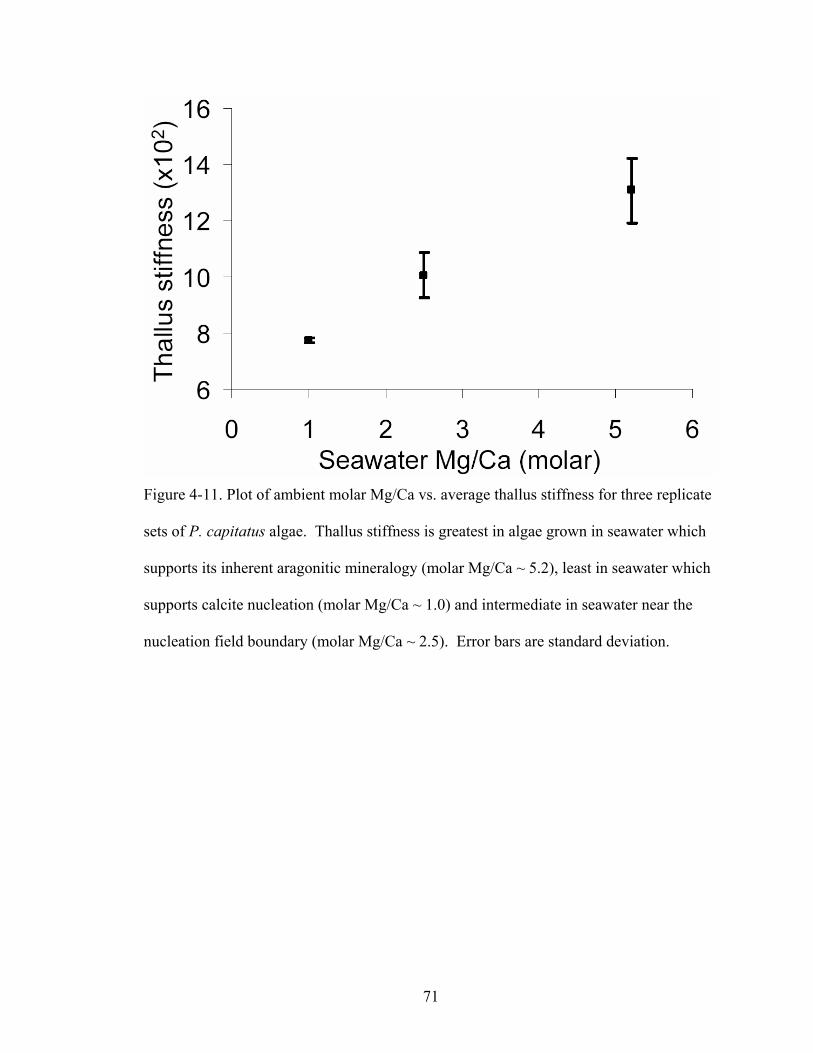
71
Figure 4-11. Plot of ambient molar Mg/Ca vs. average thallus stiffness for three replicate
sets of P. capitatus algae. Thallus stiffness is greatest in algae grown in seawater which
supports its inherent aragonitic mineralogy (molar Mg/Ca ~ 5.2), least in seawater which
supports calcite nucleation (molar Mg/Ca ~ 1.0) and intermediate in seawater near the
nucleation field boundary (molar Mg/Ca ~ 2.5). Error bars are standard deviation.
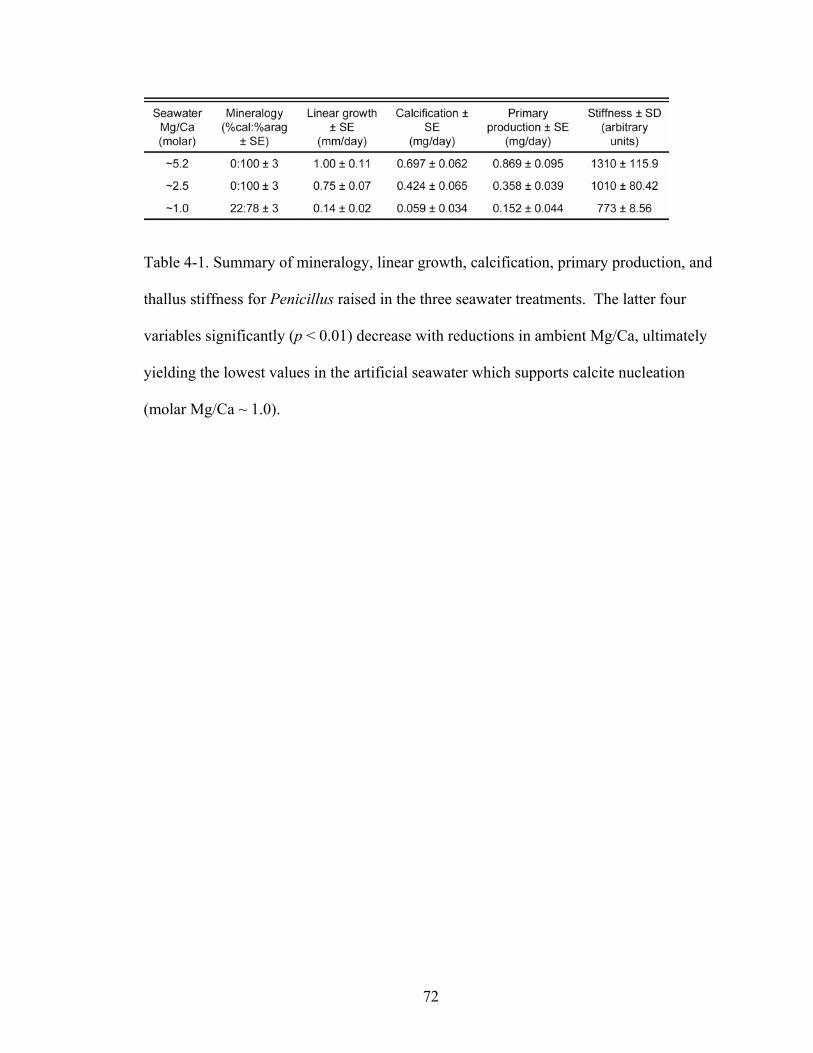
72
Table 4-1. Summary of mineralogy, linear growth, calcification, primary production, and
thallus stiffness for Penicillus raised in the three seawater treatments. The latter four
variables significantly (p < 0.01) decrease with reductions in ambient Mg/Ca, ultimately
yielding the lowest values in the artificial seawater which supports calcite nucleation
(molar Mg/Ca ~ 1.0).

73
Table 4-2. Linear regressions and statistics used to calculate stiffnesses of nine Penicillus
thalli grown in the three seawater treatments. Stiffness decreases significantly (p <
0.001) with reductions in ambient Mg/Ca.
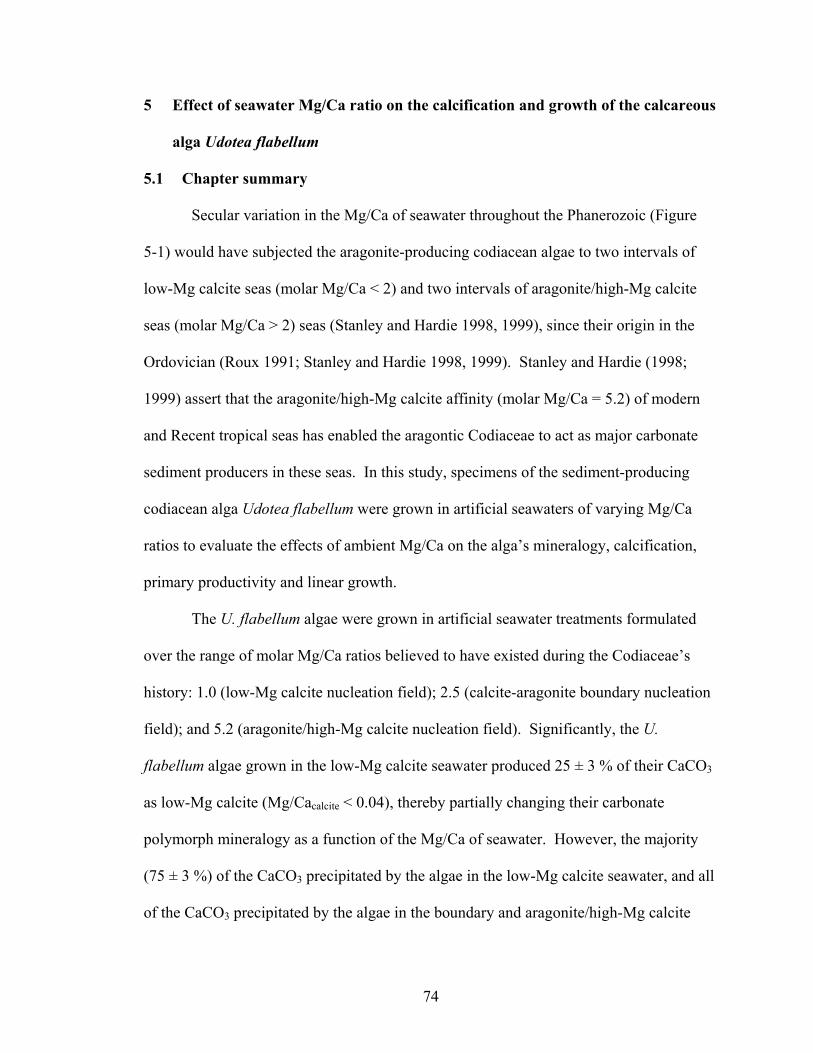
74
5 Effect of seawater Mg/Ca ratio on the calcification and growth of the calcareous
alga Udotea flabellum
5.1 Chapter summary
Secular variation in the Mg/Ca of seawater throughout the Phanerozoic (Figure
5-1) would have subjected the aragonite-producing codiacean algae to two intervals of
low-Mg calcite seas (molar Mg/Ca < 2) and two intervals of aragonite/high-Mg calcite
seas (molar Mg/Ca > 2) seas (Stanley and Hardie 1998, 1999), since their origin in the
Ordovician (Roux 1991; Stanley and Hardie 1998, 1999). Stanley and Hardie (1998;
1999) assert that the aragonite/high-Mg calcite affinity (molar Mg/Ca = 5.2) of modern
and Recent tropical seas has enabled the aragontic Codiaceae to act as major carbonate
sediment producers in these seas. In this study, specimens of the sediment-producing
codiacean alga Udotea flabellum were grown in artificial seawaters of varying Mg/Ca
ratios to evaluate the effects of ambient Mg/Ca on the alga’s mineralogy, calcification,
primary productivity and linear growth.
The U. flabellum algae were grown in artificial seawater treatments formulated
over the range of molar Mg/Ca ratios believed to have existed during the Codiaceae’s
history: 1.0 (low-Mg calcite nucleation field); 2.5 (calcite-aragonite boundary nucleation
field); and 5.2 (aragonite/high-Mg calcite nucleation field). Significantly, the U.
flabellum algae grown in the low-Mg calcite seawater produced 25 ± 3 % of their CaCO3
as low-Mg calcite (Mg/Cacalcite < 0.04), thereby partially changing their carbonate
polymorph mineralogy as a function of the Mg/Ca of seawater. However, the majority
(75 ± 3 %) of the CaCO3 precipitated by the algae in the low-Mg calcite seawater, and all
of the CaCO3 precipitated by the algae in the boundary and aragonite/high-Mg calcite
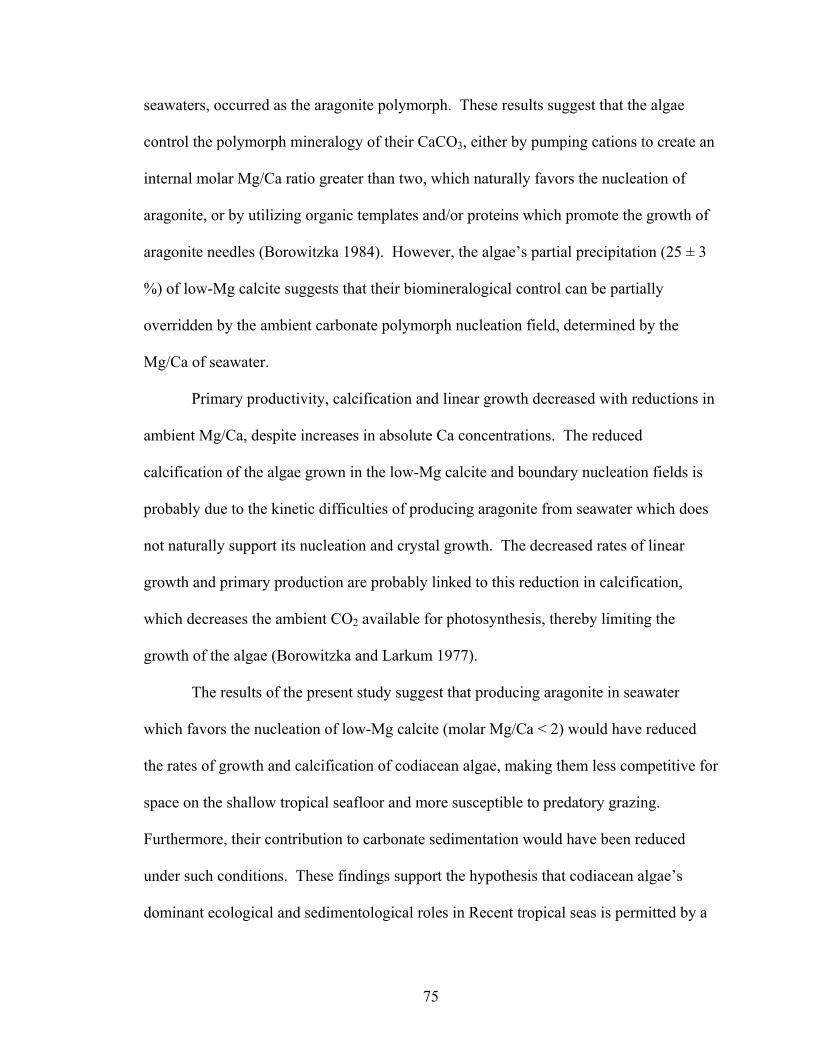
75
seawaters, occurred as the aragonite polymorph. These results suggest that the algae
control the polymorph mineralogy of their CaCO3, either by pumping cations to create an
internal molar Mg/Ca ratio greater than two, which naturally favors the nucleation of
aragonite, or by utilizing organic templates and/or proteins which promote the growth of
aragonite needles (Borowitzka 1984). However, the algae’s partial precipitation (25 ± 3
%) of low-Mg calcite suggests that their biomineralogical control can be partially
overridden by the ambient carbonate polymorph nucleation field, determined by the
Mg/Ca of seawater.
Primary productivity, calcification and linear growth decreased with reductions in
ambient Mg/Ca, despite increases in absolute Ca concentrations. The reduced
calcification of the algae grown in the low-Mg calcite and boundary nucleation fields is
probably due to the kinetic difficulties of producing aragonite from seawater which does
not naturally support its nucleation and crystal growth. The decreased rates of linear
growth and primary production are probably linked to this reduction in calcification,
which decreases the ambient CO2 available for photosynthesis, thereby limiting the
growth of the algae (Borowitzka and Larkum 1977).
The results of the present study suggest that producing aragonite in seawater
which favors the nucleation of low-Mg calcite (molar Mg/Ca < 2) would have reduced
the rates of growth and calcification of codiacean algae, making them less competitive for
space on the shallow tropical seafloor and more susceptible to predatory grazing.
Furthermore, their contribution to carbonate sedimentation would have been reduced
under such conditions. These findings support the hypothesis that codiacean algae’s
dominant ecological and sedimentological roles in Recent tropical seas is permitted by a
76
seawater Mg/Ca ratio which favors the nucleation of aragonite over calcite during this
interval (Stanley and Hardie 1998, 1999).
5.2 Introduction
The mineralogies of the major reef building and sediment producing marine
organisms have tracked transitions in the mineralogy of ooids and marine cements, the
so-called “calcite- and “aragonite seas” (Sandberg 1983), throughout the Phanerozoic
(Stanley and Hardie 1998, 1999; Figure 5-1). Secular variation in the Mg/Ca ratio of
seawater, believed to be responsible for the observed calcite/aragonite sea pattern
throughout the Phanerozoic (Hardie 1996), would have subjected the codiacean algae to
four transitions between high-Mg calcite+aragonite (molar Mg/Ca > 2) and low-Mg
calcite (molar Mg/Ca < 2) nucleation fields in the oceans since their origin in the
Ordovician (Roux 1991; Stanley and Hardie 1998, 1999; Figure 5-1). It has been
proposed that the role of the codiacean algae as major carbonate producers in Recent
tropical seas may be permitted only by the molar Mg/Ca of Recent seawater (~5.2)
remaining within the aragonite polymorph nucleation field, thereby supporting the
algae’s inherent aragonitic mineralogy (Stanley and Hardie 1998, 1999).
In the present study, the relationship between seawater Mg/Ca and algal
biomineralization is evaluated experimentally by growing modern aragonite-producing
algae, Udotea flabellum, in artificial seawaters formulated at Mg/Ca ratios believed to
have existed (Hardie 1996) since the algae’s apparent origination in the Ordovician.
The experiments reveal that the algae continue precipitating the majority of their
calcium carbonate (~75%) as aragonite in the “calcite seawater,” suggesting that the
aragonite polymorph is somehow inherent to the Udotea algae. However, this persistent
77
precipitation of aragonite, occurring out of equilibrium with the ambient “calcite
seawater,” was accompanied by reductions in linear growth, calcification and primary
productivity. These results are significant in their suggestion that codiacean algae which
persisted during calcite seas would have been impaired by concomitant reductions in
rates of growth and calcification, which would have decreased their competitiveness,
made them more susceptible to predation by grazing fish, and reduced their contribution
to carbonate sedimentation.
Such findings support Stanley and Hardie’s (1998; 1999) hypothesis that
variations in the Mg/Ca ratio of seawater have significantly influenced the
biomineralization of calcareous marine organisms throughout the Phanerozoic. This
relationship is particularly intriguing in that it links the normally disparate fields of plate
tectonics, aqueous geochemistry, paleontology and sedimentology.
This study complements a previous study (Ries 2005) which showed similar
results for the codiacean algae Penicillus capitatus, another major sediment producer in
Recent tropical seas. Other related work on the subject has revealed that coralline algae,
echinoderms, serpulid worms, crabs and shrimp, which naturally secrete high-Mg calcite
in modern aragonite seas, actually change their mineralogy to low-Mg calcite when
grown in artificial seawaters formulated at the Mg/Ca ratios which characterize calcite
seas (Stanley et al. 2002; Ries 2004).
5.3 Background
5.3.1 Anatomy
Udotea is an upright standing, fan-shaped alga whose anatomy can be divided
into three basic components: fan, thallus and holdfast (Figure 5-2A). The thallus (stalk)
78
is composed of medullar filaments, which run parallel to the thallial axis, and cortical
filaments, which branch laterally from the medular filaments (Fritsch 1948; Colombo
1978). The cortical filaments are terminated by small swellings, called utricles, which
form the external surface of the thallus. The medullar filaments in the fan (Figure 5-2A)
are heavily branched and lobed (Figure 5-2C). These lobate filaments interweave and
coalesce to form the apparently continuous surface (cortex) of the mature fan (Figure
5-2E; Fritsch 1948). Both the cortical and medular filaments have an inner (Figure 5-2D,
iw) and outer filament wall (ow), which are divided by an organic layer (ol). The two
filament walls and the space between them are collectively referred to as the filament
sheath (f). Unlike Halimeda and Penicillus, the filament sheaths within Udotea flabellum
lack pores (Böhm et al. 1978). The holdfast (Figure 5-2A), consisting of a network of
uncalcified filaments which adhere to sand particles, is located at the base of the alga and
serves to anchor it in the sediment (Hillis 1991). Offspring algae grow from rhyzoids
sent out from the holdfast within the sediment (Figure 5-2B).
Photosynthesis occurs within chloroplasts contained in the cytoplasm within the
medular and cortical filaments. Udotea is considered the most primitive plant with a C4-
like method of photosynthesis, and has called into question the terrestrial origin of this
CO2-efficient process (Reiskind et al. 1988; Reiskind et al. 1989; Reiskind and Bowes
1991)
5.3.2 Calcification
Calcification in U. flabellum occurs as aragonitic needles (< 15µm long), prisms
(0.5 µm long) and serrated crystals (1.0 µm long) precipitated intracellularly within the
filament sheath (between the inner and outer filament walls) and intercellularly in the
79
space between the filaments themselves (Figure 5-2D). The filament sheath contains an
organic layer (ol) which divides the space (Figure 5-2D). Aragonite deposited between
the outer filament wall (ow) and the organic layer (ol) has been termed primary deposit
(PD), while aragonite deposited between the inner filament wall (iw) and the organic
layer (ol) has been termed secondary deposit (SD) (Figure 5-2D; Friedman et al. 1972;
Borowitzka et al. 1974; Borowitzka and Larkum 1977; Flajs 1977; Böhm et al. 1978;
Borowitzka 1984; Kooistra 2002). Mature thalli can contain between 25 and 59 wt-%
aragonite. While the purpose of algal calcification has been debated, its most common
explanation is for rigidity in turbulent hydraulic environments and protection from
grazing predation, especially when combined with acidic, toxic secondary compounds
and nocturnal growth (Wray 1977; Paul and Van Alstyne 1988; Hay et al. 1994; Schupp
and Paul 1994; Hay 1997; Kooistra 2002).
5.3.3 Geologic History of Udotea
The codiacean algae have existed since at least the Ordovician (Chuvashov and
Riding 1984; Flügel 1991; Mamet 1991; Riding and Guo. 1991; Roux 1991; Kooistra
2002), as the Ordovician alga Dimorphosiphon demonstrates a level of organization very
similar to that of the modern Halimeda (Mu 1991). However, the acmes of diversity and
abundance for the Codiaceae occurred first in the Pennsylvanian through Permian, where
they were globally distributed and typically associated with mud mounds and other
carbonate facies, and then again in the Cenozoic, where they were generally restricted to
tropical seas and usually associated with the carbonate facies in which they are found
today (Wray 1977). Notably, both of these intervals coincide with a transition from
calcite to aragonite seas.
80
Mid-Late Carboniferous groups of phylloid algae, such as Eugonophyllum,
Ivanovia, Anchicodium and Calcifolium, all produced a thoroughly calcified blade which
resembles that of Recent Udotea (Wray 1977). The thalli of well-preserved
Pennsylvanian Eugonophyllum (Holder formation, Sacramento Mountains, New Mexico),
like Recent Udotea, contain 25-45 µm diameter branching and irregular filaments
oriented parallel to the thallial axis, maintain a cortical surface constructed from the
bulbous terminations of laterally branching utricles and exhibit an aragonitic mineralogy
(Kirkland et al. 1993). Fossil Succodium algae, from the Permian of Unayzah, Saudi
Arabia (Quassim District), also exhibit a heavily calcified thallus constructed from
medullar filaments oriented parallel to the thallial axis which branch to form
perpendicular cortical filaments terminating as bulbous utricles (Okla 1992). The
common morphology and aragonitic mineralogy of the fossil and Recent algae suggest
Eugonophyllum and Succodium, and possibly similar Pennsylvanian-Permian phylloid
algae, are phylogenetically related to Udotea (Okla 1992; Kirkland et al. 1993).
The most abundant codiacean algae in modern tropical seas are Udotea, Penicillus
and Halimeda (Wray 1977). However, nuclear encoded ribosomal DNA analysis
(Zechman et al. 1990) reveals that Penicillus and Udotea are the most closely related,
suggesting the brush of the former alga is merely the uncorticated blade of the latter.
Alternatively, Halimeda was shown to be the most phylogenetically distant.
5.3.4 Ecology and Biogeography
Udotea typically grows in the tropics (> 25ºC) on unconsolidated substrata in low
energy backreef/lagoon/bay environments up to 40 m in depth (Hillis 1991). It is less
stenothermic than other codiacean algae (such as Penicillus and Halimeda), as three
81
Udotea species have been identified growing in the subtropical Atlantic waters off the
coast of North Carolina (Hillis 1991). The alga is globally distributed, with greatest
densities occurring in the Caribbean Sea, followed by the Mediterranean Sea (Hillis-
Colinvaux 1980), the Great Barrier Reef (Drew and Abel 1988) and restricted tropical
Indian, Pacific and Atlantic Ocean localities (Hillis 1991). The alga grows rapidly,
attaining a height of up to 20 cm over its 1 to 3 month lifespan. Udotea densities up to 8
algae m-2 have been reported in southern Florida (Neumann and Land 1975).
5.3.5 Sedimentary Production
The codiacean algae have been contributing to carbonate sedimentation since at
least the Ordovician (Roux 1991). Modern codiacean algae of the genera Halimeda,
Penicillus and Udotea are among the most important carbonate sediment producers and
bioherm-builders in Recent and modern tropical marine environments (Lowenstam 1955;
Milliman 1977; Hillis-Colinvaux 1980; Wefer 1980; Drew 1983; Hudson 1985; Hine et
al. 1988; Marshall and Davies 1988; Multer 1988; Orme and Salama 1988; Payri 1988;
Phipps and Roberts 1988; Roberts et al. 1988; Mu 1991). Rates of carbonate sediment
production in Recent codiacean algal dominated marine environments are estimated to
range from 0.18 to 5.9 m 1000y-1 (Hillis 1991). Such rapid rates of carbonate accretion
by these algae, attributable to their relatively large size (up to 20 cm in height), short
lifespans (1 – 3 months; i.e., rapid turnover), high rates of growth (up to 2 mm d-1), high
population densities (76 – 109 algae m-2) and global distribution throughout the shallow
tropical environments of the Caribbean and Mediterranean seas (Hillis-Colinvaux 1980),
Great Barrier Reef (Drew and Abel 1988) and Indo-Pacific ocean (Hillis 1991), suggests
that they could be responsible for most of the aragonite mud deposited in Recent tropical
82
environments (Stockman et al. 1967; Neumann and Land 1975; Hillis 1991). Carbon and
oxygen isotopes have confirmed that most Recent tropical carbonate mud is algal in
origin (Lowenstam and Epstein 1957).
It should be noted that estimates of algal contribution to carbonate sedimentation
based solely on recognizable skeletal debris in sediment cores are only between 11 and
29 wt-% (Cloud 1962; Bathurst 1975). This may be attributable to the absence from
codiacean algae, like Udotea and Penicillus, of discrete anatomical components which
can be easily recognized in sediment samples. Unlike coral, urchin and mollusk
fragments, these algae rapidly break down into ambiguous aragonite needles,
unidentifiable at the organismal level. Therefore, the quantification of Udotea’s
contribution to carbonate sediment production, based solely on recognizable skeletal
debris, may be low.
While the codiacean algae’s contribution to carbonate sedimentation in Recent
tropical seas is significant, it has been suggested that they have fulfilled similar roles
during aragonite seas of the past, initially during the late Paleozoic and then again in the
Cenozoic (Høeg 1927; Johnson 1961; Jux 1966; Wray 1977; Segonzak 1986; Flügel
1988; Mankiewicz 1988). However, the geological record of their sedimentary
contribution over these intervals may be concealed by their typically poor preservation.
5.3.6 Seawater Chemistry
The molar Mg/Ca ratio of seawater has fluctuated between ~1.0 and ~5.2
throughout the Phanerozoic, probably as a function of the rate of ocean crust production
(Hardie 1996). As mid-ocean ridge basalt comes in contact with brine, it is converted to
greenstone; thereby releasing Ca2+ and K+ to the seawater and removing Mg2+ and SO42-
83
from it. The rate of ocean crust production controls the rate of this ion exchange and,
therefore, the relative concentrations of these ions in the oceans. Therefore, high rates of
ocean crust production result in relatively low seawater Mg/Ca ratios, as existed during
the Cretaceous period. The secular variation of oceanic Mg/Ca is revealed by the
coupling of MgSO4 evaporites and aragonite biotic/abiotic precipitates (both favored by
high Mg/Ca ratios) and KCl evaporites and calcite biotic/abiotic precipitates (both
favored by low Mg/Ca ratios) (Sandberg 1983; Hardie 1996; Stanley and Hardie 1998,
1999), fluid inclusions (Lowenstein et al. 2001; Lowenstein et al. 2003) and Br (Siemann
2003) in marine halite, and the Mg/Ca ratios of fossil echinoderms (Dickson 2002, 2004).
Laboratory experiments on the MgCl2—CaCl2—Na2CO3—H2O system revealed
that ambient Mg/Ca ratio, ionic strength and temperature determine the precipitation of
calcite versus aragonite/high-Mg calcite from seawater (Füchtbauer and Hardie 1976;
1980). The Mg/Ca mole ratio value of ~ 2 (± 0.5) was determined to be the boundary
between the calcite (Mg/Ca < 2) and aragonite + high-Mg calcite (Mg/Ca > 2) nucleation
fields (Leitmeier 1910, 1915; Lippman 1960; Müller et al. 1972; Folk 1974) for chloride
solutions under laboratory conditions approximating modern values of ionic strength (I =
0.7), temperature (28ºC), pressure (1 atm total pressure) and atmospheric pCO2. Ancient
Mg/Ca values calculated from established rates of ocean crust production (Hardie 1996)
predict that the oceans would have transitioned between the aragonite/high-Mg calcite
and low-Mg calcite nucleation fields four times throughout the Phanerozoic, thereby
predicting a pattern of aragonite and calcite seas which is consistent with the
mineralogical record of ooids and marine cements (Sandberg 1983) and skeletal
carbonates (Stanley and Hardie 1998, 1999) throughout the Phanerozoic.
84
5.4 Methods
5.4.1 Artificial seawater preparation
Three 10-gal glass aquaria were each filled with 30 L artificial seawater
formulated at molar Mg/Ca ratios of 1.0 (low-Mg calcite nucleation field), 2.5 (boundary
nucleation field) and 5.2 (aragonite/high-Mg calcite nucleation field; modern seawater).
Excluding the concentrations of Mg and Ca, the artificial seawaters were identically
formulated at normal marine values (Bidwell and Spotte 1985). Their ionic strengths
were held constant at the modern value of 0.7. Mg/Ca ratios remained within 5% of their
initial values throughout the duration of the experiments. The aquaria were fertilized
with 20.0 mg/L NaNO3, 1.3 mg/L NaH2PO4.H2O, and 0.025 mL/L EDTA, all within the
normal range for nearshore tropical marine waters (Spotte 1979). The aquaria were
maintained at 25 ± 1ºC using 50-Watt electric heaters, illuminated with 10 hours/day of
identical irradiance (19 Watts) and continuously filtered with Millennium 2000 Wet-Dry
Multi-filters (rate of filtration = 600 L/hour).
5.4.2 Specimen collection
Young U. flabellum algae were collected from the back-reef lagoon of Caye
Caulker, Belize. Specimens were stored in plastic bags filled with natural seawater from
these locations and transported by plane to the laboratory at Johns Hopkins University the
following day. After transport, the algae were placed in a holding tank of normal salinity
for 7 days. The algae were acclimated to the artificial seawater treatments in stages,
being moved every 3 days to seawater treatments of successively lower Mg/Ca ratios, so
as to minimize any chemical shock.
5.4.3 Mineralogical analysis
85
Three U. flabellum offspring specimens were grown from comparably-sized
parent algae in each of the three seawater treatments (nine specimens total). After 60
days of growth, the organisms were removed from the seawater treatments and
immediately washed for 30 seconds with distilled water. The specimens were sectioned
parallel to their thallus axes, from their holdfasts to the upper tips of their fans, and dried
in an oven for 4 hours at 100ºC. Carbon paint was used to secure the specimens to
cylindrical SEM carbon mounts, which were then carbon coated for 25 min. The U.
flabellum specimens were thoroughly examined in a JEOL 8600 scanning electron
microscope for CaCO3 precipitates. Photomicrographs of the algae’s thalli and
accompanying mineral precipitates were taken in the SEM. The algae were then each
ground to a fine powder and mixed with ethyl alcohol to create a suspension which was
allowed to dry overnight on a glass slide. The dried material was then analyzed for
calcium carbonate polymorph mineralogy using an x-ray diffractometer. The proportion
of calcite-to-aragonite was calculated as the ratio of the area under the primary calcite
peak (2 = 29.4 – 29.5º) to the area under the primary aragonite peak (2 = 26.2º).
5.4.4 Linear growth, calcification and primary productivity
Forty equal-sized parent algae were grown for 80 days in each of the three
seawater treatments (for a total of one-hundred and twenty specimens). Over the duration
of the experiment, most of the parent algae produced offspring algae. The first
appearances of offspring algae were noted throughout the experiment. The parent and
offspring U. flabellum specimens were scale-photographed every seven days. Linear
growth of the offspring algae was measured from the weekly photographs. Average
86
linear growth rates were calculated for the offspring algae over the weeks that they
exhibited measurable linear growth.
After 80 days, the offspring algae were harvested and their ages determined
relative to the date of their first appearance. The offspring algae were then dried for 24
hours in an oven set to 100 ºC, after which their dry weight was measured. The
specimens were then baked in an oven at 450 ºC for four hours to combust all organic
matter. The weight of the residual calcium carbonate material was measured and
recorded as their total calcification. The difference between the algae’s original dry
weight and the weight of their residual mineral material after combustion was recorded as
their primary production (that is, the organic matter removed by combustion).
5.5 Results
5.5.1 Mineralogical analysis
SEM images of the U. flabellum offspring algae reveal that they all precipitate
aragonite needles throughout their organic tissue, regardless of the Mg/Ca ratio of the
artificial seawater in which they are grown (Figure 5-3). The needles are mostly between
1 and 4 µm in length and are packed in apparently random arrangements throughout a 10
µm-thick zone between the outer walls of the medular and cortical filaments (Figure 5-3).
However, as indicated in Figure 5-3 (A, B), there is evidence of another mineral
precipitate intermixed with the aragonite needles which clearly lacks the acicular habit of
the aragonite crystals. Powder x-ray diffraction of the algae’s mineral content reveals
that the specimens grown in the artificial calcite seawater actually produced 25 (± 3) % of
their CaCO3 as the low-Mg calcite polymorph (< 4 mole % MgCO3) and 75 (± 3) % as
the aragonite polymorph (Figure 5-4). XRD patterns and SEM imaging of the algae
87
grown in the aragonite and boundary artificial seawaters reveal that they produced
aragonite exclusively.
5.5.2 Linear growth rates, calcification and primary productivity
The total number of offspring algae produced varied among the different artificial
seawater treatments. Twenty-three offspring algae grew in the normal (~5.2) Mg/Ca
seawater treatments, while only 16 and 17 algae grew in the low (~1.0) and intermediate
(~2.5) Mg/Ca seawater treatments, respectively.
Linear growth rates increased significantly (p < 0.17) with seawater Mg/Ca
(Figure 5-5; Appendix I). U. flabellum grown in the lowest, intermediate and highest
Mg/Ca treatments had average linear growth rates (± standard error) of 0.70 (± 0.08),
0.86 (± 0.09) and 0.96 (± 0.15) mm d-1, respectively (Table 5-1).
In the low Mg/Ca seawater (~1.0), U. flabellum offspring ranged in age from 5 to
24 days. In the intermediate Mg/Ca seawater (~2.5), U. flabellum offspring ranged in age
from 5 to 40 days. In the high Mg/Ca seawater (~5.2), U. flabellum offspring ranged in
age from 6 to 54 days. These differences in the ages among the algae are due to the
simultaneous harvest of specimens which vary in their dates of origination.
The ages of the offspring U. flabellum algae were plotted against their total
calcification (Figure 5-6) and primary production (Figure 5-7), resulting in a timeline of
these variables representing the lifespan of an “idealized” alga raised in seawater with the
given Mg/Ca ratio. This was the only way to obtain a continuous measure of
calcification and primary production throughout the life of an alga, as the measurement of
these variables requires the combustion, and therefore, destruction of the specimen. The
algae’s rates of calcification (Figure 5-6) and primary production (Figure 5-7; Table 5-1)
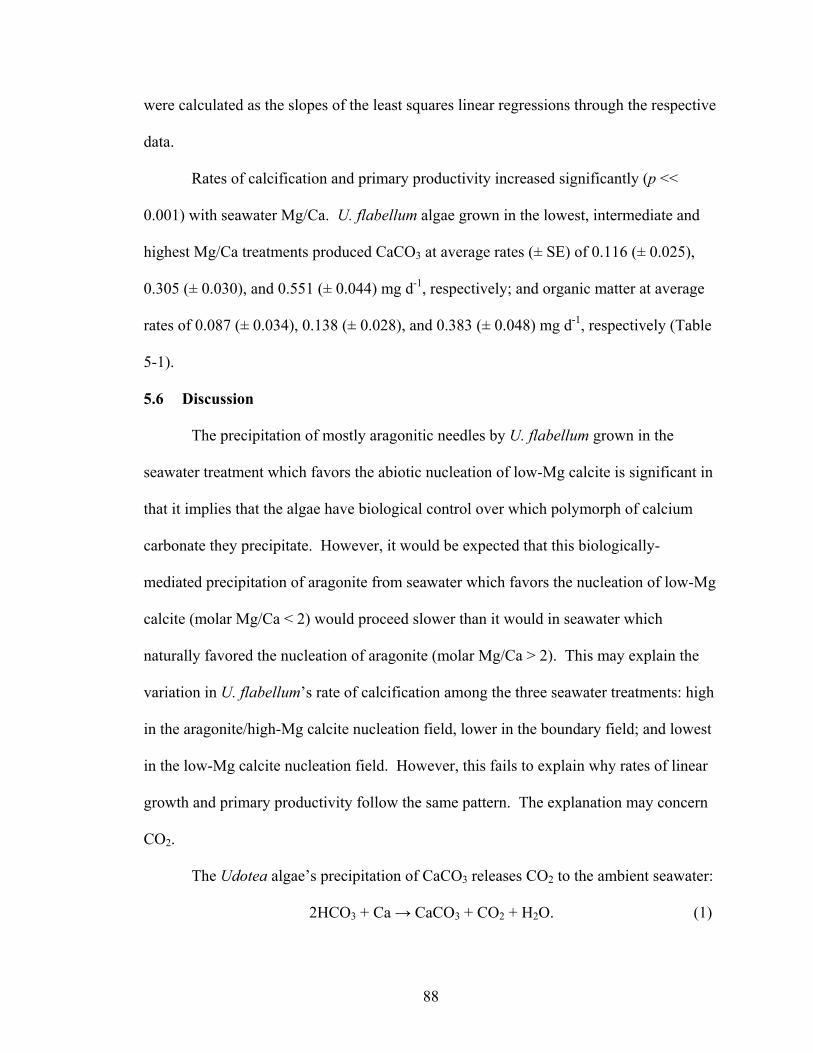
88
were calculated as the slopes of the least squares linear regressions through the respective
data.
Rates of calcification and primary productivity increased significantly (p <<
0.001) with seawater Mg/Ca. U. flabellum algae grown in the lowest, intermediate and
highest Mg/Ca treatments produced CaCO3 at average rates (± SE) of 0.116 (± 0.025),
0.305 (± 0.030), and 0.551 (± 0.044) mg d-1, respectively; and organic matter at average
rates of 0.087 (± 0.034), 0.138 (± 0.028), and 0.383 (± 0.048) mg d-1, respectively (Table
5-1).
5.6 Discussion
The precipitation of mostly aragonitic needles by U. flabellum grown in the
seawater treatment which favors the abiotic nucleation of low-Mg calcite is significant in
that it implies that the algae have biological control over which polymorph of calcium
carbonate they precipitate. However, it would be expected that this biologically-
mediated precipitation of aragonite from seawater which favors the nucleation of low-Mg
calcite (molar Mg/Ca < 2) would proceed slower than it would in seawater which
naturally favored the nucleation of aragonite (molar Mg/Ca > 2). This may explain the
variation in U. flabellum’s rate of calcification among the three seawater treatments: high
in the aragonite/high-Mg calcite nucleation field, lower in the boundary field; and lowest
in the low-Mg calcite nucleation field. However, this fails to explain why rates of linear
growth and primary productivity follow the same pattern. The explanation may concern
CO2.
The Udotea algae’s precipitation of CaCO3 releases CO2 to the ambient seawater:
2HCO3 + Ca CaCO3 + CO2 + H2O. (1)
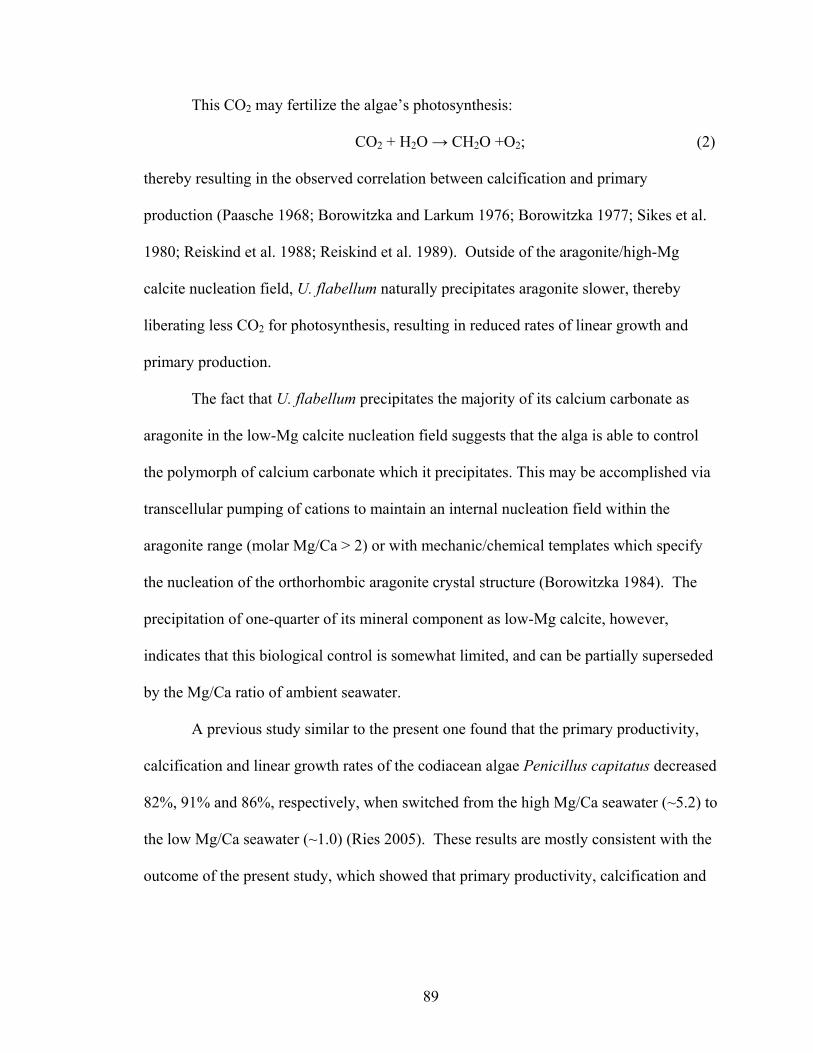
89
This CO2 may fertilize the algae’s photosynthesis:
CO2 + H2O CH2O +O2; (2)
thereby resulting in the observed correlation between calcification and primary
production (Paasche 1968; Borowitzka and Larkum 1976; Borowitzka 1977; Sikes et al.
1980; Reiskind et al. 1988; Reiskind et al. 1989). Outside of the aragonite/high-Mg
calcite nucleation field, U. flabellum naturally precipitates aragonite slower, thereby
liberating less CO2 for photosynthesis, resulting in reduced rates of linear growth and
primary production.
The fact that U. flabellum precipitates the majority of its calcium carbonate as
aragonite in the low-Mg calcite nucleation field suggests that the alga is able to control
the polymorph of calcium carbonate which it precipitates. This may be accomplished via
transcellular pumping of cations to maintain an internal nucleation field within the
aragonite range (molar Mg/Ca > 2) or with mechanic/chemical templates which specify
the nucleation of the orthorhombic aragonite crystal structure (Borowitzka 1984). The
precipitation of one-quarter of its mineral component as low-Mg calcite, however,
indicates that this biological control is somewhat limited, and can be partially superseded
by the Mg/Ca ratio of ambient seawater.
A previous study similar to the present one found that the primary productivity,
calcification and linear growth rates of the codiacean algae Penicillus capitatus decreased
82%, 91% and 86%, respectively, when switched from the high Mg/Ca seawater (~5.2) to
the low Mg/Ca seawater (~1.0) (Ries 2005). These results are mostly consistent with the
outcome of the present study, which showed that primary productivity, calcification and
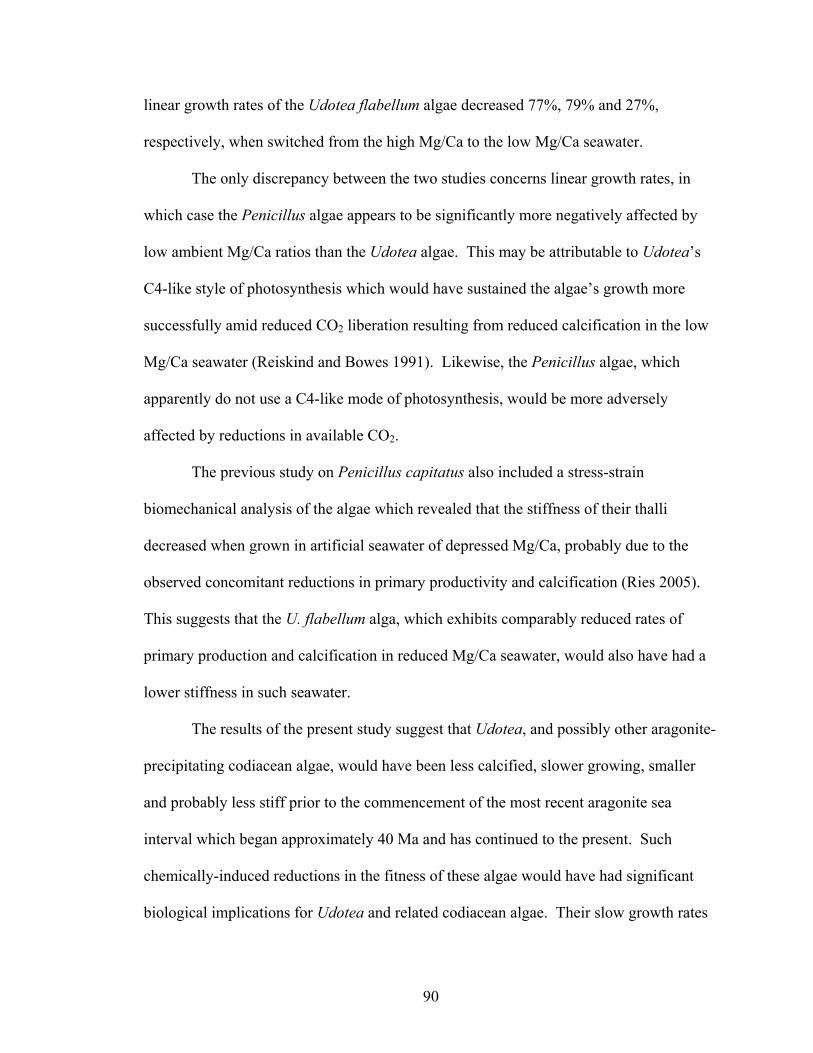
90
linear growth rates of the Udotea flabellum algae decreased 77%, 79% and 27%,
respectively, when switched from the high Mg/Ca to the low Mg/Ca seawater.
The only discrepancy between the two studies concerns linear growth rates, in
which case the Penicillus algae appears to be significantly more negatively affected by
low ambient Mg/Ca ratios than the Udotea algae. This may be attributable to Udotea’s
C4-like style of photosynthesis which would have sustained the algae’s growth more
successfully amid reduced CO2 liberation resulting from reduced calcification in the low
Mg/Ca seawater (Reiskind and Bowes 1991). Likewise, the Penicillus algae, which
apparently do not use a C4-like mode of photosynthesis, would be more adversely
affected by reductions in available CO2.
The previous study on Penicillus capitatus also included a stress-strain
biomechanical analysis of the algae which revealed that the stiffness of their thalli
decreased when grown in artificial seawater of depressed Mg/Ca, probably due to the
observed concomitant reductions in primary productivity and calcification (Ries 2005).
This suggests that the U. flabellum alga, which exhibits comparably reduced rates of
primary production and calcification in reduced Mg/Ca seawater, would also have had a
lower stiffness in such seawater.
The results of the present study suggest that Udotea, and possibly other aragonite-
precipitating codiacean algae, would have been less calcified, slower growing, smaller
and probably less stiff prior to the commencement of the most recent aragonite sea
interval which began approximately 40 Ma and has continued to the present. Such
chemically-induced reductions in the fitness of these algae would have had significant
biological implications for Udotea and related codiacean algae. Their slow growth rates
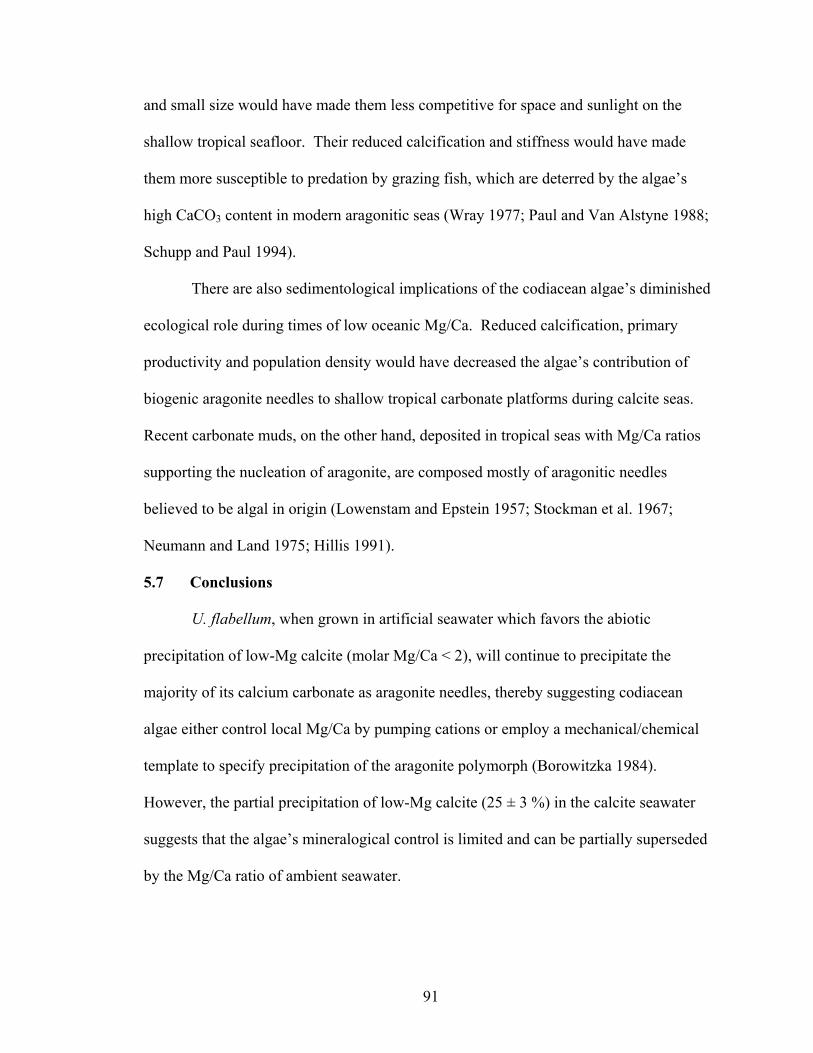
91
and small size would have made them less competitive for space and sunlight on the
shallow tropical seafloor. Their reduced calcification and stiffness would have made
them more susceptible to predation by grazing fish, which are deterred by the algae’s
high CaCO3 content in modern aragonitic seas (Wray 1977; Paul and Van Alstyne 1988;
Schupp and Paul 1994).
There are also sedimentological implications of the codiacean algae’s diminished
ecological role during times of low oceanic Mg/Ca. Reduced calcification, primary
productivity and population density would have decreased the algae’s contribution of
biogenic aragonite needles to shallow tropical carbonate platforms during calcite seas.
Recent carbonate muds, on the other hand, deposited in tropical seas with Mg/Ca ratios
supporting the nucleation of aragonite, are composed mostly of aragonitic needles
believed to be algal in origin (Lowenstam and Epstein 1957; Stockman et al. 1967;
Neumann and Land 1975; Hillis 1991).
5.7 Conclusions
U. flabellum, when grown in artificial seawater which favors the abiotic
precipitation of low-Mg calcite (molar Mg/Ca < 2), will continue to precipitate the
majority of its calcium carbonate as aragonite needles, thereby suggesting codiacean
algae either control local Mg/Ca by pumping cations or employ a mechanical/chemical
template to specify precipitation of the aragonite polymorph (Borowitzka 1984).
However, the partial precipitation of low-Mg calcite (25 ± 3 %) in the calcite seawater
suggests that the algae’s mineralogical control is limited and can be partially superseded
by the Mg/Ca ratio of ambient seawater.
92
Rates of linear growth, calcification and primary production decreases for U.
flabellum algae grown in seawater which favors the nucleation of low-Mg calcite over the
aragonite polymorph. Slower calcification will result in reduced liberation of CO2
available for algal photosynthesis, which may be responsible for the concomitant
reductions in rates of linear growth and primary production observed in the experiments
(Borowitzka and Larkum 1976; Borowitzka 1977).
The results of the present study indicate that producing aragonite in seawater
which favors the nucleation of the low-Mg calcite polymorph would have reduced the
competitiveness of these algae, made them more susceptible to grazing predation and
diminished their contribution to carbonate sedimentation. These results support the
assertion that the dominant ecological and sedimentological roles of codiacean algae in
Recent tropical seas is facilitated by the Mg/Ca ratio of seawater supporting the algae’s
aragonitic mineralogy over this interval (Stanley and Hardie 1998).

93
5.8 Figures and tables
Figure 5-1. Evidence and predictions of secular variation in the Mg/Ca of seawater
throughout the Phanerozoic which supported 3 periods of aragonite/high-Mg calcite
nucleation and 2 periods of calcite nucleation. Curve is molar Mg/Ca ratio predicted
from established rates of ocean crust production (Hardie 1996). Black vertical bars are
molar Mg/Ca ranges calculated from the Mg content of fossil echinoderms (Dickson
2002, 2004). Solid black circles are molar Mg/Ca values estimated from Br in basal
marine halite (Siemann 2003). Gray vertical bars with t-tops are molar Mg/Ca ranges
estimated from fluid inclusions in marine halites (Lowenstein et al. 2001; Lowenstein et
al. 2003). Star represents modern seawater chemistry (molar Mg/Ca = ~5.2). Horizontal
line divides the calcite (Mg/Ca < 2) and aragonite/high-Mg calcite (Mg/Ca > 2)
nucleation fields in seawater of 25ºC. Intervals of abiotic aragonite (“A”) and calcite
(“C”) precipitates (Sandberg 1983) and KCl and MgSO4 marine evaporites (Hardie 1996)
are plotted along the top of the figure (modified from Lowenstein et al. 2001).
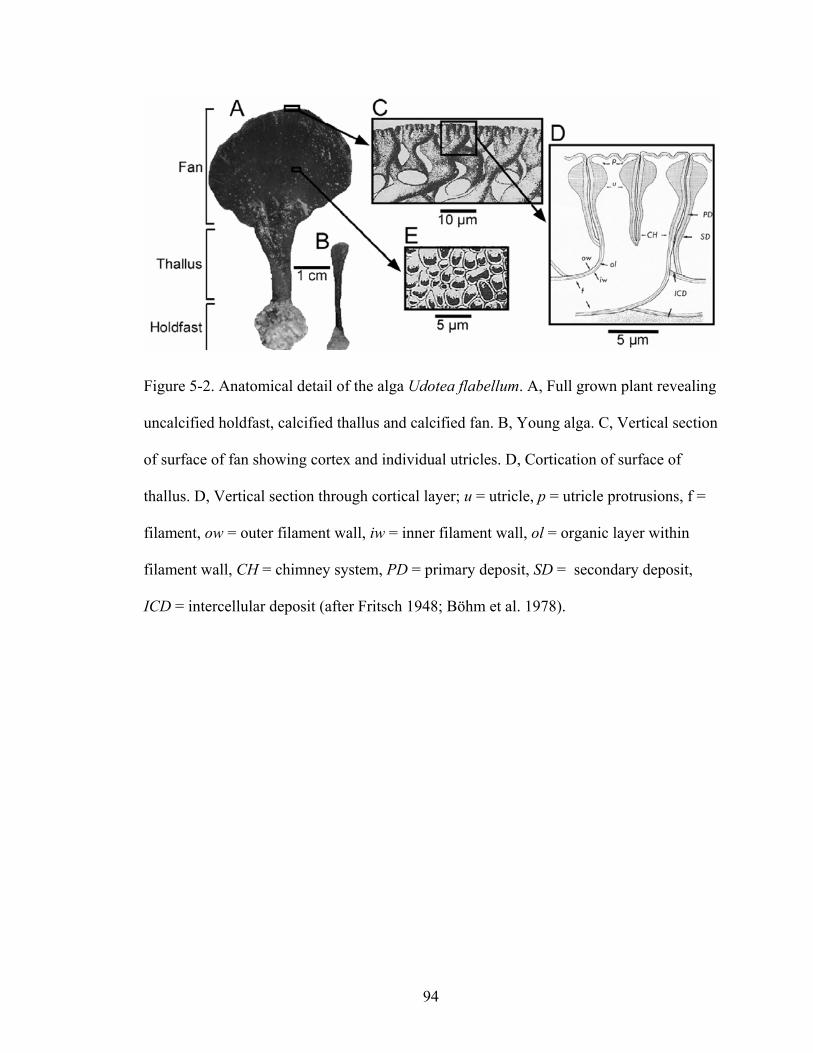
94
Figure 5-2. Anatomical detail of the alga Udotea flabellum. A, Full grown plant revealing
uncalcified holdfast, calcified thallus and calcified fan. B, Young alga. C, Vertical section
of surface of fan showing cortex and individual utricles. D, Cortication of surface of
thallus. D, Vertical section through cortical layer; u = utricle, p = utricle protrusions, f =
filament, ow = outer filament wall, iw = inner filament wall, ol = organic layer within
filament wall, CH = chimney system, PD = primary deposit, SD = secondary deposit,
ICD = intercellular deposit (after Fritsch 1948; Böhm et al. 1978).

95
Figure 5-3. A-B, Scanning electron micrographs of the calcifying chamber between the
inner and outer walls of filaments within a U. flabellum alga grown in seawater of molar
Mg/Ca ~ 1.0 (calcite seawater). Black arrows point to possible calcite crystals,
interspersed among the more numerous aragonite needles. C-D, Scanning electron
micrographs for a comparable region of a U. flabellum alga grown in seawater of molar
Mg/Ca ~ 5.2 (aragonite seawater). Note absence of the purported calcite crystals
identified in A-B.

96
Figure 5-4. A, X-ray diffraction pattern for a U. flabellum alga which produced 100%
aragonite when grown in seawater which favors the nucleation of the aragonite
polymorph (molar Mg/Ca = 5.2). Primary aragonite peak occurs at 2 = 26.2º. B, X-ray
diffraction pattern for pure calcite, revealing primary calcite peak at 2 = 29.4º. C, X-ray
diffraction pattern for a U. flabellum alga which produced 25 ± 3 % calcite and 75 ± 3 %
aragonite, as calculated from the respective areas beneath the primary calcite peak (2 =
29.4-29.5º) and the primary aragonite peak (2 = 26.2º).
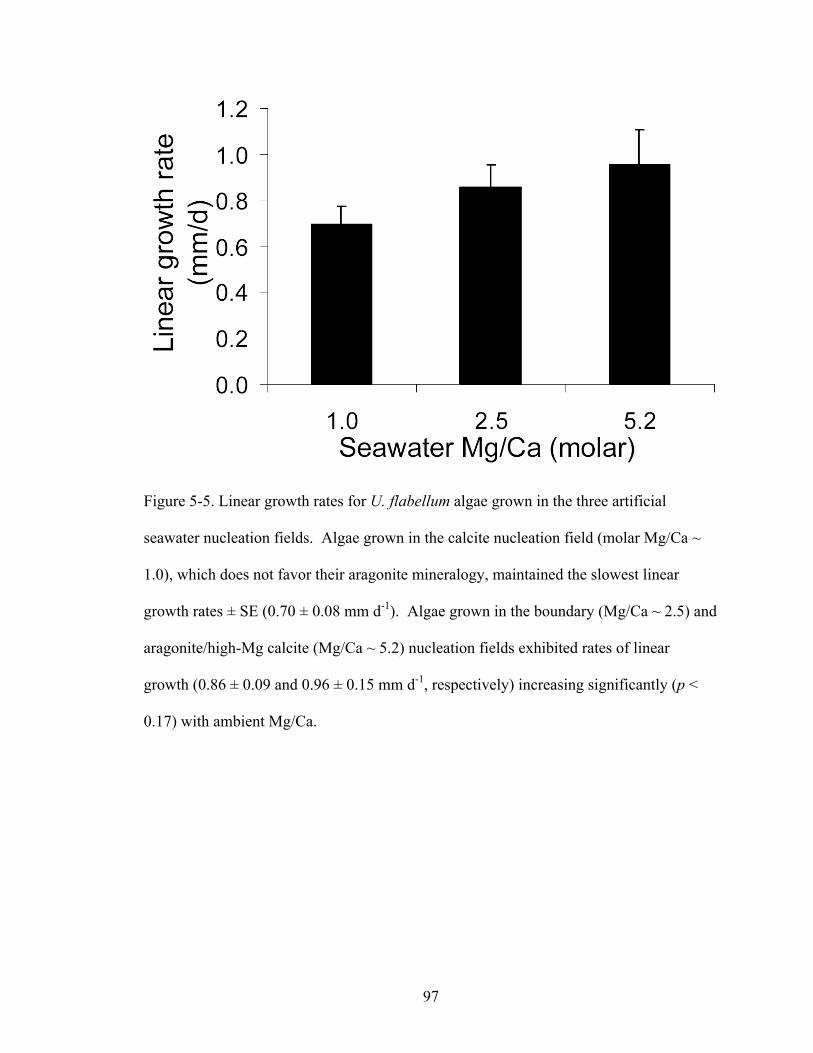
97
Figure 5-5. Linear growth rates for U. flabellum algae grown in the three artificial
seawater nucleation fields. Algae grown in the calcite nucleation field (molar Mg/Ca ~
1.0), which does not favor their aragonite mineralogy, maintained the slowest linear
growth rates ± SE (0.70 ± 0.08 mm d-1). Algae grown in the boundary (Mg/Ca ~ 2.5) and
aragonite/high-Mg calcite (Mg/Ca ~ 5.2) nucleation fields exhibited rates of linear
growth (0.86 ± 0.09 and 0.96 ± 0.15 mm d-1, respectively) increasing significantly (p <
0.17) with ambient Mg/Ca.
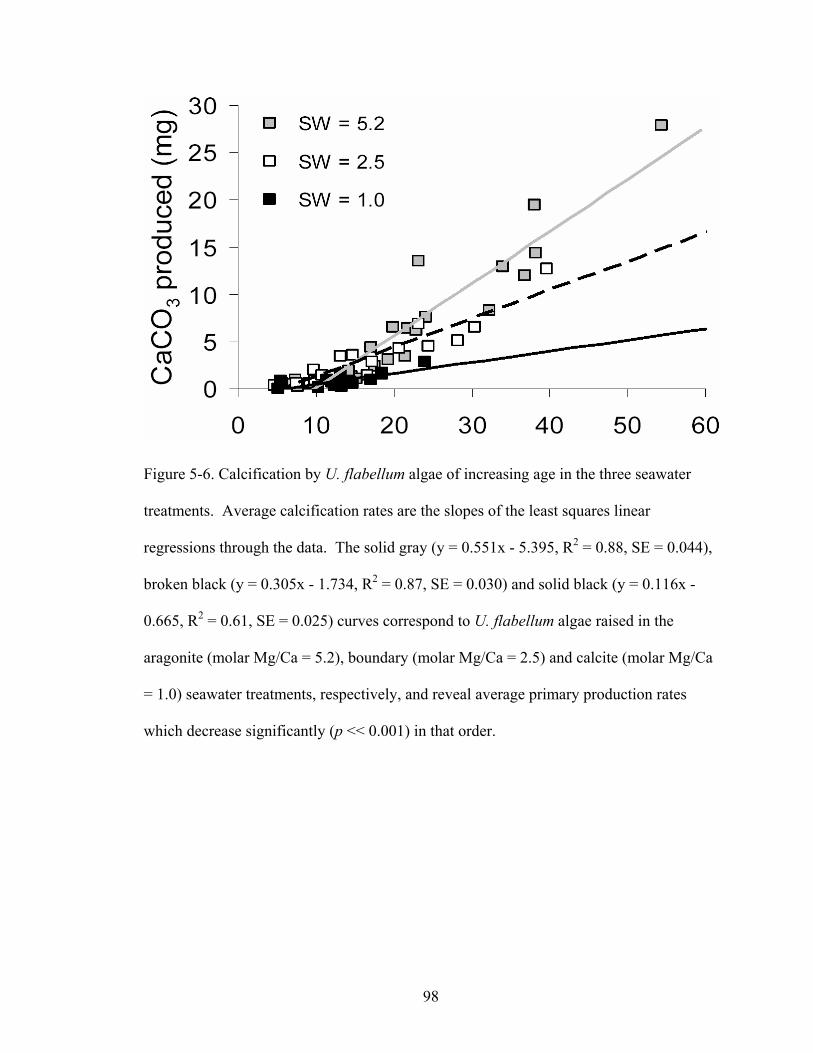
98
Figure 5-6. Calcification by U. flabellum algae of increasing age in the three seawater
treatments. Average calcification rates are the slopes of the least squares linear
regressions through the data. The solid gray (y = 0.551x - 5.395, R2 = 0.88, SE = 0.044),
broken black (y = 0.305x - 1.734, R2 = 0.87, SE = 0.030) and solid black (y = 0.116x -
0.665, R2 = 0.61, SE = 0.025) curves correspond to U. flabellum algae raised in the
aragonite (molar Mg/Ca = 5.2), boundary (molar Mg/Ca = 2.5) and calcite (molar Mg/Ca
= 1.0) seawater treatments, respectively, and reveal average primary production rates
which decrease significantly (p << 0.001) in that order.

99
Figure 5-7. Primary productivity of U. flabellum algae of increasing age in the three
seawater treatments. Average primary production rates are the slopes of the least squares
linear regressions through the data. The solid gray (y = 0.383x – 2.738, R2 = 0.75, SE =
0.048), broken black (y = 0.138x + 0.241, R2 = 0.62, SE = 0.028) and solid black (y =
0.087x + 0.477, R2 = 0.32, SE = 0.034) curves correspond to U. flabellum algae raised in
the aragonite (molar Mg/Ca = 5.2), boundary (molar Mg/Ca = 2.5) and calcite (molar
Mg/Ca = 1.0) seawater treatments, respectively, and reveal average calcification rates
which decrease significantly (p << 0.001) in that order.

100
Table 5-1. Summary of mineralogy, linear growth, calcification and primary production
for Udotea algae raised in the three artificial seawater treatments. Significantly, each of
these variables decreases with reduced ambient Mg/Ca, ultimately yielding the lowest
values in the artificial seawater which favors the nucleation of calcite over aragonite
(molar Mg/Ca ~ 1.0)
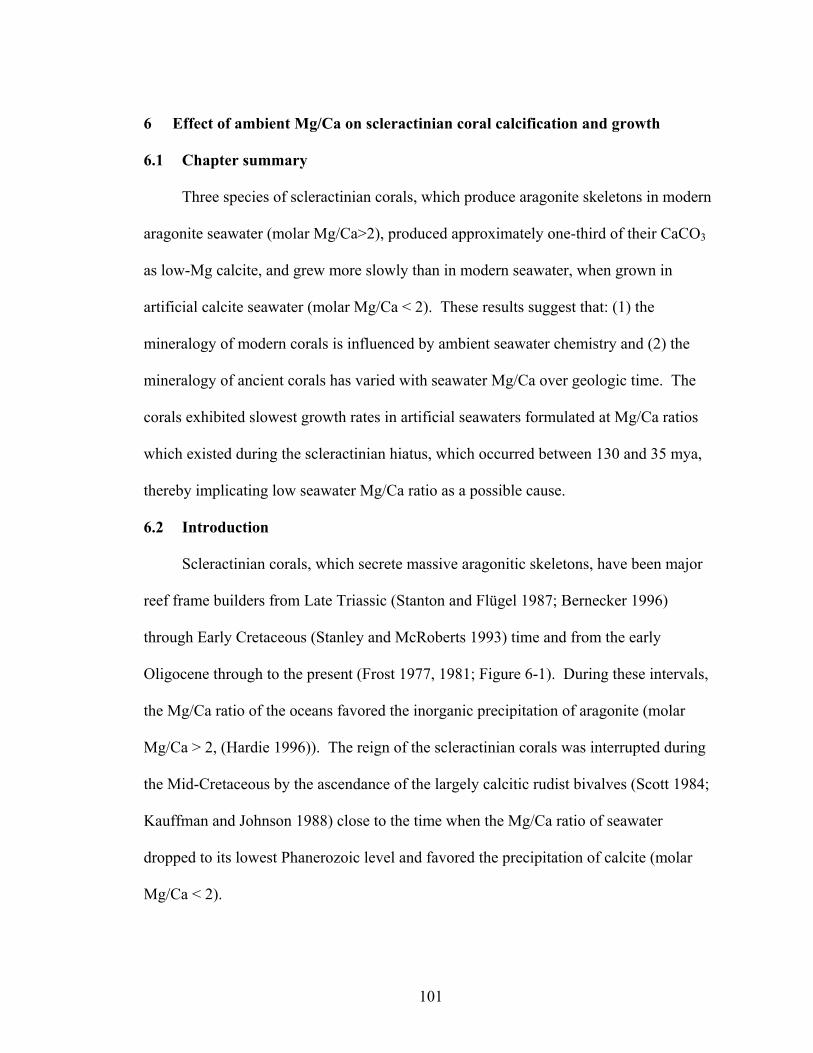
101
6 Effect of ambient Mg/Ca on scleractinian coral calcification and growth
6.1 Chapter summary
Three species of scleractinian corals, which produce aragonite skeletons in modern
aragonite seawater (molar Mg/Ca>2), produced approximately one-third of their CaCO3
as low-Mg calcite, and grew more slowly than in modern seawater, when grown in
artificial calcite seawater (molar Mg/Ca < 2). These results suggest that: (1) the
mineralogy of modern corals is influenced by ambient seawater chemistry and (2) the
mineralogy of ancient corals has varied with seawater Mg/Ca over geologic time. The
corals exhibited slowest growth rates in artificial seawaters formulated at Mg/Ca ratios
which existed during the scleractinian hiatus, which occurred between 130 and 35 mya,
thereby implicating low seawater Mg/Ca ratio as a possible cause.
6.2 Introduction
Scleractinian corals, which secrete massive aragonitic skeletons, have been major
reef frame builders from Late Triassic (Stanton and Flügel 1987; Bernecker 1996)
through Early Cretaceous (Stanley and McRoberts 1993) time and from the early
Oligocene through to the present (Frost 1977, 1981; Figure 6-1). During these intervals,
the Mg/Ca ratio of the oceans favored the inorganic precipitation of aragonite (molar
Mg/Ca > 2, (Hardie 1996)). The reign of the scleractinian corals was interrupted during
the Mid-Cretaceous by the ascendance of the largely calcitic rudist bivalves (Scott 1984;
Kauffman and Johnson 1988) close to the time when the Mg/Ca ratio of seawater
dropped to its lowest Phanerozoic level and favored the precipitation of calcite (molar
Mg/Ca < 2).

102
The rudists continued as primary reef builders through the end of the Cretaceous.
Significantly, however, the scleractinian corals did not resume forming massive,
widespread reefs until early in the Oligocene, just after the Mg/Ca of seawater shifted
back into the aragonite stability field (Figure 2-1), despite the global climate cooling that
had occurred at that time (Wolfe 1978).
The Mg/Ca ratio of seawater is believed to vary as a function of the mixing rate of
mid-ocean ridge (MOR) and large igneous province (LIP) hydrothermal brines with
average river water, driven by the rate of ocean crust production (Hardie 1996). As
upwelling mid-oceanic ridge basalt interacts with marine brine, the basalt is converted to
greenstone, thereby removing Mg2+ and SO42– from seawater and releasing Ca2+ and K+
to it. The rate of MOR and LIP ocean-crust production controls the rates of this ion
exchange and, therefore, the relative concentrations of these ions in seawater. This
relationship between ocean crust production and seawater Mg/Ca is evidenced in
synchronized transitions between MgSO4 and KCl evaporites and aragonite and calcite
biotic or abiotic precipitates (Sandberg 1983; Hardie 1996; Stanley and Hardie 1998,
1999), fluid inclusions (Lowenstein et al. 2001; Lowenstein et al. 2003) and Br (Siemann
2003) in marine halite, and the Mg/Ca ratios of fossil echinoderms (Dickson 2002, 2004).
It has been proposed that shifts in the Mg/Ca ratio of seawater, which alternately
favored the precipitation of calcite and aragonite throughout the Phanerozoic (Figure
6-1), may have influenced the success of scleractinian corals as primary reef builders
throughout their existence (Stanley and Hardie 1998, 1999). Here, we present the results
of laboratory experiments designed to evaluate the actual influence of seawater Mg/Ca on
103
the mineralogy and growth rates of three species of modern scleractinian corals,
Acropora cervicornis, Porites cylindrica, and Montipora digitata.
6.3 Methods
Sixty comparably-sized individuals of each of the three species (180 total) were
grown for 60 days in six artificial seawaters which were identical except for their molar
Mg/Ca ratios, which were formulated at 1.0, 1.5, 2.5, 3.5, 5.2, and 7.0, thereby
encompassing the range of values (Hardie 1996) believed to have existed throughout the
scleractinian corals’ existence (Figure 6-1). To differentiate between the effects of
Mg/Ca ratio and absolute concentration of Ca on coral growth, three additional seawaters
were formulated with fixed Ca concentrations at Mg/Ca ratios of 1, 3.5 and 5.2. This also
permits the comparison of coral growth rates in two sets of seawaters with fixed Mg/Ca
ratios (1 and 5.2) and different absolute Ca concentrations.
The basic seawater composition, excluding variations in Mg and Ca, was
formulated at modern values (Bidwell and Spotte 1985). The sum of the molar
concentrations of Mg and Ca in each treatment was equal to that of modern seawater,
except for those with fixed Ca concentrations, in which cases the salinities of these
seawaters were maintained at modern values by adjusting the NaCl concentration.
Each 10-gallon tank was continuously filtered with Millennium 2000 Wet-Dry
Multi-filters (rate of filtration = 600 L/hour). Water temperature was maintained at 25 ±
1 ºC using a 50 watt heater. Water was circulated with two motor-driven pumps
positioned at opposite ends of the tanks. Eight hours per day of irradiation was provided
by twin “Power Compact” coral lights that emit wavelengths commensurate with both
mid-day and twilight/dawn natural light. The coral specimens were acclimated to the
104
artificial seawater treatments over a thirty day period, in stages, to minimize any
chemical shock they might experience when exposed to the modified Mg/Ca ratios. The
corals were fed 1.8 ml of Red Sea CoralGro plankton suspension daily. Red Sea Vitamin
(0.75 mL), Coral Trace Element (1.5 mL) and Iodine (0.75 mL) supplements were added
to the aquaria weekly. Mg and Ca concentrations remained within 5% of their initial
values throughout the duration of the experiment.
Photographs and buoyant weight of the corals specimens were obtained at the
beginning of the experiment, subsequent to the 30-day acclimation period, and then again
after 60 days of growth in the artificial seawaters. New growth of the coral skeletons was
removed and micro-imaged using the JEOL 8600 Superprobe scanning electron
microscope. Skeletal Sr/Ca and Mg/Ca ratios were obtained using wave dispersive and
energy dispersive spectrometry, respectively, in the SEM’s microprobe (beam current =
0.02 A, accelerating potential = 15 kV, counting time = 15 s, beam diameter = 1–2 m).
The polymorph mineralogy of the new coral growth was determined through XRD
analysis. The proportion of calcite-to-aragonite was calculated as the ratio of the area
under the primary calcite peak (2 = 29.4 - 30.1º) to the area under the primary aragonite
peak (2 = 26.2º) (Milliman 1974).
6.4 Mineralogy
XRD analysis of new skeletal growth (Figure 6-2, Appendix K) revealed that the
three species of corals each secreted about one-third of their skeleton as low-Mg calcite
when grown in the low Mg/Ca artificial calcite seawater (molar Mg/Ca = 1.0).
Concentrations of Sr (derived from) and Mg (derived from) were mapped to approximate
the distribution of aragonite and calcite, respectively, in the corals’ skeletons (Figure
105
6-3). As seawater Mg/Ca increased, the proportion of calcite decreased in the coral
skeletons (Figure 6-4A).
Notably, the Mg/Ca ratio of the calcite secreted by the corals increased
proportionally with the Mg/Ca ratio of the seawater, thereby producing low-Mg calcite
(molar Mg/Ca < 0.04) in seawater of molar Mg/Ca < 2, and high-Mg calcite (molar
Mg/Ca > 0.04) in seawater of molar Mg/Ca > 2 (Figure 6-4B, Appendix K). This
relationship is consistent with that observed for Mg incorporation in calcareous animals
(echinoids, crabs, shrimp, serpulid worms) (Ries 2004), coralline algae (Stanley et al.
2002), and some species of coccolithophores (Stanley et al. 2005). The Mg/Ca ratios of
the aragonite secreted by the corals, which were roughly one-tenth the magnitude of the
calcite Mg/Ca ratios, also increased with the ambient Mg/Ca ratio (Figure 6-4B,
Appendix K).
Sr/Ca ratios were predictably higher in the aragonitic portions of the experimental
coral skeletons than in the calcitic portions, as aragonite more readily incorporates the Sr
cation into its crystal structure (Figure 6-4C, Appendix L). However, the Sr/Ca ratio in
both the aragonite and calcite secreted by the scleractinian corals in these experiments
increased with the Mg/Ca ratio of the ambient seawater. This may be partially attributed
to higher growth rates observed in the artificial seawaters formulated at elevated Mg/Ca,
as Sr incorporation in corals has been shown to vary with growth rate (Cohen and
McConnaughey 2003). Such a relationship must be accounted for in paleotemperature
reconstructions (Hart and Cohen 1996) that are based on the Sr/Ca of fossil corals which
existed when oceanic Mg/Ca differed from what it is today.

106
It has been proposed that organic matter detected within the centers of
calcification of scleractinian corals (up to 1% by volume) is a vestige of the organic
matrices and templates which specify the nucleation of the aragonitic polymorph (Cuif et
al. 1999). That the corals grown in the artificial seawater with an Mg/Ca ratio favoring
the inorganic precipitation of low-Mg calcite still precipitated two-thirds of their skeleton
as aragonite supports the hypothesis that corals do exert significant control over their
skeletal mineralogy (Cuif et al. 1999). However, our discovery that scleractinian corals
precipitate approximately one-third of their skeleton as low-Mg calcite, instead of
aragonite, in the artificial calcite seawater suggests that corals are somewhat limited in
their capacity for CaCO3 polymorph control.
Additional evidence that scleractinians are limited in their mineralogical control is
their tendency to incorporate Mg, as observed in this study, and other trace elements
(Cohen and McConnaughey 2003), into their skeletons in proportions which reflect their
abundance in seawater. Furthermore, the acicular morphology and spherulitic
organization of the aragontic crystals in the sclerodermites of coral skeletons closely
resembles the spherulitic aragonite which forms inorganically in marine cements,
suggesting that they could be deposited by abiotic precipitation (Barnes 1970).
Seawater reaches the coral’s region of calcification, beneath the calicoblastic
ectoderm, by moving through cells, between cells, and by diffusion through the porous
skeleton. An ATPase pump elevates Ca in the region of calcification only slightly above
the level of ambient seawater (Al-Horani et al. 2003), thereby suggesting corals
precipitate their skeletons from only slightly chemically-modified seawater. The
accelerated precipitation rate of the coral skeleton, nearly 100 times that of inorganic
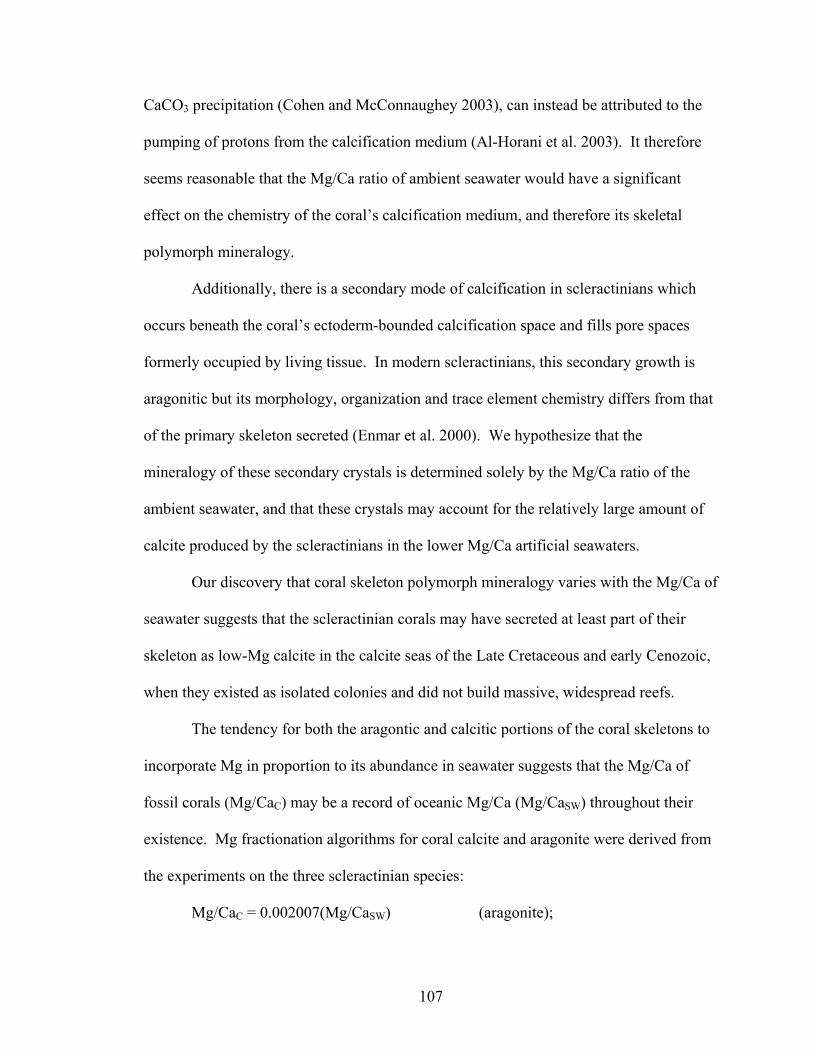
107
CaCO3 precipitation (Cohen and McConnaughey 2003), can instead be attributed to the
pumping of protons from the calcification medium (Al-Horani et al. 2003). It therefore
seems reasonable that the Mg/Ca ratio of ambient seawater would have a significant
effect on the chemistry of the coral’s calcification medium, and therefore its skeletal
polymorph mineralogy.
Additionally, there is a secondary mode of calcification in scleractinians which
occurs beneath the coral’s ectoderm-bounded calcification space and fills pore spaces
formerly occupied by living tissue. In modern scleractinians, this secondary growth is
aragonitic but its morphology, organization and trace element chemistry differs from that
of the primary skeleton secreted (Enmar et al. 2000). We hypothesize that the
mineralogy of these secondary crystals is determined solely by the Mg/Ca ratio of the
ambient seawater, and that these crystals may account for the relatively large amount of
calcite produced by the scleractinians in the lower Mg/Ca artificial seawaters.
Our discovery that coral skeleton polymorph mineralogy varies with the Mg/Ca of
seawater suggests that the scleractinian corals may have secreted at least part of their
skeleton as low-Mg calcite in the calcite seas of the Late Cretaceous and early Cenozoic,
when they existed as isolated colonies and did not build massive, widespread reefs.
The tendency for both the aragontic and calcitic portions of the coral skeletons to
incorporate Mg in proportion to its abundance in seawater suggests that the Mg/Ca of
fossil corals (Mg/CaC) may be a record of oceanic Mg/Ca (Mg/CaSW) throughout their
existence. Mg fractionation algorithms for coral calcite and aragonite were derived from
the experiments on the three scleractinian species:
Mg/CaC = 0.002007(Mg/CaSW) (aragonite);
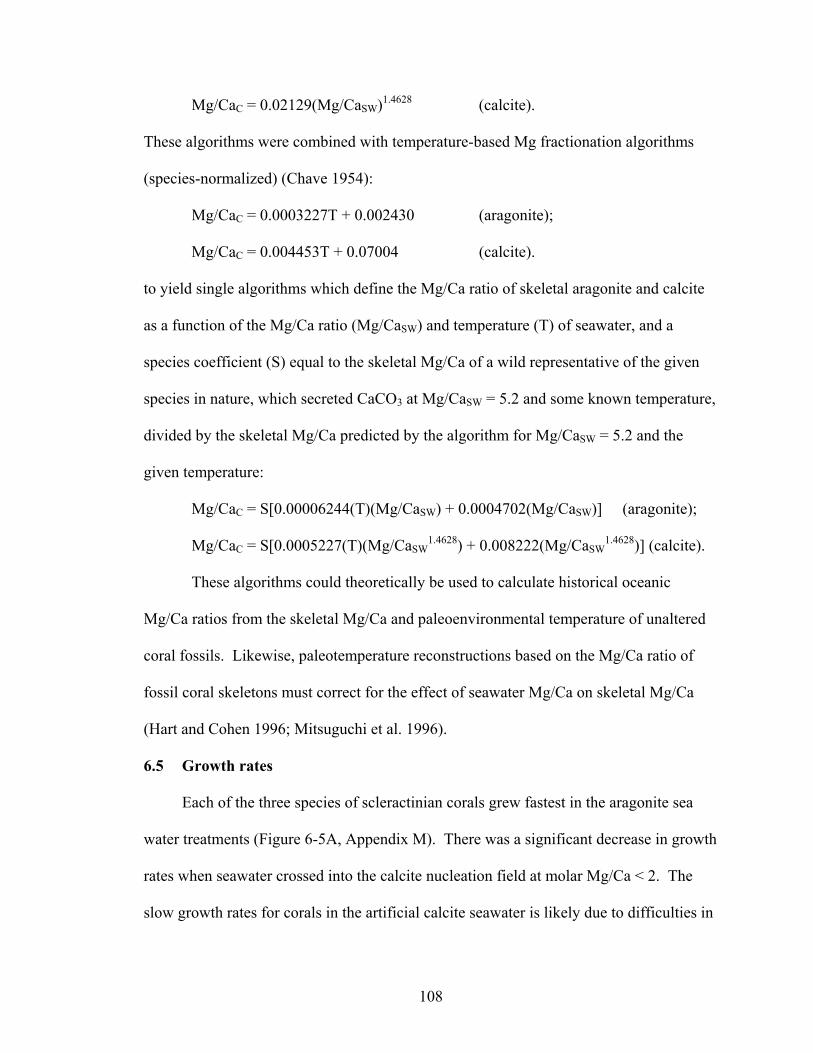
108
Mg/CaC = 0.02129(Mg/CaSW)1.4628 (calcite).
These algorithms were combined with temperature-based Mg fractionation algorithms
(species-normalized) (Chave 1954):
Mg/CaC = 0.0003227T + 0.002430 (aragonite);
Mg/CaC = 0.004453T + 0.07004 (calcite).
to yield single algorithms which define the Mg/Ca ratio of skeletal aragonite and calcite
as a function of the Mg/Ca ratio (Mg/CaSW) and temperature (T) of seawater, and a
species coefficient (S) equal to the skeletal Mg/Ca of a wild representative of the given
species in nature, which secreted CaCO3 at Mg/CaSW = 5.2 and some known temperature,
divided by the skeletal Mg/Ca predicted by the algorithm for Mg/CaSW = 5.2 and the
given temperature:
Mg/CaC = S[0.00006244(T)(Mg/CaSW) + 0.0004702(Mg/CaSW)] (aragonite);
Mg/CaC = S[0.0005227(T)(Mg/CaSW1.4628) + 0.008222(Mg/CaSW
1.4628)] (calcite).
These algorithms could theoretically be used to calculate historical oceanic
Mg/Ca ratios from the skeletal Mg/Ca and paleoenvironmental temperature of unaltered
coral fossils. Likewise, paleotemperature reconstructions based on the Mg/Ca ratio of
fossil coral skeletons must correct for the effect of seawater Mg/Ca on skeletal Mg/Ca
(Hart and Cohen 1996; Mitsuguchi et al. 1996).
6.5 Growth rates
Each of the three species of scleractinian corals grew fastest in the aragonite sea
water treatments (Figure 6-5A, Appendix M). There was a significant decrease in growth
rates when seawater crossed into the calcite nucleation field at molar Mg/Ca < 2. The
slow growth rates for corals in the artificial calcite seawater is likely due to difficulties in
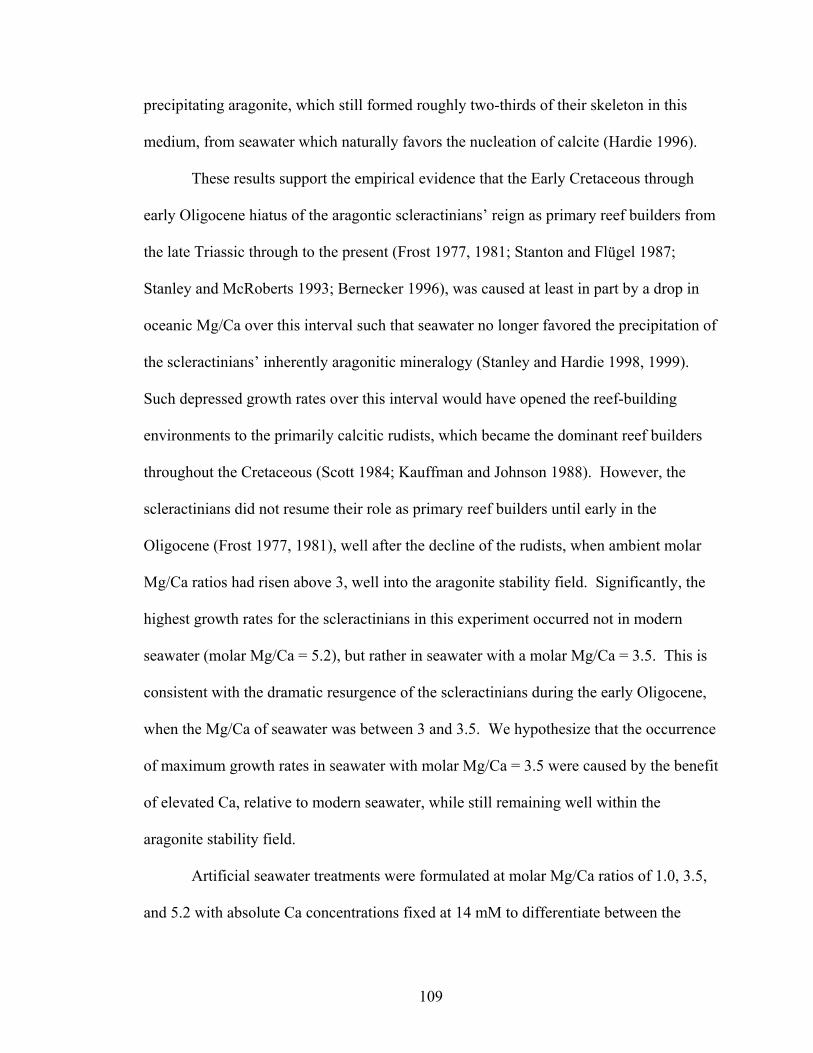
109
precipitating aragonite, which still formed roughly two-thirds of their skeleton in this
medium, from seawater which naturally favors the nucleation of calcite (Hardie 1996).
These results support the empirical evidence that the Early Cretaceous through
early Oligocene hiatus of the aragontic scleractinians’ reign as primary reef builders from
the late Triassic through to the present (Frost 1977, 1981; Stanton and Flügel 1987;
Stanley and McRoberts 1993; Bernecker 1996), was caused at least in part by a drop in
oceanic Mg/Ca over this interval such that seawater no longer favored the precipitation of
the scleractinians’ inherently aragonitic mineralogy (Stanley and Hardie 1998, 1999).
Such depressed growth rates over this interval would have opened the reef-building
environments to the primarily calcitic rudists, which became the dominant reef builders
throughout the Cretaceous (Scott 1984; Kauffman and Johnson 1988). However, the
scleractinians did not resume their role as primary reef builders until early in the
Oligocene (Frost 1977, 1981), well after the decline of the rudists, when ambient molar
Mg/Ca ratios had risen above 3, well into the aragonite stability field. Significantly, the
highest growth rates for the scleractinians in this experiment occurred not in modern
seawater (molar Mg/Ca = 5.2), but rather in seawater with a molar Mg/Ca = 3.5. This is
consistent with the dramatic resurgence of the scleractinians during the early Oligocene,
when the Mg/Ca of seawater was between 3 and 3.5. We hypothesize that the occurrence
of maximum growth rates in seawater with molar Mg/Ca = 3.5 were caused by the benefit
of elevated Ca, relative to modern seawater, while still remaining well within the
aragonite stability field.
Artificial seawater treatments were formulated at molar Mg/Ca ratios of 1.0, 3.5,
and 5.2 with absolute Ca concentrations fixed at 14 mM to differentiate between the
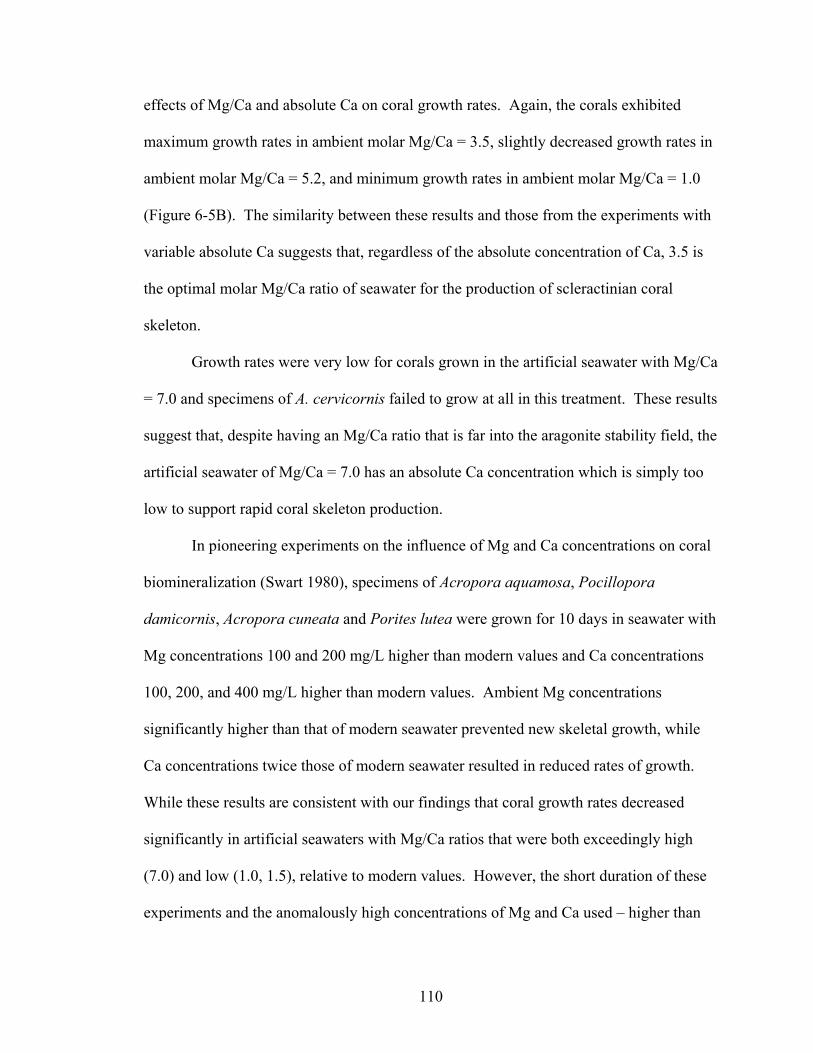
110
effects of Mg/Ca and absolute Ca on coral growth rates. Again, the corals exhibited
maximum growth rates in ambient molar Mg/Ca = 3.5, slightly decreased growth rates in
ambient molar Mg/Ca = 5.2, and minimum growth rates in ambient molar Mg/Ca = 1.0
(Figure 6-5B). The similarity between these results and those from the experiments with
variable absolute Ca suggests that, regardless of the absolute concentration of Ca, 3.5 is
the optimal molar Mg/Ca ratio of seawater for the production of scleractinian coral
skeleton.
Growth rates were very low for corals grown in the artificial seawater with Mg/Ca
= 7.0 and specimens of A. cervicornis failed to grow at all in this treatment. These results
suggest that, despite having an Mg/Ca ratio that is far into the aragonite stability field, the
artificial seawater of Mg/Ca = 7.0 has an absolute Ca concentration which is simply too
low to support rapid coral skeleton production.
In pioneering experiments on the influence of Mg and Ca concentrations on coral
biomineralization (Swart 1980), specimens of Acropora aquamosa, Pocillopora
damicornis, Acropora cuneata and Porites lutea were grown for 10 days in seawater with
Mg concentrations 100 and 200 mg/L higher than modern values and Ca concentrations
100, 200, and 400 mg/L higher than modern values. Ambient Mg concentrations
significantly higher than that of modern seawater prevented new skeletal growth, while
Ca concentrations twice those of modern seawater resulted in reduced rates of growth.
While these results are consistent with our findings that coral growth rates decreased
significantly in artificial seawaters with Mg/Ca ratios that were both exceedingly high
(7.0) and low (1.0, 1.5), relative to modern values. However, the short duration of these
experiments and the anomalously high concentrations of Mg and Ca used – higher than
111
have ever characterized Phanerozoic seawater – preclude interpretation of the results in
the context of actual past marine conditions.
Other experiments on specimens of Acropora sp., Stylophora pistillata, Acropora
cervicornis and Acropora formosa show that calcification rates increase as Ca
concentrations are elevated from approximately 20% to 80% of normal marine values
(Chalker 1976; Gattuso et al. 1998). At Ca concentration above 80%, calcification rates
level out and, in some cases, decline. However, these experiments do not adjust Mg
concomitantly with Ca, and therefore fail to control for the kinetic effects of ambient
Mg/Ca. When the observed variation in calcification rate is correlated with the implicit
variation in the Mg/Ca ratio of the artificial seawaters, the results conform to those
observed in our study. Furthermore, the short durations (2 – 2.5 h) of the experiments do
not allow sufficient time for the corals to fully equilibrate to the substantially altered
ambient conditions, thereby limiting the biological significance of the results.
Experiments have also shown that the CO3 concentration of seawater can limit the
rate of coral calcification (Langdon et al. 2000; Marubini et al. 2003). Therefore, it is
conceivable that the rapid ocean crust production and accompanying volcanism which
characterized the Cretaceous would have elevated CO2 in the atmosphere and oceans and
reduced the aragonite saturation state of seawater ([Ca] x [CO3]). One could therefore
deduce that it was the reduced aragonite saturation state of seawater during the
Cretaceous, and not the low oceanic Mg/Ca favoring the precipitation of calcite over
aragonite, which resulted in the scleractinian hiatus over this interval. However, as
discussed above, the rapid ocean crust production of the Cretaceous resulted in an
enrichment in oceanic Ca which would have mostly offset the accompanying decline in
112
CO3 (Hardie 1996; Berner 1997; Demicco et al. 2003), thereby maintaining seawater near
the 3 – 4 times aragonite supersaturated state which exists today.
The flexibility of coral skeletal mineralogy begs the question whether there is a
biomechanical advantage for a coral skeleton built from aragonite needles versus one
built from calcite rhombs. The obvious difference between the two skeletons concerns
crystal packing and can be likened to the advantages of trabecular (low density) and
cortical (high density) bone in vertebrates. Assuming that calcitic rhombs would be more
closely packed than aragonitic needles, the calcitic skeletons would presumably be denser
and, therefore, less successful at taking up space on the seafloor, which could be a
significant disadvantage in the highly competitive, substrate-limited tropical reef
environment. The increased density of the close-packed calcitic skeleton would likely
make the coral’s surface more resistant to abrasion from minor impact, such as that
delivered by grazing parrotfish, while its overall skeleton would probably be more
susceptible to major impacts, such as that associated with hurricane surf, which would
result in cross-skeletal fractures propagating along the calcite rhombs’ perfect cleavage
planes. Alternatively, coral skeletons built from aragonite would be more resistant to
major fracturing, as propagating fractures would be interrupted by the spherulitic
organization of the aragonitic sclerodermites, and less resistant to minor surficial
abrasion, due to lower skeletal density.
6.6 Conclusions
Our discovery that scleractinian corals change their skeletal mineral from mostly
aragonite in modern aragonite seawater to approximately one-third low-Mg calcite when
grown in artificial calcite seawater suggests that while corals are able to specify the
113
nucleation of the aragonite polymorph, their mineralogical control can be at least partially
overridden by ambient seawater chemistry. This suggests that the mineralogy of portions
of the scleractinian corals’ skeletons has varied with ambient Mg/Ca throughout geologic
time; it now seems conceivable that they would have produced at least part of their
skeleton from low-Mg calcite during the calcite seas of the mid-Late Cretaceous.
Furthermore, the slow growth rates exhibited by the corals grown in the artificial calcite
seawater support the hypothesis that the scleractinians’ disappearance as primary reef
builders during the Early Cretaceous through early Oligocene may have been caused, at
least in part, by the transition to calcite seawater over this interval; while their
reappearance in the early Oligocene and continued dominance as reef builders through to
the present may have been facilitated by the concomitant transition back to aragonite
seawater, which favors the scleractinians’ inherent mineralogy.

114
6.7 Figures and tables
Figure 6-1. Secular variation in Mg/Ca ratio of seawater and mineralogy of the major
reef building corals throughout the Phanerozoic. Curve is molar Mg/Ca calculated from
brine-magma-river water flux model (Hardie 1996). Black vertical bars are Mg/Ca
ranges calculated from fossil echinoderm Mg/Ca and paleotemperature (Dickson 2002,
2004; Ries 2004). Bars include error associated with Mg fractionation algorithms. Gray
vertical bars with T-tops are Mg/Ca ranges estimated from fluid inclusions in marine
halites (Lowenstein et al. 2001). Solid black circles are Mg/Ca values estimated from Br
in basal marine halite (Siemann 2003). Star represents modern seawater chemistry
(molar Mg/Ca = 5.2). The distribution and carbonate mineralogy of the major reef-
building corals are represented by horizontal bars (gray = aragonite, white = calcite)
(Stanley and Hardie 1998, 1999). Horizontal line is divide between calcite (molar Mg/Ca
<2) and aragonite–high-Mg calcite (molar Mg/Ca >2) nucleation fields in seawater at 25
°C. Temporal distributions of nonskeletal aragonite and calcite (Sandberg 1983) and KCl
and MgSO4 marine evaporites (Hardie 1996) are plotted along top of figure. A—marine
aragonite deposition; C—marine calcite deposition.
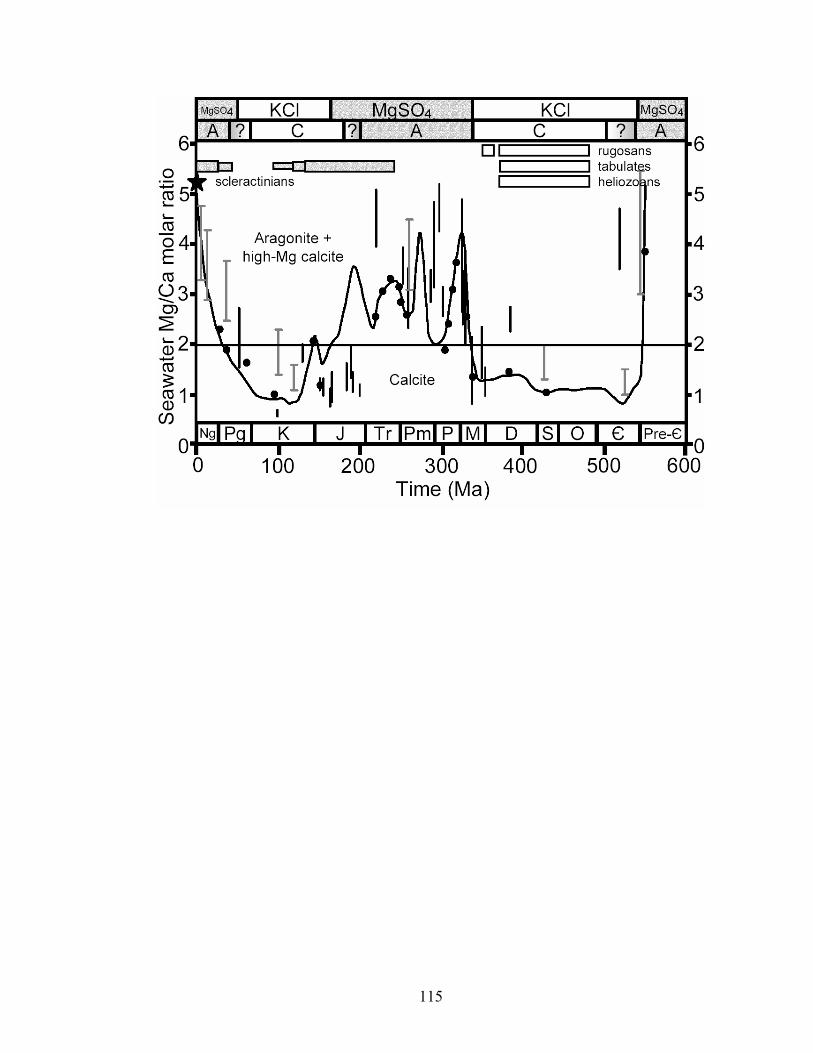
115
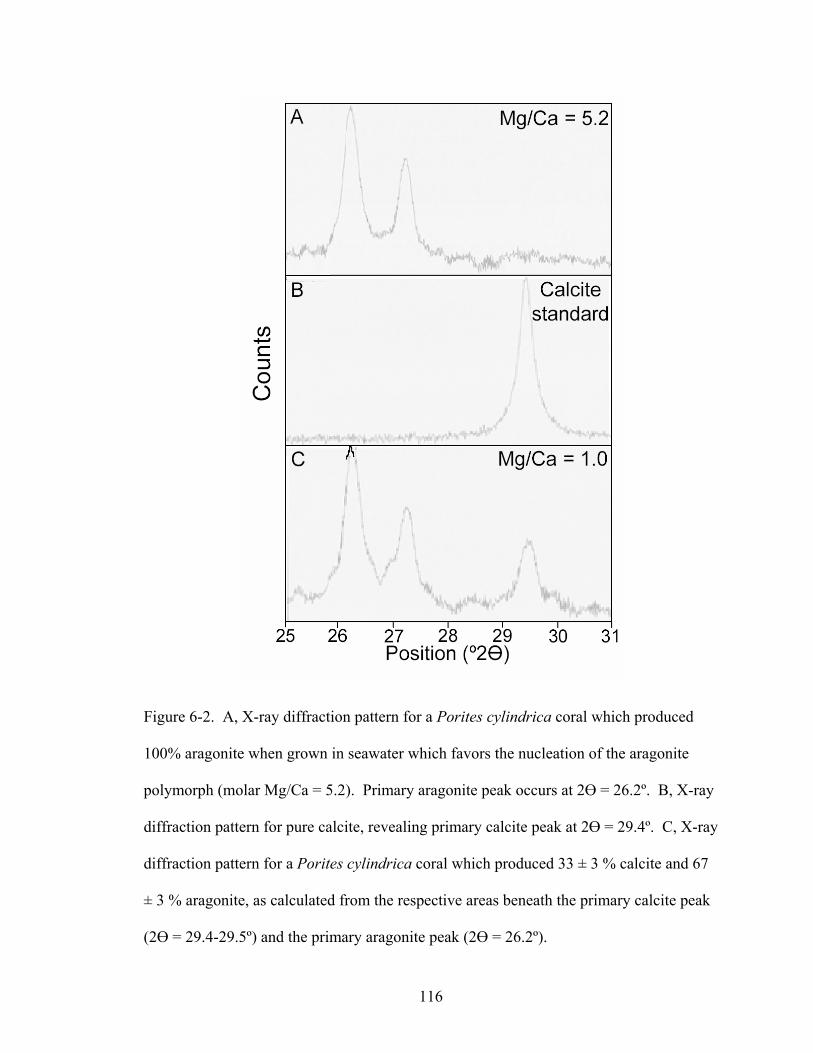
116
Figure 6-2. A, X-ray diffraction pattern for a Porites cylindrica coral which produced
100% aragonite when grown in seawater which favors the nucleation of the aragonite
polymorph (molar Mg/Ca = 5.2). Primary aragonite peak occurs at 2 = 26.2º. B, X-ray
diffraction pattern for pure calcite, revealing primary calcite peak at 2 = 29.4º. C, X-ray
diffraction pattern for a Porites cylindrica coral which produced 33 ± 3 % calcite and 67
± 3 % aragonite, as calculated from the respective areas beneath the primary calcite peak
(2 = 29.4-29.5º) and the primary aragonite peak (2 = 26.2º).
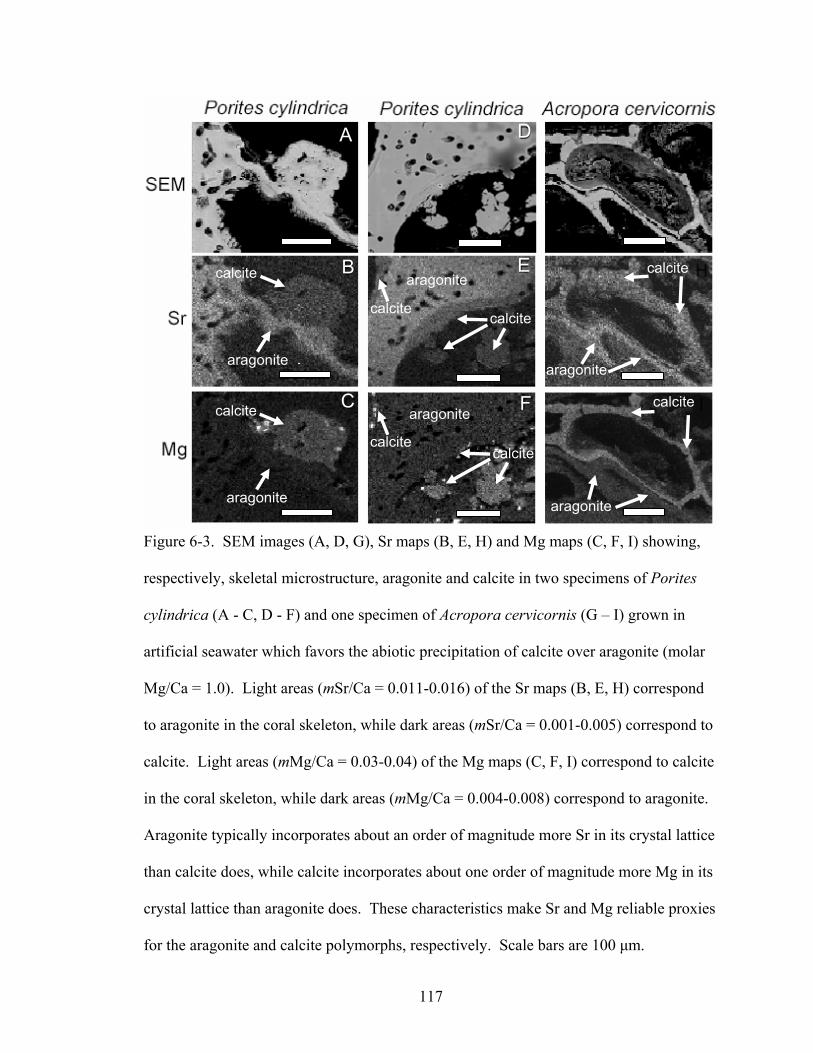
117
Figure 6-3. SEM images (A, D, G), Sr maps (B, E, H) and Mg maps (C, F, I) showing,
respectively, skeletal microstructure, aragonite and calcite in two specimens of Porites
cylindrica (A - C, D - F) and one specimen of Acropora cervicornis (G – I) grown in
artificial seawater which favors the abiotic precipitation of calcite over aragonite (molar
Mg/Ca = 1.0). Light areas (mSr/Ca = 0.011-0.016) of the Sr maps (B, E, H) correspond
to aragonite in the coral skeleton, while dark areas (mSr/Ca = 0.001-0.005) correspond to
calcite. Light areas (mMg/Ca = 0.03-0.04) of the Mg maps (C, F, I) correspond to calcite
in the coral skeleton, while dark areas (mMg/Ca = 0.004-0.008) correspond to aragonite.
Aragonite typically incorporates about an order of magnitude more Sr in its crystal lattice
than calcite does, while calcite incorporates about one order of magnitude more Mg in its
crystal lattice than aragonite does. These characteristics make Sr and Mg reliable proxies
for the aragonite and calcite polymorphs, respectively. Scale bars are 100 µm.
calcite
aragonite
calcite
aragonite
calcite
aragonitecalcite
aragonite
calcite
aragonitecalcite
aragonite
calcite
calcite
A
B
C
D
E
F
118
Figure 6-4. Mineralogy and geochemistry of Acropora cervicornis, Montipora digitata,
and Porites cylindrica grown in artificial seawater treatments. (A) Molar % calcite in
coral skeletons versus molar Mg/Ca ratio of artificial seawater. White bars = A.
cervicornis, gray bars = M. digitata, and black bars = P. cylindrica. (B) Molar Mg/Ca
ratio of calcitic (white squares = A. cervicornis, gray squares = M. digitata, and black
squares = P. cylindrica) and aragonitic (gray diamonds = M. digitata, black diamonds =
P. cylindrica) portions of coral skeleton. Solid black lines represent Mg-fractionation
curves for coral calcite (y = 0.02129x1.4628, R2 = 0.9458, n = 43) and coral aragonite (y =
0.002007x, R2 = 0.7537, n = 43), calculated using least squares regression. (C) Molar
Sr/Ca ratio of calcitic (gray squares = M. digitata, black squares = P. cylindrica; n = 16)
and aragonitic (gray diamonds = M. digitata, black diamonds = P. cylindrica; n = 35)
portions of coral skeleton. For seawater mMg/Ca < 2, mSr/Ca values are for calcitic
portions of coral skeleton; for seawater mMg/Ca > 2, mSr/Ca values are for aragonitic
portions of coral skeleton. Error bars correspond to instrument error plus specimen
variation. Molar Mg/Ca < 2 = calcite seas; molar Mg/Ca > 2 = aragonite + high-Mg
calcite seas.
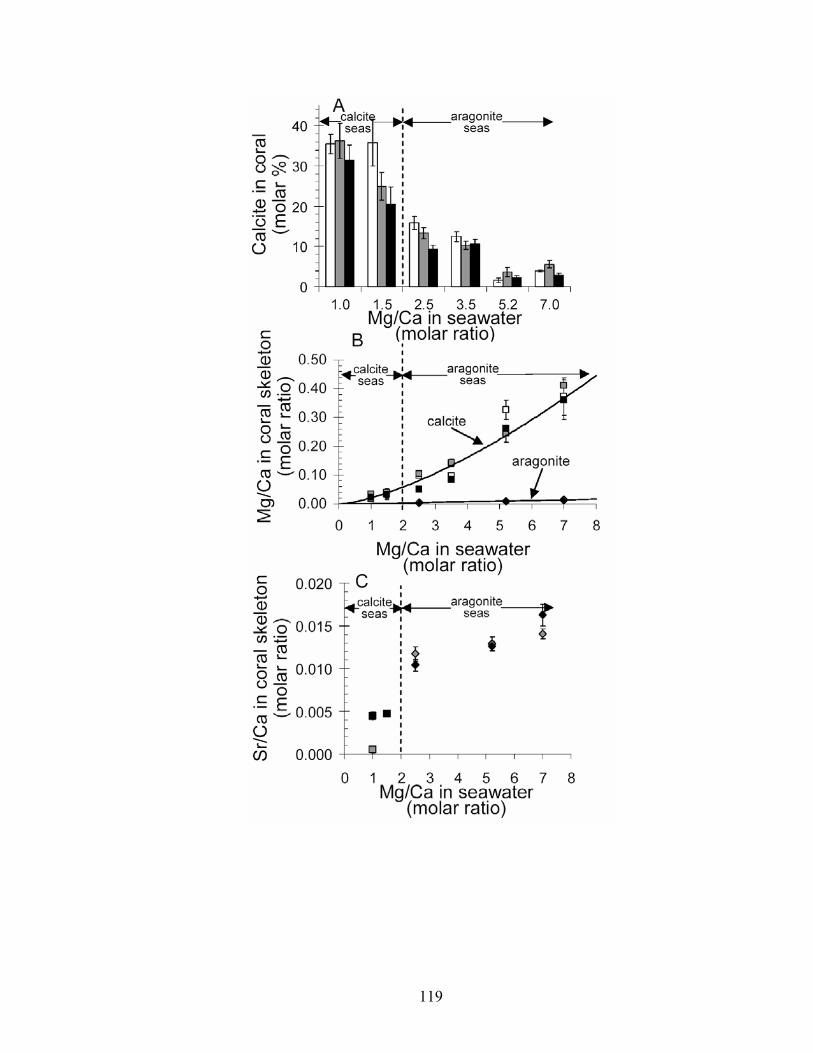
119
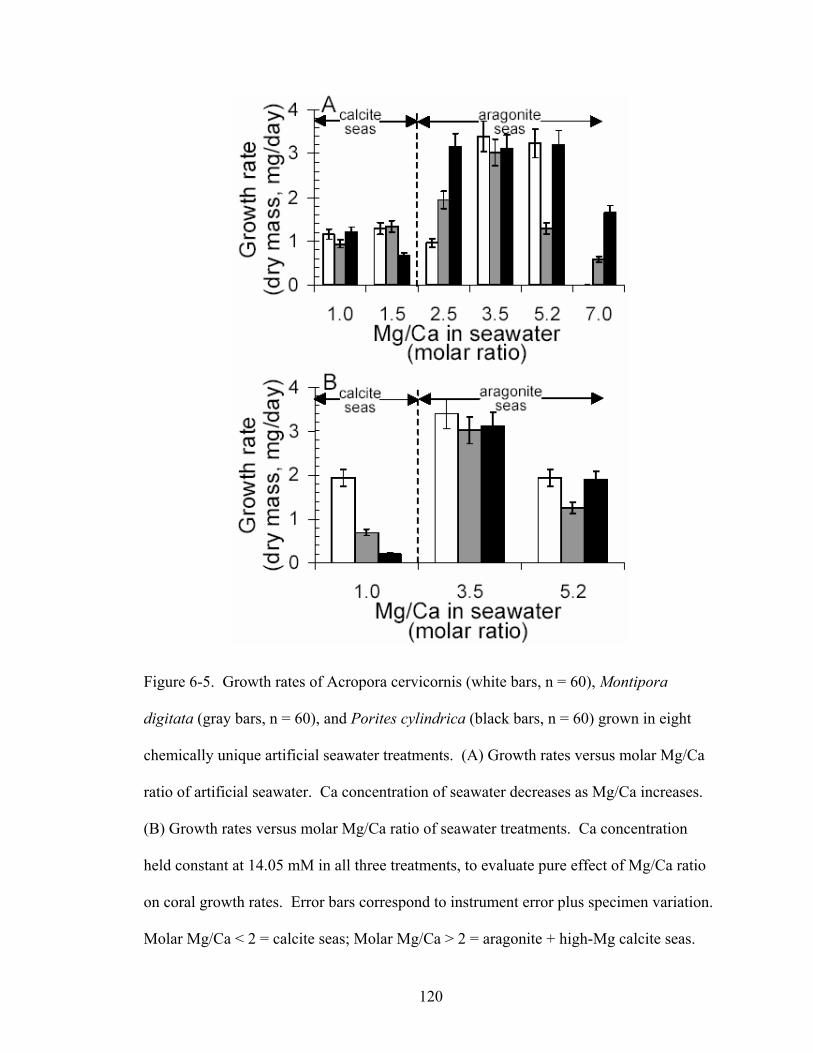
120
Figure 6-5. Growth rates of Acropora cervicornis (white bars, n = 60), Montipora
digitata (gray bars, n = 60), and Porites cylindrica (black bars, n = 60) grown in eight
chemically unique artificial seawater treatments. (A) Growth rates versus molar Mg/Ca
ratio of artificial seawater. Ca concentration of seawater decreases as Mg/Ca increases.
(B) Growth rates versus molar Mg/Ca ratio of seawater treatments. Ca concentration
held constant at 14.05 mM in all three treatments, to evaluate pure effect of Mg/Ca ratio
on coral growth rates. Error bars correspond to instrument error plus specimen variation.
Molar Mg/Ca < 2 = calcite seas; Molar Mg/Ca > 2 = aragonite + high-Mg calcite seas.
121
7 Effect of the Mg/Ca ratio of seawater on Mg-fractionation in crustose coralline
algae
7.1 Chapter summary
The Mg/Ca ratio of seawater has varied significantly throughout the Phanerozoic,
apparently as a function of the rate of ocean crust production. Specimens of the crustose
coralline alga Neogoniolithon sp., grown in artificial seawaters encompassing the range
of Mg/Ca ratios shown to have existed throughout the Phanerozoic, varied their skeletal
Mg/Ca ratio as a direct function of the seawater Mg/Ca ratio. Specimens grown in
seawater treatments formulated with identical Mg/Ca ratios but differing absolute
concentrations of Mg exhibited no change in skeletal Mg/Ca, thereby emphasizing the
importance of the ambient Mg/Ca ratio, instead of the absolute concentration of Mg, in
determining the Mg/Ca of coralline algal calcite. Specimens grown in seawater of the
lowest molar Mg/Ca (~1.0) changed their mineralogy to low-Mg calcite (mMg/Ca <
0.04), suggesting that ancient calcitic red algae, which exhibit morphologies and modes
of calcification comparable to Neogoniolithon sp., would have produced low-Mg from
the middle Cambrian to middle Mississippian and during the middle to Late Cretaceous,
when oceanic mMg/Ca approached unity. This condition would have greatly influenced
the geochemistry and diagenesis of carbonate facies, in which these algae have been
ubiquitous, throughout the Phanerozoic.
The precipitation of high-Mg calcite from artificial seawater which favors the
abiotic precipitation of aragonite suggests that these algae dictate the precipitation of the
calcitic polymorph of CaCO3. However, the algae’s virtually abiotic incorporation of Mg
into their skeletal calcite suggests that their biomineralogical influence is limited to
122
polymorph specification and is generally ineffective in the regulation of skeletal Mg
incorporation. The Mg/Ca of well-preserved crustose coralline algae fossils, when
corrected for the effect of seawater temperature, may be an archive of oceanic Mg/Ca
throughout the Phanerozoic. Mg fractionation algorithms which model skeletal Mg/Ca as
a function of ambient Mg/Ca and temperature are presented herein. These results support
the empirical evidence that the secular variation of oceanic Mg/Ca has caused the
mineralogy and skeletal chemistry of calcifying marine organisms to change significantly
over the Phanerozoic.
7.2 Introduction
Seawater chemistry is an important topic in the geosciences because it connects
the fields of plate tectonics, geochemistry, paleontology and sedimentology (Stanley and
Hardie 1998, 1999; Montañez 2002). In this manuscript, I explore the relationship
between the Mg/Ca ratio of seawater (the purported driver of the aragonite- and calcite
seas) and Mg incorporation in the crustose coralline algae, the primary reef cementers
throughout the Phanerozoic (Wray 1977). The results of this study have major
implications in the fields of biomineralization, carbonate geochemistry, and
paleoceanography.
Secular variation in the Mg/Ca ratio of seawater is believed to be responsible for
pandemic changes in the polymorph mineralogy of biotic and abiotic carbonates
throughout the Phanerozoic (Figure 7-1; Sandberg 1983; Wilkinson and Given 1986;
Railsback 1993; Stanley and Hardie 1998, 1999). Such chemical variation would have
subjected the ecologically and sedimentologically important reef-cementing crustose
coralline algae to ambient molar Mg/Ca ratios oscillating between 1.0 and 5.2 (the
123
modern value). Stanley and Hardie (1998; 1999) assert that modern coralline red algae
secrete a high-Mg calcite skeleton (molar Mg/Ca = 0.18) because of the elevated Mg/Ca
ratio of modern seas (Stanley and Hardie 1998, 1999). If their assertion is correct, the
Mg content of these geologically important algae should have varied concomitantly with
oceanic Mg/Ca throughout the Phanerozoic.
Laboratory experiments have shown that the Mg/Ca ratio of abiotic calcite
precipitated from artificial seawater is determined by the temperature and Mg/Ca ratio of
the precipitating solution (Berner 1975; Füchtbauer and Hardie 1976; Füchtbauer and
Hardie 1980; Mucci and Morse 1983; Morse et al. 1997). Experiments on organisms
have also shown that the amount of Mg incorporated in the calcitic skeletons of the
coralline algae Amphiroa sp. (Stanley et al. 2002), the sea urchin Eucidaris tribuloides,
the crab Perchon gibbesi, the shrimp Palaemonetes pugio, the calcareous serpulid worm
Hydroides crucigera (Ries 2004), the coccolithophores Ochrosphaera neopolitana and
Pleurochrysis carterae (Stanley et al. 2005), the blue mussel Mytilus edulis (Lorens and
Bender 1980), and the euryhaline ostracode Cyprideis australiensis (Deckker et al. 1999),
varies as a function of the Mg/Ca ratio of the seawater in which these organisms are
grown. The purpose of this study was to determine whether the geologically important
crustose coralline algae, which have been important reef cementers since the Early
Cretaceous, are equally mineralogically influenced by the Mg/Ca of ambient seawater.
This manuscript presents experiments in which specimens of the modern
crustose coralline alga Neogoniolithon sp. were grown in artificial seawaters formulated
at Mg/Ca ratios which encompass the range of Mg/Ca ratios believed to have existed
since the origin of the crustose coralline algae in the Early Cretaceous (Wray 1977).

124
The experiments reveal that, in fact, the algae’s skeletal Mg/Ca is greatly
influenced by the Mg/Ca ratio of their seawater. In artificial seawater of the lowest
Mg/Ca, such as that believed to have characterized the Mid-Late Cretaceous, the
encrusting algae actually changed their mineralogy from high to low-Mg calcite (molar
Mg/Ca < 0.04). This is significant because it suggests that the crustose coralline algae
inhabiting the calcite seas of the Cretaceous, as well as their possibly ancestral calcitic
algal precursors which inhabited the calcite seas of the mid-Paleozoic, would have
secreted low-Mg calcite -- a condition which would greatly influence the geochemistry
and diagenesis of the massive carbonate buildups cemented by these algae over these
intervals. While these algae clearly dictate the precipitation of the calcite polymorph
within their tissue (even in modern aragonitic seawater), they are unable to control the
amount of Mg incorporated into their calcite; and in this capacity, their biomineralization
mimics abiotic precipitation (Füchtbauer and Hardie 1976; 1980)
7.3 Background
7.3.1 Secular variation in the Mg/Ca of seawater
Since at least the beginning of the Phanerozoic, the abiotic calcium carbonate
precipitates in the Earth’s oceans have alternated between the low-Mg calcite and the
aragonite + high-Mg calcite polymorphs (Figure 7-1; Sandberg 1983). These so-called
calcite and aragonite seas have occurred in general synchronicity with intervals of KCl
and MgSO4 marine evaporites, respectively. Laboratory experiments have shown that
such synchronicity can be caused by the Mg/Ca ratio of the precipitating seawater
solution, such that molar Mg/Ca ratios below 2 yield low-Mg calcite precipitates and KCl
evaporites, while molar Mg/Ca ratios above two yield aragonite + high-Mg calcite
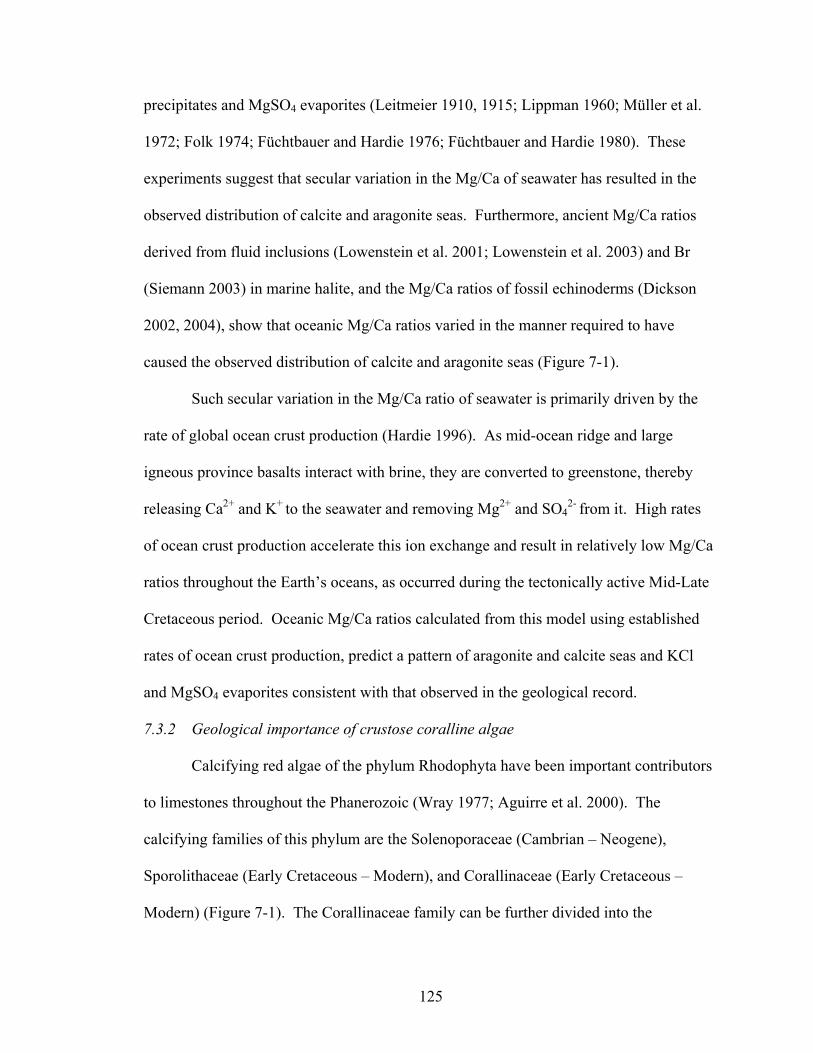
125
precipitates and MgSO4 evaporites (Leitmeier 1910, 1915; Lippman 1960; Müller et al.
1972; Folk 1974; Füchtbauer and Hardie 1976; Füchtbauer and Hardie 1980). These
experiments suggest that secular variation in the Mg/Ca of seawater has resulted in the
observed distribution of calcite and aragonite seas. Furthermore, ancient Mg/Ca ratios
derived from fluid inclusions (Lowenstein et al. 2001; Lowenstein et al. 2003) and Br
(Siemann 2003) in marine halite, and the Mg/Ca ratios of fossil echinoderms (Dickson
2002, 2004), show that oceanic Mg/Ca ratios varied in the manner required to have
caused the observed distribution of calcite and aragonite seas (Figure 7-1).
Such secular variation in the Mg/Ca ratio of seawater is primarily driven by the
rate of global ocean crust production (Hardie 1996). As mid-ocean ridge and large
igneous province basalts interact with brine, they are converted to greenstone, thereby
releasing Ca2+ and K+ to the seawater and removing Mg2+ and SO42- from it. High rates
of ocean crust production accelerate this ion exchange and result in relatively low Mg/Ca
ratios throughout the Earth’s oceans, as occurred during the tectonically active Mid-Late
Cretaceous period. Oceanic Mg/Ca ratios calculated from this model using established
rates of ocean crust production, predict a pattern of aragonite and calcite seas and KCl
and MgSO4 evaporites consistent with that observed in the geological record.
7.3.2 Geological importance of crustose coralline algae
Calcifying red algae of the phylum Rhodophyta have been important contributors
to limestones throughout the Phanerozoic (Wray 1977; Aguirre et al. 2000). The
calcifying families of this phylum are the Solenoporaceae (Cambrian – Neogene),
Sporolithaceae (Early Cretaceous – Modern), and Corallinaceae (Early Cretaceous –
Modern) (Figure 7-1). The Corallinaceae family can be further divided into the
126
geniculate (articulate) forms, which comprise the Amphiroideae, Corallinoideae, and
Metagoniolithoideae subfamilies, and the nongeniculate (nonarticulate or crustose) forms,
which comprise the Austrolithoideae, Melobesioideae, Choreonematoideae,
Lithophylloideae, and Mastophoroideae subfamilies (Aguirre et al. 2000). The latter
subfamily contains the Neogoniolithon (the subject of the present study) and the
Porolithon genera, which are important reef builders and sediment producers in modern
tropical and subtropical seas throughout the world (Wray 1977; Aguirre et al. 2000).
The Corallinaceae are globally distributed in modern seas, ranging from the
tropics to the poles and occurring from the intertidal to depths of up to 250 m (Adey and
Macintyre 1973). Neogoniolithon sp., however, is restricted to subtropical-tropical
waters of normal salinity and depths of less than 10 m. The encrusting Corallinaceae
vary from producing thin crusts of only a single cell in thickness to building massive
nodules up to 10 cm in diameter.
The heavily calcified tissue of the Corallinaceae lends them to extensive
representation in the geological record (Aguirre et al. 2000). These algae are some of the
most common and widespread skeletal constituents in Cretaceous and Cenozoic marine
carbonate facies (Wray 1977; Aguirre et al. 2000). Their contribution to reef limestones
since the Early Cretaceous, while probably not comparable (Macintyre 1997) to their
abundance on the surfaces of modern, wave-exposed reefs [where they have been
documented to cover up to 40% of the reef’s surface (Littler 1973; Macintyre 1997) and
produce up to 1.5 to 10.3 kg CaCO3 m-2 y-1 (Chisholm 2003)], is believed to have been
significant (Alexandersson 1977; James et al. 1988; Berner 1990; Aguirre et al. 2000).
127
The abundance of fossil Corallinaceae in post-Jurassic reef and sediment limestones
suggests significant geological implications for the results of this experimental study.
This study may also be applicable to the ancient Solenoporaceae and
Archaeolithophyllum algae, which, because of their similar morphologies, environmental
distributions and calcitic mineralogies relative to the modern crustose corallines, have
been invoked, somewhat dubiously (Aguirre et al. 2000), as potential ancestors of the
Corallinaceae (Wray 1977). The Solenoporaceae were major contributors to shelf, reefal
and bioherm carbonates throughout the Paleozoic and Mesozoic, albeit probably not to
the extent of modern Corallinaceae (Johnson 1961). The Archaeolithophyllum, an
encrusting algae of disputed affinity, is one of the dominant skeletal constituents of the
thick, widespread carbonate buildups of the Late Mississippian to Late Permian (Wray
1964). Regardless of the phylogenetic relationship between the modern crustose
coralline algae and the geologically important Solenoporaceae and Archaeolithophyllum,
their comparable morphology and modes of calcification suggests that the findings of this
study (concerning Mg incorporation in crustose coralline algae) can possibly be
extrapolated back for most of the calcitic encrusting algae – and the limestones they
helped form – throughout the Phanerozoic.
7.4 Methods
Specimens of Neogoniolithon sp. algae were grown in artificial seawaters which
were identical (Bidwell and Spotte 1985) except for their molar Mg/Ca ratios, which
were formulated at 1.0, 1.5, 2.5, 2.5, 5.2 and 7.0, thereby encompassing the range of
values shown to have existed since the algae’s origin (~1.0 – 5.2; Figure 7-1; Hardie
1996)). Mg and Ca concentrations remained within 5% of their initial values throughout
128
the experiment. To differentiate between the effects of Mg/Ca ratio and absolute Mg
concentration on skeletal Mg-fractionation, a second set of artificial seawaters were
formulated with Mg/Ca ratios of 1.0 and 5.2 and corresponding absolute concentrations
of Mg which were lower and higher, respectively, than those employed in the first set of
artificial seawaters with the same Mg/Ca ratios. The sums of the molar concentrations of
Mg and Ca were held constant in the first set of artificial seawaters, thereby fixing the
salinity and ionic strength at modern values of 35 ppt and 0.7, respectively. In the second
set of artificial seawaters, for which the sum of the molar Mg and Ca concentrations
could not be fixed, the salinity was maintained at 35 ppt by adjusting the concentration of
NaCl.
Five specimens of Neogoniolithon sp. were grown for 100 days in each of the
eight aquaria. Water was maintained at 25 ± 1º C with a single 50 watt heater and
continuously filtered with Millennium 2000 Wet-Dry Multi-filters (rate of filtration = 600
L/hour). 10 h/day of identical irradiation was provided by twin “Power Compact” lights
which emit wavelengths commensurate with the mid-day and dawn/twilight spectra. The
seawater was fertilized with 20.0 mg/L NaNO3, 1.3 mg/L NaH2PO4.H2O, and 0.025 mL/L
EDTA, all within the normal range for nearshore tropical marine waters (Spotte 1979).
The algae were acclimated to the artificial seawater treatments in stages, over a 30-day
period, to minimize any shock they may experience when exposed to the unfamiliar
Mg/Ca ratios.
Comparison of the algae after 100 days of growth with photographs taken of them
at the beginning of the experiment identified growth which occurred exclusively in the
experimental seawaters. Samples taken from the perimeter of these new growth sections
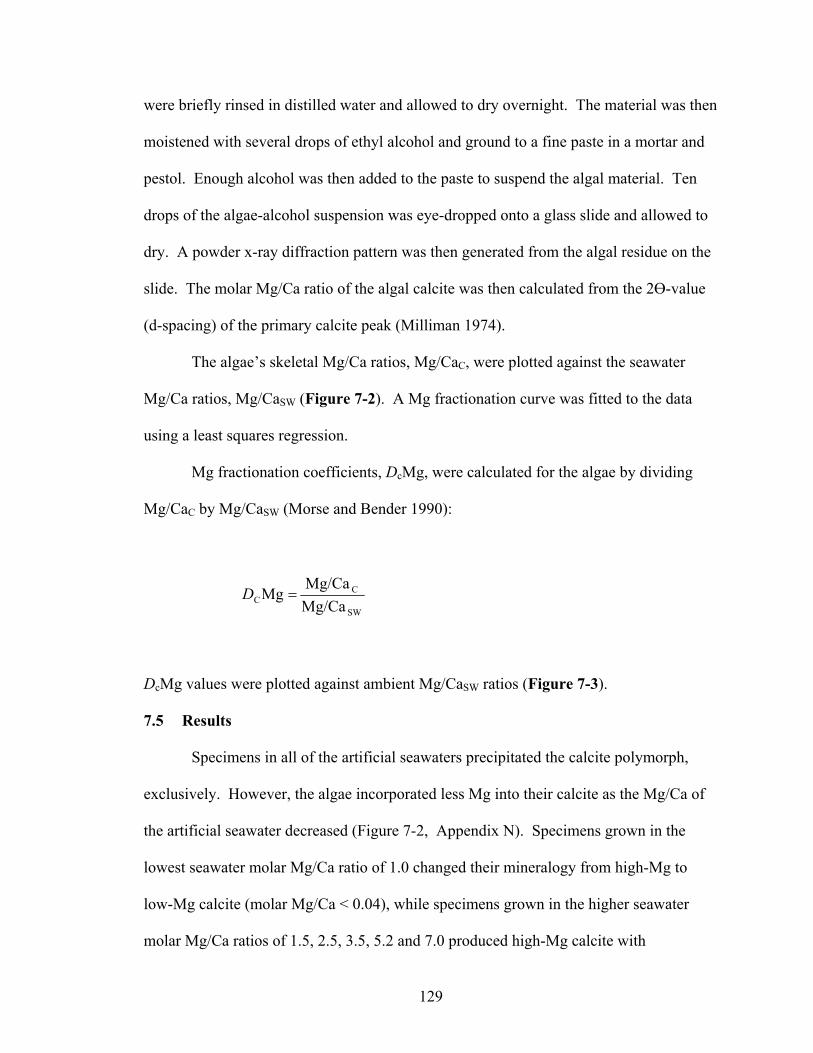
129
were briefly rinsed in distilled water and allowed to dry overnight. The material was then
moistened with several drops of ethyl alcohol and ground to a fine paste in a mortar and
pestol. Enough alcohol was then added to the paste to suspend the algal material. Ten
drops of the algae-alcohol suspension was eye-dropped onto a glass slide and allowed to
dry. A powder x-ray diffraction pattern was then generated from the algal residue on the
slide. The molar Mg/Ca ratio of the algal calcite was then calculated from the 2 -value
(d-spacing) of the primary calcite peak (Milliman 1974).
The algae’s skeletal Mg/Ca ratios, Mg/CaC, were plotted against the seawater
Mg/Ca ratios, Mg/CaSW (Figure 7-2). A Mg fractionation curve was fitted to the data
using a least squares regression.
Mg fractionation coefficients, DcMg, were calculated for the algae by dividing
Mg/CaC by Mg/CaSW (Morse and Bender 1990):
SW
CC Mg/Ca
Mg/CaMgD
DcMg values were plotted against ambient Mg/CaSW ratios (Figure 7-3).
7.5 Results
Specimens in all of the artificial seawaters precipitated the calcite polymorph,
exclusively. However, the algae incorporated less Mg into their calcite as the Mg/Ca of
the artificial seawater decreased (Figure 7-2, Appendix N). Specimens grown in the
lowest seawater molar Mg/Ca ratio of 1.0 changed their mineralogy from high-Mg to
low-Mg calcite (molar Mg/Ca < 0.04), while specimens grown in the higher seawater
molar Mg/Ca ratios of 1.5, 2.5, 3.5, 5.2 and 7.0 produced high-Mg calcite with
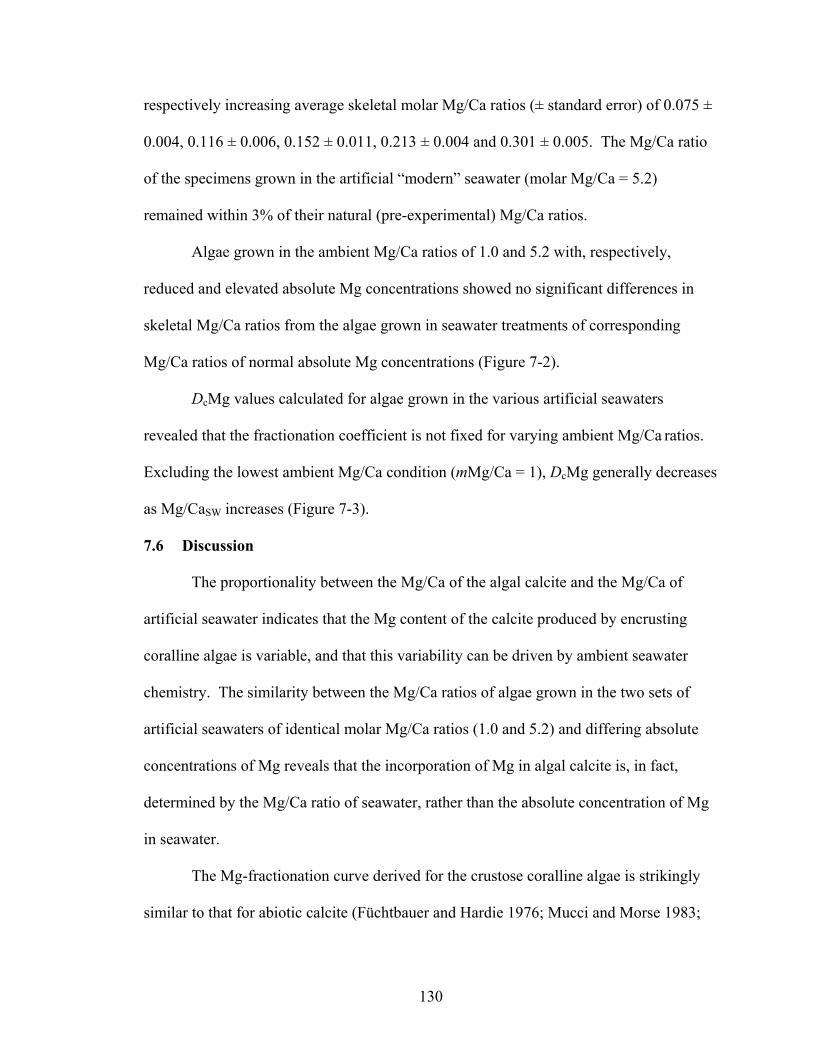
130
respectively increasing average skeletal molar Mg/Ca ratios (± standard error) of 0.075 ±
0.004, 0.116 ± 0.006, 0.152 ± 0.011, 0.213 ± 0.004 and 0.301 ± 0.005. The Mg/Ca ratio
of the specimens grown in the artificial “modern” seawater (molar Mg/Ca = 5.2)
remained within 3% of their natural (pre-experimental) Mg/Ca ratios.
Algae grown in the ambient Mg/Ca ratios of 1.0 and 5.2 with, respectively,
reduced and elevated absolute Mg concentrations showed no significant differences in
skeletal Mg/Ca ratios from the algae grown in seawater treatments of corresponding
Mg/Ca ratios of normal absolute Mg concentrations (Figure 7-2).
DcMg values calculated for algae grown in the various artificial seawaters
revealed that the fractionation coefficient is not fixed for varying ambient Mg/Ca ratios.
Excluding the lowest ambient Mg/Ca condition (mMg/Ca = 1), DcMg generally decreases
as Mg/CaSW increases (Figure 7-3).
7.6 Discussion
The proportionality between the Mg/Ca of the algal calcite and the Mg/Ca of
artificial seawater indicates that the Mg content of the calcite produced by encrusting
coralline algae is variable, and that this variability can be driven by ambient seawater
chemistry. The similarity between the Mg/Ca ratios of algae grown in the two sets of
artificial seawaters of identical molar Mg/Ca ratios (1.0 and 5.2) and differing absolute
concentrations of Mg reveals that the incorporation of Mg in algal calcite is, in fact,
determined by the Mg/Ca ratio of seawater, rather than the absolute concentration of Mg
in seawater.
The Mg-fractionation curve derived for the crustose coralline algae is strikingly
similar to that for abiotic calcite (Füchtbauer and Hardie 1976; Mucci and Morse 1983;

131
Figure 7-2), thereby suggesting that the algae are merely inducing the precipitation of
calcite by the removal of CO2. However, the algae’s precipitation of high-Mg calcite
from the artificial seawater formulated at a molar Mg/Ca ratio of 7.0, which naturally
favors the abiotic precipitation of the aragonitic polymorph (Füchtbauer and Hardie
1976), suggests that the algae are actively specifying the nucleation of the calcitic
polymorph. However, the algae’s abiotic pattern of Mg-incorporation suggests that its
mineralogical control is limited to polymorph specification and is unable to regulate Mg-
fractionation, which appears to be driven by ambient seawater chemistry and
temperature.
The Mg-fractionation curve for the non-encrusting coralline algae Amphiroa sp.
(Stanley et al. 2002) appears to be slightly lower than the Mg-fractionation curve
generated in this study for the encrusting coralline algae (Figure 7-4). This may be
attributed to the more sophisticated articulated morphology of the Amphiroa algae, which
may permit the exclusion of more Mg from the calcite crystal lattice.
The relationship between the Mg/Ca ratios of the algal calcite and the ambient
artificial seawater is also generally consistent with other experiments on Mg fractionation
in two species of coccolithophores and other more sophisticated calcareous animal
invertebrates (Lorens and Bender 1980; Deckker et al. 1999; Ries 2004). However, these
organisms appear to be less influenced by ambient Mg/Ca ratios than the encrusting
coralline algae. Again, this may be a reflection of their more sophisticated morphologies
and modes of calcification.
The inverse relationship observed between DcMg and Mg/CaSW (when the DcMg
value at Mg/CaSW = 1.0 is excluded) is also consistent with other studies on Mg
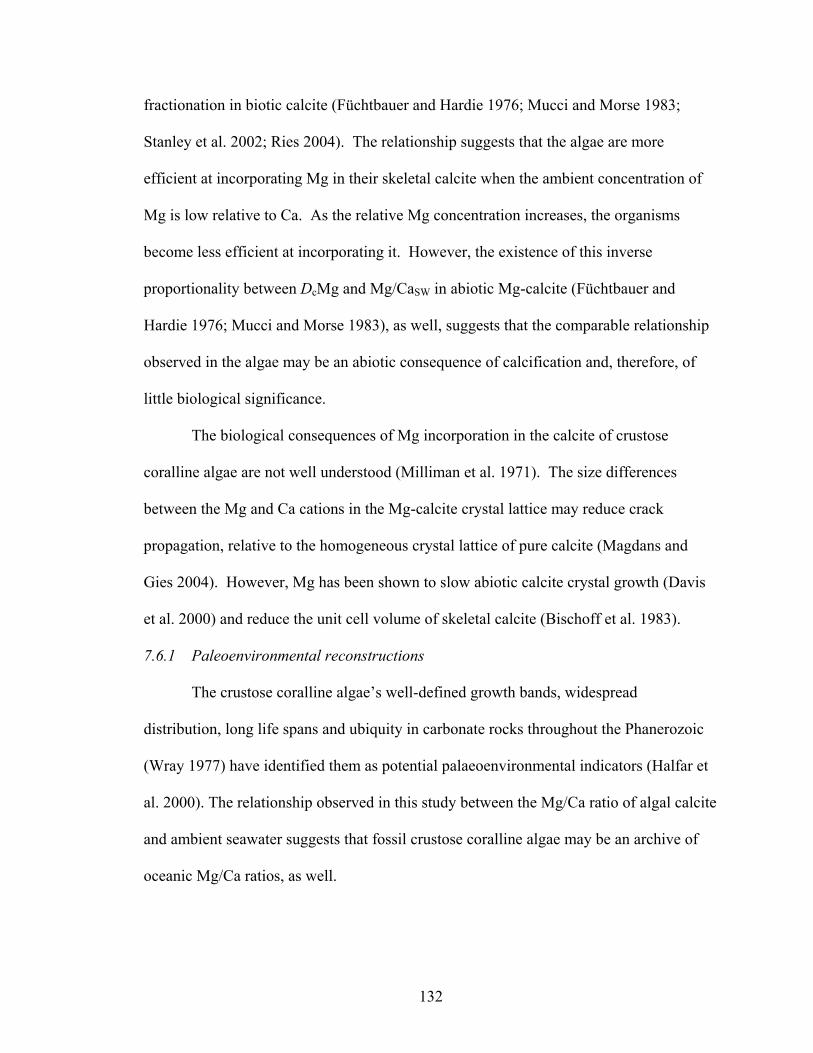
132
fractionation in biotic calcite (Füchtbauer and Hardie 1976; Mucci and Morse 1983;
Stanley et al. 2002; Ries 2004). The relationship suggests that the algae are more
efficient at incorporating Mg in their skeletal calcite when the ambient concentration of
Mg is low relative to Ca. As the relative Mg concentration increases, the organisms
become less efficient at incorporating it. However, the existence of this inverse
proportionality between DcMg and Mg/CaSW in abiotic Mg-calcite (Füchtbauer and
Hardie 1976; Mucci and Morse 1983), as well, suggests that the comparable relationship
observed in the algae may be an abiotic consequence of calcification and, therefore, of
little biological significance.
The biological consequences of Mg incorporation in the calcite of crustose
coralline algae are not well understood (Milliman et al. 1971). The size differences
between the Mg and Ca cations in the Mg-calcite crystal lattice may reduce crack
propagation, relative to the homogeneous crystal lattice of pure calcite (Magdans and
Gies 2004). However, Mg has been shown to slow abiotic calcite crystal growth (Davis
et al. 2000) and reduce the unit cell volume of skeletal calcite (Bischoff et al. 1983).
7.6.1 Paleoenvironmental reconstructions
The crustose coralline algae’s well-defined growth bands, widespread
distribution, long life spans and ubiquity in carbonate rocks throughout the Phanerozoic
(Wray 1977) have identified them as potential palaeoenvironmental indicators (Halfar et
al. 2000). The relationship observed in this study between the Mg/Ca ratio of algal calcite
and ambient seawater suggests that fossil crustose coralline algae may be an archive of
oceanic Mg/Ca ratios, as well.
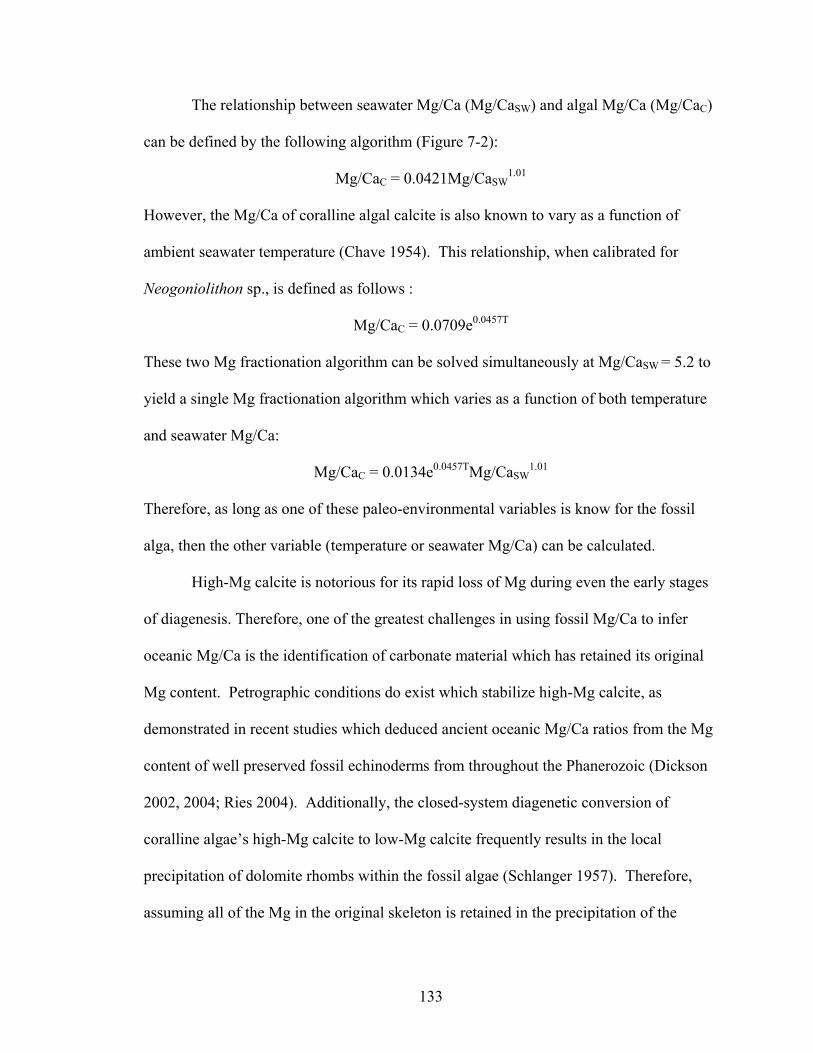
133
The relationship between seawater Mg/Ca (Mg/CaSW) and algal Mg/Ca (Mg/CaC)
can be defined by the following algorithm (Figure 7-2):
Mg/CaC = 0.0421Mg/CaSW1.01
However, the Mg/Ca of coralline algal calcite is also known to vary as a function of
ambient seawater temperature (Chave 1954). This relationship, when calibrated for
Neogoniolithon sp., is defined as follows :
Mg/CaC = 0.0709e0.0457T
These two Mg fractionation algorithm can be solved simultaneously at Mg/CaSW = 5.2 to
yield a single Mg fractionation algorithm which varies as a function of both temperature
and seawater Mg/Ca:
Mg/CaC = 0.0134e0.0457TMg/CaSW1.01
Therefore, as long as one of these paleo-environmental variables is know for the fossil
alga, then the other variable (temperature or seawater Mg/Ca) can be calculated.
High-Mg calcite is notorious for its rapid loss of Mg during even the early stages
of diagenesis. Therefore, one of the greatest challenges in using fossil Mg/Ca to infer
oceanic Mg/Ca is the identification of carbonate material which has retained its original
Mg content. Petrographic conditions do exist which stabilize high-Mg calcite, as
demonstrated in recent studies which deduced ancient oceanic Mg/Ca ratios from the Mg
content of well preserved fossil echinoderms from throughout the Phanerozoic (Dickson
2002, 2004; Ries 2004). Additionally, the closed-system diagenetic conversion of
coralline algae’s high-Mg calcite to low-Mg calcite frequently results in the local
precipitation of dolomite rhombs within the fossil algae (Schlanger 1957). Therefore,
assuming all of the Mg in the original skeleton is retained in the precipitation of the
134
dolomite, the volume of that dolomite relative to the volume of the original fossil should
provide an approximation of the original Mg content of the encrusting coralline algae.
It should be noted that the accuracy of ancient chemical and temperature
reconstructions from the Mg content of fossil encrusting coralline algae will be reduced
by factors such as open system diagenesis (in which Mg is lost), species-specific Mg
fractionation, variations in algal growth rates, and fluctuations of other cations in
seawater which influence Mg partitioning in the algal calcite.
The proportionality between the Mg/Ca of the algal calcite and the Mg/Ca of the
artificial seawaters (Figure 7-2) suggests that the Mg content of crustose coralline algae
has fluctuated along with secular variation in the Mg/Ca of seawater throughout the
Phanerozoic. Furthermore, the production of low-Mg calcite in artificial seawater with
molar Mg/Ca = 1 suggests that these algae, which produce exclusively high-Mg calcite in
modern seawater (molar Mg/Ca = 5.2), probably produced low-Mg calcite in middle and
Late Cretaceous seas, when molar Mg/Ca ratios are believed to have been near unity.
7.7 Conclusions
These experiments reveal that the Mg/Ca ratio of calcite produced by the encrusting
coralline alga Neogoniolithon sp. varies as a function of the Mg/Ca ratio of its ambient
seawater. Therefore, the skeletal Mg/Ca ratios of these important reef cementing algae
should have tracked secular changes in the Mg/Ca ratio of seawater throughout the
Phanerozoic. First-order reconstructions of oceanic Mg/Ca ratios or paleotemperatures
can be made from the Mg content of unaltered fossils of these encrusting coralline algae,
given that one of these variables is known for the seawater in which the fossilized algae
originally lived. The precipitation of high-Mg calcite in the artificial seawater which
135
favors the nucleation of the aragonite polymorph (molar Mg/Ca = 7.0) suggests that these
encrusting coralline algae specify the calcite polymorph of CaCO3. However, the
similarity between the algae’s Mg-fractionation curve and that for abiotic calcite suggests
that their biomineralogical control is limited to polymorph specification, and that Mg
incorporation in that calcite proceeds nearly abiotically, as if the algae are merely
inducing the precipitation of CaCO3 through the removal of CO2 via photosynthesis.
The encrusting coralline algae, which produce exclusively high-Mg calcite in
modern seas, probably produced low-Mg calcite during the middle to Late Cretaceous,
when molar Mg/Ca ratios are believed to have favored the abiotic nucleation of calcite.
This assertion may also be applicable to the possibly-ancestral calcitic algal precursors of
the Corallinaceae (the Solenoporaceae and Archaeolithophyllum), which inhabited the
calcite seas of the middle Cambrian through the middle Mississippian. These results
support the empirical fossil evidence that the secular variation of oceanic Mg/Ca has
caused the mineralogy and skeletal chemistry of calcifying organisms to change
significantly over the Phanerozoic (Stanley and Hardie 1998, 1999).
136
7.8 Figures and tables
Figure 7-1. Secular variation in the Mg/Ca ratio of seawater and distribution of the
calcifying Rhodophyta (Wray 1977; Aguirre et al. 2000) throughout the Phanerozoic.
Curve is molar Mg/Ca calculated from brine-magma-river water flux model (Hardie
1996). Black vertical bars are Mg/Ca ranges calculated from fossil echinoderm Mg/Ca
and paleotemperature (Dickson 2002, 2004; Ries 2004). Bars include error associated
with Mg fractionation algorithms. Gray vertical bars with T-tops are Mg/Ca ranges
estimated from fluid inclusions in marine halites (Lowenstein et al. 2001; Lowenstein et
al. 2003). Solid black circles are Mg/Ca values estimated from Br in basal marine halite
(Siemann 2003). Star represents modern seawater chemistry (molar Mg/Ca = 5.2). The
distribution of the calcifying Rhodophyta is represented by horizontal bars (Wray 1977;
Stanley and Hardie 1998, 1999). Horizontal line is divide between calcite (molar Mg/Ca
<2) and aragonite–high-Mg calcite (molar Mg/Ca >2) nucleation fields in seawater at 25
°C. Temporal distributions of nonskeletal aragonite and calcite (Sandberg 1983) and KCl
and MgSO4 marine evaporites (Hardie 1996) are plotted along top of figure. A—marine
aragonite deposition; C—marine calcite deposition.
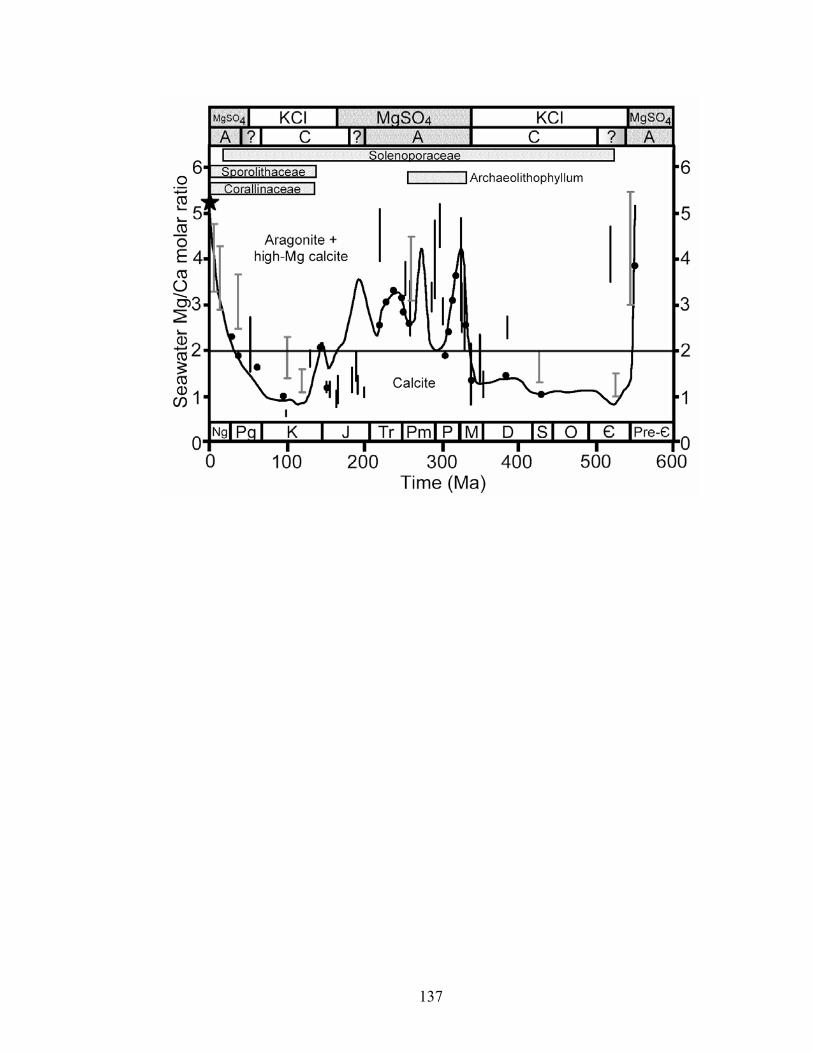
137
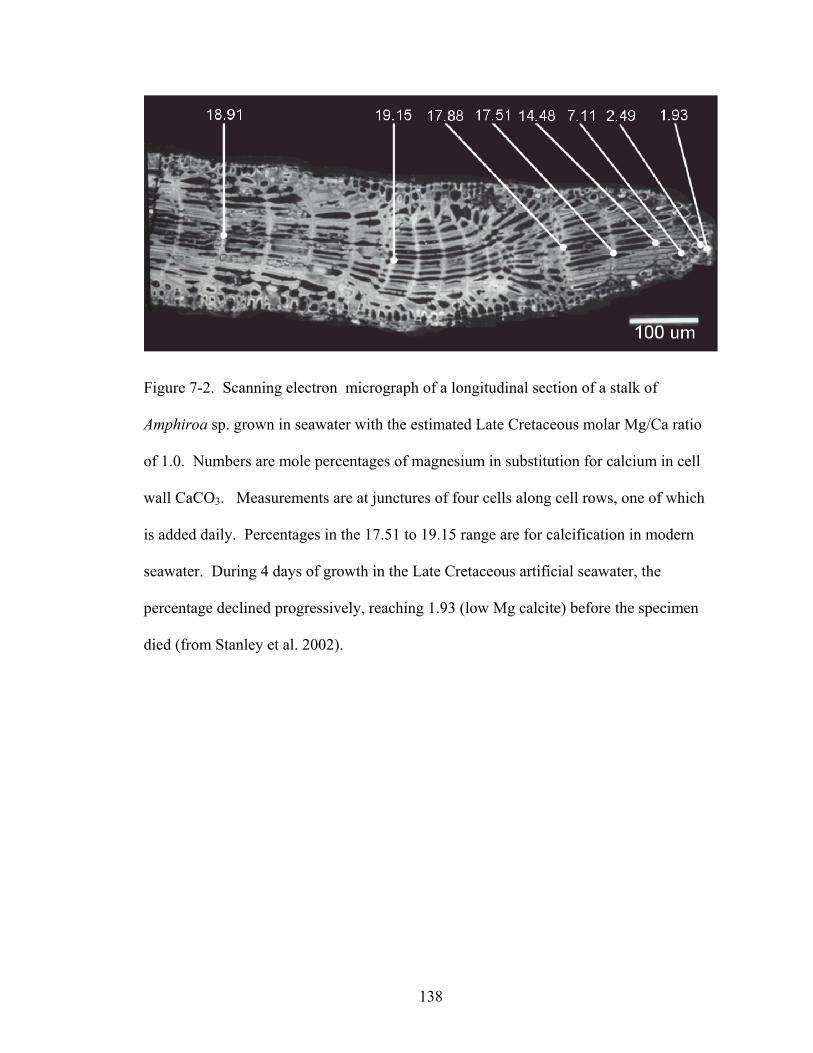
138
Figure 7-2. Scanning electron micrograph of a longitudinal section of a stalk of
Amphiroa sp. grown in seawater with the estimated Late Cretaceous molar Mg/Ca ratio
of 1.0. Numbers are mole percentages of magnesium in substitution for calcium in cell
wall CaCO3. Measurements are at junctures of four cells along cell rows, one of which
is added daily. Percentages in the 17.51 to 19.15 range are for calcification in modern
seawater. During 4 days of growth in the Late Cretaceous artificial seawater, the
percentage declined progressively, reaching 1.93 (low Mg calcite) before the specimen
died (from Stanley et al. 2002).
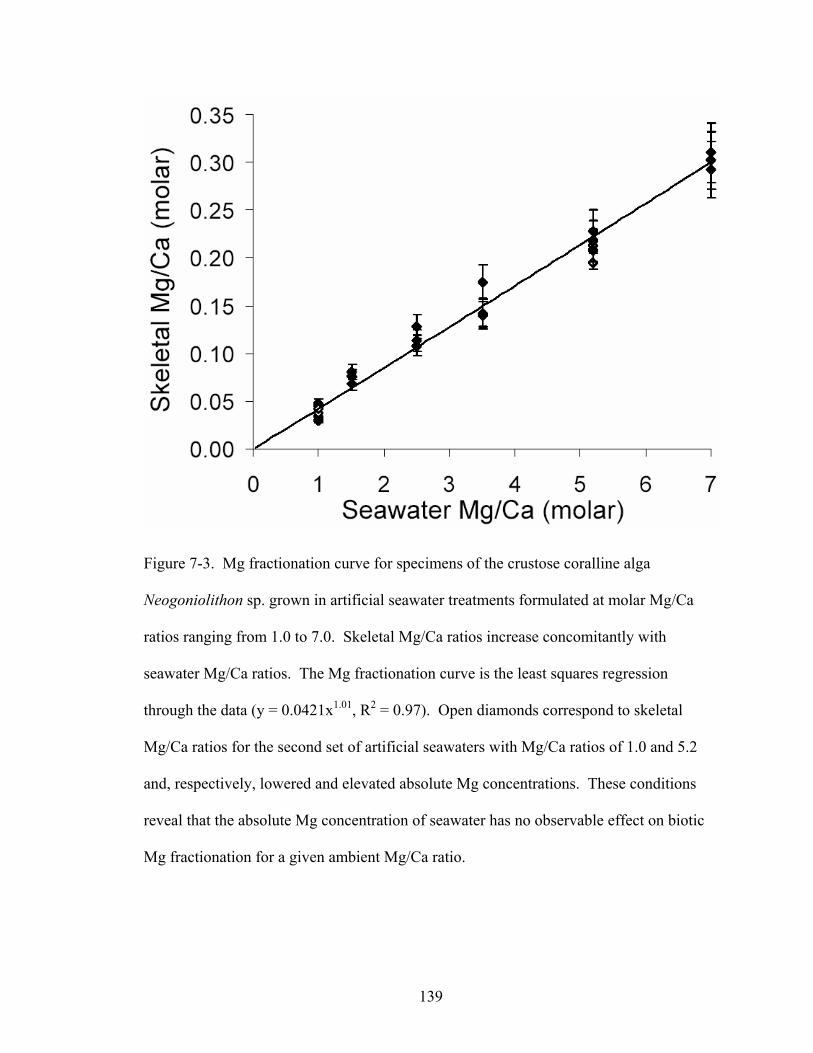
139
Figure 7-3. Mg fractionation curve for specimens of the crustose coralline alga
Neogoniolithon sp. grown in artificial seawater treatments formulated at molar Mg/Ca
ratios ranging from 1.0 to 7.0. Skeletal Mg/Ca ratios increase concomitantly with
seawater Mg/Ca ratios. The Mg fractionation curve is the least squares regression
through the data (y = 0.0421x1.01, R2 = 0.97). Open diamonds correspond to skeletal
Mg/Ca ratios for the second set of artificial seawaters with Mg/Ca ratios of 1.0 and 5.2
and, respectively, lowered and elevated absolute Mg concentrations. These conditions
reveal that the absolute Mg concentration of seawater has no observable effect on biotic
Mg fractionation for a given ambient Mg/Ca ratio.
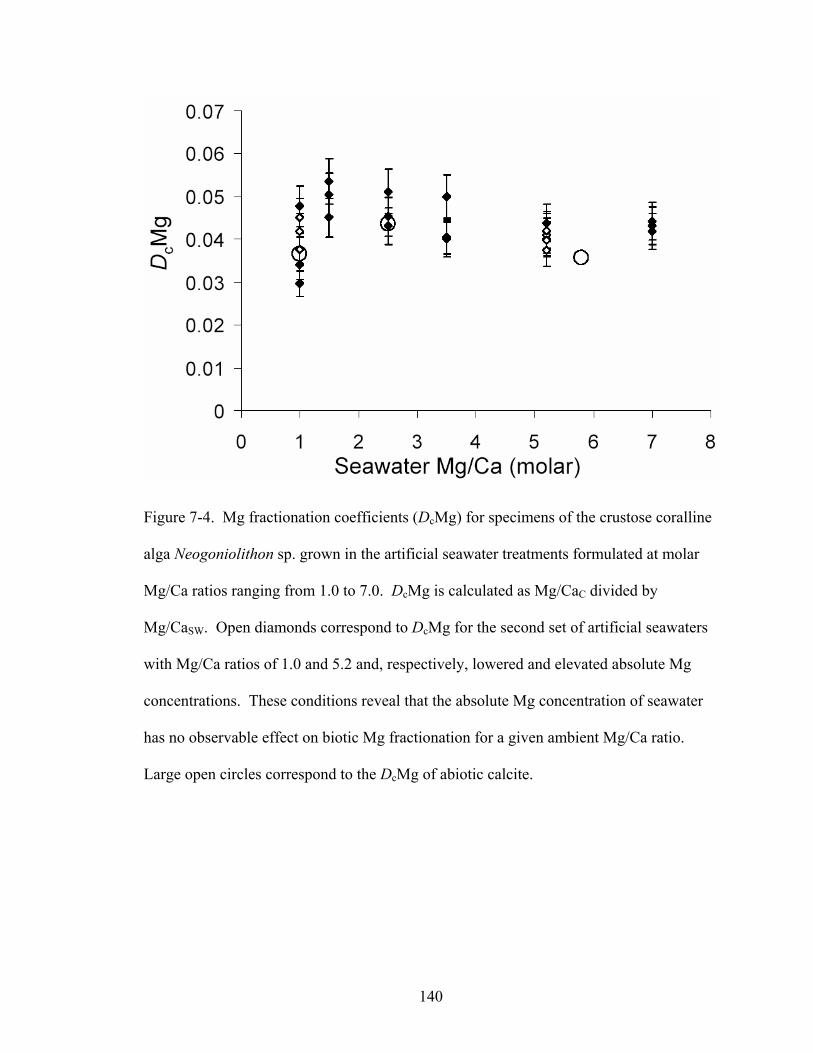
140
Figure 7-4. Mg fractionation coefficients (DcMg) for specimens of the crustose coralline
alga Neogoniolithon sp. grown in the artificial seawater treatments formulated at molar
Mg/Ca ratios ranging from 1.0 to 7.0. DcMg is calculated as Mg/CaC divided by
Mg/CaSW. Open diamonds correspond to DcMg for the second set of artificial seawaters
with Mg/Ca ratios of 1.0 and 5.2 and, respectively, lowered and elevated absolute Mg
concentrations. These conditions reveal that the absolute Mg concentration of seawater
has no observable effect on biotic Mg fractionation for a given ambient Mg/Ca ratio.
Large open circles correspond to the DcMg of abiotic calcite.
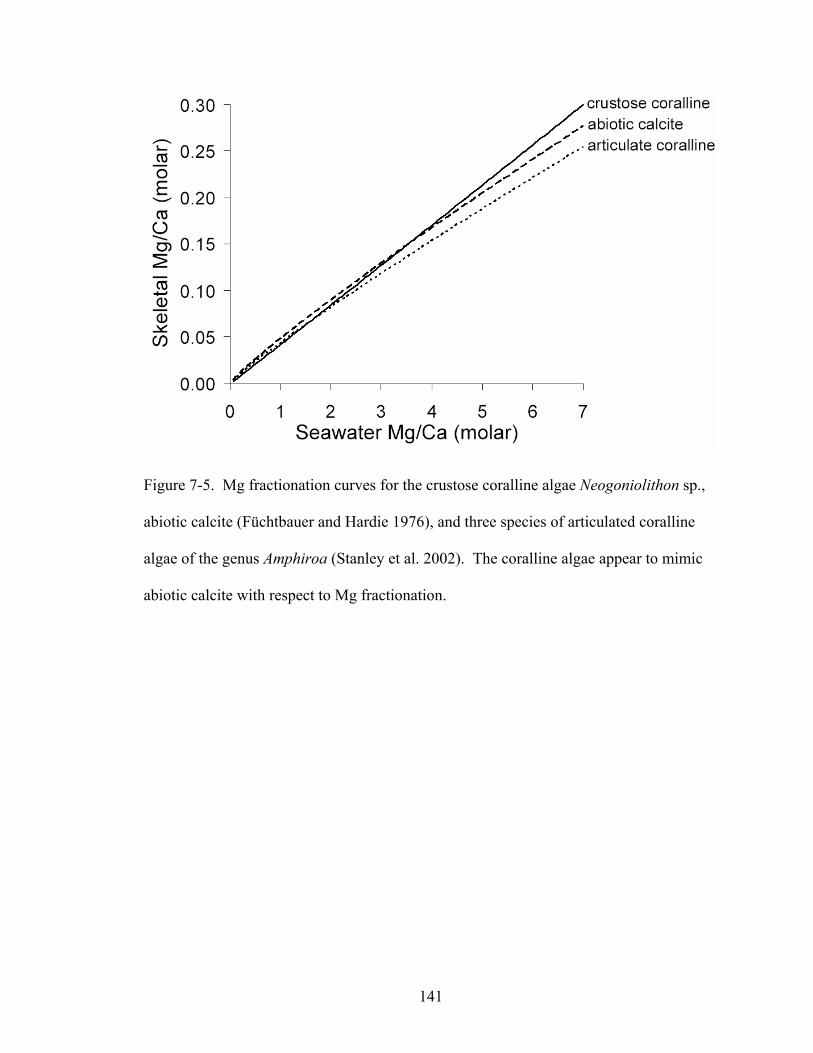
141
Figure 7-5. Mg fractionation curves for the crustose coralline algae Neogoniolithon sp.,
abiotic calcite (Füchtbauer and Hardie 1976), and three species of articulated coralline
algae of the genus Amphiroa (Stanley et al. 2002). The coralline algae appear to mimic
abiotic calcite with respect to Mg fractionation.
142
8 Effect of ambient Mg/Ca ratio on Mg fractionation in calcareous marine
invertebrates: A record of the oceanic Mg/Ca ratio over the Phanerozoic
8.1 Chapter summary
The Mg/Ca ratio of seawater has changed significantly over the Phanerozoic,
primarily as a function of the rate of ocean-crust production. Echinoids, crabs, shrimps,
and calcareous serpulid worms grown in artificial seawaters encompassing the range of
Mg/Ca ratios that existed throughout the Phanerozoic exhibit a direct nonlinear
relationship between skeletal and ambient Mg/Ca. Specimens grown in seawater with the
lowest Mg/Ca (~1) changed their mineralogy to low-Mg calcite (<4 mol% MgCO3),
suggesting that these high-Mg calcareous organisms would have produced low-Mg
calcite in the Cretaceous, when oceanic Mg/Ca was lowest (~1).
These results support the empirical evidence that the skeletal chemistry of
calcareous organisms has varied significantly over the Phanerozoic as a function of the
Mg/Ca of seawater and that the Mg/Ca of unaltered fossils of such organisms may be a
record of oceanic Mg/Ca throughout the Phanerozoic. Mg fractionation algorithms, which
relate skeletal Mg/Ca, seawater Mg/Ca, and temperature, were derived from these and
other experiments. They can be used to estimate paleoceanic Mg/Ca ratios and
temperatures from fossil skeletal Mg/Ca of the organisms evaluated. Paleoceanic Mg/Ca
ratios, recalculated by using the echinoderm Mg fractionation algorithm from published
fossil echinoid Mg/Ca, crinoid Mg/Ca, and paleotemperature data, are consistent with
other estimates and models of oceanic Mg/Ca over the Phanerozoic.
8.2 Introduction

143
Considerable time and effort has been devoted to the reconstruction of the
thermochemical history of seawater, owing to its inevitably far-reaching geological,
geochemical, and paleontological implications. Ancient seawater Mg/Ca ratios have been
reconstructed from the Mg/Ca of fossil echinoderms (Dickson 2002, 2004), and
paleoceanic temperatures have been reconstructed from the Mg/Ca of fossil foraminifera
(Lear et al. 2000). These applications have assumed (1) that skeletal Mg/Ca varies with
ambient Mg/Ca (Stanley and Hardie 1998, 1999; Stanley et al. 2002) and (2) that this
variation is linear and can therefore be defined with a single fractionation coefficient. In
the present study, I have conducted experiments on four modern high-Mg calcareous
invertebrates to evaluate these assumptions. Although my experiments confirm the first
assumption, they disprove the second by showing that skeletal Mg varies nonlinearly
with ambient Mg/Ca. Such reconstructions must therefore employ Mg fractionation
coefficients that vary with oceanic Mg/Ca, known to have oscillated over the Phanerozoic
(Figure 8-1; Ronov 1964; Folk 1974; Wilkinson 1979; Wilkinson and Algeo 1989;
Hardie 1996; Morse et al. 1997; Lowenstein et al. 2001; Siemann 2003).
The Mg/Ca of seawater is thought to vary primarily as a function of the mixing rate
of mid-ocean ridge hydrothermal brines and average river water, driven by the rate of
ocean-crust production (Hardie 1996). As mid-oceanic-ridge basalt comes in contact with
brine, it is converted to greenstone, thereby releasing Ca2+ and K+ to the seawater and
removing Mg2+ and SO42– from it. The rate of ocean-crust production controls the rate of
this ion exchange and, therefore, the relative concentrations of these ions in the oceans.
This relationship is evidenced in synchronized transitions between MgSO4 and KCl
evaporites and aragonite and calcite biotic or abiotic precipitates (Sandberg 1983; Hardie

144
1996; Stanley and Hardie 1998), fluid inclusions (Lowenstein et al. 2001; Lowenstein et
al. 2003) and Br (Siemann 2003) in marine halite, and the Mg/Ca ratios of fossil
echinoderms (Dickson 2002, 2004).
The observation that Mg/Ca has varied in the oceans over the Phanerozoic (Figure
8-1) coupled with experiments showing that the amount of Mg incorporated into
nonskeletal carbonates increases with the ambient Mg/Ca ratio of seawater (Kitano and
Kanamori 1966; Glover and Sippel 1967; Katz 1973; Berner 1975; Füchtbauer and
Hardie 1976; Devery and Ehlmann 1981; Mucci and Morse 1983; Morse et al. 1997)
suggests that ambient Mg/Ca would have influenced Mg incorporation in skeletal
carbonates over the Phanerozoic, as well. Laboratory experiments have shown that the
amount of Mg incorporated into the calcite of Amphiroa coralline algae increases with
the Mg/Ca ratio of the seawater (Stanley et al. 2002). The purpose of this study is to
determine whether calcite-secreting marine invertebrates mimic coralline algae and
abiotic calcite with respect to the fractionation of Mg and to evaluate the variability of the
coefficients that govern this fractionation, with respect to ambient Mg/Ca, taxonomy, and
anatomy.
Previous work has shown that the Mg/Ca ratio of the low-Mg calcite produced by
the blue mussel Mytilus edulis and the euryhaline ostracod crustacean Cyprideis
australiensis varies with the Mg/Ca ratio of the experimental seawater in which they are
raised (Lorens and Bender 1980; Deckker et al. 1999). However, these results were
achieved by employing artificial seawater with Mg/Ca ratios significantly greater than
those thought to have existed throughout the Phanerozoic (Hardie 1996).
8.3 Methods
145
Four types of marine invertebrates that secrete high-Mg calcite in modern seas—
echinoids (Eucidaris tribuloides), crabs (Perchon gibbesi), shrimps (Palaemonetes pugio)
and calcareous serpulid worms (Hydroides crucigera)—were grown in six artificial
seawaters (Bidwell and Spotte 1985) that were identical except for their Mg/Ca molar
ratios, which were formulated at values which encompass the range shown to have
existed throughout the Phanerozoic (~1.0–5.2; Figure 8-1; Hardie 1996): 1.0, 1.5, 2.9,
4.4, 5.4, and 6.7. The ionic strengths of the artificial seawaters were held constant at the
modern value of 0.7. The Mg/Ca ratios remained within 5% of their initial values
throughout the experiment.
Six individuals of each of the four species were maintained together at 25 ± 1 °C
and provided with 10 h/d of identical 15 W irradiance for 160 days in each of the six
artificial seawaters, ample time for all of the specimens to generate new skeletal material
that could be analyzed for Mg content. The specimens were grown in substrate-free
tanks and fed 10 g wet seaweed per week. The high survival rate for these organisms in
each of the seawater treatments suggests that variations in Mg and Ca do not have severe
metabolic effects on the organisms. Bellis et al. (1987) showed that reduced levels of
ambient Mg (from 50 to 0 mM) did not have significant effects on amino acid retention in
sea urchin larvae, whereas Hayashi and Motokawa (1986) demonstrated that elevated Mg
levels increased tissue viscosity in echinoderms. However, this increase was observed at
Mg concentrations 2–5 times greater than modern values, well above the range of
concentrations evaluated in these experiments.
After 160 days of growth in the artificial seawaters, spines and coronal plates were
harvested from the pencil urchins, claws from the sally lightfoot crabs, tails from the

146
grass shrimp, and tube sections from the serpulid worms. New skeletal material,
distinguished by its location on the outer perimeter of the skeleton, was embedded in
Epotek epoxy resin, sectioned parallel to the longitudinal axis and analyzed for Mg/Ca
molar ratio with the JEOL 8600 Superprobe electron microprobe (EDS, beam current =
0.02 A, accelerating potential = 15 kV, counting time = 15 s, beam diameter = 1–2 m).
Measurements were made near the periphery of the skeleton to ensure the analysis of new
skeletal material which had been deposited sufficiently far from the original skeleton so
as to minimize any topotactic effects.
The skeletal Mg/Ca ratios, Mg/CaC, were plotted against the seawater Mg/Ca
ratios, Mg/CaSW, for each of the organisms (Figure 8-2A, C, E). Mg fractionation curves
were fitted to the data by using least squares regression.
Mg fractionation coefficients, DcMg, were calculated for each of the animals in this
study by dividing Mg/CaC by Mg/CaSW (Morse and Bender 1990):
SW
CC Mg/Ca
Mg/CaMgD
DcMg values were plotted against ambient Mg/CaSW ratios (Figure 8-2B, D, F).
8.4 Results and Discussion
8.4.1 Mg Fractionation Curves
Significantly, all of the organisms incorporated less Mg into their skeletons as the
Mg/Ca of the artificial seawater decreased (Figure 8-2A, C, E, Appendix O, Appendix P,
Appendix Q, Appendix R). Organisms grown in the lowest Mg/CaSW (~1) changed their
mineralogy to low-Mg calcite (Mg/CaC < 0.04), while organisms grown in the artificial
147
“modern” Mg/CaSW (~5.2) continued to produce high-Mg calcite, remaining within 3%
of their pre-experimental Mg/CaC ratios.
Each type of animal produced a unique Mg fractionation curve. The spines and
coronal plates of the echinoids yielded different fractionation curves, as well (Figure
8-2A). Furthermore, each of the curves was lower than the experimentally determined
curve for abiotic magnesian calcite (Füchtbauer and Hardie 1976). This deviation of the
biotic fractionation curves from the abiotic curve suggests that these organisms influence,
to varying degrees, the incorporation of Mg in their calcite skeletons. However, ranking
the organisms by increasing Mg content—echinoid spine, shrimp, crab–echinoid plate–
worm—suggests that the degree of Mg fractionation is not, as previously suggested,
linked to taxonomic complexity (Chave 1954). While the biological consequences of
skeletal Mg incorporation are unknown, Mg has been shown to retard abiotic calcite-
crystal growth (Davis et al. 2000) and decrease the unit-cell volume of skeletal calcite
(Bischoff et al. 1983).
8.4.2 Mg Fractionation Coefficients (DcMg)
Significantly, the calculation of DcMg at various Mg/CaSW ratios revealed that the
coefficient varied with the ambient Mg/CaSW (Figure 8-2B, D, F, Appendix O, Appendix
P, Appendix Q, Appendix R). DcMg decreased for the echinoid spines–coronal plates and
crabs as Mg/CaSW increased (Figure 8-2B, D). This result is consistent with the
experiments on the coralline algae (Stanley et al. 2002) and abiotic magnesian calcite
(Füchtbauer and Hardie 1976; Mucci and Morse 1983). However, DcMg values increased
for the grass shrimps as Mg/CaSW increased (Figure 8-2D) and were scattered for the
serpulid worm tubes (Figure 8-2F). The discrepancies among the organisms may be
148
attributable to differences among the organic templates thought to control crystal growth
and/or differences in the mechanisms which transport Mg2+ and Ca2+ ions into or out of
the skeleton-precipitating solutions.
8.4.3 Ocean-Chemistry Reconstructions
The proportionality between the Mg/Ca of these animals’ skeletons and the
Mg/Ca of the seawater in which they grew suggests that such animals should have
recorded oceanic Mg/Ca throughout the Phanerozoic. Dickson (2002; 2004) innovatively
employed a fixed DcMg, derived from echinoderms in modern seawater at 25 °C, to
reconstruct paleoceanic Mg/Ca from the Mg/Ca of fossil crinoid ossicles and echinoid
plates. The present study shows that this reconstruction can be improved by employing a
Mg fractionation curve, instead of a single DcMg, to convert skeletal Mg/Ca to seawater
Mg/Ca. The effect of ancient seawater temperature on fossil Mg/Ca can also be corrected
for in the reconstruction by using Chave’s (1954) observations on the relationship
between skeletal Mg fractionation and temperature.
Mg fractionation curves for echinoid plates, echinoid spines, crabs, serpulid worm
tubes, coralline algae (Stanley et al. 2002), and nonskeletal calcite (Füchtbauer and
Hardie 1976) were species-normalized with a factor equal to Chave’s (1954) average
skeletal Mg/Ca of the given higher taxon at Mg/CaSW = 5.2, T = 25 °C divided by the
skeletal Mg/Ca of the species in that taxon evaluated in this study at Mg/CaSW = 5.2, T =
25 °C (Table 8-1). The species-normalization factors for the echinoid plates, echinoid
spines, crabs, serpulid worm tubes, and coralline algae are 0.913, 1.708, 0.868, 1.140, and
1.3297, respectively.
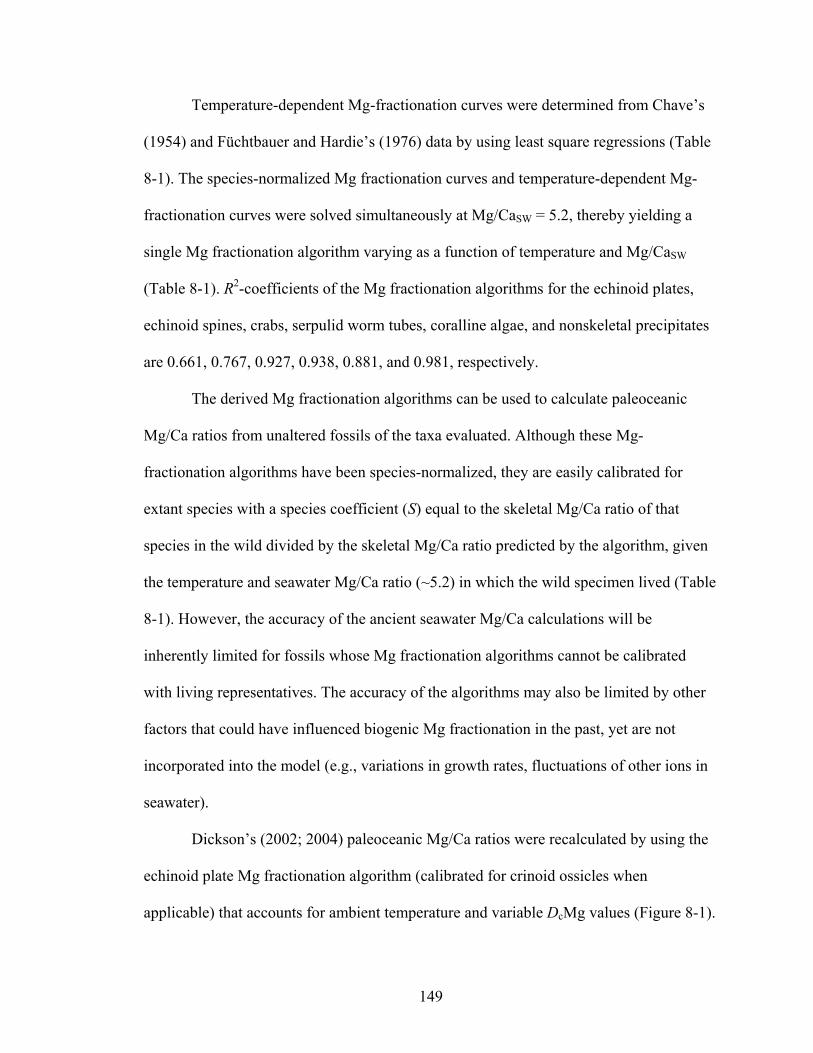
149
Temperature-dependent Mg-fractionation curves were determined from Chave’s
(1954) and Füchtbauer and Hardie’s (1976) data by using least square regressions (Table
8-1). The species-normalized Mg fractionation curves and temperature-dependent Mg-
fractionation curves were solved simultaneously at Mg/CaSW = 5.2, thereby yielding a
single Mg fractionation algorithm varying as a function of temperature and Mg/CaSW
(Table 8-1). R2-coefficients of the Mg fractionation algorithms for the echinoid plates,
echinoid spines, crabs, serpulid worm tubes, coralline algae, and nonskeletal precipitates
are 0.661, 0.767, 0.927, 0.938, 0.881, and 0.981, respectively.
The derived Mg fractionation algorithms can be used to calculate paleoceanic
Mg/Ca ratios from unaltered fossils of the taxa evaluated. Although these Mg-
fractionation algorithms have been species-normalized, they are easily calibrated for
extant species with a species coefficient (S) equal to the skeletal Mg/Ca ratio of that
species in the wild divided by the skeletal Mg/Ca ratio predicted by the algorithm, given
the temperature and seawater Mg/Ca ratio (~5.2) in which the wild specimen lived (Table
8-1). However, the accuracy of the ancient seawater Mg/Ca calculations will be
inherently limited for fossils whose Mg fractionation algorithms cannot be calibrated
with living representatives. The accuracy of the algorithms may also be limited by other
factors that could have influenced biogenic Mg fractionation in the past, yet are not
incorporated into the model (e.g., variations in growth rates, fluctuations of other ions in
seawater).
Dickson’s (2002; 2004) paleoceanic Mg/Ca ratios were recalculated by using the
echinoid plate Mg fractionation algorithm (calibrated for crinoid ossicles when
applicable) that accounts for ambient temperature and variable DcMg values (Figure 8-1).

150
Paleotemperatures were estimated by Dickson (see Dickson’s supplementary data (2002))
from paleogeographic and paleotemperature maps (Golonka et al. 1994). The resulting
Mg/Ca ratios are consistent with other estimates and models of paleoceanic Mg/Ca over
the Phanerozoic (Hardie 1996; Lowenstein et al. 2001; Siemann 2003).
8.4.4 Ocean-Temperature Reconstructions
The correlation between temperature and skeletal Mg incorporation (Chave 1954)
also permits the reconstruction of ancient seawater temperatures from skeletal Mg/Ca
ratios. However, such reconstructions must correct skeletal Mg/Ca for the effect of
varying ambient Mg/CaSW. A recent temperature reconstruction from the Mg/CaC of
fossil foraminifera (Lear et al. 2000) has, like the echinoderm reconstruction (Dickson
2002, 2004), employed a fixed DcMg to make this correction. This paleotemperature
reconstruction can be improved by using an empirically derived Mg fractionation
algorithm, which accounts for DcMg varying with Mg/CaSW.
8.4.5 Paleontological Implications
The production of low-Mg calcite by all four organisms in the artificial seawater
with Mg/Ca = ~1 suggests that these organisms, which produce high-Mg calcite in
modern seas, probably produced low-Mg calcite in middle and Late Cretaceous seas,
when Mg/Ca ratios are thought to have been near unity. The wide variety of organisms
that exhibit this proportionality between skeletal and ambient Mg/Ca suggests that this is
a general trend for modern high-Mg calcareous organisms.
8.5 Conclusions
These experiments show that the Mg/Ca ratios in the skeletons of four modern
high-Mg calcareous organisms—echinoids, shrimp, crabs, and serpulid worms—vary
151
proportionally with the Mg/Ca ratio of the seawater in which they are grown. Therefore,
the Mg/Ca of unaltered fossils of such organisms should have tracked changes in oceanic
Mg/Ca throughout the Phanerozoic. Reconstructions of paleoceanic Mg/Ca and
temperature from echinoderms and foraminifera, respectively, have already assumed that
this relationship exists for these organisms. However, these reconstructions employ a
fixed Mg fractionation coefficient (DcMg) over a range of ambient Mg/Ca ratios. The
results of the present study show that DcMg varies with the Mg/Ca of the ambient
seawater. Such reconstructions are improved by employing Mg fractionation algorithms
that define how DcMg varies as a function of ambient Mg/Ca and temperature. The
variation of Mg fractionation curves among closely related organisms, such as crabs and
shrimps, and among different skeletal components within the same organism, such as
echinoid spines and coronal plates, underscores the importance of employing only Mg
fractionation algorithms known to characterize the specific anatomy of the given
organism. Furthermore, the organisms evaluated in this study, which all produce high-Mg
calcite in modern seas, probably produced low-Mg calcite in middle and Late Cretaceous
seas, when Mg/Ca values are thought to have been near their lowest.
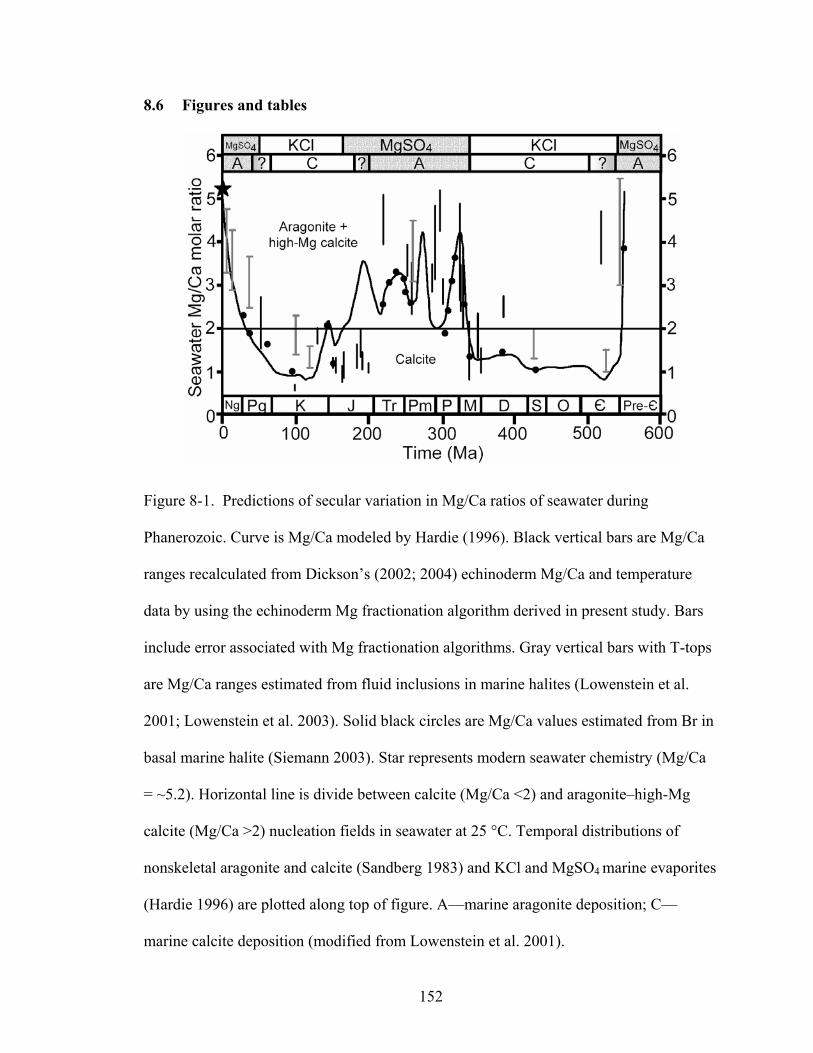
152
8.6 Figures and tables
Figure 8-1. Predictions of secular variation in Mg/Ca ratios of seawater during
Phanerozoic. Curve is Mg/Ca modeled by Hardie (1996). Black vertical bars are Mg/Ca
ranges recalculated from Dickson’s (2002; 2004) echinoderm Mg/Ca and temperature
data by using the echinoderm Mg fractionation algorithm derived in present study. Bars
include error associated with Mg fractionation algorithms. Gray vertical bars with T-tops
are Mg/Ca ranges estimated from fluid inclusions in marine halites (Lowenstein et al.
2001; Lowenstein et al. 2003). Solid black circles are Mg/Ca values estimated from Br in
basal marine halite (Siemann 2003). Star represents modern seawater chemistry (Mg/Ca
= ~5.2). Horizontal line is divide between calcite (Mg/Ca <2) and aragonite–high-Mg
calcite (Mg/Ca >2) nucleation fields in seawater at 25 °C. Temporal distributions of
nonskeletal aragonite and calcite (Sandberg 1983) and KCl and MgSO4 marine evaporites
(Hardie 1996) are plotted along top of figure. A—marine aragonite deposition; C—
marine calcite deposition (modified from Lowenstein et al. 2001).
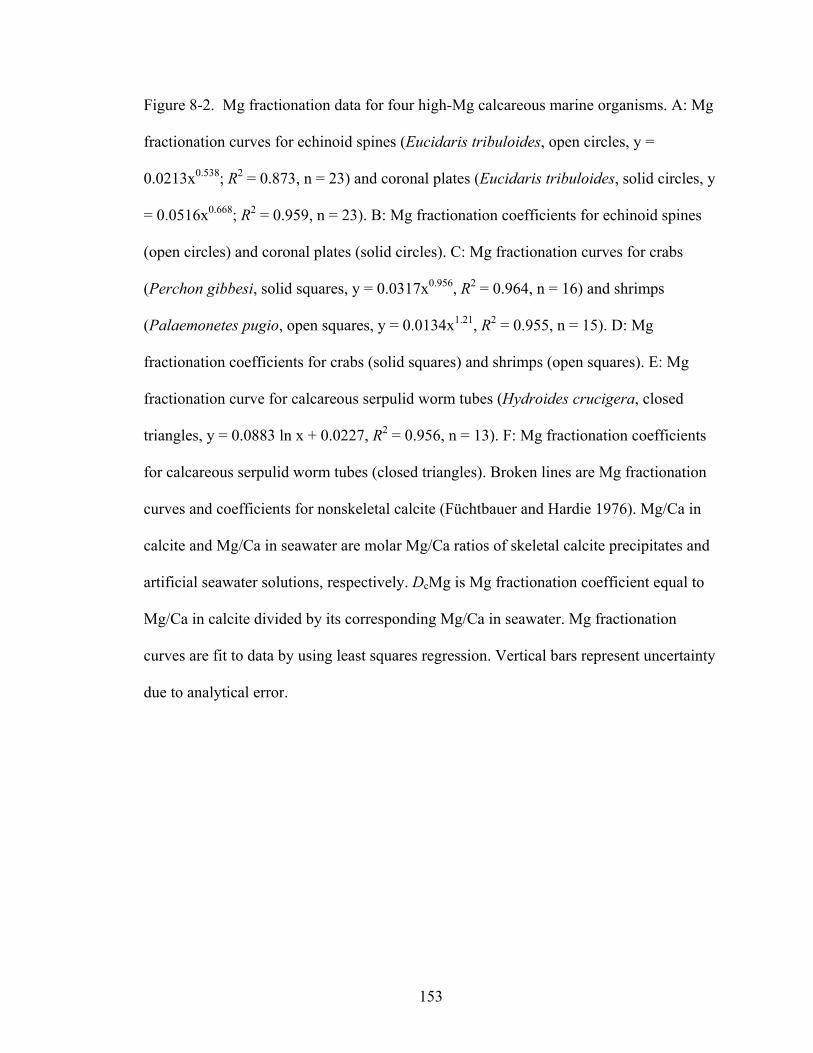
153
Figure 8-2. Mg fractionation data for four high-Mg calcareous marine organisms. A: Mg
fractionation curves for echinoid spines (Eucidaris tribuloides, open circles, y =
0.0213x0.538; R2 = 0.873, n = 23) and coronal plates (Eucidaris tribuloides, solid circles, y
= 0.0516x0.668; R2 = 0.959, n = 23). B: Mg fractionation coefficients for echinoid spines
(open circles) and coronal plates (solid circles). C: Mg fractionation curves for crabs
(Perchon gibbesi, solid squares, y = 0.0317x0.956, R2 = 0.964, n = 16) and shrimps
(Palaemonetes pugio, open squares, y = 0.0134x1.21, R2 = 0.955, n = 15). D: Mg
fractionation coefficients for crabs (solid squares) and shrimps (open squares). E: Mg
fractionation curve for calcareous serpulid worm tubes (Hydroides crucigera, closed
triangles, y = 0.0883 ln x + 0.0227, R2 = 0.956, n = 13). F: Mg fractionation coefficients
for calcareous serpulid worm tubes (closed triangles). Broken lines are Mg fractionation
curves and coefficients for nonskeletal calcite (Füchtbauer and Hardie 1976). Mg/Ca in
calcite and Mg/Ca in seawater are molar Mg/Ca ratios of skeletal calcite precipitates and
artificial seawater solutions, respectively. DcMg is Mg fractionation coefficient equal to
Mg/Ca in calcite divided by its corresponding Mg/Ca in seawater. Mg fractionation
curves are fit to data by using least squares regression. Vertical bars represent uncertainty
due to analytical error.
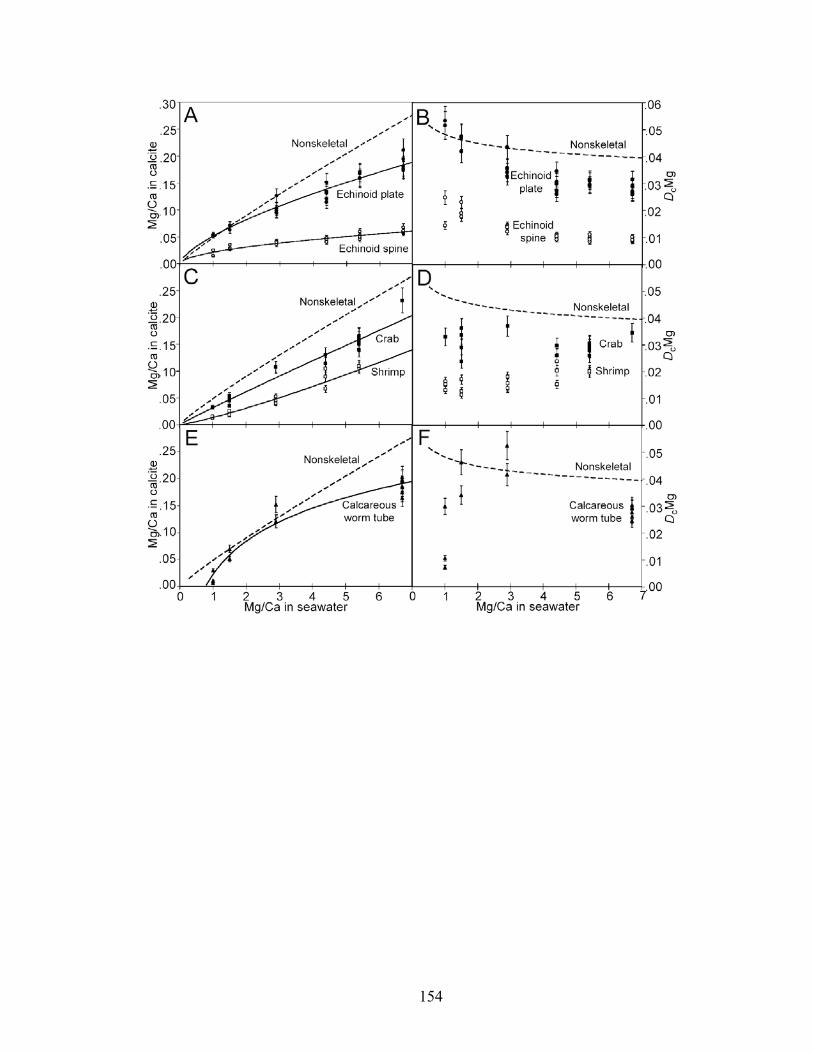
154
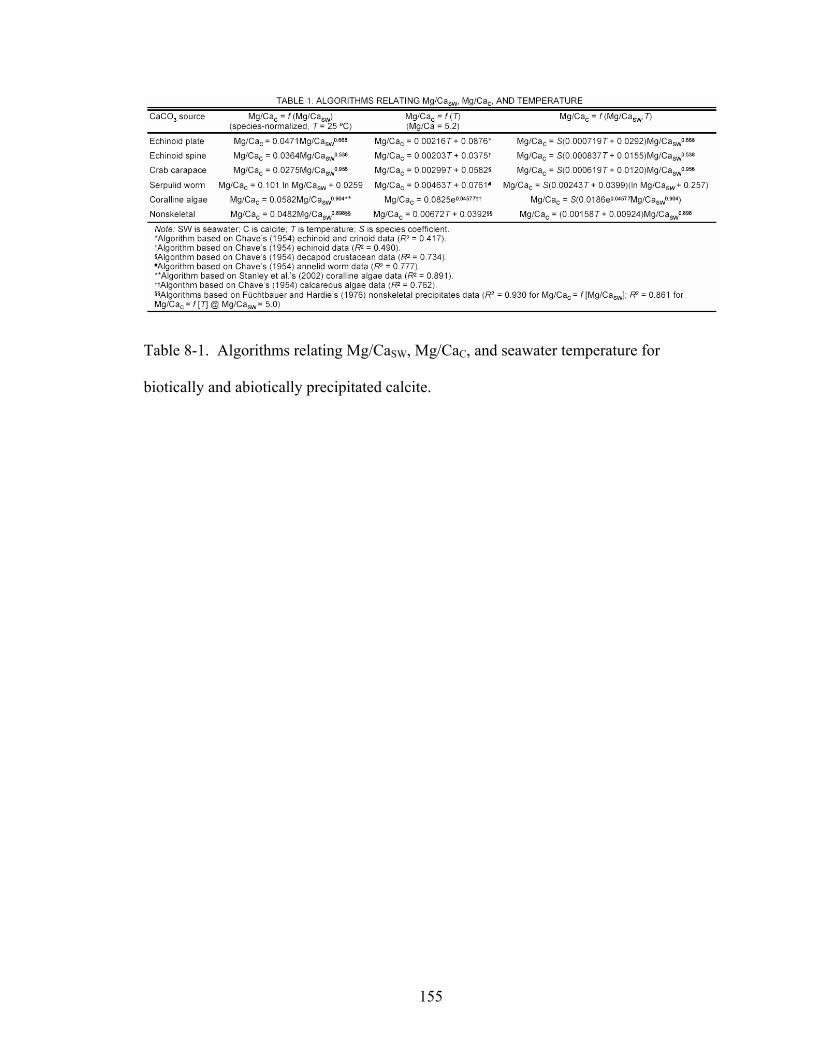
155
Table 8-1. Algorithms relating Mg/CaSW, Mg/CaC, and seawater temperature for
biotically and abiotically precipitated calcite.
156
9 Conclusions
9.1 Effect of artificial seawater Mg/Ca on growth and calcification rates
The aragonite-secreting codiacean algae [Penicillus capitatus, Udotea flabellum,
and Halimeda incrassata (Stanley et al. in preparation)] and the scleractinian corals
(Porites cylindrica, Montipora digitata, and Acropora cervicornis) exhibited higher rates
of calcification and growth in seawater of Mg/Ca ratios which favored their aragonitic
mineralogy. Conversely, the coccolithophores (Pleurochrysis carterae, Ochrosphaera
neopolitana, and Cruciplacolithus neohelis (Stanley et al. in press) exhibited higher rates
of growth and calcification in seawater of Mg/Ca ratios which favored their calcitic
mineralogy. It is reasonable, if not expected, that the algae’s and corals’ precipitation of
aragonite in the low-Mg calcite nucleation field, and the coccolithophores precipitation of
Mg calcite in the aragonite nucleation field, proceeds at a slower rate than it does in
seawater which favors the organisms’ inherent skeletal mineralogies. It appears that such
reduced rates of calcification liberate less CO2 for photosynthesis (Borowitzka and
Larkum 1976; Borowitzka 1977), thereby resulting in the concomitant reductions in
linear growth and primary productivity for these autotrophic organisms, when grown in
mineralogically unfavorable seawater.
9.2 Effect of artificial seawater Mg/Ca on polymorph mineralogy and Mg
incorporation
The codiacean algae and the scleractinian corals produced approximately one-
quarter and one-third, respectively, of their CaCO3 as the calcite polymorph, as opposed
to their normal aragonite polymorph, when grown in the artificial calcite seawater (molar
Mg/Ca < 2). The coccolithophores produced exclusively Mg calcite in all of the ambient
157
Mg/Ca conditions, with two of the three species exhibiting skeletal Mg/Ca ratios which
increased proportionally with the Mg/Ca ratio of the artificial seawater in which they
were grown. The coralline algae (Neogoniolithon sp.) and reef dwelling animals (the
echinoid Eucidaris tribuloides, the crab Perchon gibbesi, the shrimp Palaemonetes
pugio, and the calcareous serpulid worm Hydroides crucigera) produced exclusively Mg
calcite in all of the experimental Mg/Ca conditions and incorporated Mg into their
skeletons in proportion to the Mg/Ca ratio of the artificial seawater.
9.3 Biomineralogical control
The codiacean algae’s and scleractinian corals’ precipitation of a mostly
aragonitic skeleton, even in seawater which favors the abiotic precipitation of calcite,
suggests that these organisms exert significant control over their biomineralization.
However, the precipitation of one-quarter of the algae’s CaCO3 and one-third of the
corals’ CaCO3 as the calcite polymorph, as opposed to the normal aragonite polymorph,
suggests that the algae’s and corals’ biomineralogical control is somewhat limited and
can be at least partially overridden by ambient seawater chemistry.
Likewise, the influence of seawater Mg/Ca on the skeletal Mg/Ca of two of the
three species of coccolithophores, the calcitic portions of the scleractinian corals, the
coralline algae, and the reef-dwelling animals revealed through the experiments, suggests
that while these organisms are capable of specifying precipitation of the calcite
polymorph, even in seawater which favors the abiotic precipitation of aragonite, their
biomineralogical control is limited in its ability to prevent Mg incorporation in that
calcite. However, the deviation of many of these organisms’ Mg fractionation patterns
from that of abiotic calcite, combined with variations in Mg fractionation observed
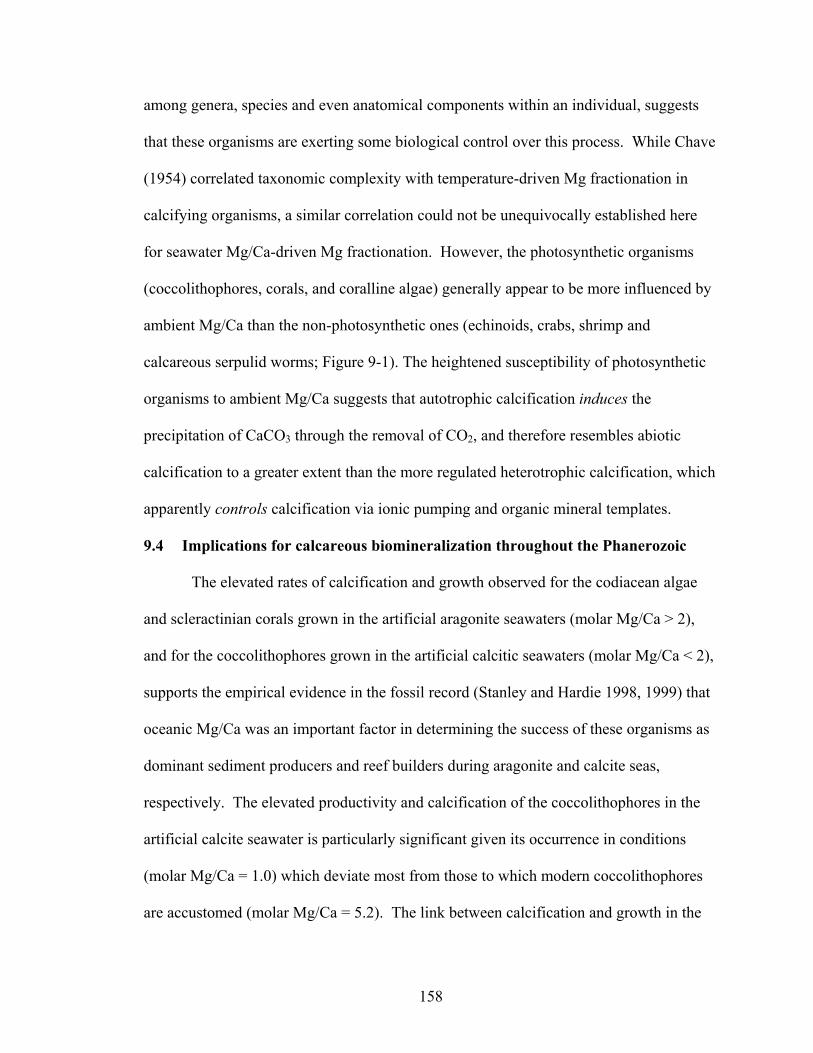
158
among genera, species and even anatomical components within an individual, suggests
that these organisms are exerting some biological control over this process. While Chave
(1954) correlated taxonomic complexity with temperature-driven Mg fractionation in
calcifying organisms, a similar correlation could not be unequivocally established here
for seawater Mg/Ca-driven Mg fractionation. However, the photosynthetic organisms
(coccolithophores, corals, and coralline algae) generally appear to be more influenced by
ambient Mg/Ca than the non-photosynthetic ones (echinoids, crabs, shrimp and
calcareous serpulid worms; Figure 9-1). The heightened susceptibility of photosynthetic
organisms to ambient Mg/Ca suggests that autotrophic calcification induces the
precipitation of CaCO3 through the removal of CO2, and therefore resembles abiotic
calcification to a greater extent than the more regulated heterotrophic calcification, which
apparently controls calcification via ionic pumping and organic mineral templates.
9.4 Implications for calcareous biomineralization throughout the Phanerozoic
The elevated rates of calcification and growth observed for the codiacean algae
and scleractinian corals grown in the artificial aragonite seawaters (molar Mg/Ca > 2),
and for the coccolithophores grown in the artificial calcitic seawaters (molar Mg/Ca < 2),
supports the empirical evidence in the fossil record (Stanley and Hardie 1998, 1999) that
oceanic Mg/Ca was an important factor in determining the success of these organisms as
dominant sediment producers and reef builders during aragonite and calcite seas,
respectively. The elevated productivity and calcification of the coccolithophores in the
artificial calcite seawater is particularly significant given its occurrence in conditions
(molar Mg/Ca = 1.0) which deviate most from those to which modern coccolithophores
are accustomed (molar Mg/Ca = 5.2). The link between calcification and growth in the
159
photosynthetic organisms (via CO2 liberation) suggests that autotrophic calcifiers would
have been most influenced by variations in the Mg/Ca ratio of seawater.
The correlation observed between skeletal Mg/Ca and seawater Mg/Ca for the
coccolithophores, the calcitic portions of the scleractinian corals, the coralline algae, and
the reef-dwelling animals supports the assertion that the skeletal Mg/Ca of organisms
which secrete high-Mg calcite in modern seas has varied in synchronicity with oceanic
Mg/Ca throughout the Phanerozoic (Stanley and Hardie 1998, 1999). The secretion of
low-Mg calcite by each of these organisms in the artificial calcite seawater (molar Mg/Ca
< 2) suggests that these organisms, which secrete high-Mg calcite in modern aragonite
seas, would have secreted low-Mg calcite in ancient calcite seas, such as those shown to
have existed during the middle Paleozoic and mid-Late Cretaceous. The wide range of
organisms which exhibit this proportionality between skeletal and seawater Mg/Ca
suggests that this is a universal trend for organisms which secrete high Mg calcite in
modern seas.
9.5 Paleoceanographic reconstructions
The observed relationship between seawater Mg/Ca and skeletal Mg
incorporation in the coccolithophores, the calcitic portions of the scleractinian corals, the
coralline algae, and the reef-dwelling animals suggests that well-preserved fossils of
these organisms may be an archive of oceanic Mg/Ca throughout the Phanerozoic.
Likewise, the reconstruction of ancient seawater temperatures from skeletal Mg/Ca ratios
must correct for the effect of secular variation in the Mg/Ca ratio of seawater. Mg
fractionation algorithms which define skeletal Mg/Ca as a function of seawater Mg/Ca
and temperature (Chave, 1954) were derived for the organisms evaluated in these
160
experiments. Oceanic Mg/Ca ratios calculated from the Mg content of fossil
echinoderms, established paleotemperature data, and the echinoid Mg fractionation
algorithm are in general agreement with other estimates of oceanic Mg/Ca throughout the
Phanerozoic.

161
9.6 Figures and tables
Figure 9-1. The relationship between skeletal Mg/Ca and seawater Mg/Ca for organisms
which secrete at least part of their skeleton as calcite. Solid lines are Mg fractionation
curves for photosynthetic organisms [the two coccolithophores Pleurochrysis carterae
and Ochrosphaera neopolitana (Stanley et al. in press); the crustose coralline red algae
Neogoniolithon sp.; the scleractinian corals Porites cylindrica, Montipora digitata, and
Acropora cervicornis; and the articulated coralline algae Amphiroa (Stanley et al. 2002)];
dotted line is Mg fractionation curve for abiotic calcite (Füchtbauer and Hardie 1976);
and dashed lines are Mg fractionation curves for non-photosynthetic organisms (the
echinoid Eucidaris tribuloides, the crab Perchon gibbesi, the shrimp Palaemonetes
pugio; and the calcareous serpulid worm Hydroides crucigera). Photosynthetic
organisms appear to be more influenced by ambient Mg/Ca than non-photosynthetic
ones.
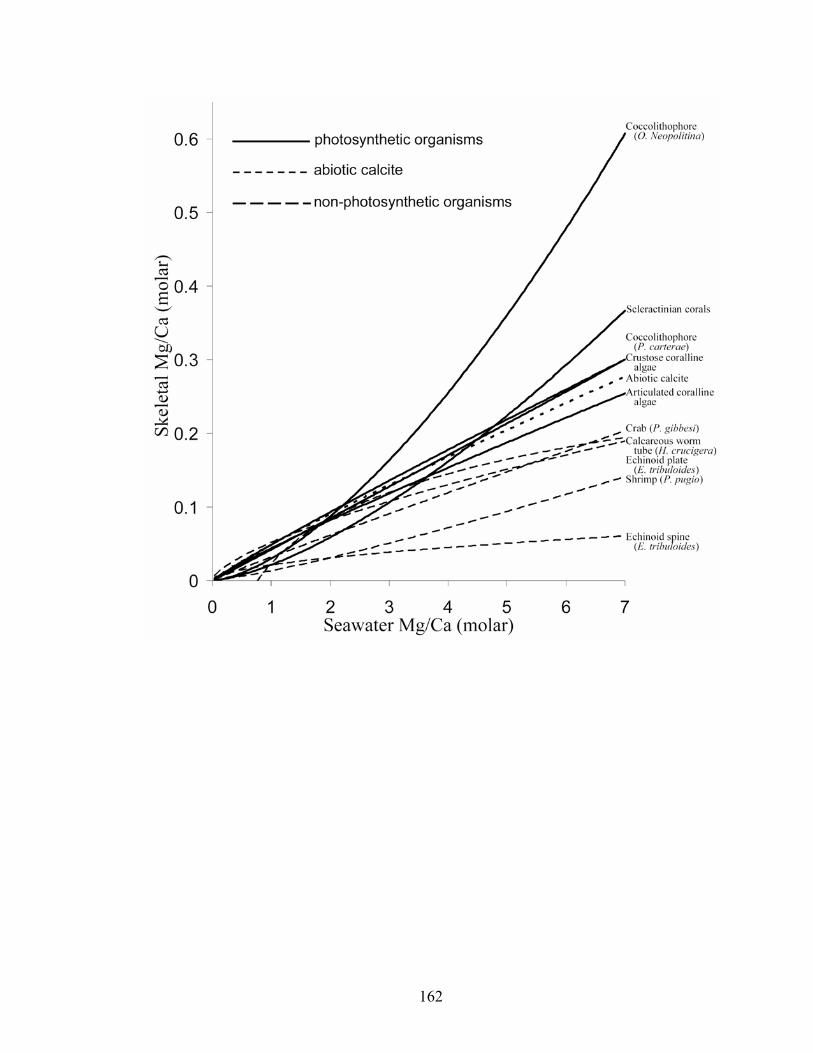
162

163
Appendices
Appendix A. Primary production and calcification for the codiacean alga Halimeda
incrassata.
Seawater mMg/Ca
Age(days)
Primary production (mg)
Calcification (mg)
2.5 1 0.06 0.05 2.5 2 0.14 0.19 2.5 3 0.23 0.40 2.5 4 0.33 0.66 2.5 5 0.48 1.11 2.5 6 0.68 1.70 2.5 7 0.88 2.30
5.2 1 0.22 0.10 5.2 2 0.52 0.68 5.2 3 0.84 1.59 5.2 4 1.18 2.69 5.2 5 1.57 4.15 5.2 6 1.91 5.67 5.2 7 2.20 7.35
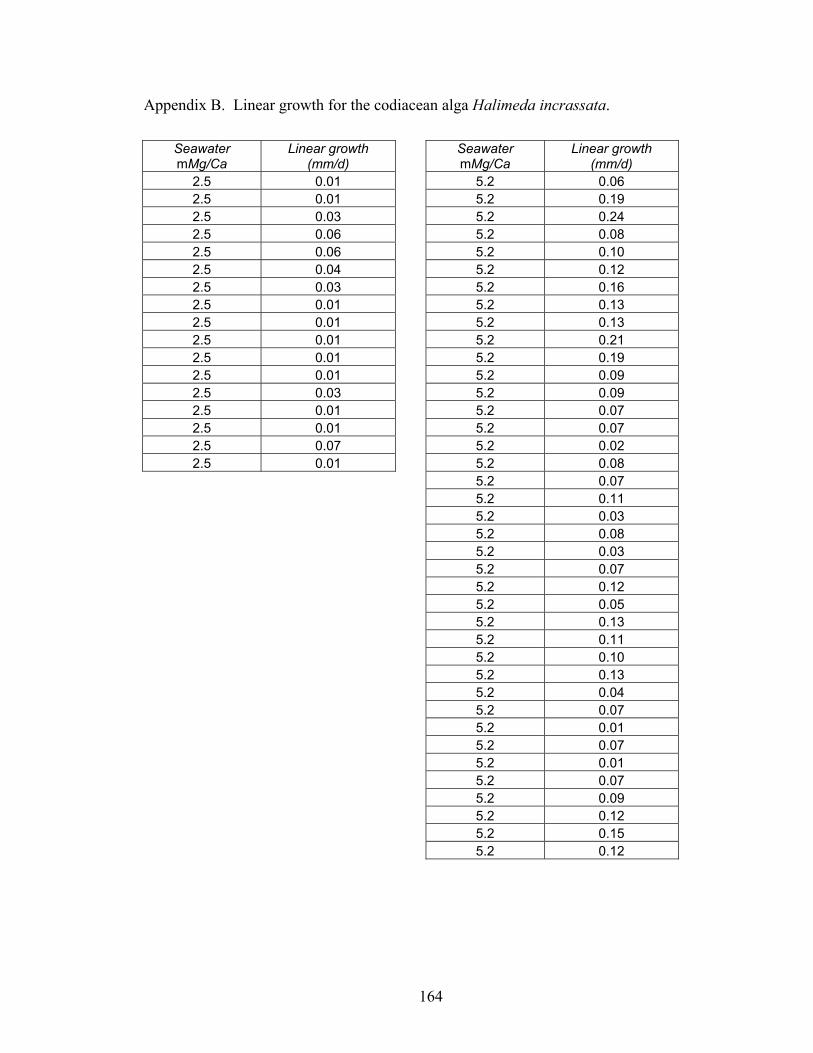
164
Appendix B. Linear growth for the codiacean alga Halimeda incrassata.
Seawater mMg/Ca
Linear growth (mm/d)
Seawater mMg/Ca
Linear growth (mm/d)
2.5 0.01 5.2 0.06 2.5 0.01 5.2 0.19 2.5 0.03 5.2 0.24 2.5 0.06 5.2 0.08 2.5 0.06 5.2 0.10 2.5 0.04 5.2 0.12 2.5 0.03 5.2 0.16 2.5 0.01 5.2 0.13 2.5 0.01 5.2 0.13 2.5 0.01 5.2 0.21 2.5 0.01 5.2 0.19 2.5 0.01 5.2 0.09 2.5 0.03 5.2 0.09 2.5 0.01 5.2 0.07 2.5 0.01 5.2 0.07 2.5 0.07 5.2 0.02 2.5 0.01 5.2 0.08
5.2 0.07 5.2 0.11 5.2 0.03 5.2 0.08 5.2 0.03 5.2 0.07 5.2 0.12 5.2 0.05 5.2 0.13 5.2 0.11 5.2 0.10 5.2 0.13 5.2 0.04 5.2 0.07 5.2 0.01 5.2 0.07 5.2 0.01 5.2 0.07 5.2 0.09 5.2 0.12 5.2 0.15 5.2 0.12
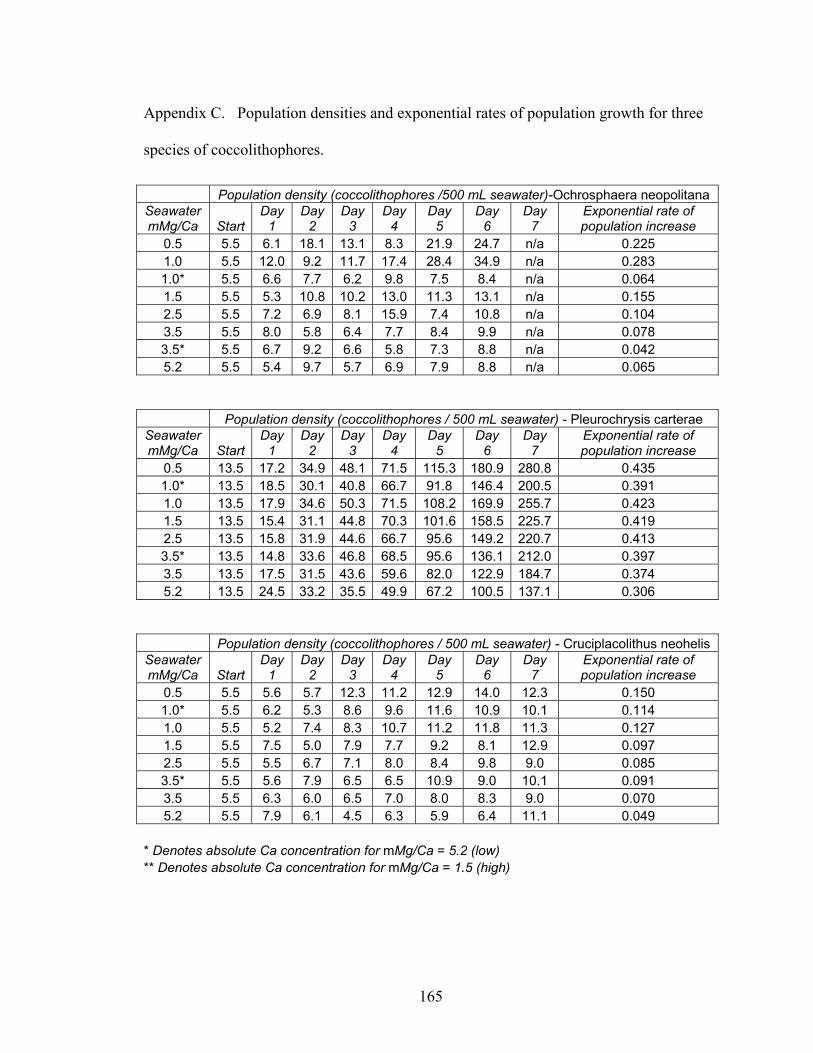
165
Appendix C. Population densities and exponential rates of population growth for three
species of coccolithophores.
Population density (coccolithophores /500 mL seawater)-Ochrosphaera neopolitanaSeawater mMg/Ca Start
Day 1
Day 2
Day 3
Day 4
Day 5
Day 6
Day 7
Exponential rate of population increase
0.5 5.5 6.1 18.1 13.1 8.3 21.9 24.7 n/a 0.225 1.0 5.5 12.0 9.2 11.7 17.4 28.4 34.9 n/a 0.283 1.0* 5.5 6.6 7.7 6.2 9.8 7.5 8.4 n/a 0.064 1.5 5.5 5.3 10.8 10.2 13.0 11.3 13.1 n/a 0.155 2.5 5.5 7.2 6.9 8.1 15.9 7.4 10.8 n/a 0.104 3.5 5.5 8.0 5.8 6.4 7.7 8.4 9.9 n/a 0.078 3.5* 5.5 6.7 9.2 6.6 5.8 7.3 8.8 n/a 0.042 5.2 5.5 5.4 9.7 5.7 6.9 7.9 8.8 n/a 0.065
Population density (coccolithophores / 500 mL seawater) - Pleurochrysis carteraeSeawater mMg/Ca Start
Day 1
Day 2
Day 3
Day 4
Day 5
Day 6
Day 7
Exponential rate of population increase
0.5 13.5 17.2 34.9 48.1 71.5 115.3 180.9 280.8 0.435 1.0* 13.5 18.5 30.1 40.8 66.7 91.8 146.4 200.5 0.391 1.0 13.5 17.9 34.6 50.3 71.5 108.2 169.9 255.7 0.423 1.5 13.5 15.4 31.1 44.8 70.3 101.6 158.5 225.7 0.419 2.5 13.5 15.8 31.9 44.6 66.7 95.6 149.2 220.7 0.413 3.5* 13.5 14.8 33.6 46.8 68.5 95.6 136.1 212.0 0.397 3.5 13.5 17.5 31.5 43.6 59.6 82.0 122.9 184.7 0.374 5.2 13.5 24.5 33.2 35.5 49.9 67.2 100.5 137.1 0.306
Population density (coccolithophores / 500 mL seawater) - Cruciplacolithus neohelisSeawater mMg/Ca Start
Day 1
Day 2
Day 3
Day 4
Day 5
Day 6
Day 7
Exponential rate of population increase
0.5 5.5 5.6 5.7 12.3 11.2 12.9 14.0 12.3 0.150 1.0* 5.5 6.2 5.3 8.6 9.6 11.6 10.9 10.1 0.114 1.0 5.5 5.2 7.4 8.3 10.7 11.2 11.8 11.3 0.127 1.5 5.5 7.5 5.0 7.9 7.7 9.2 8.1 12.9 0.097 2.5 5.5 5.5 6.7 7.1 8.0 8.4 9.8 9.0 0.085 3.5* 5.5 5.6 7.9 6.5 6.5 10.9 9.0 10.1 0.091 3.5 5.5 6.3 6.0 6.5 7.0 8.0 8.3 9.0 0.070 5.2 5.5 7.9 6.1 4.5 6.3 5.9 6.4 11.1 0.049
* Denotes absolute Ca concentration for mMg/Ca = 5.2 (low) ** Denotes absolute Ca concentration for mMg/Ca = 1.5 (high)
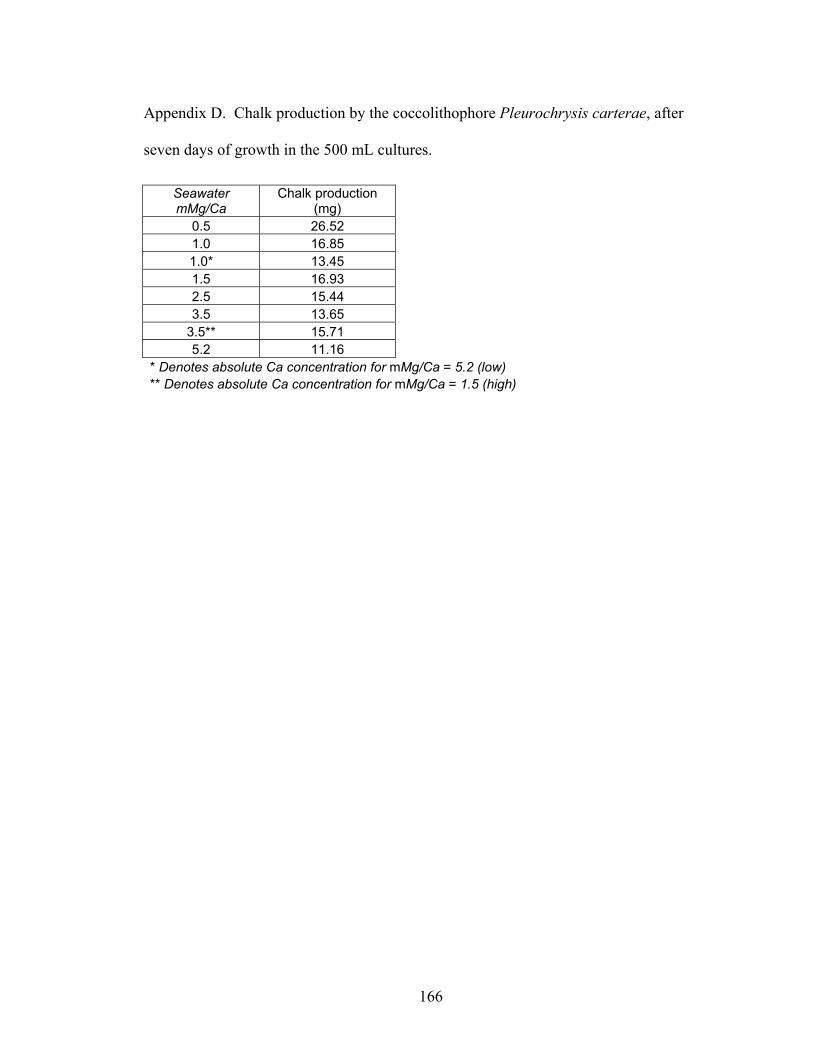
166
Appendix D. Chalk production by the coccolithophore Pleurochrysis carterae, after
seven days of growth in the 500 mL cultures.
Seawater mMg/Ca
Chalk production (mg)
0.5 26.52 1.0 16.85 1.0* 13.45 1.5 16.93 2.5 15.44 3.5 13.65
3.5** 15.71 5.2 11.16
* Denotes absolute Ca concentration for mMg/Ca = 5.2 (low)** Denotes absolute Ca concentration for mMg/Ca = 1.5 (high)
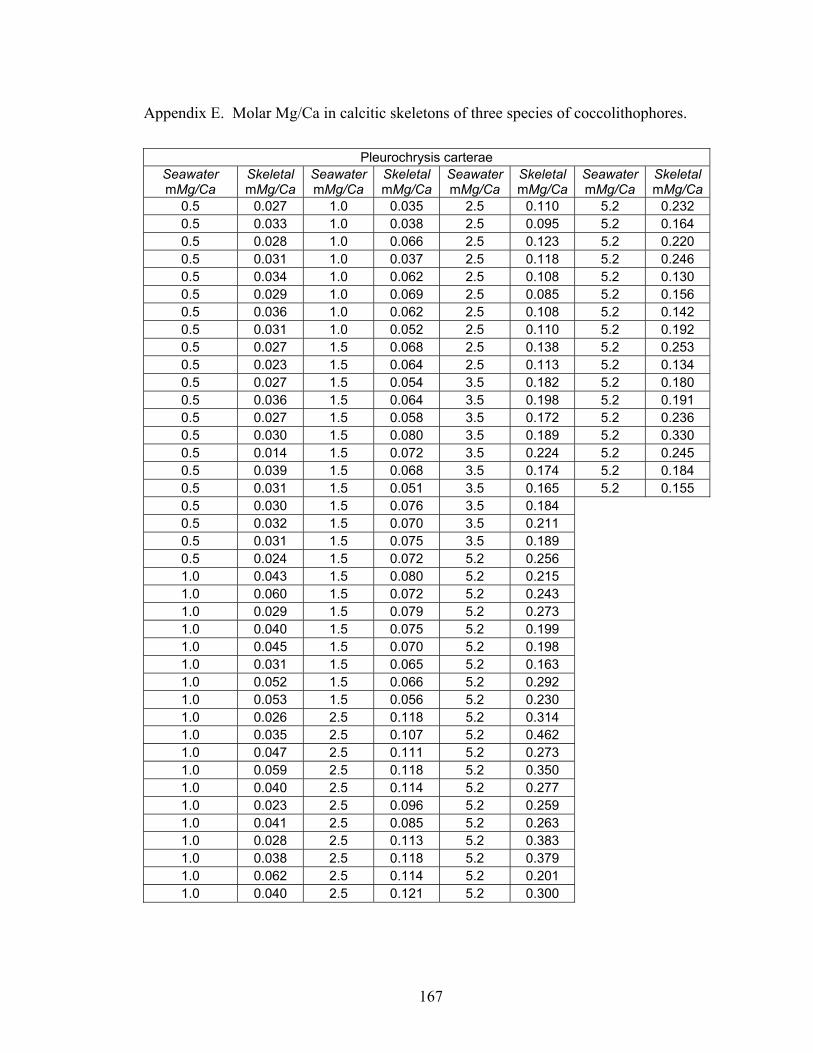
167
Appendix E. Molar Mg/Ca in calcitic skeletons of three species of coccolithophores.
Pleurochrysis carterae Seawater mMg/Ca
SkeletalmMg/Ca
Seawater mMg/Ca
SkeletalmMg/Ca
Seawater mMg/Ca
SkeletalmMg/Ca
Seawater mMg/Ca
SkeletalmMg/Ca
0.5 0.027 1.0 0.035 2.5 0.110 5.2 0.232 0.5 0.033 1.0 0.038 2.5 0.095 5.2 0.164 0.5 0.028 1.0 0.066 2.5 0.123 5.2 0.220 0.5 0.031 1.0 0.037 2.5 0.118 5.2 0.246 0.5 0.034 1.0 0.062 2.5 0.108 5.2 0.130 0.5 0.029 1.0 0.069 2.5 0.085 5.2 0.156 0.5 0.036 1.0 0.062 2.5 0.108 5.2 0.142 0.5 0.031 1.0 0.052 2.5 0.110 5.2 0.192 0.5 0.027 1.5 0.068 2.5 0.138 5.2 0.253 0.5 0.023 1.5 0.064 2.5 0.113 5.2 0.134 0.5 0.027 1.5 0.054 3.5 0.182 5.2 0.180 0.5 0.036 1.5 0.064 3.5 0.198 5.2 0.191 0.5 0.027 1.5 0.058 3.5 0.172 5.2 0.236 0.5 0.030 1.5 0.080 3.5 0.189 5.2 0.330 0.5 0.014 1.5 0.072 3.5 0.224 5.2 0.245 0.5 0.039 1.5 0.068 3.5 0.174 5.2 0.184 0.5 0.031 1.5 0.051 3.5 0.165 5.2 0.155 0.5 0.030 1.5 0.076 3.5 0.184 0.5 0.032 1.5 0.070 3.5 0.211 0.5 0.031 1.5 0.075 3.5 0.189 0.5 0.024 1.5 0.072 5.2 0.256 1.0 0.043 1.5 0.080 5.2 0.215 1.0 0.060 1.5 0.072 5.2 0.243 1.0 0.029 1.5 0.079 5.2 0.273 1.0 0.040 1.5 0.075 5.2 0.199 1.0 0.045 1.5 0.070 5.2 0.198 1.0 0.031 1.5 0.065 5.2 0.163 1.0 0.052 1.5 0.066 5.2 0.292 1.0 0.053 1.5 0.056 5.2 0.230 1.0 0.026 2.5 0.118 5.2 0.314 1.0 0.035 2.5 0.107 5.2 0.462 1.0 0.047 2.5 0.111 5.2 0.273 1.0 0.059 2.5 0.118 5.2 0.350 1.0 0.040 2.5 0.114 5.2 0.277 1.0 0.023 2.5 0.096 5.2 0.259 1.0 0.041 2.5 0.085 5.2 0.263 1.0 0.028 2.5 0.113 5.2 0.383 1.0 0.038 2.5 0.118 5.2 0.379 1.0 0.062 2.5 0.114 5.2 0.201 1.0 0.040 2.5 0.121 5.2 0.300

168
Ochrosphaera neopolitana Seawater mMg/Ca Skeletal mMg/Ca Seawater mMg/Ca Skeletal mMg/Ca
0.9 0.016 2.9 0.108 0.9 0.026 2.9 0.097 0.9 0.044 2.9 0.090 0.9 0.054 2.9 0.141 0.9 0.026 2.9 0.082 0.9 0.028 2.9 0.119 0.9 0.030 2.9 0.108 0.9 0.038 2.9 0.086 0.9 0.024 2.9 0.123 0.9 0.016 2.9 0.109 1.4 0.050 3.8 0.358 1.4 0.044 3.8 0.160 1.4 0.056 3.8 0.322 1.4 0.052 3.8 0.219 1.4 0.053 3.8 0.287 1.4 0.044 3.8 0.344 1.4 0.057 3.8 0.246 1.4 0.029 3.8 0.351 1.4 0.068 3.8 0.353 1.4 0.037 5.2 0.430 1.9 0.083 5.2 0.544 1.9 0.092 5.2 0.525 1.9 0.060 5.2 0.586 1.9 0.080 5.2 0.535 1.9 0.060 5.2 0.451 1.9 0.084 5.2 0.443 1.9 0.071 5.2 0.485 1.9 0.076 5.2 0.351 1.9 0.095 5.2 0.412 1.9 0.064
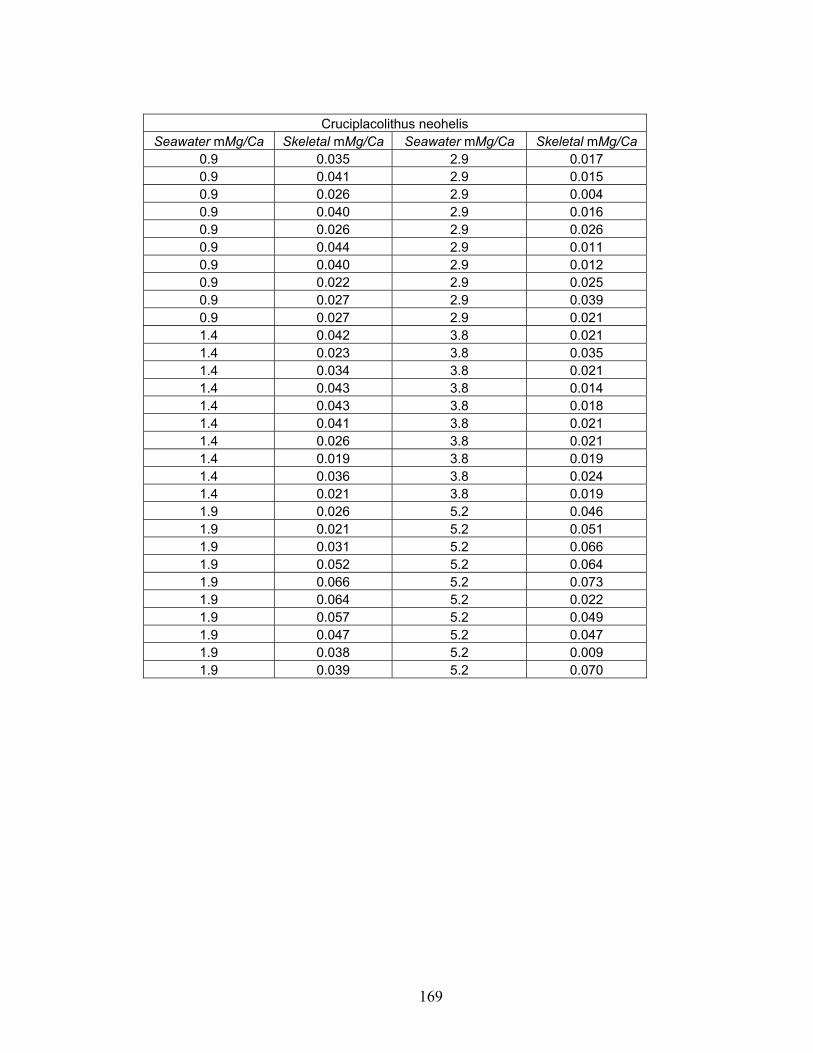
169
Cruciplacolithus neohelis Seawater mMg/Ca Skeletal mMg/Ca Seawater mMg/Ca Skeletal mMg/Ca
0.9 0.035 2.9 0.017 0.9 0.041 2.9 0.015 0.9 0.026 2.9 0.004 0.9 0.040 2.9 0.016 0.9 0.026 2.9 0.026 0.9 0.044 2.9 0.011 0.9 0.040 2.9 0.012 0.9 0.022 2.9 0.025 0.9 0.027 2.9 0.039 0.9 0.027 2.9 0.021 1.4 0.042 3.8 0.021 1.4 0.023 3.8 0.035 1.4 0.034 3.8 0.021 1.4 0.043 3.8 0.014 1.4 0.043 3.8 0.018 1.4 0.041 3.8 0.021 1.4 0.026 3.8 0.021 1.4 0.019 3.8 0.019 1.4 0.036 3.8 0.024 1.4 0.021 3.8 0.019 1.9 0.026 5.2 0.046 1.9 0.021 5.2 0.051 1.9 0.031 5.2 0.066 1.9 0.052 5.2 0.064 1.9 0.066 5.2 0.073 1.9 0.064 5.2 0.022 1.9 0.057 5.2 0.049 1.9 0.047 5.2 0.047 1.9 0.038 5.2 0.009 1.9 0.039 5.2 0.070
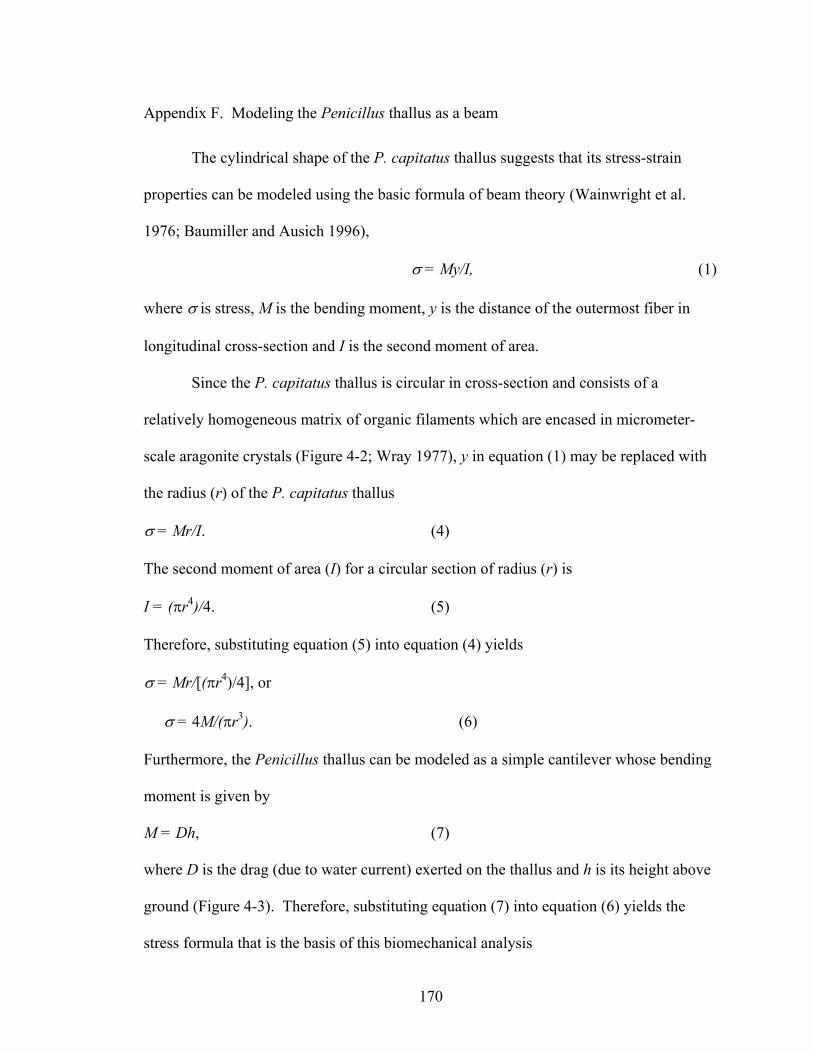
170
Appendix F. Modeling the Penicillus thallus as a beam
The cylindrical shape of the P. capitatus thallus suggests that its stress-strain
properties can be modeled using the basic formula of beam theory (Wainwright et al.
1976; Baumiller and Ausich 1996),
= My/I, (1)
where is stress, M is the bending moment, y is the distance of the outermost fiber in
longitudinal cross-section and I is the second moment of area.
Since the P. capitatus thallus is circular in cross-section and consists of a
relatively homogeneous matrix of organic filaments which are encased in micrometer-
scale aragonite crystals (Figure 4-2; Wray 1977), y in equation (1) may be replaced with
the radius (r) of the P. capitatus thallus
= Mr/I. (4)
The second moment of area (I) for a circular section of radius (r) is
I = ( r4)/4. (5)
Therefore, substituting equation (5) into equation (4) yields
= Mr/[( r4)/4], or
= 4M/( r3). (6)
Furthermore, the Penicillus thallus can be modeled as a simple cantilever whose bending
moment is given by
M = Dh, (7)
where D is the drag (due to water current) exerted on the thallus and h is its height above
ground (Figure 4-3). Therefore, substituting equation (7) into equation (6) yields the
stress formula that is the basis of this biomechanical analysis
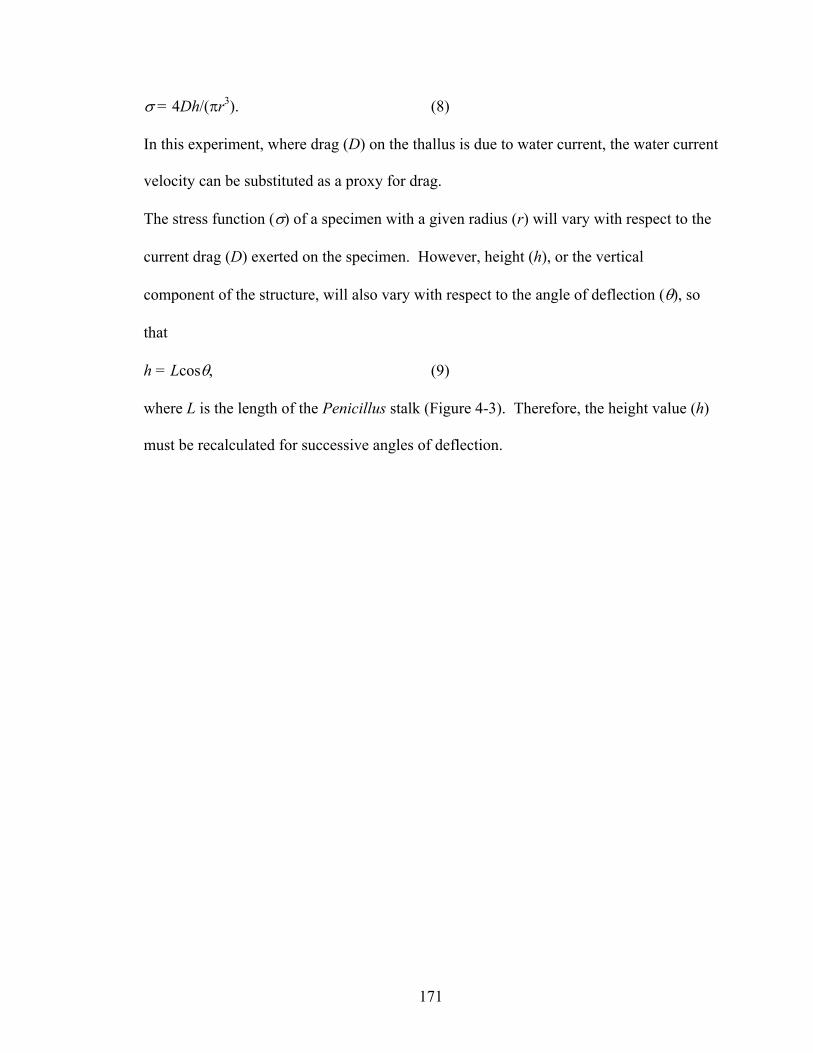
171
= 4Dh/( r3). (8)
In this experiment, where drag (D) on the thallus is due to water current, the water current
velocity can be substituted as a proxy for drag.
The stress function ( ) of a specimen with a given radius (r) will vary with respect to the
current drag (D) exerted on the specimen. However, height (h), or the vertical
component of the structure, will also vary with respect to the angle of deflection ( ), so
that
h = Lcos , (9)
where L is the length of the Penicillus stalk (Figure 4-3). Therefore, the height value (h)
must be recalculated for successive angles of deflection.
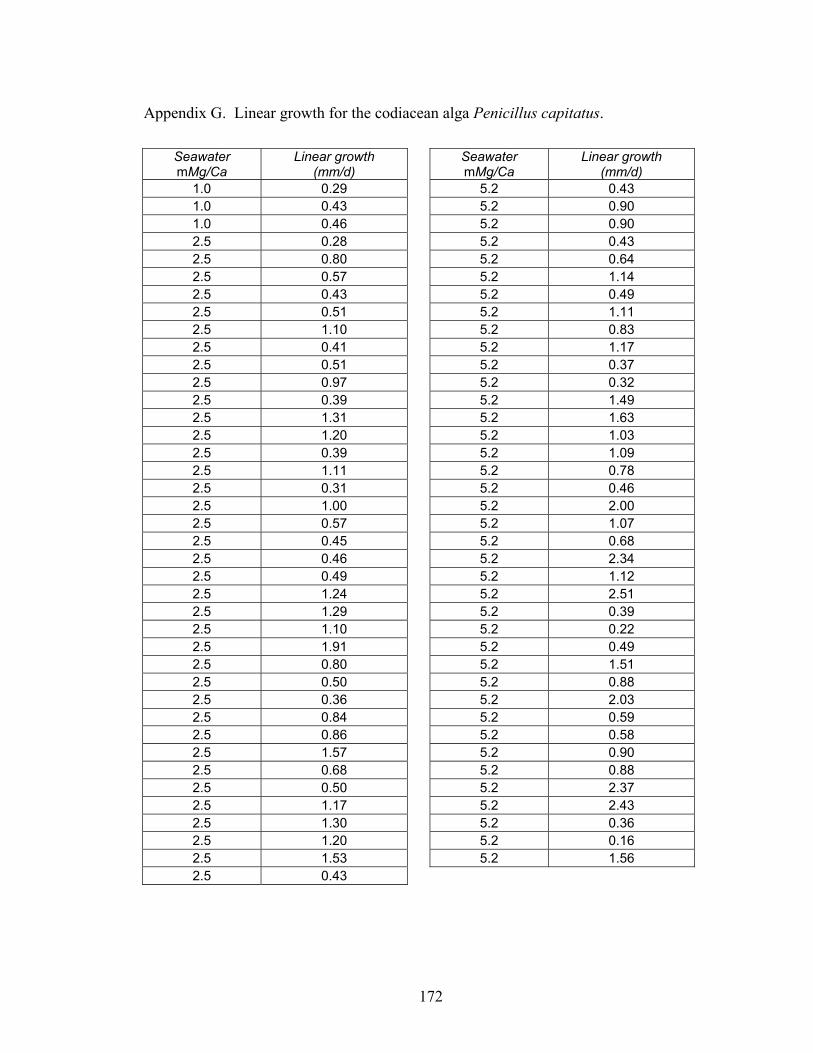
172
Appendix G. Linear growth for the codiacean alga Penicillus capitatus.
Seawater mMg/Ca
Linear growth (mm/d)
Seawater mMg/Ca
Linear growth (mm/d)
1.0 0.29 5.2 0.43 1.0 0.43 5.2 0.90 1.0 0.46 5.2 0.90 2.5 0.28 5.2 0.43 2.5 0.80 5.2 0.64 2.5 0.57 5.2 1.14 2.5 0.43 5.2 0.49 2.5 0.51 5.2 1.11 2.5 1.10 5.2 0.83 2.5 0.41 5.2 1.17 2.5 0.51 5.2 0.37 2.5 0.97 5.2 0.32 2.5 0.39 5.2 1.49 2.5 1.31 5.2 1.63 2.5 1.20 5.2 1.03 2.5 0.39 5.2 1.09 2.5 1.11 5.2 0.78 2.5 0.31 5.2 0.46 2.5 1.00 5.2 2.00 2.5 0.57 5.2 1.07 2.5 0.45 5.2 0.68 2.5 0.46 5.2 2.34 2.5 0.49 5.2 1.12 2.5 1.24 5.2 2.51 2.5 1.29 5.2 0.39 2.5 1.10 5.2 0.22 2.5 1.91 5.2 0.49 2.5 0.80 5.2 1.51 2.5 0.50 5.2 0.88 2.5 0.36 5.2 2.03 2.5 0.84 5.2 0.59 2.5 0.86 5.2 0.58 2.5 1.57 5.2 0.90 2.5 0.68 5.2 0.88 2.5 0.50 5.2 2.37 2.5 1.17 5.2 2.43 2.5 1.30 5.2 0.36 2.5 1.20 5.2 0.16 2.5 1.53 5.2 1.56 2.5 0.43

173
Appendix H. Primary production and calcification for the codiacean alga Penicillus
capitatus.
Seawater mMg/Ca
Primary production (mg)
Calcification (mg)
Seawater mMg/Ca
Primary production (mg)
Calcification (mg)
1.0 3.50 3.10 5.2 3.80 1.10 1.0 2.50 0.20 5.2 3.31 4.38 1.0 4.35 2.31 5.2 3.60 1.50 1.0 6.50 1.90 5.2 7.88 4.92 1.0 6.03 2.74 5.2 5.72 5.12 1.0 4.82 4.67 5.2 13.91 5.75 1.0 6.00 1.30 5.2 9.00 8.40 1.0 4.18 3.37 5.2 24.33 11.68 1.0 6.70 1.80 5.2 27.50 22.50 1.0 7.03 5.50 5.2 11.30 10.20 1.0 5.57 2.55 5.2 22.30 17.40 1.0 11.86 4.20 5.2 30.20 23.50 1.0 9.50 4.62 5.2 17.40 17.70 2.5 1.20 0.20 5.2 33.50 22.30 2.5 4.50 0.90 5.2 40.10 32.10 2.5 2.38 1.62 5.2 45.00 34.40 2.5 2.75 1.88 2.5 3.48 2.92 2.5 3.88 2.16 2.5 3.75 1.57 2.5 6.10 0.70 2.5 4.42 3.65 2.5 4.00 1.00 2.5 3.63 1.50 2.5 4.00 2.25 2.5 5.30 4.90 2.5 8.51 9.73 2.5 5.20 6.40 2.5 5.30 7.30 2.5 7.70 5.30 2.5 5.80 7.30 2.5 9.20 5.60 2.5 5.60 5.00 2.5 10.00 3.50 2.5 16.95 6.21 2.5 10.50 15.30 2.5 5.57 4.22 2.5 7.00 2.30 2.5 17.50 20.70 2.5 16.20 19.80 2.5 18.20 14.00 2.5 21.20 29.50
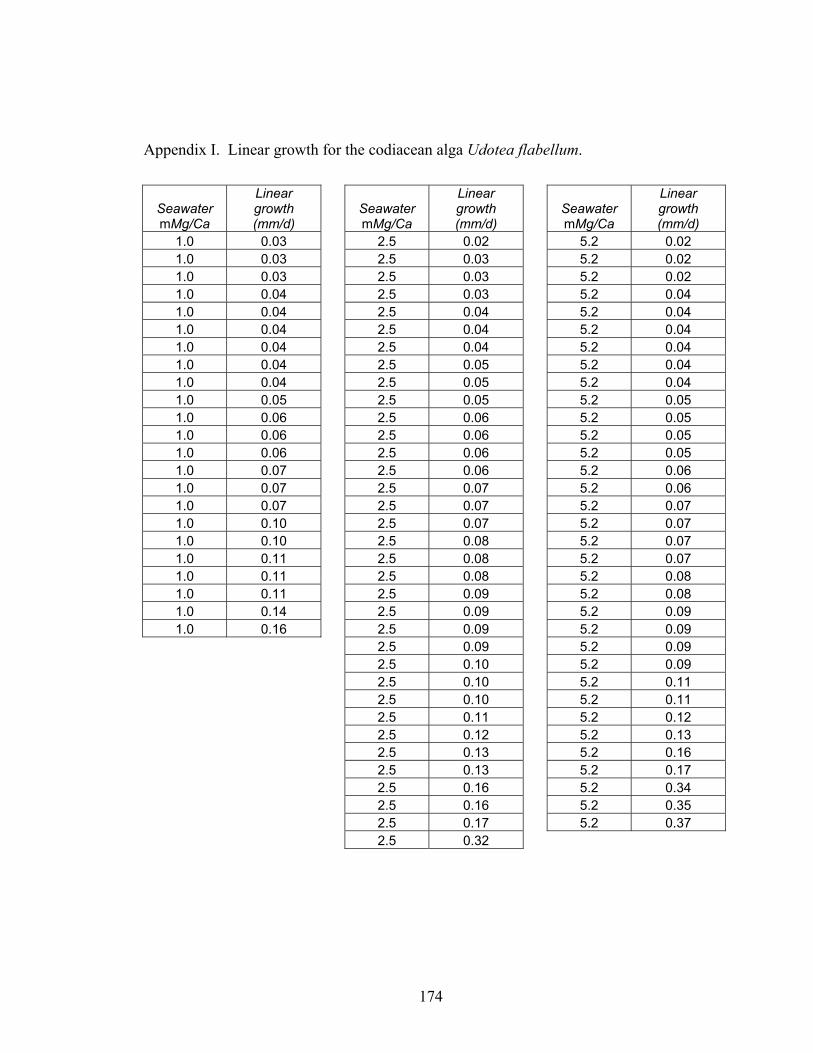
174
Appendix I. Linear growth for the codiacean alga Udotea flabellum.
Seawater mMg/Ca
Linear growth (mm/d)
Seawater mMg/Ca
Linear growth (mm/d)
Seawater mMg/Ca
Linear growth (mm/d)
1.0 0.03 2.5 0.02 5.2 0.02 1.0 0.03 2.5 0.03 5.2 0.02 1.0 0.03 2.5 0.03 5.2 0.02 1.0 0.04 2.5 0.03 5.2 0.04 1.0 0.04 2.5 0.04 5.2 0.04 1.0 0.04 2.5 0.04 5.2 0.04 1.0 0.04 2.5 0.04 5.2 0.04 1.0 0.04 2.5 0.05 5.2 0.04 1.0 0.04 2.5 0.05 5.2 0.04 1.0 0.05 2.5 0.05 5.2 0.05 1.0 0.06 2.5 0.06 5.2 0.05 1.0 0.06 2.5 0.06 5.2 0.05 1.0 0.06 2.5 0.06 5.2 0.05 1.0 0.07 2.5 0.06 5.2 0.06 1.0 0.07 2.5 0.07 5.2 0.06 1.0 0.07 2.5 0.07 5.2 0.07 1.0 0.10 2.5 0.07 5.2 0.07 1.0 0.10 2.5 0.08 5.2 0.07 1.0 0.11 2.5 0.08 5.2 0.07 1.0 0.11 2.5 0.08 5.2 0.08 1.0 0.11 2.5 0.09 5.2 0.08 1.0 0.14 2.5 0.09 5.2 0.09 1.0 0.16 2.5 0.09 5.2 0.09
2.5 0.09 5.2 0.09 2.5 0.10 5.2 0.09 2.5 0.10 5.2 0.11 2.5 0.10 5.2 0.11 2.5 0.11 5.2 0.12 2.5 0.12 5.2 0.13 2.5 0.13 5.2 0.16 2.5 0.13 5.2 0.17 2.5 0.16 5.2 0.34 2.5 0.16 5.2 0.35 2.5 0.17 5.2 0.37 2.5 0.32

175
Appendix J. Primary production and calcification for the codiacean algae Udotea
flabellum.
Seawater mMg/Ca
Age(days)
Primary production
(mg)
Calcification (mg)
Seawater mMg/Ca
Age(days)
Primary production
(mg)
Calcification (mg)
1.0 5 0.59 0.01 5.2 6 0.98 0.42 1.0 5 0.98 0.82 5.2 7 1.47 0.92 1.0 10 0.98 0.15 5.2 8 1.70 0.18 1.0 12 1.26 0.92 5.2 9 0.52 0.43 1.0 12 1.89 0.75 5.2 10 1.26 0.53 1.0 12 1.43 0.39 5.2 14 5.03 1.89 1.0 13 1.77 0.71 5.2 15 2.64 1.28 1.0 13 2.04 1.48 5.2 15 3.71 1.01 1.0 13 1.46 0.27 5.2 17 4.36 4.38 1.0 14 2.20 0.84 5.2 18 2.95 2.38 1.0 14 1.48 0.72 5.2 19 1.56 3.14 1.0 15 1.09 0.61 5.2 20 4.96 6.50 1.0 17 3.74 0.94 5.2 22 4.44 3.47 1.0 18 1.70 1.62 5.2 22 6.53 6.38 1.0 19 2.09 1.58 5.2 23 3.37 6.13 1.0 24 1.86 2.83 5.2 23 7.87 13.54 2.5 5 0.58 0.32 5.2 24 5.60 7.59 2.5 6 0.38 0.58 5.2 32 3.48 8.26 2.5 7 0.95 0.61 5.2 34 15.17 12.90 2.5 9 0.99 0.61 5.2 37 7.00 11.94 2.5 10 3.09 2.02 5.2 38 15.35 19.47 2.5 10 0.81 0.78 5.2 38 8.57 14.35 2.5 11 1.16 1.46 5.2 54 22.39 27.90 2.5 13 3.01 3.48 2.5 15 3.69 3.51 2.5 17 3.38 1.48 2.5 17 1.34 2.87 2.5 21 3.15 4.21 2.5 23 5.63 6.85 2.5 24 2.15 4.53 2.5 28 2.97 5.08 2.5 30 4.42 6.58 2.5 40 5.75 12.65
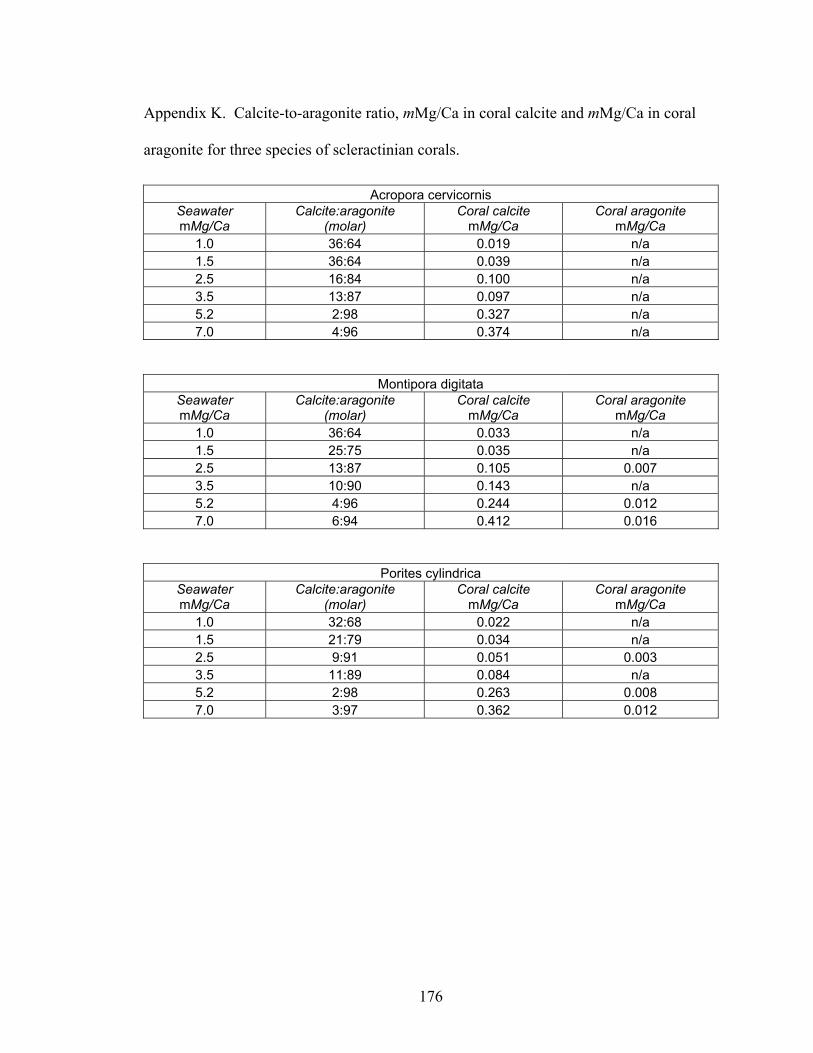
176
Appendix K. Calcite-to-aragonite ratio, mMg/Ca in coral calcite and mMg/Ca in coral
aragonite for three species of scleractinian corals.
Acropora cervicornis Seawater mMg/Ca
Calcite:aragonite (molar)
Coral calcite mMg/Ca
Coral aragonite mMg/Ca
1.0 36:64 0.019 n/a 1.5 36:64 0.039 n/a 2.5 16:84 0.100 n/a 3.5 13:87 0.097 n/a 5.2 2:98 0.327 n/a 7.0 4:96 0.374 n/a
Montipora digitata Seawater mMg/Ca
Calcite:aragonite (molar)
Coral calcite mMg/Ca
Coral aragonite mMg/Ca
1.0 36:64 0.033 n/a 1.5 25:75 0.035 n/a 2.5 13:87 0.105 0.007 3.5 10:90 0.143 n/a 5.2 4:96 0.244 0.012 7.0 6:94 0.412 0.016
Porites cylindrica Seawater mMg/Ca
Calcite:aragonite (molar)
Coral calcite mMg/Ca
Coral aragonite mMg/Ca
1.0 32:68 0.022 n/a 1.5 21:79 0.034 n/a 2.5 9:91 0.051 0.003 3.5 11:89 0.084 n/a 5.2 2:98 0.263 0.008 7.0 3:97 0.362 0.012
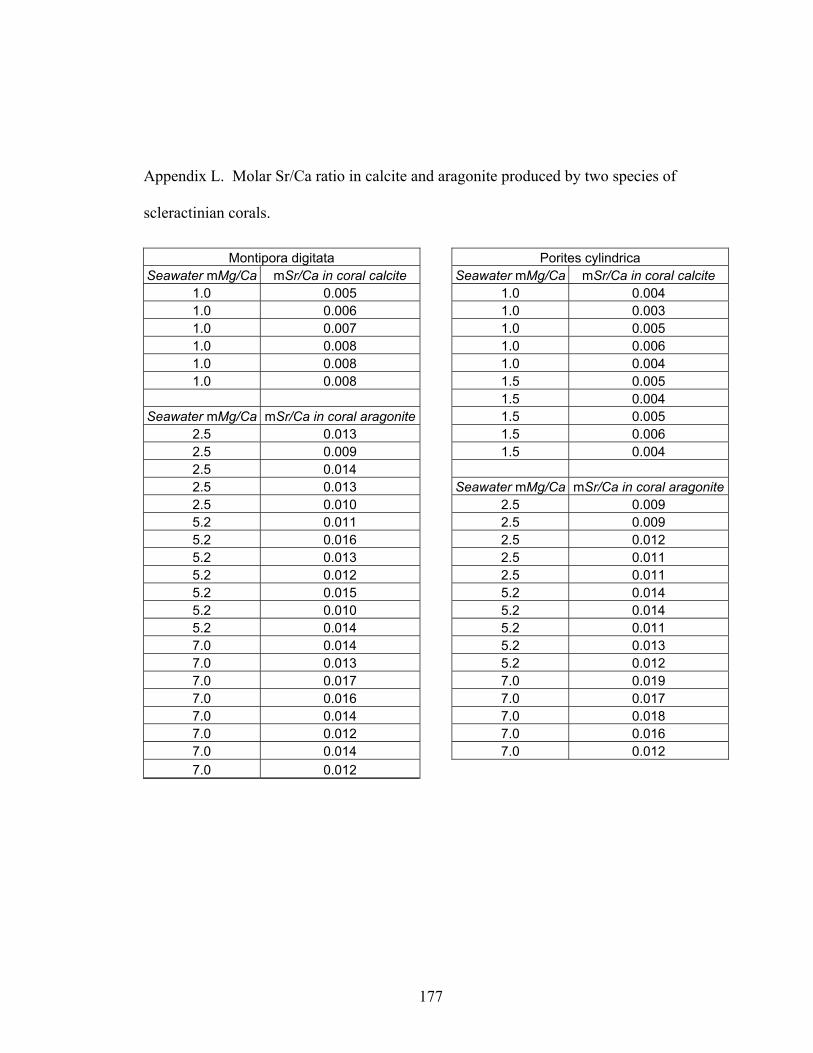
177
Appendix L. Molar Sr/Ca ratio in calcite and aragonite produced by two species of
scleractinian corals.
Montipora digitata Porites cylindrica Seawater mMg/Ca mSr/Ca in coral calcite Seawater mMg/Ca mSr/Ca in coral calcite
1.0 0.005 1.0 0.004 1.0 0.006 1.0 0.003 1.0 0.007 1.0 0.005 1.0 0.008 1.0 0.006 1.0 0.008 1.0 0.004 1.0 0.008 1.5 0.005
1.5 0.004 Seawater mMg/Ca mSr/Ca in coral aragonite 1.5 0.005
2.5 0.013 1.5 0.006 2.5 0.009 1.5 0.004 2.5 0.014 2.5 0.013 Seawater mMg/Ca mSr/Ca in coral aragonite2.5 0.010 2.5 0.009 5.2 0.011 2.5 0.009 5.2 0.016 2.5 0.012 5.2 0.013 2.5 0.011 5.2 0.012 2.5 0.011 5.2 0.015 5.2 0.014 5.2 0.010 5.2 0.014 5.2 0.014 5.2 0.011 7.0 0.014 5.2 0.013 7.0 0.013 5.2 0.012 7.0 0.017 7.0 0.019 7.0 0.016 7.0 0.017 7.0 0.014 7.0 0.018 7.0 0.012 7.0 0.016 7.0 0.014 7.0 0.012 7.0 0.012
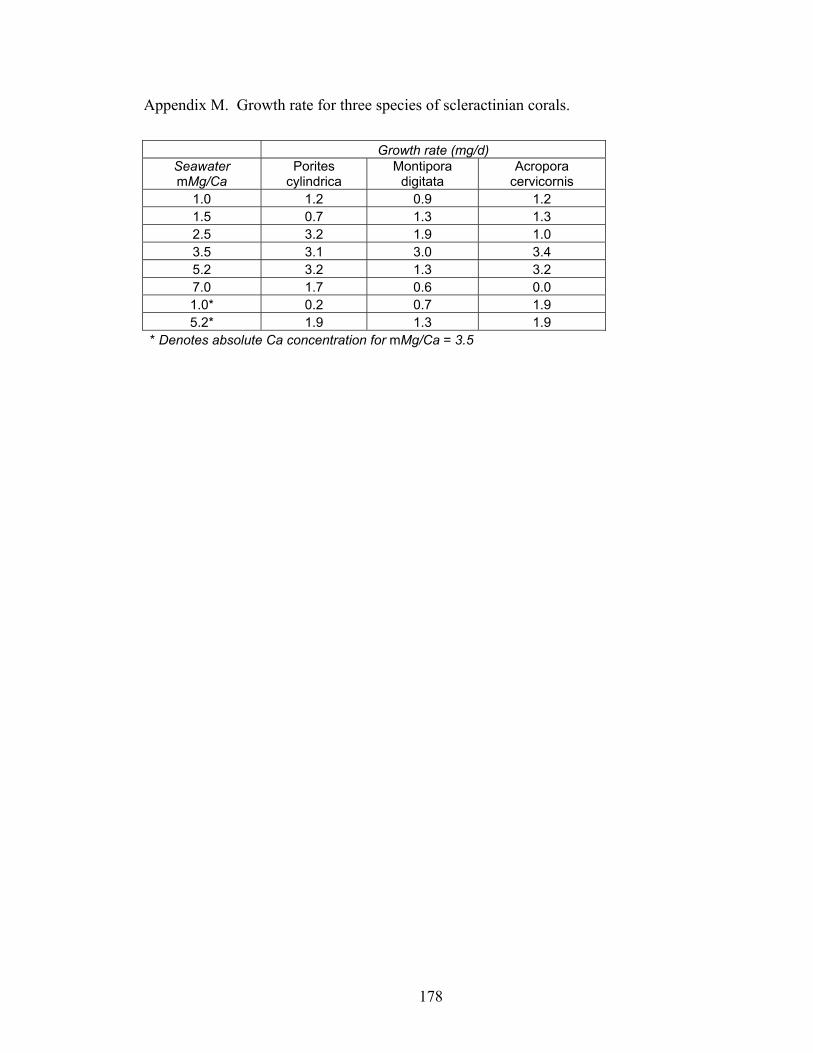
178
Appendix M. Growth rate for three species of scleractinian corals.
Growth rate (mg/d) Seawater mMg/Ca
Porites cylindrica
Montipora digitata
Acropora cervicornis
1.0 1.2 0.9 1.2 1.5 0.7 1.3 1.3 2.5 3.2 1.9 1.0 3.5 3.1 3.0 3.4 5.2 3.2 1.3 3.2 7.0 1.7 0.6 0.0 1.0* 0.2 0.7 1.9 5.2* 1.9 1.3 1.9
* Denotes absolute Ca concentration for mMg/Ca = 3.5
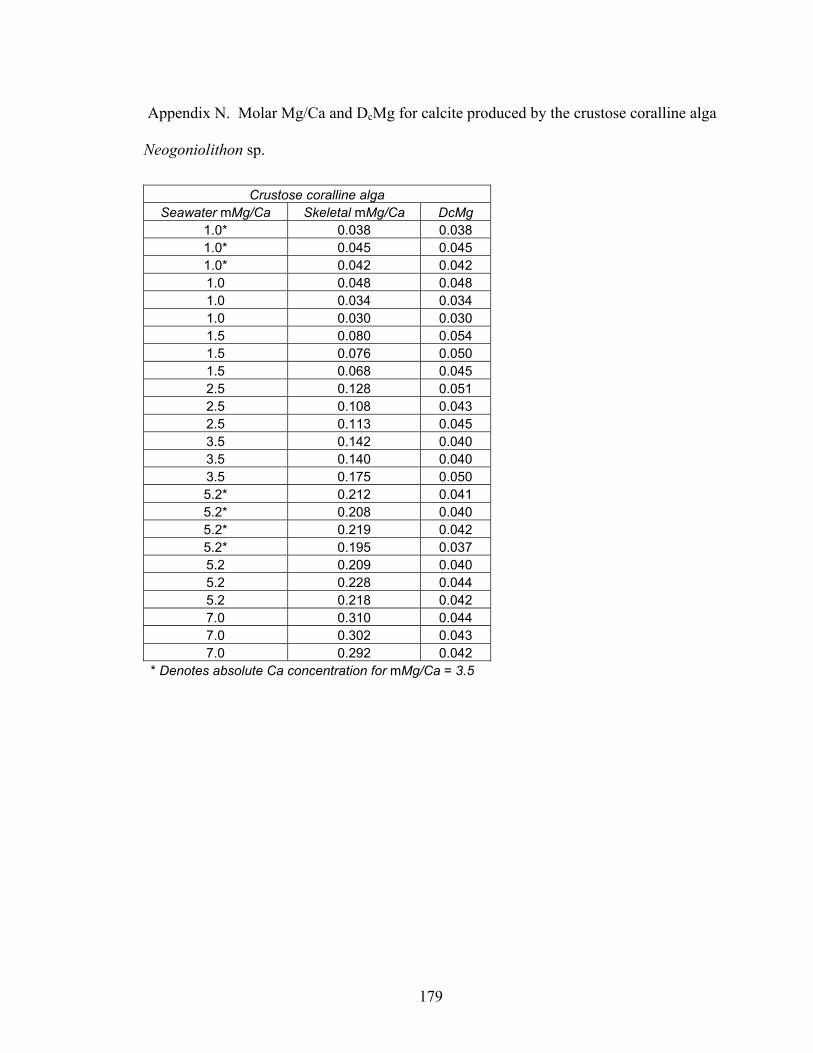
179
Appendix N. Molar Mg/Ca and DcMg for calcite produced by the crustose coralline alga
Neogoniolithon sp.
Crustose coralline alga Seawater mMg/Ca Skeletal mMg/Ca DcMg
1.0* 0.038 0.038 1.0* 0.045 0.045 1.0* 0.042 0.042 1.0 0.048 0.048 1.0 0.034 0.034 1.0 0.030 0.030 1.5 0.080 0.054 1.5 0.076 0.050 1.5 0.068 0.045 2.5 0.128 0.051 2.5 0.108 0.043 2.5 0.113 0.045 3.5 0.142 0.040 3.5 0.140 0.040 3.5 0.175 0.050 5.2* 0.212 0.041 5.2* 0.208 0.040 5.2* 0.219 0.042 5.2* 0.195 0.037 5.2 0.209 0.040 5.2 0.228 0.044 5.2 0.218 0.042 7.0 0.310 0.044 7.0 0.302 0.043 7.0 0.292 0.042
* Denotes absolute Ca concentration for mMg/Ca = 3.5
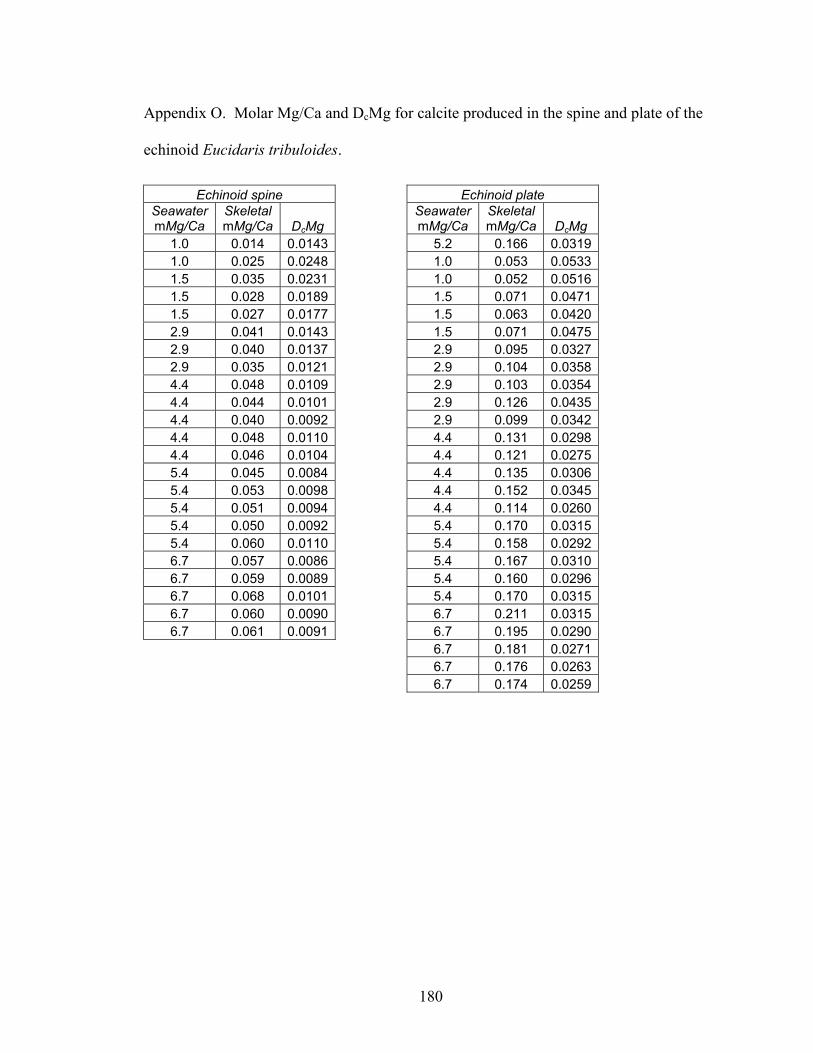
180
Appendix O. Molar Mg/Ca and DcMg for calcite produced in the spine and plate of the
echinoid Eucidaris tribuloides.
Echinoid spine Echinoid plate Seawater mMg/Ca
SkeletalmMg/Ca DcMg
Seawater mMg/Ca
SkeletalmMg/Ca DcMg
1.0 0.014 0.0143 5.2 0.166 0.0319 1.0 0.025 0.0248 1.0 0.053 0.0533 1.5 0.035 0.0231 1.0 0.052 0.0516 1.5 0.028 0.0189 1.5 0.071 0.0471 1.5 0.027 0.0177 1.5 0.063 0.0420 2.9 0.041 0.0143 1.5 0.071 0.0475 2.9 0.040 0.0137 2.9 0.095 0.0327 2.9 0.035 0.0121 2.9 0.104 0.0358 4.4 0.048 0.0109 2.9 0.103 0.0354 4.4 0.044 0.0101 2.9 0.126 0.0435 4.4 0.040 0.0092 2.9 0.099 0.0342 4.4 0.048 0.0110 4.4 0.131 0.0298 4.4 0.046 0.0104 4.4 0.121 0.0275 5.4 0.045 0.0084 4.4 0.135 0.0306 5.4 0.053 0.0098 4.4 0.152 0.0345 5.4 0.051 0.0094 4.4 0.114 0.0260 5.4 0.050 0.0092 5.4 0.170 0.0315 5.4 0.060 0.0110 5.4 0.158 0.0292 6.7 0.057 0.0086 5.4 0.167 0.0310 6.7 0.059 0.0089 5.4 0.160 0.0296 6.7 0.068 0.0101 5.4 0.170 0.0315 6.7 0.060 0.0090 6.7 0.211 0.0315 6.7 0.061 0.0091 6.7 0.195 0.0290
6.7 0.181 0.0271 6.7 0.176 0.0263 6.7 0.174 0.0259
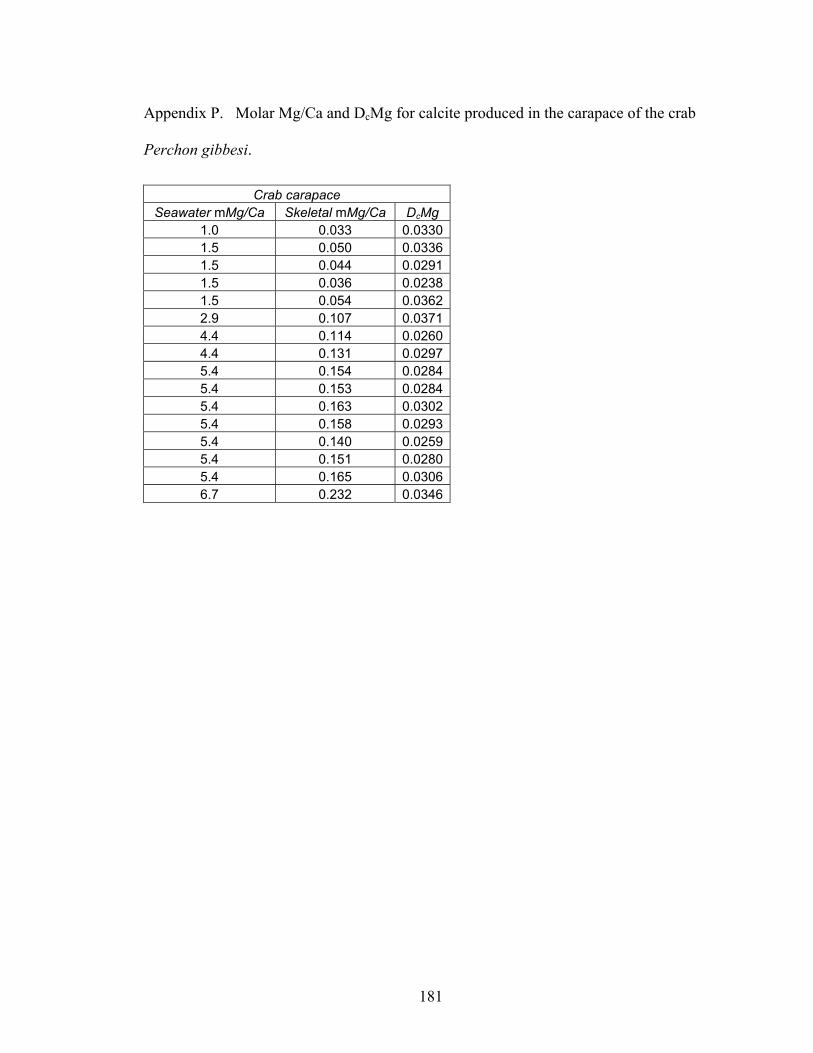
181
Appendix P. Molar Mg/Ca and DcMg for calcite produced in the carapace of the crab
Perchon gibbesi.
Crab carapace Seawater mMg/Ca Skeletal mMg/Ca DcMg
1.0 0.033 0.03301.5 0.050 0.03361.5 0.044 0.02911.5 0.036 0.02381.5 0.054 0.03622.9 0.107 0.03714.4 0.114 0.02604.4 0.131 0.02975.4 0.154 0.02845.4 0.153 0.02845.4 0.163 0.03025.4 0.158 0.02935.4 0.140 0.02595.4 0.151 0.02805.4 0.165 0.03066.7 0.232 0.0346
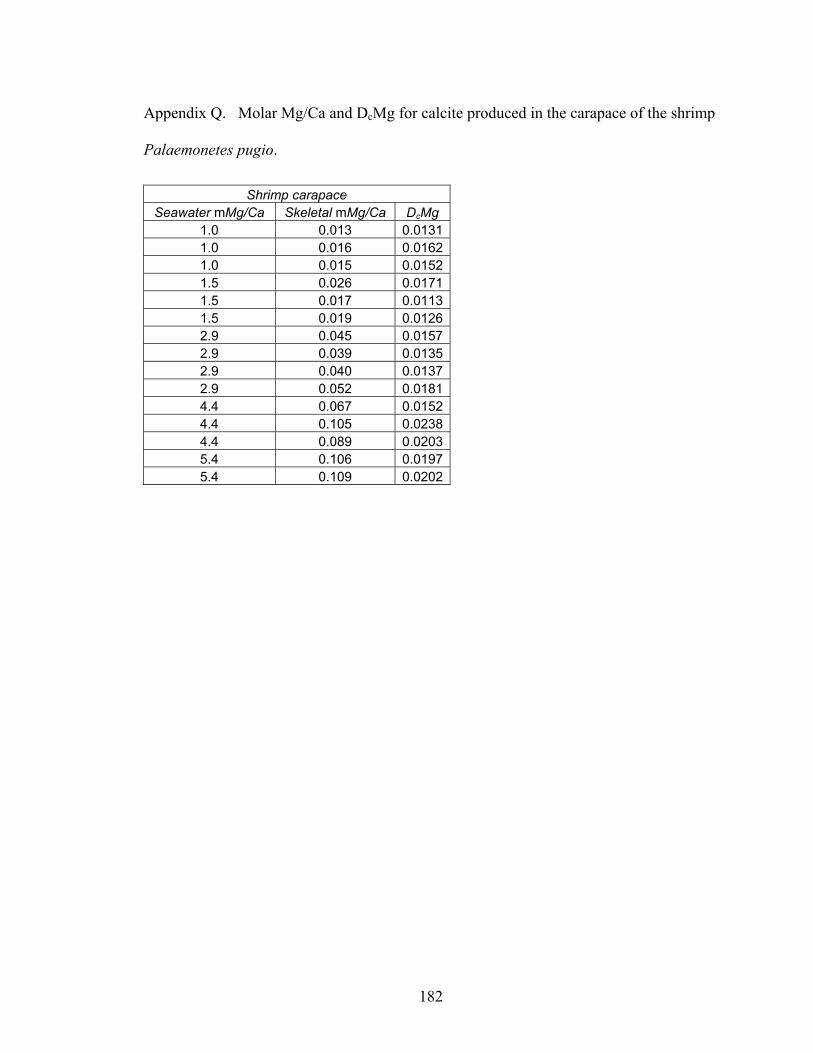
182
Appendix Q. Molar Mg/Ca and DcMg for calcite produced in the carapace of the shrimp
Palaemonetes pugio.
Shrimp carapace Seawater mMg/Ca Skeletal mMg/Ca DcMg
1.0 0.013 0.01311.0 0.016 0.01621.0 0.015 0.01521.5 0.026 0.01711.5 0.017 0.01131.5 0.019 0.01262.9 0.045 0.01572.9 0.039 0.01352.9 0.040 0.01372.9 0.052 0.01814.4 0.067 0.01524.4 0.105 0.02384.4 0.089 0.02035.4 0.106 0.01975.4 0.109 0.0202
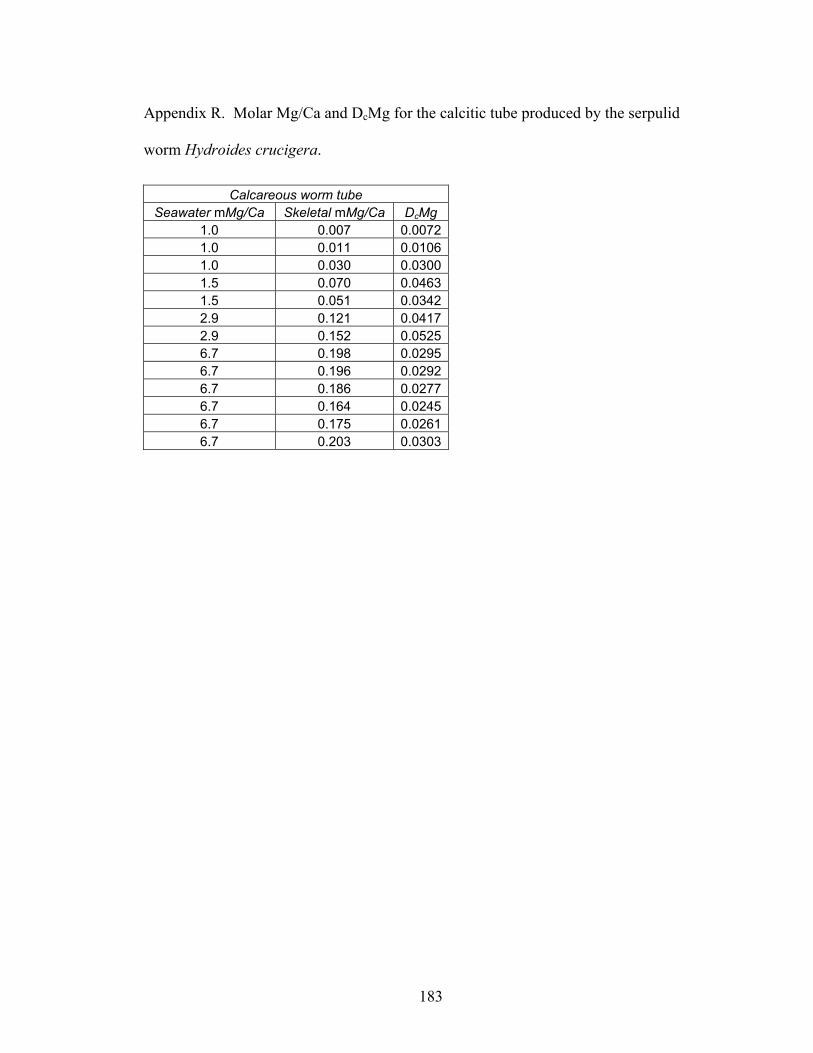
183
Appendix R. Molar Mg/Ca and DcMg for the calcitic tube produced by the serpulid
worm Hydroides crucigera.
Calcareous worm tube Seawater mMg/Ca Skeletal mMg/Ca DcMg
1.0 0.007 0.00721.0 0.011 0.01061.0 0.030 0.03001.5 0.070 0.04631.5 0.051 0.03422.9 0.121 0.04172.9 0.152 0.05256.7 0.198 0.02956.7 0.196 0.02926.7 0.186 0.02776.7 0.164 0.02456.7 0.175 0.02616.7 0.203 0.0303
184
Bibliography
Adey, W. H., and I. G. Macintyre. 1973. Crustose coralline algae: a re-evaluation in the
geological sciences. Geological Society of America Bulletin 84:883-904.
Aguirre, J., R. Riding, and J. C. Braga. 2000. Diversity of coralline red algae: origination
and extinction patterns from the Early Cretaceous to the Pleistocene. Paleobiology
26(4):651-667.
Alexandersson, T. 1977. Carbonate cementation in Recent coralline algal constructions.
Pp. 261-269. In E. Flugel, ed. Fossil Algae: Recent Result and Developments.
Springer-Verlag, Berlin.
Al-Horani, F. A., S. M. Al-Moghrabi, and D. De Beer. 2003. The mechanism of
calcification and its relation to photosynthesis and respiration in the scleractinian
coral Galaxea fascicularis. Marine Biology 142:419-426.
Barnes, D. J. 1970. Coral skeletons: An explanation of their growth and structure.
Science 170:1305-1308.
Bathurst, R. G. C. 1975. Carbonate sediments and their diagenesis. Elsevier, Amsterdam.
Baumiller, T. K., and W. I. Ausich. 1996. Crinoid stalk flexibility: theoretical predictions
and fossil stalk postures. Lethaia 29:47-59.
Bellis, S., J. P. Davis, and G. C. Stephens. 1987. The lack of an effect of magnesium on
the uptake of amino acids by the sea urchin Strongylocentrotus purpuratus.
Journal of Experimental Zoology 244:383-388.
Bernecker, M. 1996. Upper Triassic reefs of the Oman Mountains: data from the south
Tethyan margin. Facies 34:41-76.

185
Berner, R. A. 1975. The role of magnesium in the crystal growth of calcite and aragonite
from sea water. Geochimica et Cosmochimica Acta 39:489-504.
Berner, R. A. 1997. The rise of land plants and their effect on weathering and
atmospheric CO2. Science 291:339-376.
Berner, T. 1990. Coral-reef algae. Pp. 253-264. In Z. Dubinsky, ed. Coral Reefs. Elsevier,
Amsterdam.
Bidwell, J. P., and S. Spotte. 1985. Artificial Seawaters: Formulas and Methods. Jones
and Bartlett, Boston.
Bischoff, W. D., F. C. Bishop, and F. T. Mackenzie. 1983. Biogenically produced
magnesian calcite: inhomogeneities in chemical and physical properties:
comparison with synthetic phases. American Mineralogist 68:1183-1188.
Böhm, L., D. Fütterer, and E. Kaminski. 1978. Algal calcification in some Codiaceae
(Chlorophyta): ultrastructure and location of skeletal deposits. Journal of
Phycology 14:486-493.
Borowitzka, M. A. 1977. Algal calcification. Oceanography and Marine Biology Annual
Review 15:189-223.
Borowitzka, M. A. 1984. Calcification in aquatic plants. Plant, Cell and Environment
7:457-466.
Borowitzka, M. A., and A. W. D. Larkum. 1976. Calcification in the green alga
Halimeda. III. The sources of inorganic carbon for photosynthesis and
calcification and a model of the mechanism of calcification. Journal of
Experimental Biology 27:879-893.
186
Borowitzka, M. A., and A. W. D. Larkum. 1977. Calcification in the green alga
Halimeda. I. An ultrastructure study of thallus development. Journal of Phycology
13:6-16.
Borowitzka, M. A., W. D. Larkum, and C. E. Nockolds. 1974. A scanning electron
microscope study of the structure and organization of the calcium carbonate
deposits of algae. Phycologia 13:195-203.
Chalker, B. E. 1976. Calcium-Transport During Skeletogenesis in Hermatypic Corals.
Comparative Biochemistry and Physiology a-Physiology 54(4):455-459.
Chave, K. E. 1954. Aspects of the Biogeochemistry of magnesium, 1. Calcareous marine
organisms. Journal of Geology 62:266-283.
Chisholm, J. R. M. 2003. Primary productivity of reef-building crustose coralline algae.
Limnology and Oceanography 48(4):1376-1387.
Chuvashov, B., and R. Riding. 1984. Principal floras of Paleozoic marine calcareous
algae. Palaeontology 27:487-500.
Cloud, P. E., Jr. 1962. Environment of calcium carbonate deposition west of Andros
Island, Bahamas. No. 350. U.S. Geological Survey.
Cohen, A. L., and T. A. McConnaughey. 2003. A Geochemical Perspective on Coral
Mineralization. Pp. 151-187. In P. M. Dove, S. Weiner, and J. J. De Yoreo, eds.
Biomineralization. Reviews in Mineralogy and Geochemistry.
Colombo, P. M. 1978. An ultrastructural study of thallus organization in Udotea
petiolata. Phycologia 17(3):227-235.
187
Cuif, J. P., Y. Dauphin, J. Doucet, P. Gautret, and H. Zibrowius. 1999. Biochemical
markers of zooxanthellae symbiosis in soluble matrices of skeleton in
scleractinian coral skeletons. Geochimica et Cosmochimica Acta 67:75-83.
Davis, K. J., P. M. Dove, and J. J. De Yoreo. 2000. The role of Mg2+ as an impurity in
calcite growth. Science 290:1134-1137.
Deckker, P. D., A. R. Chivas, and J. M. G. Shelley. 1999. Uptake of Mg and Sr in the
euryhaline ostracod Cyprideis determined from in vitro experiments.
Palaeogeography, Palaeoclimatology, Palaeoecology 148:105-116.
Demicco, R. V., T. K. Lowenstein, and L. A. Hardie. 2003. Atmospheric pCO2 since 60
Ma from records of seawater pH, calcium, and primary carbonate mineralogy.
Geology 31(9):793-796.
Devery, D. M., and A. J. Ehlmann. 1981. Morphological changes in a series of synthetic
Mg calcites. American Mineralogist 66:592-595.
Dickson, J. A. D. 2002. Fossil echinoderms as monitor of the Mg/Ca ratio of Phanerozoic
oceans. Science 298:1222-1224.
Dickson, J. A. D. 2004. Echinoderm skeletal preservation: calcite-aragonite seas and the
Mg/Ca ratio of Phanerozoic oceans. Journal of Sedimentary Research 74(3):355-
365.
Drew, E. A. 1983. Halimeda biomass growth rate and sediment generation on reefs in the
Central Great Barrier Reef Province. Coral Reefs 2:101-110.
Drew, E. A., and K. M. Abel. 1988. Studies on Halimeda. 1. The distribution and species
composition of Halimeda meadows throughout the Great Barrier Reef Province.
Coral Reefs 6:195-205.
188
Ehrlinger, J. R., Cerling, T.E. 1995. Atmospheric CO2 and the ratio of intercellular to
ambient CO2 concentrations in plants. Tree Physiology 15:105-111.
Elliot, G. F. 1978. Ecological significance of post-Paleozoic green calcareous algae.
Geological Magazine 115:437-442.
Enmar, R., B. Lazar, M. Bar-Matthews, E. Sass, A. Katz, and M. Stein. 2000. Diagenesis
in live corals from the Gulf of Aqaba. I. The effect on paleo-oceanography
tracers. Geochimica et Cosmochimica Acta 64:3123-3132.
Flajs, G. 1977. Skeletal structures of some calcifying algae. Pp. 225-231. In E. Flugel, ed.
Fossil Algae. Springer-Verlag, Berlin.
Flügel, E. 1988. Halimeda: paleontological record and palaeoenvironmental significance.
Coral Reefs 6:123-130.
Flügel, E. 1991. Triassic and Jurassic marine calcareous algae: a critical review. Pp. 481-
503. In R. Riding, ed. Calcareous algae and stromatolites. Springer-Verlag,
Berlin.
Folk, R. L. 1974. The natural history of crystalline calcium carbonate: effect of
magnesium content and salinity. Journal of Sedimentary Petrology 44:40-53.
Freeman, K. H., and J. M. Hayes. 1992. Fractionation of carbon isotopes by
phytoplankton and estimates of ancient CO2 levels. Global Biogeochemical
Cycles 6:185-198.
Friedman, E. I., W. C. Roth, J. B. Turner, and R. S. McEwin. 1972. Calcium oxalate
crystals in the aragonite-producing green alga Penicillus and related genera.
Science 177:891-893.
189
Fritsch, F. E. 1948. The structure and reproduction of the algae. Pp. 402-413. Cambridge
University Press.
Frost, S. H. 1977. Miocene to Holocene evolution of Caribbean Province reef-building
corals. Proceedings of the 3rd International Coral Reef Symposium:353-355.
Frost, S. H. 1981. Oligocene reef coral biofacies of the Vicentin, Northeast Italy. Pp. 483-
539. In D. F. Toomey, ed. European Fossil Reef Models. Society of Economic
Paleontologists and Mineralogists, Special Publications.
Füchtbauer, H., and L. A. Hardie. 1976. Experimentally determined homogeneous
distribution coefficients for precipitated magnesian calcites: application to marine
carbonate cements. Geological Society of America Abstracts with Program 8:877.
Füchtbauer, H., and L. A. Hardie. 1980. Comparison of experimental and natural
magnesian calcites. International Association of Sedimentologists, Bochum:167-
169.
Gattuso, J. P., M. Frankignoulle, I. Bourge, S. Romaine, and R. W. Buddemeier. 1998.
Effect of calcium carbonate saturation of seawater on coral calcification. Global
and Planetary Change 18(1-2):37-46.
Gaylord, E. H., and C. N. Gaylord. 1990. Structural Engineering Handbook. McGraw,
New York.
Glover, E. D., and R. F. Sippel. 1967. Synthesis of magnesium calcites. Geochimica et
Cosmochimica Acta 31:603-614.
Golonka, J., M. I. Ros, and C. R. Scotese. 1994. Phanerozoic paleogeographic and
paleoclimatic modeling maps. Pp. 1-47. In A. R. Embry, B. Beaucamp, and D. J.
190
Glass, eds. Pangea: global environments and resources. Canadian Society of
Petroleum Geologists, Calgary.
Halfar, J., T. Zack, A. Kronz, and J. C. Zachos. 2000. Growth and high-resolution
paleoenvironmental signals of rhodoliths (coralline red algae): A new biogenic
archive. Journal of Geophysical Research-Oceans 105(C9):22107-22116.
Hardie, L. A. 1996. Secular variation in seawater chemistry: an explanation for the
coupled secular variation in the mineralogies of marine limestones and potash
evaporites over the past 600 m.y. Geology 24:279-283.
Hart, S. R., and A. L. Cohen. 1996. Sr/Ca in corals: An ion microprobe study of annual
cycles and microscale coherence with other trace elements. Geochimica et
Cosmochimica Acta 60:3075-3084.
Hattin, D. E. 1988. Cretaceous shelf-sea chalk deposits: a global synthesis. American
Association of Petroleum Geologists Bulletin 72:195-196.
Hay, M. E. 1997. Calcified seaweeds on coral reefs: complex defenses, trophic
relationships, and value as habitats. Pp. 713-718. Proceedings of the Eighth
International Coral Reef Symposium.
Hay, M. E., Q. E. Kappel, and W. Fenical. 1994. Synergism in plant defenses against
herbivores: interactions of chemistry, calcification and plant quality. Ecology
75:1714-1726.
Hayashi, Y., and T. Motokawa. 1986. Effects of ionic environment on viscosity of catch
connective tissue in the Holothurian body wall. Journal of Experimental Biology
125:71-84.

191
Hillis, L. 1991. Recent calcified Halimedaceae. Pp. 167-188. In R. Riding, ed.
Calcareous algae and stromatolites. Springer-Verlag, Berlin.
Hillis-Colinvaux, L. 1980. Ecology and taxonomy of Halimeda: Primary producer of
coral reefs. Pp. 1-327. In J. H. S. Blaxter, F. S. Russell, and M. Yonge, eds.
Advances in Marine Biology 11.
Hine, A. C., Hallock P., M. W. Harris, H. T. Mullins, D. F. Belknap, and W. C. Jaap.
1988. Halimeda bioherms along an open seaway: Miskito Channel, Nicaraguan
Rise, SW Carribbean Sea. Coral Reefs 6:173-178.
Høeg, O. A. 1927. Preliminary note on a new Codiaceae from the Ordovician of Norway.
Avh Nors Vidensk Akad Oslo, Mat Naturviss 4:1-15.
Hudson, J. H. 1985. Growth rate and carbonate production in Halimeda opuntia:
Marquesas Keys, Florida. Pp. 257-263. In D. F. Toomey, and M. H. Nitecki, eds.
Paleoalgology. Springer-Verlag, Berlin.
James, N. P., J. L. Wray, and R. N. Ginsburg. 1988. Calcification of encrusting aragonitic
algae (Peyssonneliaceae): implications for the origin of Late Paleozoic reefs and
cements. Journal of Sedimentary Petrology 58(2):291-303.
Johnson, J. H. 1961. Limestone-building algae and algal limestones. Colorado School of
Mines.
Jux, U. 1966. Palaeoporella in Boda-Kalk von Dalarne. Palaeontographica 118:153-165.
Katz, A. 1973. The interaction of magnesium with calcite during crystal growth at 25-
90ºC and one atmosphere. Geochimica et Cosmochimica Acta 37:1563-1586.
Kauffman, E. G., and C. C. Johnson. 1988. The morphological and ecological evolution
of Middle and Upper Cretaceous reef-building rudistids. Palaios 3:194-216.

192
Kirkland, B. C., C. H. Moore, and J. A. D. Dickson. 1993. Well-preserved aragonitic
phylloid algae (Eugonophyllum, Udoteaceae) from the Pennsylvanian Holder
formation, Sacramento Mountains, NM. Palaios 8:111-120.
Kitano, Y., and N. Kanamori. 1966. Synthesis of magnesium calcites at low temperatures
and pressures. Journal of Geochemistry 1:1-11.
Kooistra, W. H. C. F. 2002. Molecular phylogenies of Udoteacea (Bryopsidales,
Chlorophyta) reveal nonmonophyly for Udotea, Penicillus and Chlorodemsis.
Phycologia 41(5):453-462.
Langdon, C., T. Takahashi, C. Sweeney, D. Chipman, J. Goddard, F. Marubini, H.
Aceves, H. Barnett, and M. J. Atkinson. 2000. Effect of calcium carbonate
saturation state on the calcification rate of an experimental coral reef. Global
Biogeochemical Cycles 14(2):639-654.
Lasemi, Z., and P. A. Sandberg. 2000. Linked cyclic changes in Phanerozoic ocean
atmosphere composition and original mineralogy of micritic limestones.
Geological Society of America Abstracts with Program 32:A68.
Lear, C. H., H. Elderfield, and P. A. Wilson. 2000. Cenozoic deep-sea temperatures and
global ice volumes from Mg/Ca in benthic foraminiferal calcite. Science 287:269-
272.
Leitmeier, H. 1910. Zur kenntnis der carbonate, die dimorphie des Kohlensauren Kalkes.
I. Teil. Neues Jahrbuch für Mineralogie, Heft 1:49-74.
Leitmeier, H. 1915. Zur kenntnis der carbonate. II. Teil. Neues Jahrbuch für Mineralogie,
Beilageband 40:655-700.
193
Lippman, F. 1960. Versuche zur Aufklarung der Bildungsbedingungen von Calcit und
Aragonit. Fortschritte der Mineralogie 38:156-161.
Littler, M. M. 1973. The population and community structure of Hawaiian fringing reef
crustose Corallinaceae. Journal of Experimental Marine Biology and Ecology
11:103-120.
Lorens, R. B., and M. L. Bender. 1980. The impact of solution chemistry on Mytilus
edulis calcite and aragonite. Geochimica et Cosmochimica Acta 44:1265-1278.
Lowenstam, H. A. 1955. Aragonite needles secreted by algae and some sedimentary
implications. Journal of Sedimentary Petrology 25:270-272.
Lowenstam, H. A., and S. Epstein. 1957. On the origin of sedimentary aragonite needles
of the Great Bahama Bank. Journal of Geology 65:364-375.
Lowenstein, T. K., L. A. Hardie, M. N. Timofeeff, and R. V. Demicco. 2003. Secular
variation in seawater chemistry and the origin of calcium chloride basinal brines.
Geology 31(10):857-860.
Lowenstein, T. K., M. N. Timofeeff, S. T. Brennan, L. A. Hardie, and R. V. Demicco.
2001. Oscillations in Phanerozoic seawater chemistry: evidence from fluid
inclusions. Science 294:1086-1088.
Macintyre, I. G. 1997. Reevaluating the role of crustose coralline algae in the
construction of coral reefs. Proceedings of the 8th International Coral Reef
Symposium 1:725-730.
Mackenzie, F. T., and J. D. Pigott. 1981. Tectonic controls of Phanerozoic sedimentary
rock cycling. Journal of the Geological Society of London 138:183-196.
194
Magdans, U., and H. Gies. 2004. Single crystal structure analysis of sea urchin spine
calcites: Systematic investigations of the Ca/Mg distribution as a function of
habitat of the sea urchin and the sample location in the spine. European Journal of
Mineralogy 16(2):261-268.
Mamet, B. 1991. Carbonifereous calcareous algae. Pp. 370-451. In R. Riding, ed.
Calcareous algae and stromatolites. Springer-Verlag, Berlin.
Mankiewicz, C. 1988. Occurrence and paleoecologic significance of Halimeda in late
Miocene reefs, southeastern Spain. Coral Reefs 6:271-279.
Marshall, J. F., and P. J. Davies. 1988. Halimeda bioherms of the Great Barrier Reef.
Coral Reefs 6:139-148.
Marubini, F., C. Ferrier-Pages, and J. P. Cuif. 2003. Suppression of skeletal growth in
scleractinian corals by decreasing ambient carbonate-ion concentration: a cross-
family comparison. Proceedings of the Royal Society of London Series B-
Biological Sciences 270(1511):179-184.
Matthews, R. K. 1966. Genesis of recent lime mud in southern British Honduras. Journal
of Sedimentary Petrology 36:428-454.
Milliken, K. L., and J. D. Pigott. 1977. Variation of oceanic Mg/Ca ratio through time
implication of the calcite sea. Geological Society of America Abstracts with
Program 9:64-65.
Milliman, J. D. 1974. Marine carbonates. Springer-Verlag, Berlin.
Milliman, J. D. 1977. Role of calcareous algae in Atlantic continental margin
sedimentation. Pp. 232-247. In E. Flugel, ed. Fossil algae. Springer-Verlag,
Berlin.
195
Milliman, J. D., M. Gastner, and J. Muller. 1971. Utilization of Magnesium in Coralline
Algae. Geological Society of America Bulletin 82(3):573-&.
Mitsuguchi, T., E. Matsumoto, O. Abe, T. Uchida, and P. J. Isdale. 1996. Mg/Ca
thermometry in coral skeletons. Science 274:961-963.
Montañez, I. P. 2002. Biological skeletal carbonate records changes in major-ion
chemistry of paleo-oceans. Proceedings of the National Academy of Sciences
99(25):15852-15854.
Morse, J. W., and M. L. Bender. 1990. Partition coefficients in calcite: examination of
factors influencing the validity of experimental results and their application to
natural systems. Chemical Geology 82:265-277.
Morse, J. W., Q. Wang, and M. Y. Tsio. 1997. Influences of temperature and Mg:Ca ratio
on CaCO3 precipitates from seawater. Geology 25:85-87.
Mu, X. 1991. Fossil Udoteaceae and Gymnocodiaceae. Pp. 146-166. In R. Riding, ed.
Calcareous algae and stromatolites. Springer-Verlag, Berlin.
Mucci, A., and J. W. Morse. 1983. The incorporation of Mg2+ and Sr2+ into calcite
overgrowths: influence of growth rate and solution composition. Geochimica et
Cosmochimica Acta 47:217-233.
Müller, G., G. Irion, and U. Förstner. 1972. Formation and diagenesis of inorganic Ca-
Mg carbonates in the lacustrine environment. Naturwissenschaften 59:158-164.
Multer, H. G. 1988. Growth rate, ultrastructure and sediment contribution of Halimeda
incrassata and Halimeda monile, Nonsuch and Falmouth Bays, Antiqua, W. I.
Coral Reefs 6:179-186.
196
Neumann, A. C., and L. S. Land. 1975. Lime mud deposition and calcareous algae in the
Bight of Abaco, Bahamas: A budget. Journal of Sedimentary Petrology 45:763-
786.
Okla, S. M. 1992. Permian algae and algal microfacies from Unayzah, Quassim District,
Saudi Arabia. Facies 27:217-224.
Orme, G. R., and M. S. Salama. 1988. Form and seismic stratigraphy of Halimeda banks
in part of the northern Great Barrier Reef Province. Coral Reefs 6:131-137.
Paasche, E. 1968. Biology and physiology of coccolithophorids. Annual Review of
Microbiology 22:77-86.
Paul, V. J., and K. L. Van Alstyne. 1988. Chemical defense and chemical variation in
some tropical Pacific species of Halimeda (Halimedaceae; Chlorophyta). Coral
Reefs 6:263-269.
Payri, C. E. 1988. Halimeda contribution to organic and inorganic production in a
Tahitian reef system. Coral Reefs 6:251-262.
Phipps, C. V. G., and H. H. Roberts. 1988. Seismic characteristics and accretion history
of Halimeda bioherms on Kalukalukuang Bank, eastern Java Sea (Indonesia).
Coral Reefs 6:149-159.
Railsback, L. B. 1993. Original Mineralogy of Carboniferous Worm Tubes - Evidence for
Changing Marine Chemistry and Biomineralization. Geology 21(8):703-706.
Reiskind, J. B., and G. Bowes. 1991. The role of phosphoenolpyruvate carboxykinase in
a marine macroalga with C4-like photosynthetic characteristics. Proceedings of
the National Academy of Sciences 88:2883-2887.

197
Reiskind, J. B., P. T. Seamon, and G. Bowes. 1988. Alternative methods of
photosynthetic carbon assimilation in marine macroalgae. Plant Physiology
87:686-692.
Reiskind, J. B., P. T. Seamon, and G. Bowes. 1989. Photosynthetic responses and
anatomical features of two marine macroalgae with different CO2 compensation
points. Aquatic Botany 33:71-86.
Riding, R., and L. Guo. 1991. Permian marine calcareous algae. Pp. 452-480. In R.
Riding, ed. Calcareous algae and stromatolites. Springer-Verlag, Berlin.
Ries, J. B. 2004. Effect of ambient Mg/Ca ratio on Mg fractionation in calcareous marine
invertebrates: A record of the oceanic Mg/Ca ratio over the Phanerozoic. Geology
32(11):981-984.
Ries, J. B. 2005. Aragonite production in calcite seas: effect of seawater Mg/Ca ratio on
the calcification and growth of the calcareous alga Penicillus capitatus.
Paleobiology:in press.
Ries, J. B., S. M. Stanley, and L. A. Hardie. 2004. Calcite seas and the scleractinian
hiatus: linking seawater Mg/Ca and coral biomineralization. Science:submitted.
Rimstidt, J. D., A. Balog, and J. Webb. 1998. Distribution of trace elements between
carbonate minerals and aqueous solutions. Geochimica et Cosmochimica Acta
62(11):1851-1863.
Roberts, H. H., P. Aharon, and C. V. Phipps. 1988. Morphology and sedimentology of
Halimeda bioherms from the eastern Java Sea (Indonesia). Coral Reefs 6:161-172.
Ronov, A. B. 1964. General tendencies in evolution of composition of earth crust, ocean
and atmosphere. Geochemistry International 8:715-743.

198
Roux, A. 1991. Ordovician algae and global tectonics. Pp. 335-348. In R. Riding, ed.
Calcareous algae and stromatolites. Springer-Verlag, Berlin.
Rushdi, A. I., R. M. Pytkowicz, E. Suess, and C. T. Chen. 1992. The effects of
magnesium to calcium ratios in artificial seawater, at different ionic products,
upon induction time, and the mineralogy of calcium carbonate: a laboratory study.
Geologische Rundschau 81:571-578.
Sandberg, P. A. 1975. New interpretations of Great Salt Lake ooids and of ancient
nonskeletal carbonate mineralogy. Sedimentology 22:497-538.
Sandberg, P. A. 1983. An oscillating trend in Phanerozoic nonskeletal carbonate
mineralogy. Nature 305:19-22.
Schlanger, S. O. 1957. Dolomite growth in coralline algae. Journal of Sedimentary
Petrology 27(2):181-186.
Scholle, P. A. 1978. American Association of Petroleum Geologists Memoirs. 27.
Schupp, P. J., and V. J. Paul. 1994. Calcium carbonate and secondary metabolites in
tropical seaweeds: variable effects on herbivorous fishes. Ecology 75(4):1172-
1185.
Scott, R. W. 1984. Evolution of Early Cretaceous reefs in the Gulf of Mexico.
Paleontographica America 54:406-412.
Segonzak, G. 1986. Aspects concernant les algues de type Halimeda (Chlorophycées),
actuelles et fossiles. Bulletin de la Societé de la Histoire Naturelle de Toulouse
122:125-129.
Siemann, M. G. 2003. Extensive and rapid changes in seawater chemistry during the
Phanerozoic: evidence from Br contents in basal halite. Terra Nova 15:243-248.

199
Sikes, C. S., R. D. Roer, and K. M. Wilbur. 1980. Photosynthesis and coccolith
formation: inorganic carbon sources and net inorganic reaction of deposition.
Limnology and Oceanography 25:248-261.
Spencer, R. J., and L. A. Hardie. 1990. Control of seawater composition by mixing of
river waters and mid-ocean ridge hydrothermal brines. Pp. 409-419. In R. J.
Spencer, and I.-M. Chou, eds. Fluid-Mineral Interactions: A tribute to H.P.
Eugster.
Spotte, S. H. 1979. Seawater Aquariums: The Captive Environment. Wiley and Sons,
New York.
Stanley, G. D., and C. A. McRoberts. 1993. A coral reef in the Telkwa Range, British
Columbia: the earliest Jurassic example. Canadian Journal of Earth Sciences
30:819-831.
Stanley, S. M., and L. A. Hardie. 1998. Secular oscillations in carbonate mineralogy of
reef-building and sediment-producing organisms driven by tectonically forced
shifts in seawater chemistry. Paleogeography, Paleoclimatology, Paleoecology
144:3-19.
Stanley, S. M., and L. A. Hardie. 1999. Hypercalcification: paleontology links plate
tectonics and geochemistry to sedimentology. GSA Today 9:2-7.
Stanley, S. M., J. B. Ries, and L. A. Hardie. 2002. Low-magnesium calcite produced by
coralline algae in seawater of Late Cretaceous composition. Proceedings of the
National Academy of Sciences 99(24):15323-15326.
Stanley, S. M., J. B. Ries, and L. A. Hardie. in preparation. The effect of ambient Mg/Ca
on the growth and calcification of the sediment-producing Halimeda alga.
200
Stanley, S. M., J. B. Ries, and L. A. Hardie. in press. Seawater chemistry,
coccolithophore population growth, and the origin of Cretaceous chalk. Geology.
Stanton, R. J., and E. Flügel. 1987. Paleoecology of Upper Triassic reefs in the northern
Calcareous Alps: reef communities. Facies 16:157-186.
Stockman, K. W., R. N. Ginsburg, and E. A. Shinn. 1967. The production of lime mud by
algae in south Florida. Journal of Sedimentary Petrology 37:633-648.
Swart, P. 1980. The effect of seawater chemistry on the growth of some scleractinian
corals. In P. Tardent, and R. Tardent, eds. Development and Cellular Biology of
Coelenterates. Elsevier, Amsterdam.
Van de Poel, H. M., and W. Schlager. 1994. Variations in Mesozoic-Cenozoic skeletal
carbonate mineralogy. Geologie en Mijnbouw 73:31-51.
Van den Hoek, C. 1981. Chlorophyta: morphology and classification. Pp. 86-132. In C.
S. Lobban, and M. J. Wynne, eds. The Biology of Seaweeds. University of
California Press, Berkeley.
Wainwright, S. A., W. D. Biggs, J. D. Currey, and J. M. Gosline. 1976. Mechanical
Design in Organisms. Edward Arnold, London.
Wefer, G. 1980. Carbonate production by algae Halimeda, Penicillus and Padina. Nature
285:323-324.
Wilkinson, B. H. 1979. Biomineralization, paleoceanography, and the evolution of
calcareous marine organisms. Geology 7:524-527.
Wilkinson, B. H., and T. J. Algeo. 1989. Sedimentary carbonate record of calcium-
magnesium cycling. American Journal of Science 289:1158-1194.
201
Wilkinson, B. H., and K. R. Given. 1986. Secular variation in abiotic marine carbonates:
Constraints on Phanerozoic atmospheric carbon dioxide contents and oceanic
Mg/Ca ratios. Journal of Geology 94:321-333.
Wolfe, J. A. 1978. A paleobotanical interpretation of Tertiary climates in the Northern
Hemisphere. Pp. 129-138. In B. J. Skinner, ed. Paleontology and
Paleoenvironments. William Kaufmann, Inc., Los Altos, CA.
Wray, J. L. 1964. Archaeolithophyllum, an abundant calcareous alga in limestones of the
Lansing Group (Pennsylvanian), southeastern Kansas. Kansas Geological Survey
Bulletin 170(1):1-13.
Wray, J. L. 1977. Calcareous algae. Elsevier, Amsterdam.
Zechman, F. W., E. C. Theriot, E. A. Zimmer, and R. L. Chapman. 1990. Phylogeny of
the Ulvophyceae (Chlorophyta): Cladistic analysis of nuclear encoded rRNA
sequence data. Journal of Phycology 26:700-710.
202
Justin B. Ries Curriculum Vita
PERSONAL Born 11 August 1976. Baltimore, Maryland, USA.
EDUCATION Ph.D. 2005 Geobiology The Johns Hopkins University M.A. 2002 Geobiology The Johns Hopkins University B.A. 1998 (GPA 3.87) Geosciences Franklin and Marshall College Magna cum Laude Study abroad 1996 Geosciences Edinburgh University High school 1994 Liberal Arts The Friends School of Baltimore
ACADEMIC POSITIONS 2005-present: Postdoctoral Fellow, The Johns Hopkins University 2004-present: Teaching Fellow, The Johns Hopkins University. 2000-2004: Teaching Assistant, The Johns Hopkins University. 1999: Instructor, Northland Preparatory Academy, Flagstaff, Arizona.
TEACHING EXPERIENCE Primary Instructor: Teaching Assistant:Tropical Marine Ecology (2005) Population Ecology (2004 & 2001) JHU Departmental Field Trip to Maine (2004) Global Change and Human Health (2004) Earth System History Lab (2003 & 2002) Guided Tour of the Planets (2003)
AWARDS AND HONORS2004 – 2005 Howard Hughes Teaching Fellowship 2003, 2001 J. Brien Key Award 2002 Sigma Xi Award 1998 Phi Beta Kappa Honor Society 1998 Nancy Juerges Geomorphology Award 1994 - 1998 Franklin and Marshall College Honors List 1994 - 1998 John Marshall Scholar 1996 - 1997 Dana Scholar 1996 Skull and Crown Honor Society
CURRENT PROFESSIONAL APPOINTMENTS 2002-2005 Johns Hopkins University Diving Safety Control Board
PUBLICATIONS (2002 – 2005) Ries, J.B. 2005. Aragonite production in calcite seas: effect of seawater Mg/Ca ratio on the calcification and growth of the calcareous alga Penicillus capitatus. Paleobiology, in press.
203
Stanley, S.M., J.B. Ries, and L.A. Hardie. 2005. Seawater chemistry, coccolithophore population growth, and the origin of Cretaceous chalk. Geology, in press.
Ries, J.B. 2004. The effect of ambient Mg/Ca on Mg fractionation in calcareous marine invertebrates: A record of Phanerozoic Mg/Ca in seawater. Geology, 32(11):981-984.
Stanley, S.M., J.B. Ries, and L.A. Hardie. 2002. Low-magnesium calcite produced by coralline algae in seawater of Late Cretaceous composition. Proceedings of the National Academy of Sciences 99(24):15323-15326.
PUBLISHED ABSTRACTS (1997 – 2005) Ries, J.B. 2004. Aragonite production in calcite seas: effect of seawater Mg/Ca ratio on the calcification and growth of the calcareous algae Penicillus, Halimeda and Udotea. Eos Transactions AGU, 85(47), Fall Meet. Suppl., Abstract PP34A-02.
Ries, J.B. 2004. Modern scleractinian corals produce calcite in experimental Mid-Paleozoic/Cretaceous seawater. Geological Society of America Abstracts with Program, 36(5):544.
Stanley, S.M., J.B. Ries, and L.A. Hardie. 2004. How an increase in the Mg/Ca ratio of seawater after the Cretaceous depressed chalk production and caused some coccolithophores to secrete high-Mg calcite. Geological Society of America Abstracts with Program, 36(5):96.
Ries, J.B. 2004. Marine animals that secrete high-Mg calcite in modern seas produce low-Mg calcite in seawater of mid-Cretaceous composition. Ecological Society of America Mid-Atlantic Chapter Meeting 1:2.
Ries, J.B. 2003. Modern high-magnesium calcite organisms produce low-magnesium calcite in experimental mid-Cretaceous seawater. Geological Society of America Abstracts with Program 34(7):204-205.
Stanley, S.M., J.B. Ries, and L.A. Hardie. 2002. Production of low-magnesium calcite by three species of coralline algae grown in artificial seawater with the magnesium/calcium ratio of Late Cretaceous seas. Geological Society of America Abstracts with Program 34(6):167.
Ries, J.B., D. Merritts, D.J. Harbor, T. Gardner, P.A. Erickson and M. Carlson. 1998. Increased rates of fluvial bedrock incision in the Central Appalachian Mountains, Virginia. Geological Society of America Abstracts with Program 30(7):140.
Ries, J.B. 1998. Modes and rates of fluvial bedrock incision in the Valley and Ridge Province, southwestern Virginia. Keck Research Symposium in Geology 11:254-257.
Monteleone, B. and J.B. Ries. 1997. The Hydrology and geochemistry of the Cougar Creek watershed, McCall, Idaho. Keck Research Symposium in Geology 10:41-44.
204
POPULAR PRESS “Sea change had major effect on coral reefs: Ocean chemistry led to death, rebound, JHU student finds” by Dennis O’Brien. The Baltimore Sun, November 26, 2004.
RESEARCH ADVISORS Steven M. Stanley, The Johns Hopkins University: Ph.D. co-advisor 2000-2005 Lawrence A. Hardie, The Johns Hopkins University: Ph.D. co-advisor 2000-2005 Dorothy J. Merritts, Franklin and Marshall College: Undergraduate thesis advisor 1997-1998
PROFESSIONAL SOCIETIESGeological Society of America American Geophysical Union Paleontological Society Geochemical Society American Association of Petroleum Geologists Ecological Society of America American Association for the Advancement of Science
RECENT RESEARCH GRANTS NATIONAL SCIENCE FOUNDATION – Geobiology (2004-2006) $86,705 “Experiments and Observations Based on the Finding that Scleractinian Corals Secrete Calcite Instead of Aragonite in Cretaceous Seawater” (postdoctoral researcher listed on grant)
PETROLEUM RESEARCH FUND – Geobiology (2002-2004) $80,000 “Experiments and Observations on the Relationships between Seawater Chemistry and the Mineralogy of Reef-Building and Chalk-Producing Organisms” (graduate student listed on grant)
NATIONAL SCIENCE FOUNDATION – Geobiology (2002) $21,000 “Experiments on the Effects of the Magnesium-Calcium ratio of Seawater on Carbonate Skeletal Secretion” (graduate student listed on grant)
DAVID ELLIOT FUND FOR RESEARCH – Geobiology (2004-2005) “Effect of Seawater Mg/Ca on Calcareous Biomineralization” $10,000
GLASSMANN GRANT FOR FIELD RESEARCH – Geobiology (2001-2004) $12,000 “Effect of Oceanic Mg/Ca on Paleozoic Reef-Building Organisms”
NASA DELAWARE SPACE GRANT – Geosciences (1996-1998) $15,000