Experiments in-materials-science-and-engineering sneak-preview
21
Experiments in Materials Science and Engineering by Tariq A. Khraishi and Marwan S. Al-Haik Included in this preview: • Copyright Page • Table of Contents • Excerpt of Chapter 1, 2 and 3 For additional information on adopting this book for your class, please contact us at 800.200.3908 x501 or via e-mail at [email protected]
-
Upload
ravenna-barros -
Category
Engineering
-
view
174 -
download
0
Transcript of Experiments in-materials-science-and-engineering sneak-preview

Experiments in Materials Science and Engineering
by Tariq A. Khraishi and Marwan S. Al-Haik
Included in this preview:
• Copyright Page• Table of Contents• Excerpt of Chapter 1, 2 and 3
For additional information on adopting this book for your class, please contact us at 800.200.3908 x501 or via e-mail at [email protected]
EXPERIMENTS IN MATERIALS SCIENCE AND ENGINEERING
Tariq A. Khraishi and Marwan S. Al-Haik
Copyright © 2011 University Readers Inc. All rights reserved. No part of this publication may be reprinted, reproduced, transmitted, or utilized in any form or by any electronic, mechanical, or other means, now known or hereafter invented, including photocopying, microfi lming, and recording, or in any information retrieval system without the written permission of University Readers, Inc.
First published in the United States of America in 2011 by University Readers, Inc.
Trademark Notice: Product or corporate names may be trademarks or registered trademarks, and are used only for identifi cation and explanation without intent to infringe.
15 14 13 12 11 1 2 3 4 5
Printed in the United States of America
ISBN: 978-1-60927-868-7

DEDICATION
I dedicate this book to my wife and children who had to put up with a lot of my days and nights away from them, including many weekends, so that I could generate this book. I also dedicate it to my parents who spent a lot of their resources on getting me through my university studies.
T. Khraishi
To the memory of my two colleagues, Kevin Granata and Liviu Librescu, who sacrifi ced their own lives protecting the students of Virginia Tech on April 17, 2007. Although I will never get to meet them, they have already taught me a lot and for this I humbly dedicate this book to their memory.
M. Al-Haik
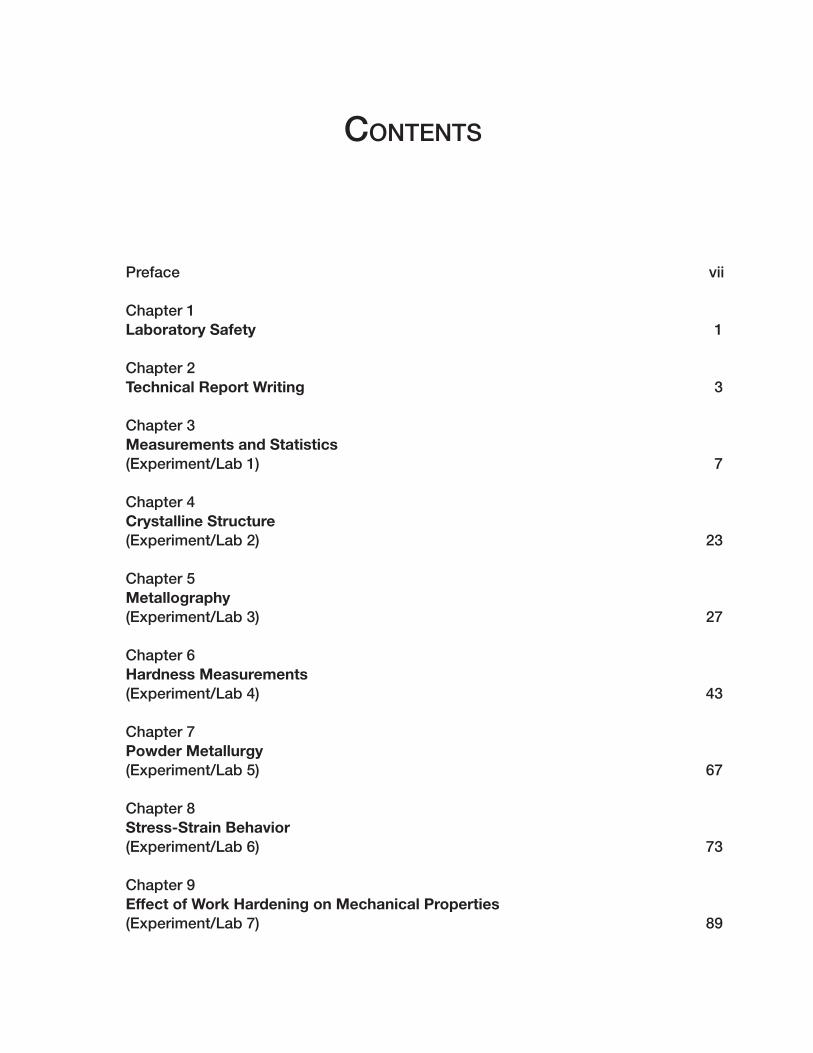
CONTENTS
Preface vii
Chapter 1Laboratory Safety 1
Chapter 2Technical Report Writing 3
Chapter 3Measurements and Statistics (Experiment/Lab 1) 7
Chapter 4Crystalline Structure(Experiment/Lab 2) 23
Chapter 5Metallography (Experiment/Lab 3) 27
Chapter 6Hardness Measurements(Experiment/Lab 4) 43
Chapter 7Powder Metallurgy (Experiment/Lab 5) 67
Chapter 8Stress-Strain Behavior (Experiment/Lab 6) 73
Chapter 9Effect of Work Hardening on Mechanical Properties(Experiment/Lab 7) 89
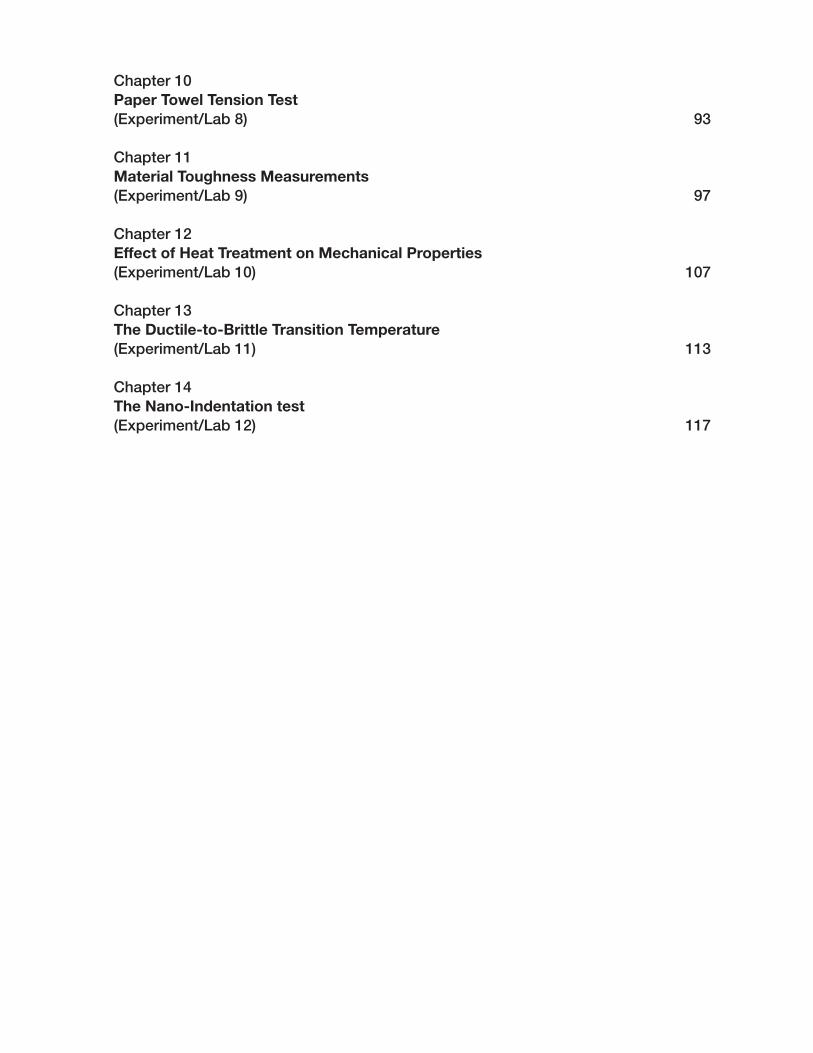
Chapter 10Paper Towel Tension Test (Experiment/Lab 8) 93
Chapter 11Material Toughness Measurements (Experiment/Lab 9) 97
Chapter 12Effect of Heat Treatment on Mechanical Properties (Experiment/Lab 10) 107
Chapter 13The Ductile-to-Brittle Transition Temperature (Experiment/Lab 11) 113
Chapter 14The Nano-Indentation test (Experiment/Lab 12) 117
PREFACE
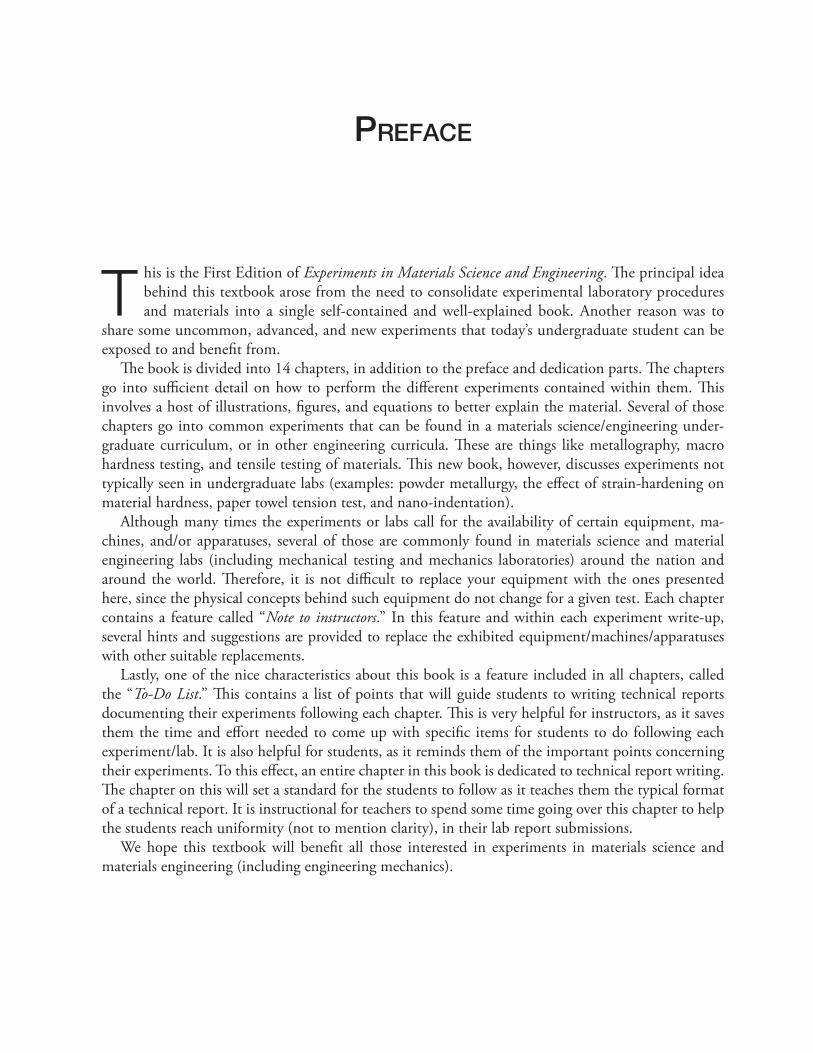
This is the First Edition of Experiments in Materials Science and Engineering. Th e principal idea behind this textbook arose from the need to consolidate experimental laboratory procedures and materials into a single self-contained and well-explained book. Another reason was to
share some uncommon, advanced, and new experiments that today’s undergraduate student can be exposed to and benefi t from.
Th e book is divided into 14 chapters, in addition to the preface and dedication parts. Th e chapters go into suffi cient detail on how to perform the diff erent experiments contained within them. Th is involves a host of illustrations, fi gures, and equations to better explain the material. Several of those chapters go into common experiments that can be found in a materials science/engineering under-graduate curriculum, or in other engineering curricula. Th ese are things like metallography, macro hardness testing, and tensile testing of materials. Th is new book, however, discusses experiments not typically seen in undergraduate labs (examples: powder metallurgy, the eff ect of strain-hardening on material hardness, paper towel tension test, and nano-indentation).
Although many times the experiments or labs call for the availability of certain equipment, ma-chines, and/or apparatuses, several of those are commonly found in materials science and material engineering labs (including mechanical testing and mechanics laboratories) around the nation and around the world. Th erefore, it is not diffi cult to replace your equipment with the ones presented here, since the physical concepts behind such equipment do not change for a given test. Each chapter contains a feature called “Note to instructors.” In this feature and within each experiment write-up, several hints and suggestions are provided to replace the exhibited equipment/machines/apparatuses with other suitable replacements.
Lastly, one of the nice characteristics about this book is a feature included in all chapters, called the “To-Do List.” Th is contains a list of points that will guide students to writing technical reports documenting their experiments following each chapter. Th is is very helpful for instructors, as it saves them the time and eff ort needed to come up with specifi c items for students to do following each experiment/lab. It is also helpful for students, as it reminds them of the important points concerning their experiments. To this eff ect, an entire chapter in this book is dedicated to technical report writing. Th e chapter on this will set a standard for the students to follow as it teaches them the typical format of a technical report. It is instructional for teachers to spend some time going over this chapter to help the students reach uniformity (not to mention clarity), in their lab report submissions.
We hope this textbook will benefi t all those interested in experiments in materials science and materials engineering (including engineering mechanics).

CHAPTER 1
LABORATORY SAFETY
The following are a set of safety rules that are commonly practiced in materials science and engineering labs:
1. Safety glasses/goggles must be worn in all labs when any experiments are running (especially those in-volving chemical substances and fl ying/moving objects). Standard or average safety glasses/goggles are adequate for most procedures. However side shields may be necessary for some operations.
2. Rubber gloves should be worn when dealing with any chemical. Also, furnace-rated gloves should be worn when dealing with furnaces.
3. Fume facemasks should be worn when dealing with chemicals.4. Identify the eye wash areas and lab/building exits closest to you from day one in the lab.5. Material safety data sheets are available in the lab in case you need to review them.6. Closed-toe shoes are required at all times in the lab (i.e., no sandals or fl ip-fl ops).7. Long pants or long skirts are required in the lab at all times.8. No tank tops or tube tops are allowed in the lab. Th e torso and shoulders must be covered by a shirt, or
lab coat. Also very loose sleeves must be rolled above the elbow or restricted so that they cannot become tangled in equipment.
9. Long hair must be tied back while operating machinery.10. Unsafe behavior including improper use of equipment will not be tolerated.11. No food or drinks are allowed in the laboratory at any time.12. Th e laboratory must be kept clean at all times.13. Bring your textbook to each lab to reference learning material in case there is a need.

2 Experiments in Materials Science and Engineering
14. Bring yourself to each lab. Attendance is a must by every student and absence will negatively impact your lab grade unless it is excused absence for extenuating circumstance. Moreover, you have to attend on time at the beginning of a lab. Do not come late to labs.
15. Always follow instructions from the lab instructor(s).16. Failure to abide by these rules will result in loss of laboratory privileges. Th e instructors may ask anyone
to leave at any time for failure to abide by these rules.
Note to instructors: You can augment or edit the above rules in any way that is most suitable for your lab/class situation.
CHAPTER 2
TECHNICAL REPORT WRITING
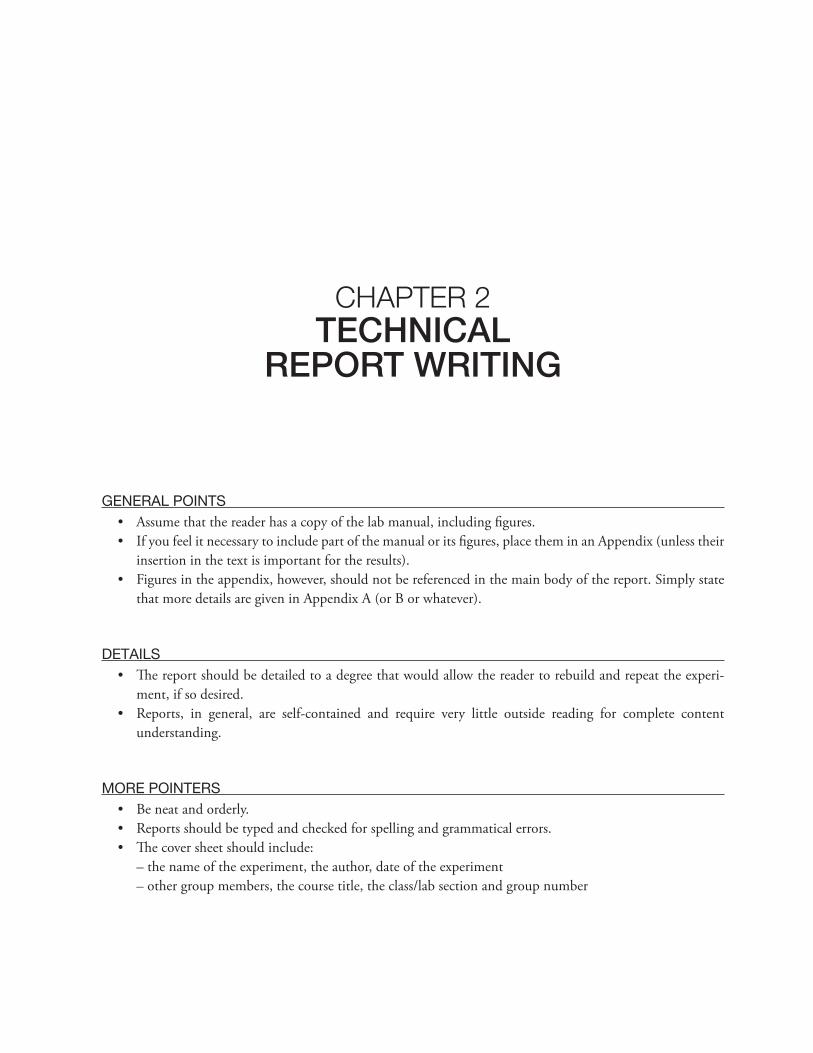
GENERAL POINTS
• Assume that the reader has a copy of the lab manual, including fi gures.• If you feel it necessary to include part of the manual or its fi gures, place them in an Appendix (unless their
insertion in the text is important for the results).• Figures in the appendix, however, should not be referenced in the main body of the report. Simply state
that more details are given in Appendix A (or B or whatever).
DETAILS
• Th e report should be detailed to a degree that would allow the reader to rebuild and repeat the experi-ment, if so desired.
• Reports, in general, are self-contained and require very little outside reading for complete content understanding.
MORE POINTERS
• Be neat and orderly.• Reports should be typed and checked for spelling and grammatical errors.• Th e cover sheet should include:
– the name of the experiment, the author, date of the experiment– other group members, the course title, the class/lab section and group number

4 Experiments in Materials Science and Engineering
ORGANIZATION, ETC
• Clearly separate the diff erent sections, using appropriate headings, numbered in accordance with their appearance in the contents page.
• Th e report shall have a contents page, with each of the sections numbered and listed by page number.• Th e main body of the report begins with the Abstract.• Put the page number (i.e., 1) at the bottom center, halfway up the bottom margin of the Abstract (fi rst
page). Th e Title page and the Table of Contents page are not numbered.• Th e appendices each begin on a new page, numbered with a capital letter, a dash, and an Arabic number
(i.e., A-1, B-3, etc.). • All fi gures, including graphs, shall be labeled with a Figure # and a caption.• All fi gures and tables shall be referenced in the body of the report.• Do not submit glued, taped, or stapled fi gures on the fi nal report. If need be, photocopy the entire page.
Better yet, make a scanned image of the fi gure and insert into the text. Acknowledge the source of such data.
LANGUAGE POINTERS
• Always avoid using the fi rst and second person (I, we, you, etc.). Th e third person is appropriate. For example, instead of “We tested steel in uniaxial tension,” say “Steel was tested in uniaxial tension.”
• Use the past tense at all times unless it’s truly awkward. Th e present tense is acceptable for facts that are generally true.
• For example, it is appropriate to say that “steel is widely used in structural applications because it is both strong and ductile.” But when discussing your results, you must use past tense: “the steel tested was found to be both strong and ductile.”
REPORT CONTENT
• Abstract• 1.0 Introduction• 2.0 Experimental Apparatus and Methods• 3.0 Results• 4.0 Discussion• 5.0 Conclusions• 6.0 To-Do List• References• Appendices
ABSTRACT
• Summarize what was done and what was found in an experiment.• Th e abstract should be brief, often only one paragraph, but should highlight all of the relevant information.• Its heading is centered at the top of the fi rst page

Technical Report Writing 5
INTRODUCTION
• Any generally accepted equation or fact that is used in the Discussion section to explain your results. • Summarize the important theoretical assumptions and present the governing equations with some expla-
nation of their origins (a derivation may be appropriate in some cases). • Th eorems which are central to the purpose of the experiment or to the fi nal evaluation of the data. • Present these theorems in their mathematical forms and defi ne all symbols used. • All equations should be written on a line of their own with an equation number as is done throughout
this manual. • It is sometimes customary to include a Nomenclature section before the Introduction.
Th e following is a list of DO NOT INCLUDES in the Introduction:• Details of the experiment. • Th eory or equation that is not used in the Discussion section. • Th e lab manual.• Paraphrasing of the lab manual is also not acceptable.
EXPERIMENTAL APPARATUS AND METHODS
• Focus on what was actually performed during the experiment. • Briefl y note the important details of the physical set-up of the experiment and the experimental procedure
that was followed.• Describe any particularly important details, such as how and under what conditions the data was collected. • Especially note any changes or adjustments which were necessary for satisfactory completion of the
experiment. • Generally, the fewer words, the better. • Do not give the step-by-step details.
RESULTS
• In the form of graphs or tables.• All graphs and tables should be explained but not discussed. • Simply state what the graphs and tables are and leave the deductions and relation to theory to the
Discussion section.• All entries must have units. It is best to put the units in the column where the result is identifi ed. • Tables and graphs must be labeled, numbered, and given a title.
DISCUSSION
• Fully discuss the results in light of the background information and theory discussed in theintroduction.– Are your results what you expected?– Are they consistent with what was discussed the Introduction?– Compare the data to all the theory discussed in the Introduction– No new theory should be introduced in the Discussion section

6 Experiments in Materials Science and Engineering
• Explain:– Any good or bad results– Any strengths and weaknesses of the experimental and computational procedures– general purpose of the lab and suggestions as to possible applications of the results or further investigations
• Give Sample Calculations for data listed in tables• Th ese are your individual comments and should refl ect any original thoughts or additional results that
were obtained• Do not answer the questions in the lab manuals as part of the Discussion. Th ey should be answered in
their own section, after the Conclusions • Keep in mind that the questions in the lab manual usually do not represent a complete discussion of your
data• Error analyses:
– Any explanations for the error and suggestions for decreasing the error should be discussed in the Discussion section– Th e detailed calculations of the error analysis need not be discussed in the main body of the report but instead belong in a separate appendix
• If there are very few results or a lot of results it is appropriate to combine the Results and Discussion sections into a section headed Results and Discussion.
• Th en you can present your data, state what equation was used to calculate it, and compare it to theory all in one section.
CONCLUSIONS
• A brief summary of the important results and a brief emphasis of the important points of the Discussion. • No new information or ideas.• Summarize what you found and what conclusions you drew from it.• Th ese conclusions should already have been discussed in the Discussion section so only state them here.
REFERENCES
• Th e literature, to which direct reference was made in the report, shall be placed here.• Paraphrasing and direct quotes are to be noted by raised numbers or numbers enclosed in brackets in the
report. Another common style for referencing includes the use of the fi rst author’s (also called the lead author) last name followed by the year of publication of the reference. Such a referencing style can be used instead of the numbering system but they both can’t be used together.
• For the numbering system, placement of the literary references shall be in the sequential order of their appearance in the body of the report. For the other system utilizing the last name, references should be listed (i.e., sorted) alphabetically.
Note to instructors: You can augment or edit the above guides or pointers in any way that is most suitable for your lab/class situation. It is also important to determine to the students up front which style of referencing is to be used in their reports.
CHAPTER 3
MEASUREMENTS AND STATISTICS
(EXPERIMENT/LAB 1)
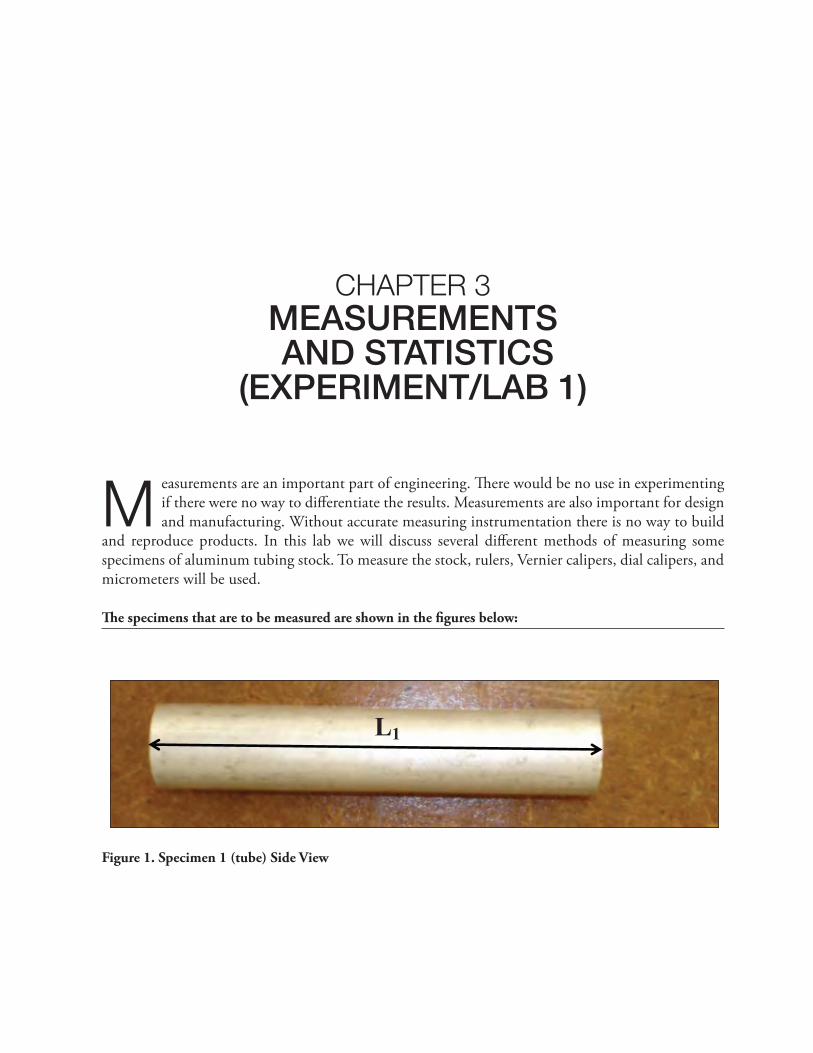
Measurements are an important part of engineering. Th ere would be no use in experimenting if there were no way to diff erentiate the results. Measurements are also important for design and manufacturing. Without accurate measuring instrumentation there is no way to build
and reproduce products. In this lab we will discuss several diff erent methods of measuring some specimens of aluminum tubing stock. To measure the stock, rulers, Vernier calipers, dial calipers, and micrometers will be used.
Th e specimens that are to be measured are shown in the fi gures below:
Figure 1. Specimen 1 (tube) Side View
L1
8 Experiments in Materials Science and Engineering
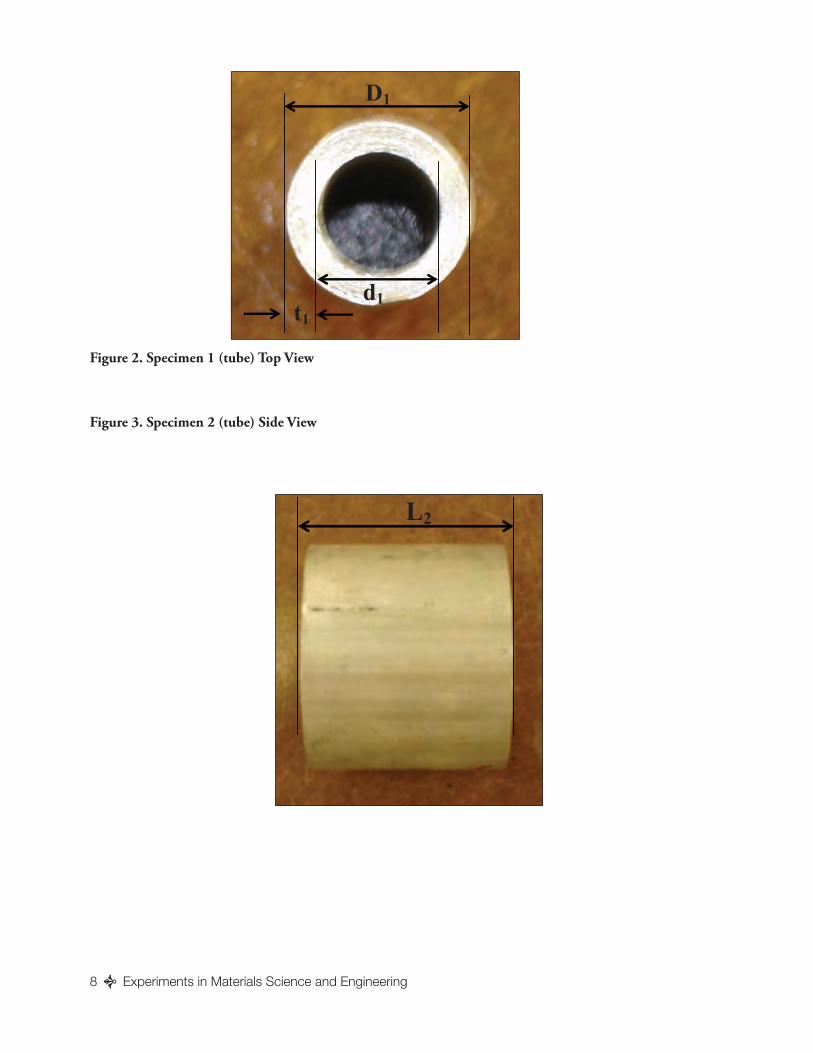
Figure 2. Specimen 1 (tube) Top View
Figure 3. Specimen 2 (tube) Side View
D1
d1 t1
L2
Measurements and Statistics 9
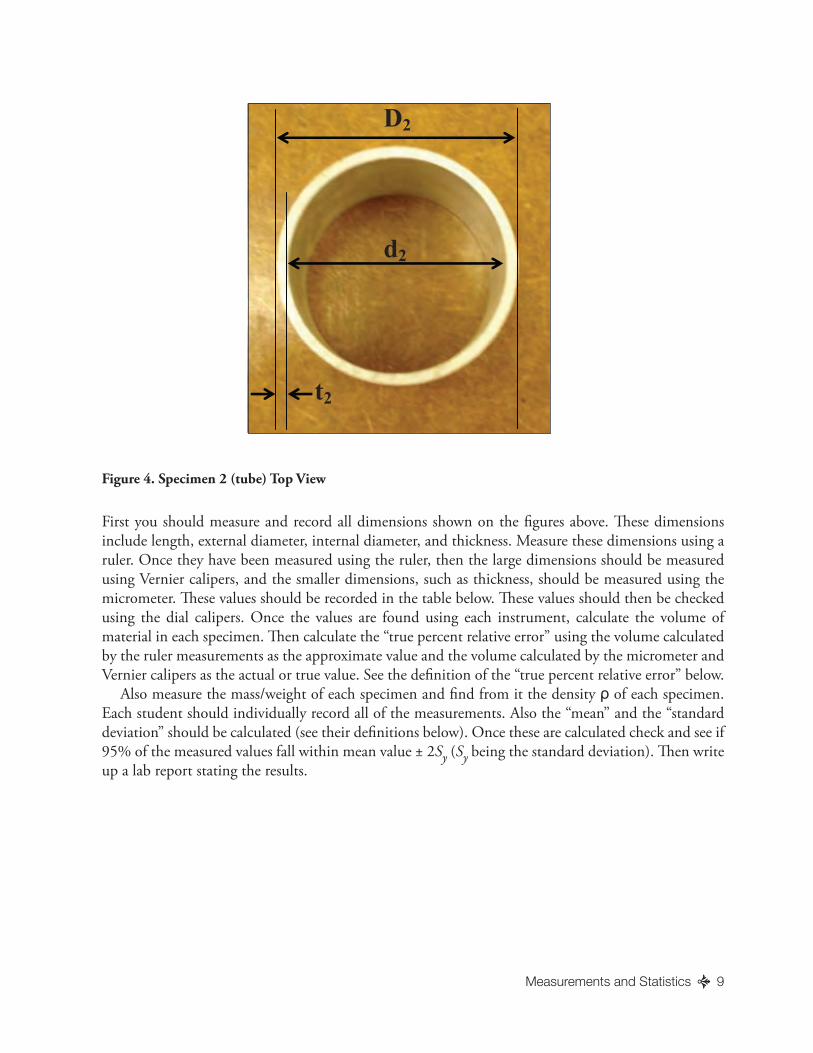
Figure 4. Specimen 2 (tube) Top View
First you should measure and record all dimensions shown on the fi gures above. Th ese dimensions include length, external diameter, internal diameter, and thickness. Measure these dimensions using a ruler. Once they have been measured using the ruler, then the large dimensions should be measured using Vernier calipers, and the smaller dimensions, such as thickness, should be measured using the micrometer. Th ese values should be recorded in the table below. Th ese values should then be checked using the dial calipers. Once the values are found using each instrument, calculate the volume of material in each specimen. Th en calculate the “true percent relative error” using the volume calculated by the ruler measurements as the approximate value and the volume calculated by the micrometer and Vernier calipers as the actual or true value. See the defi nition of the “true percent relative error” below.
Also measure the mass/weight of each specimen and fi nd from it the density ρ of each specimen. Each student should individually record all of the measurements. Also the “mean” and the “standard deviation” should be calculated (see their defi nitions below). Once these are calculated check and see if 95% of the measured values fall within mean value ± 2Sy (Sy being the standard deviation). Th en write up a lab report stating the results.
D2
d2
t2
10 Experiments in Materials Science and Engineering
Using a Ruler:
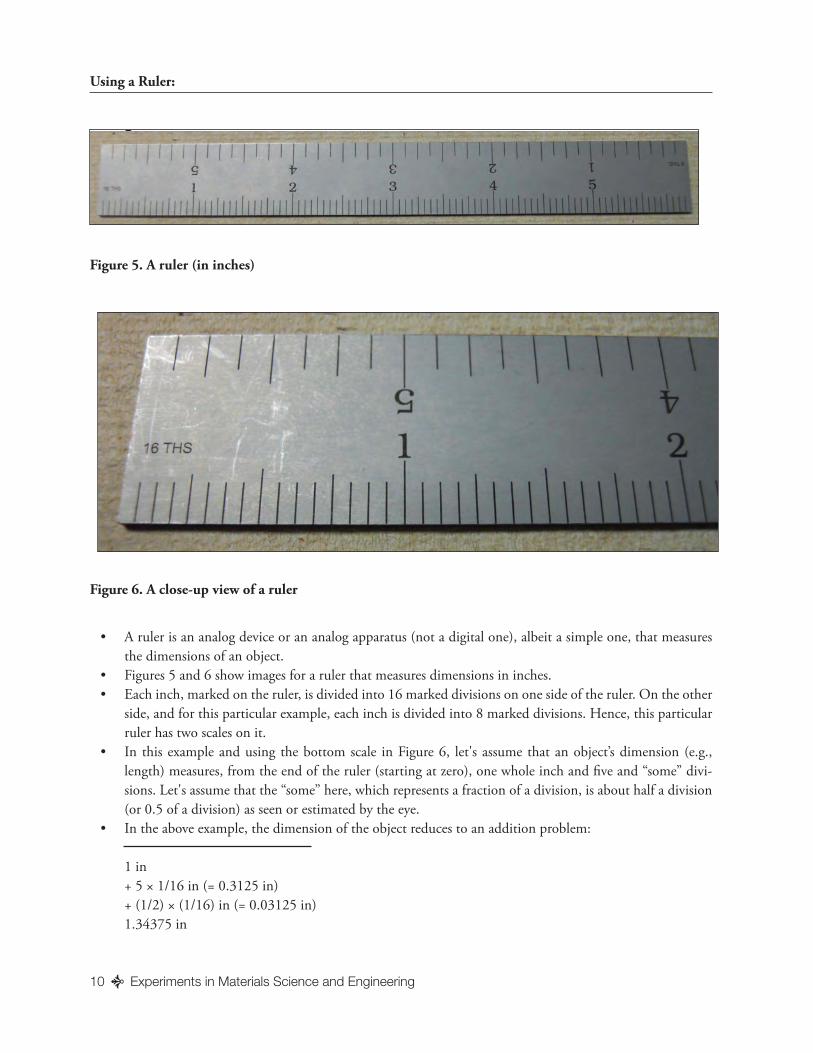
Figure 5. A ruler (in inches)
Figure 6. A close-up view of a ruler
• A ruler is an analog device or an analog apparatus (not a digital one), albeit a simple one, that measures the dimensions of an object.
• Figures 5 and 6 show images for a ruler that measures dimensions in inches.• Each inch, marked on the ruler, is divided into 16 marked divisions on one side of the ruler. On the other
side, and for this particular example, each inch is divided into 8 marked divisions. Hence, this particular ruler has two scales on it.
• In this example and using the bottom scale in Figure 6, let's assume that an object’s dimension (e.g., length) measures, from the end of the ruler (starting at zero), one whole inch and fi ve and “some” divi-sions. Let's assume that the “some” here, which represents a fraction of a division, is about half a division (or 0.5 of a division) as seen or estimated by the eye.
• In the above example, the dimension of the object reduces to an addition problem:
1 in+ 5 × 1/16 in (= 0.3125 in)+ (1/2) × (1/16) in (= 0.03125 in)1.34375 in
g
Measurements and Statistics 11
• Note in the above numeric example that the fi rst line of addition (i.e., the 1 in) was a certain quantity or known for sure. Th e same applies to the second line of addition (i.e., to the 0.3125 in). Th erefore, there are four digits after the dot (in the 1.3125 in measurement) that are signifi cant digits (i.e., their inclusion is both important and meaningful).
• Th e third line, however, was an estimate albeit a good estimate (done with our own analog measuring tool: the eye). Including the last line in the addition process produces a fi fth digit after the dot in 1.34375 and actually alters the last three digits in the original 1.3125 number.
• In other words, the last four digits (from the right) in the 1.34375 measurement are not certain. From the point of view of writing decimal numbers, one would instead write this measurement as 1.34 inches (instead of 1.34375 in). Th e second digit in 1.34 after the dot (i.e., the “4”) is also termed a signifi cant digit although its exact quantifi cation is uncertain. Although its exact quantifi cation will depend on who did the eyeballing, most people will estimate the fraction to be 0.5 of one sixteenth of an inch leading to the “4” in the second digit after the dot for the 1.34 dimension measurement here.
• Th erefore in this problem there are three signifi cant digits in the 1.34 in measurement and specifi cally two signifi cant digits after the dot. Trying to fi gure out what digit comes after the “4” here is extreme speculation and has no signifi cance using this measuring tool. In fact, adding any other digit after the “4” would cause that digit to be called an “insignifi cant” digit as this would be tantamount to an estimation process over an already estimated process involving the second digit after the dot.
• In conclusion thus, the number of signifi cant digits after the dot are governed by the last digit that can be reasonably estimated.
• Although the above example dealt with inches (which are part of the US Customary Units), it is equally applicable to SI units (e.g., meter/m, centimeter/cm or millimeter/mm).
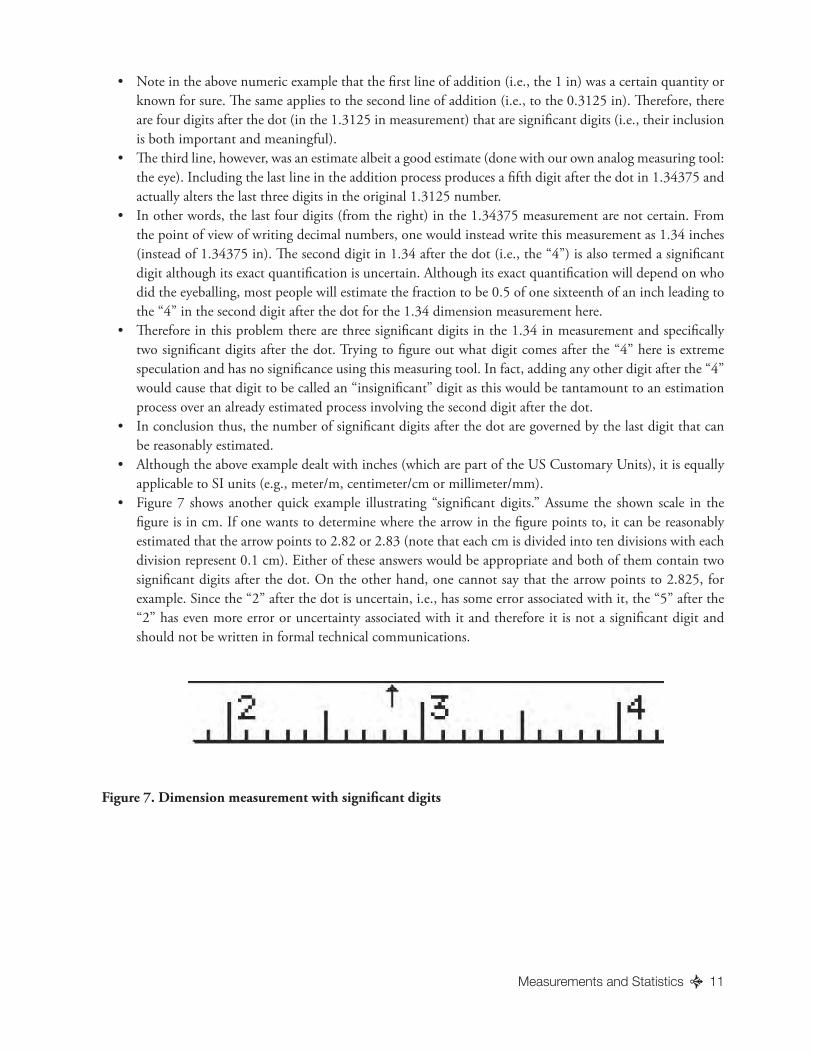
• Figure 7 shows another quick example illustrating “signifi cant digits.” Assume the shown scale in the fi gure is in cm. If one wants to determine where the arrow in the fi gure points to, it can be reasonably estimated that the arrow points to 2.82 or 2.83 (note that each cm is divided into ten divisions with each division represent 0.1 cm). Either of these answers would be appropriate and both of them contain two signifi cant digits after the dot. On the other hand, one cannot say that the arrow points to 2.825, for example. Since the “2” after the dot is uncertain, i.e., has some error associated with it, the “5” after the “2” has even more error or uncertainty associated with it and therefore it is not a signifi cant digit and should not be written in formal technical communications.
Figure 7. Dimension measurement with signifi cant digits
12 Experiments in Materials Science and Engineering
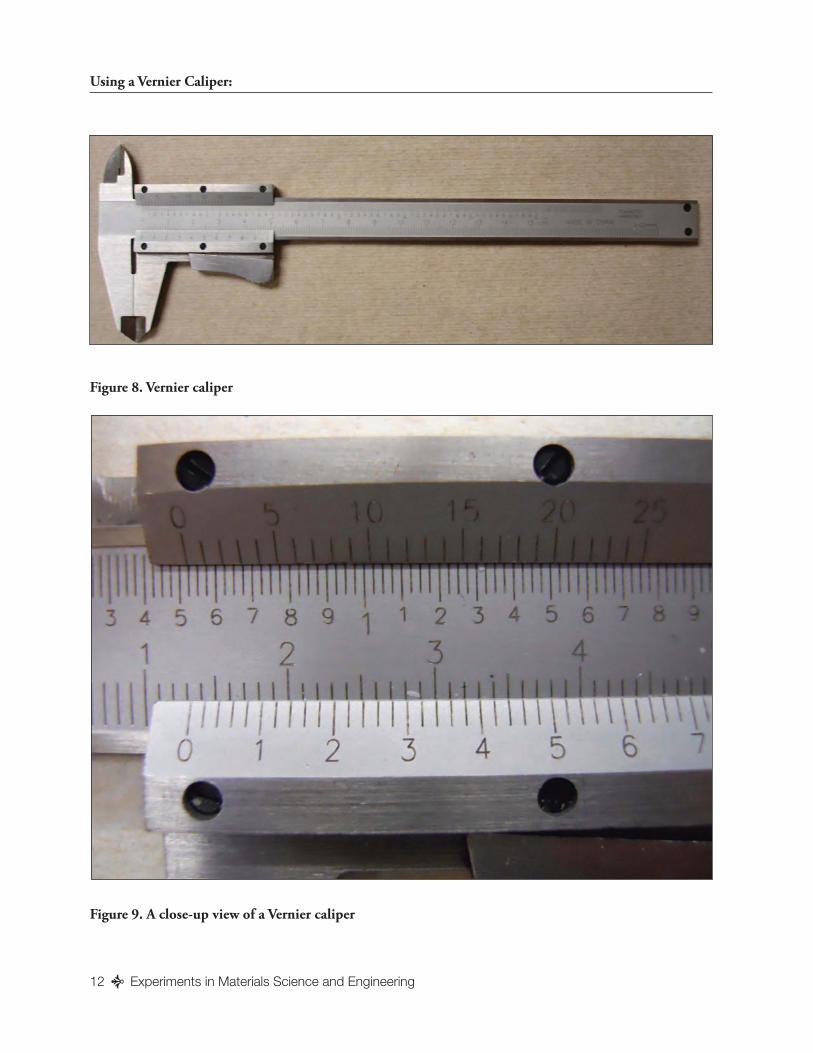
Figure 9. A close-up view of a Vernier caliper
Using a Vernier Caliper:
Figure 8. Vernier caliper
g p
Measurements and Statistics 13
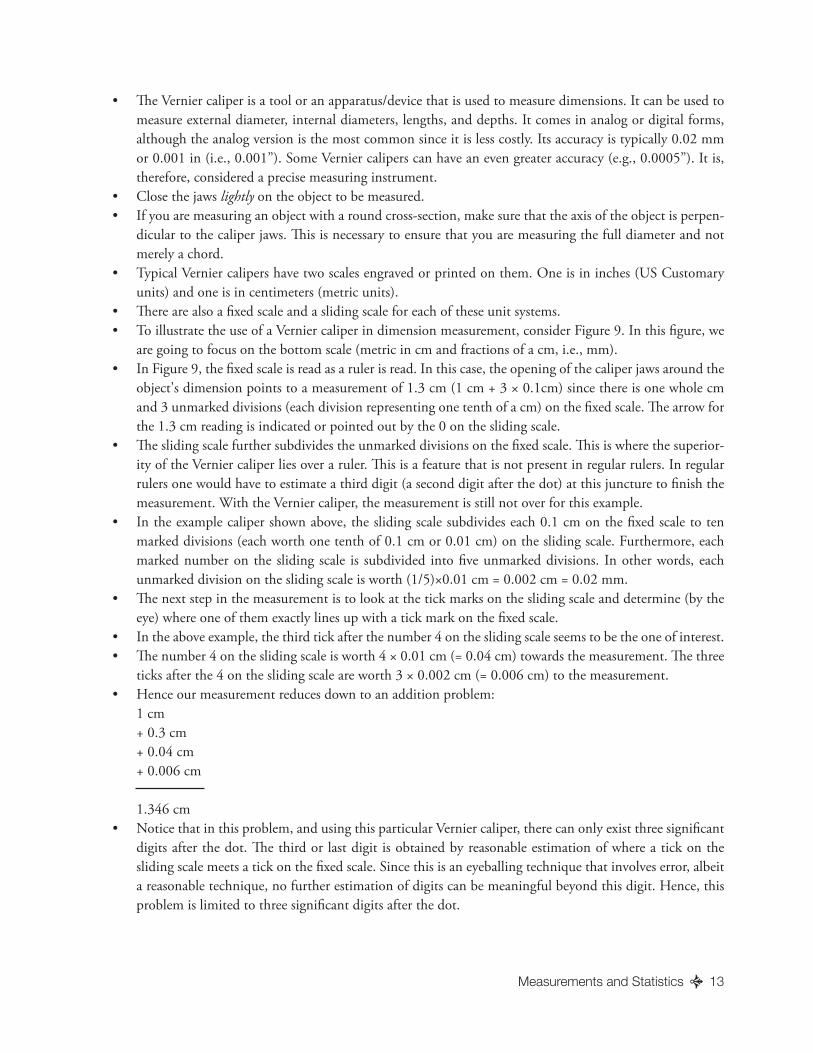
• Th e Vernier caliper is a tool or an apparatus/device that is used to measure dimensions. It can be used to measure external diameter, internal diameters, lengths, and depths. It comes in analog or digital forms, although the analog version is the most common since it is less costly. Its accuracy is typically 0.02 mm or 0.001 in (i.e., 0.001”). Some Vernier calipers can have an even greater accuracy (e.g., 0.0005”). It is, therefore, considered a precise measuring instrument.
• Close the jaws lightly on the object to be measured. • If you are measuring an object with a round cross-section, make sure that the axis of the object is perpen-
dicular to the caliper jaws. Th is is necessary to ensure that you are measuring the full diameter and not merely a chord.
• Typical Vernier calipers have two scales engraved or printed on them. One is in inches (US Customary units) and one is in centimeters (metric units).
• Th ere are also a fi xed scale and a sliding scale for each of these unit systems.• To illustrate the use of a Vernier caliper in dimension measurement, consider Figure 9. In this fi gure, we
are going to focus on the bottom scale (metric in cm and fractions of a cm, i.e., mm).• In Figure 9, the fi xed scale is read as a ruler is read. In this case, the opening of the caliper jaws around the
object's dimension points to a measurement of 1.3 cm (1 cm + 3 × 0.1cm) since there is one whole cm and 3 unmarked divisions (each division representing one tenth of a cm) on the fi xed scale. Th e arrow for the 1.3 cm reading is indicated or pointed out by the 0 on the sliding scale.
• Th e sliding scale further subdivides the unmarked divisions on the fi xed scale. Th is is where the superior-ity of the Vernier caliper lies over a ruler. Th is is a feature that is not present in regular rulers. In regular rulers one would have to estimate a third digit (a second digit after the dot) at this juncture to fi nish the measurement. With the Vernier caliper, the measurement is still not over for this example.
• In the example caliper shown above, the sliding scale subdivides each 0.1 cm on the fi xed scale to ten marked divisions (each worth one tenth of 0.1 cm or 0.01 cm) on the sliding scale. Furthermore, each marked number on the sliding scale is subdivided into fi ve unmarked divisions. In other words, each unmarked division on the sliding scale is worth (1/5)×0.01 cm = 0.002 cm = 0.02 mm.
• Th e next step in the measurement is to look at the tick marks on the sliding scale and determine (by the eye) where one of them exactly lines up with a tick mark on the fi xed scale.
• In the above example, the third tick after the number 4 on the sliding scale seems to be the one of interest.• Th e number 4 on the sliding scale is worth 4 × 0.01 cm (= 0.04 cm) towards the measurement. Th e three
ticks after the 4 on the sliding scale are worth 3 × 0.002 cm (= 0.006 cm) to the measurement.• Hence our measurement reduces down to an addition problem:
1 cm+ 0.3 cm+ 0.04 cm+ 0.006 cm
1.346 cm• Notice that in this problem, and using this particular Vernier caliper, there can only exist three signifi cant
digits after the dot. Th e third or last digit is obtained by reasonable estimation of where a tick on the sliding scale meets a tick on the fi xed scale. Since this is an eyeballing technique that involves error, albeit a reasonable technique, no further estimation of digits can be meaningful beyond this digit. Hence, this problem is limited to three signifi cant digits after the dot.
14 Experiments in Materials Science and Engineering
• On those rare occasions when the reading just happens to be a “nice” number like 4 cm, don’t forget to include the zero decimal places showing the precision of the measurement and the reading error. So not 4 cm, but rather 4.000 cm.
• Th e same method is used for English units.
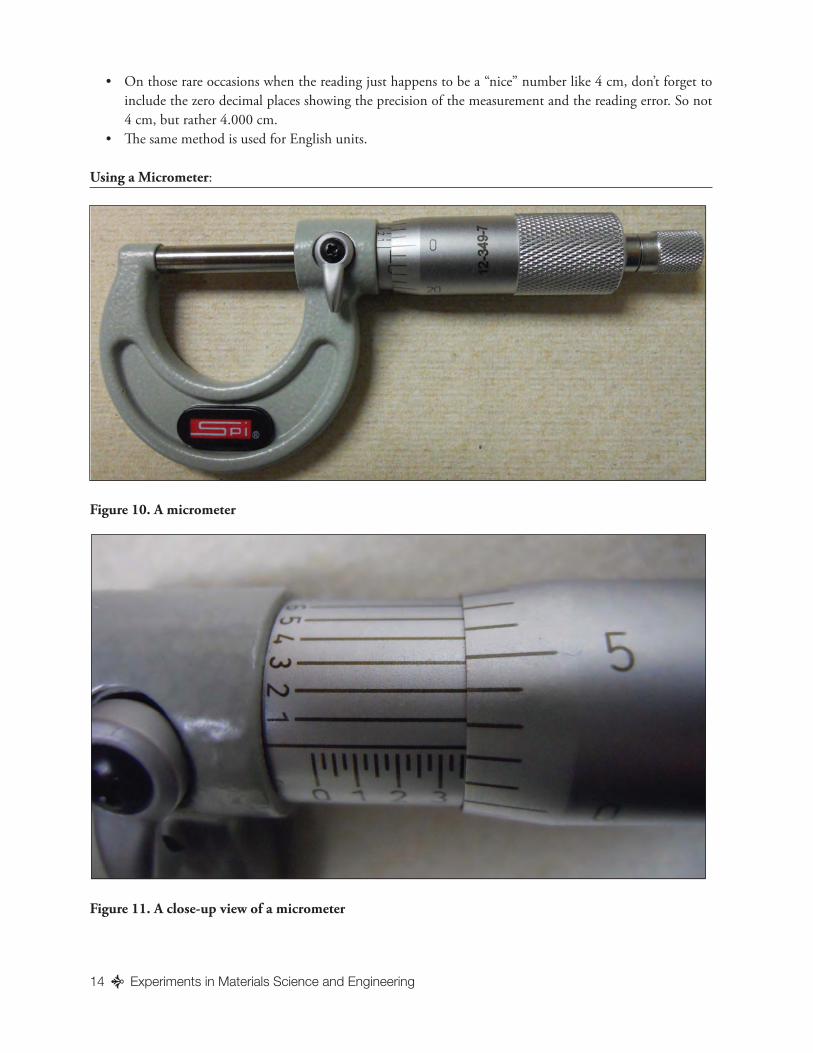
Using a Micrometer:
Figure 10. A micrometer
Figure 11. A close-up view of a micrometer