EXPERIMENTAL WORK - Shodhgangashodhganga.inflibnet.ac.in/bitstream/10603/8698/14/14_chapter...
100
Characterization of Isolated Compounds 267 EXPERIMENTAL WORK The process that leads the plant to isolate pharmacologically active pure constituents is very long and tedious and requires a multidisciplinary collaboration of botanists, phytochemists and pharmacologists. The project involves Collection and Authentication of the Plant Material Extraction of the selected plant Preliminary screening of extracts Isolation and purification of compounds Structure elucidation of compound Extraction and Phytochemical Screening of Flemingia wightiania A. Collection and Authentification of Flemingia wightiania The whole plant Flemingia wightiania widely found in the South India. The plant was collected from the Chittoor district (Andhra Pradesh), identified and authenticated by Dr. K. Madhava Chetty, Asst. Professor, Dept. of Botany. Sri Venkateswara University, Tirupathi. B. Extraction Process The whole plant was shade dried at room temperature and was chopped into small pieces. Dried plant were powdered and packed in air tight container. The coarse material was subjected to successive soxhlet extraction by using different solvents. Solvents are used based on their increasing order of polarity i.e., n- Hexane (0.1), Ethyl acetate (4.4), Methanol (5.1) and Water (10.2). The extraction is carried with Methanol, n-Hexane and Ethyl acetate. The aqueous extraction was carried Please purchase PDF Split-Merge on www.verypdf.com to remove this watermark. Please purchase PDF Split-Merge on www.verypdf.com to remove this watermark.
Transcript of EXPERIMENTAL WORK - Shodhgangashodhganga.inflibnet.ac.in/bitstream/10603/8698/14/14_chapter...
Characterization of Isolated Compounds
267
EXPERIMENTAL WORK
The process that leads the plant to isolate pharmacologically active pure
constituents is very long and tedious and requires a multidisciplinary collaboration of
botanists, phytochemists and pharmacologists. The project involves
Collection and Authentication of the Plant Material
Extraction of the selected plant
Preliminary screening of extracts
Isolation and purification of compounds
Structure elucidation of compound
Extraction and Phytochemical Screening of Flemingia wightiania
A. Collection and Authentification of Flemingia wightiania
The whole plant Flemingia wightiania widely found in the South India. The plant
was collected from the Chittoor district (Andhra Pradesh), identified and authenticated by
Dr. K. Madhava Chetty, Asst. Professor, Dept. of Botany. Sri Venkateswara University,
Tirupathi.
B. Extraction Process
The whole plant was shade dried at room temperature and was chopped into small
pieces. Dried plant were powdered and packed in air tight container.
The coarse material was subjected to successive soxhlet extraction by using
different solvents. Solvents are used based on their increasing order of polarity i.e., n-
Hexane (0.1), Ethyl acetate (4.4), Methanol (5.1) and Water (10.2). The extraction is
carried with Methanol, n-Hexane and Ethyl acetate. The aqueous extraction was carried
Please purchase PDF Split-Merge on www.verypdf.com to remove this watermark.Please purchase PDF Split-Merge on www.verypdf.com to remove this watermark.

Characterization of Isolated Compounds
268
out by cold maceration process. The extracts were concentrated under reduced pressure
and stored in desiccators.
Table 1: Extractive Yield and Percentage Yield of Flemingia wightiania
Sl. No. Extracts Yield in gm Percentage Yield
1. n-Hexane 42.34 8.46%
2. Ethyl acetate 39.00 7.8%
3. Methanol 53.20 10.64%
4. Aqueous 64.46 6.44%
Preliminary Qualitative Phytochemical Studies:
Table 2: Preliminary Phytochemical Screening of Flemingia wightiania Extracts
Sl. No. Test n-Hexane
Extract
Ethyl
acetate
Extract
Methanolic
Extract
Aqueous
Extract
i Alkaloids
A. Mayer’s Test
B. Dragandroff’s Test
C. Wagner’s Test
D. Hager’s test
-
+
-
-
-
-
-
-
+
+
+
+
+
-
-
+
ii Carbohydrates
A. Molish’s Test
B. Barfoed’s Test
C. Bendict’s Test
D. Fehling,s Test
+
+
-
-
-
-
-
-
+
+
-
-
-
+
+
+
iii Flavonoids
A. Shinoda Test
B. Ferric chloride Test
C. Alkaline Test
D. Lead acetate Test
-
-
-
-
-
-
-
-
+
+
-
+
-
+
-
+
Please purchase PDF Split-Merge on www.verypdf.com to remove this watermark.Please purchase PDF Split-Merge on www.verypdf.com to remove this watermark.
Characterization of Isolated Compounds
269
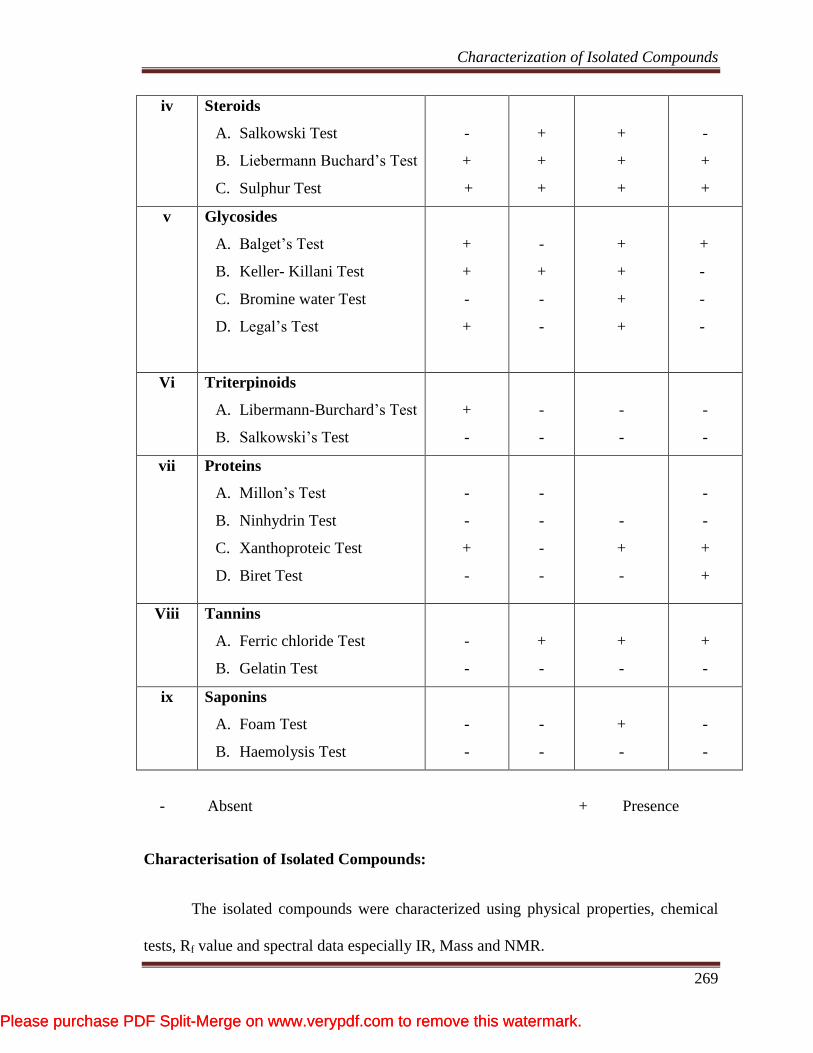
iv Steroids
A. Salkowski Test
B. Liebermann Buchard’s Test
C. Sulphur Test
-
+
+
+
+
+
+
+
+
-
+
+
v Glycosides
A. Balget’s Test
B. Keller- Killani Test
C. Bromine water Test
D. Legal’s Test
+
+
-
+
-
+
-
-
+
+
+
+
+
-
-
-
Vi Triterpinoids
A. Libermann-Burchard’s Test
B. Salkowski’s Test
+
-
-
-
-
-
-
-
vii Proteins
A. Millon’s Test
B. Ninhydrin Test
C. Xanthoproteic Test
D. Biret Test
-
-
+
-
-
-
-
-
-
+
-
-
-
+
+
Viii Tannins
A. Ferric chloride Test
B. Gelatin Test
-
-
+
-
+
-
+
-
ix Saponins
A. Foam Test
B. Haemolysis Test
-
-
-
-
+
-
-
-
- Absent + Presence
Characterisation of Isolated Compounds:
The isolated compounds were characterized using physical properties, chemical
tests, Rf value and spectral data especially IR, Mass and NMR.
Please purchase PDF Split-Merge on www.verypdf.com to remove this watermark.Please purchase PDF Split-Merge on www.verypdf.com to remove this watermark.
Characterization of Isolated Compounds
270
Compound 1: (FW-1)
Eluent : 75% ethyl acetate in Hexane
Physical Properties : Pale yellow crystalline compound
Chemical Test : It gave positive test for FeCl3, lead acetate, test for Schinoda of
flavanoids.
TLC : Green color spot
It was collected from 279-343 fractions, as pale green colored crystallized needles
from 75% ethyl acetate in hexane fraction.
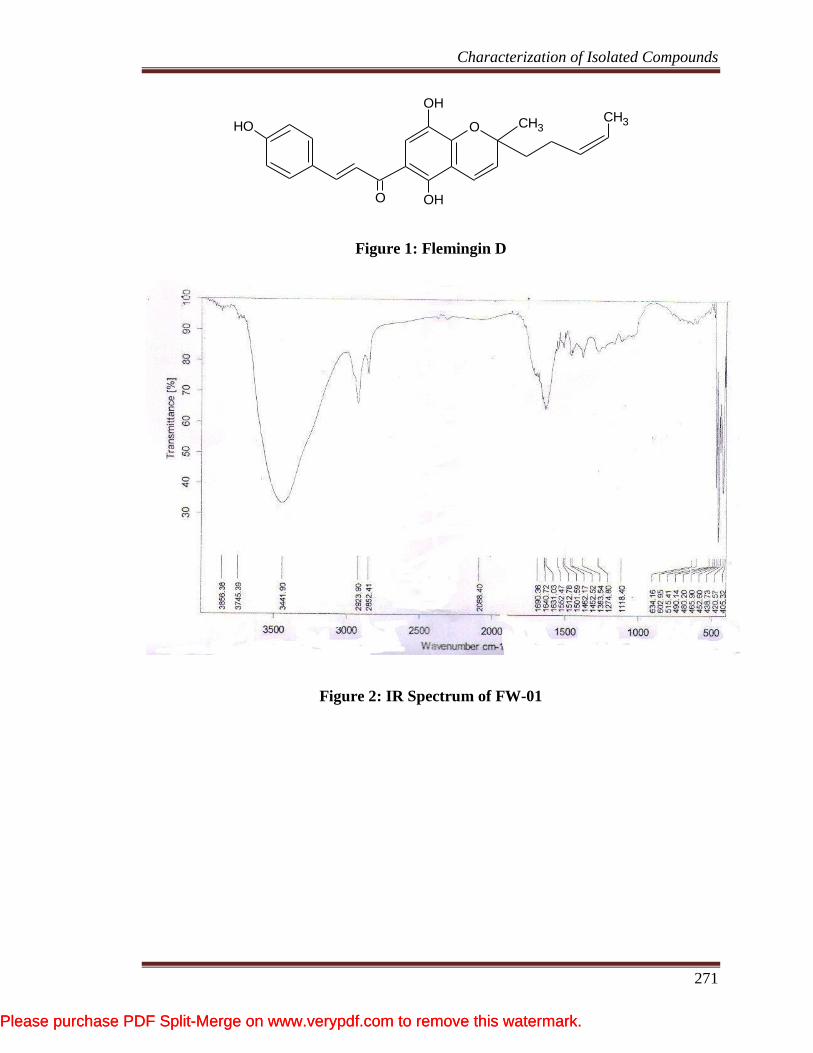
IR Spectrum indicated bands at 3398 (OH), 2921(C-H stretch), 1630(C=O) cm-1
.
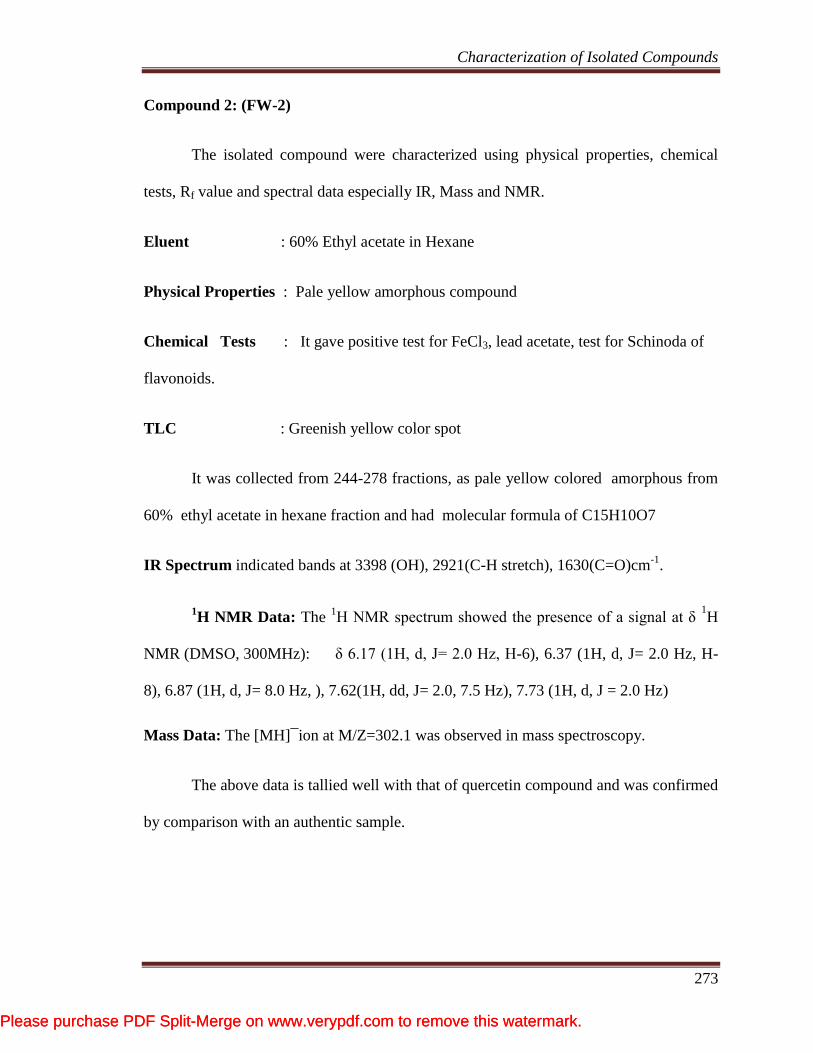
1H NMR Data:
1H
NMR spectrum (400MHz, CDCl3, δ ppm) showed the
presence of a 1 hydroxyl (δ 13.501,1H, S), a downfield methylene proton (δ 6.708, 1H, s)
characteristic of H-3 of flavonoids , (δ 6.410, 6.389 1H,s) assigned to H-6 of ring A of
5,7-dihydroxy flavonoids. The 1H NMR spectrum also showed the presence of a signal at
δ 7.358(1H, J = 8 Hz), δ 7.260 (1H, J = 1.6 Hz), (δ 7.056,7.036,7.016 2H,J=8.34,t) and δ
7.975 (1H, J = 6.4 Hz), (δ 6.410,6.389 1H,J=8.34,d) (δ 8.014 (1H, J = 4.2 Hz),
characteristic of 1, 4 – disubstituted phenyl unit.
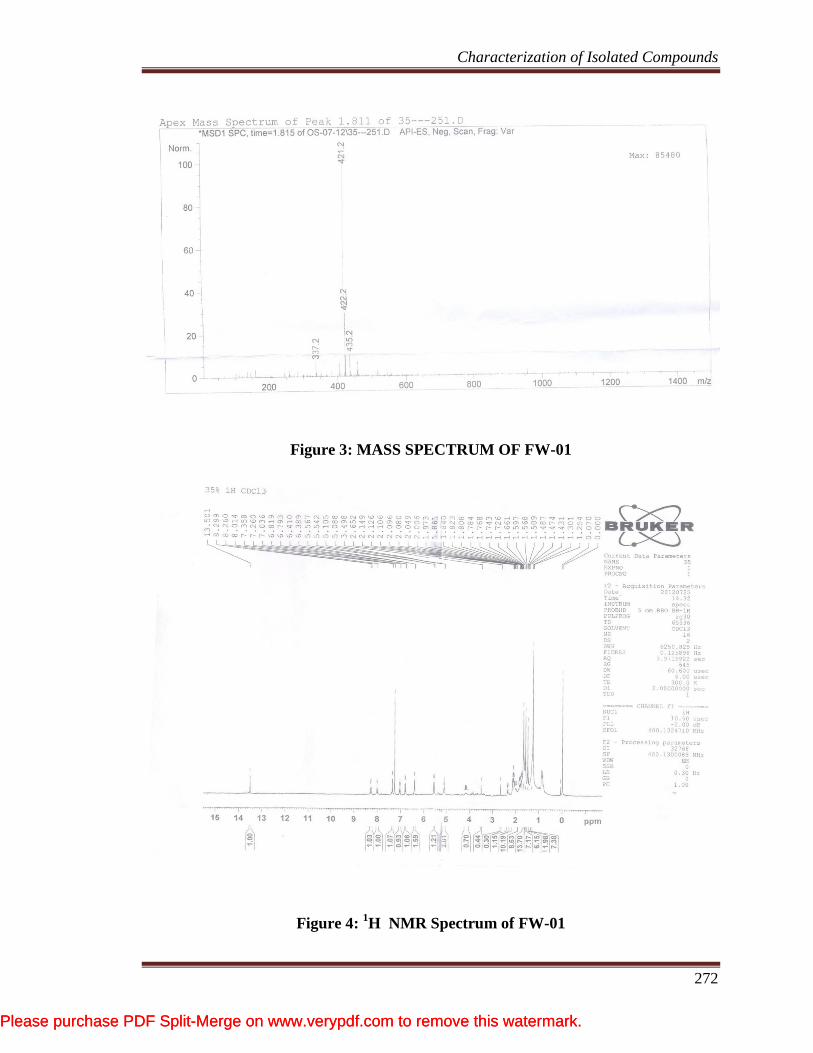
Mass Data: The [MH]¯ion at M/Z=421.2 was observed in mass spectroscopy.
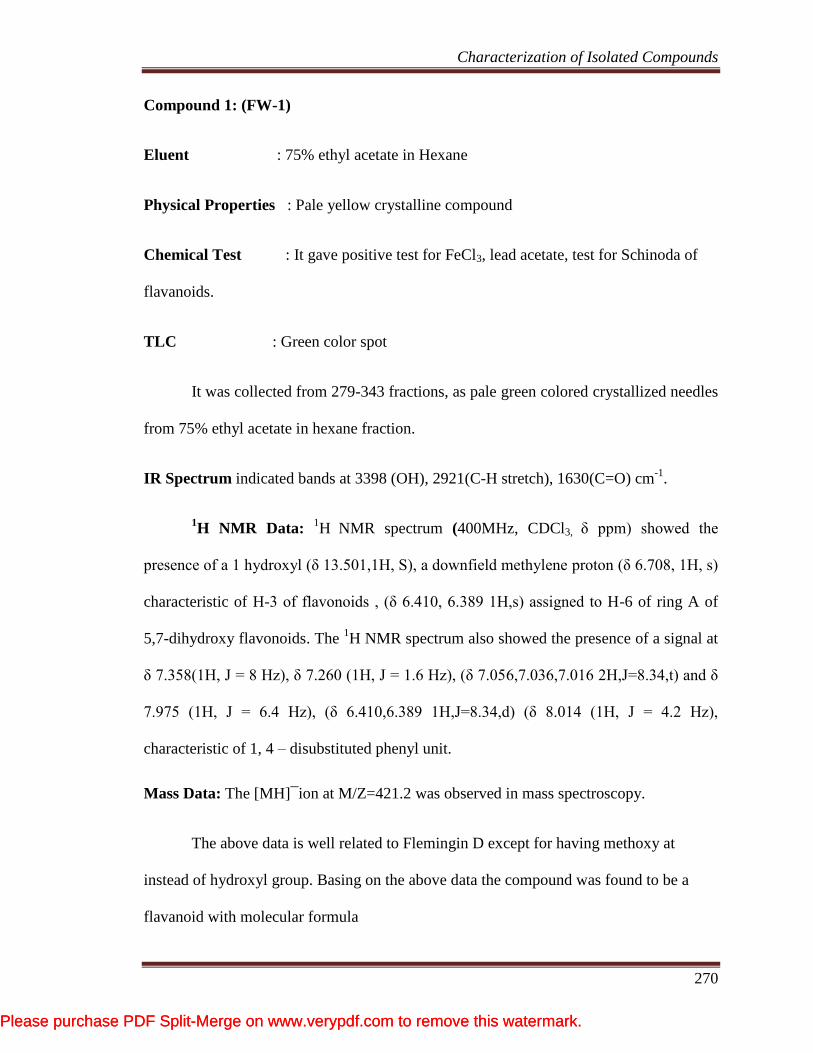
The above data is well related to Flemingin D except for having methoxy at
instead of hydroxyl group. Basing on the above data the compound was found to be a
flavanoid with molecular formula
Please purchase PDF Split-Merge on www.verypdf.com to remove this watermark.Please purchase PDF Split-Merge on www.verypdf.com to remove this watermark.
Characterization of Isolated Compounds
271
OH
OH
OH O
O
CH3CH3
Figure 1: Flemingin D
Figure 2: IR Spectrum of FW-01
Please purchase PDF Split-Merge on www.verypdf.com to remove this watermark.Please purchase PDF Split-Merge on www.verypdf.com to remove this watermark.
Characterization of Isolated Compounds
272
Figure 3: MASS SPECTRUM OF FW-01
Figure 4: 1H NMR Spectrum of FW-01
Please purchase PDF Split-Merge on www.verypdf.com to remove this watermark.Please purchase PDF Split-Merge on www.verypdf.com to remove this watermark.
Characterization of Isolated Compounds
273
Compound 2: (FW-2)
The isolated compound were characterized using physical properties, chemical
tests, Rf value and spectral data especially IR, Mass and NMR.
Eluent : 60% Ethyl acetate in Hexane
Physical Properties : Pale yellow amorphous compound
Chemical Tests : It gave positive test for FeCl3, lead acetate, test for Schinoda of
flavonoids.
TLC : Greenish yellow color spot
It was collected from 244-278 fractions, as pale yellow colored amorphous from
60% ethyl acetate in hexane fraction and had molecular formula of C15H10O7
IR Spectrum indicated bands at 3398 (OH), 2921(C-H stretch), 1630(C=O)cm-1
.
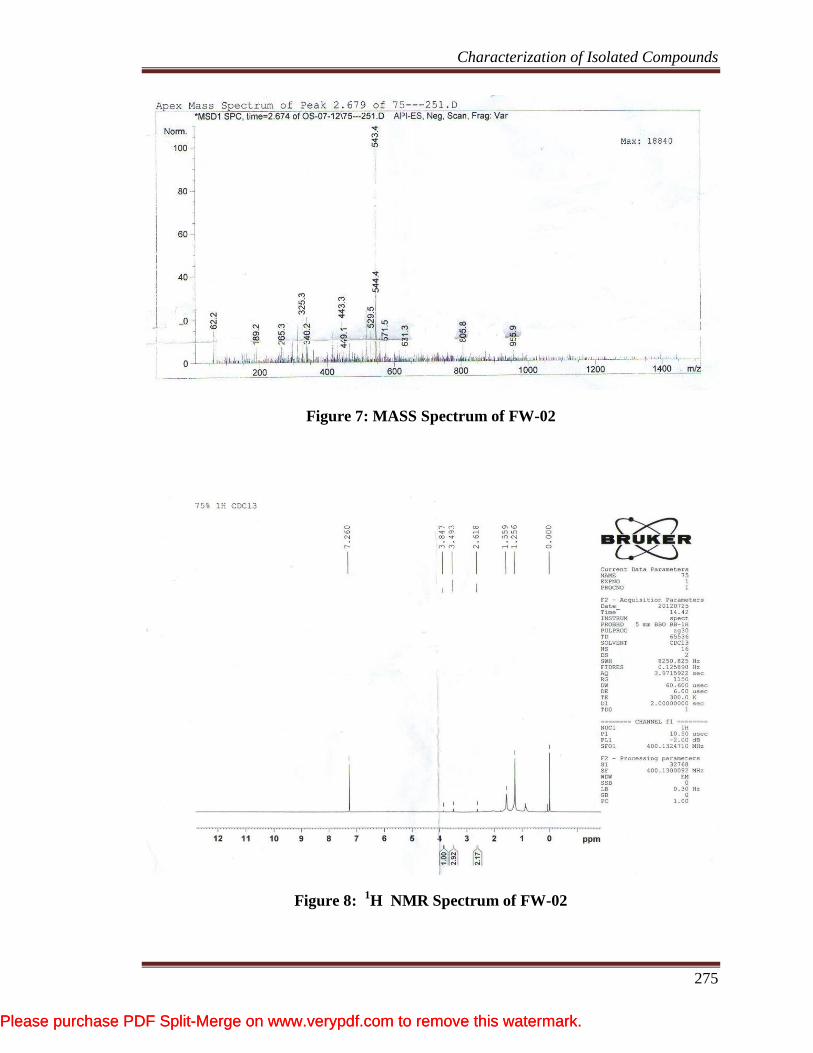
1H NMR Data: The
1H NMR spectrum showed the presence of a signal at δ
1H
NMR (DMSO, 300MHz): δ 6.17 (1H, d, J= 2.0 Hz, H-6), 6.37 (1H, d, J= 2.0 Hz, H-
8), 6.87 (1H, d, J= 8.0 Hz, ), 7.62(1H, dd, J= 2.0, 7.5 Hz), 7.73 (1H, d, J = 2.0 Hz)
Mass Data: The [MH]¯ion at M/Z=302.1 was observed in mass spectroscopy.
The above data is tallied well with that of quercetin compound and was confirmed
by comparison with an authentic sample.
Please purchase PDF Split-Merge on www.verypdf.com to remove this watermark.Please purchase PDF Split-Merge on www.verypdf.com to remove this watermark.
Characterization of Isolated Compounds
274
O OH
OHOH
O
OH
OH
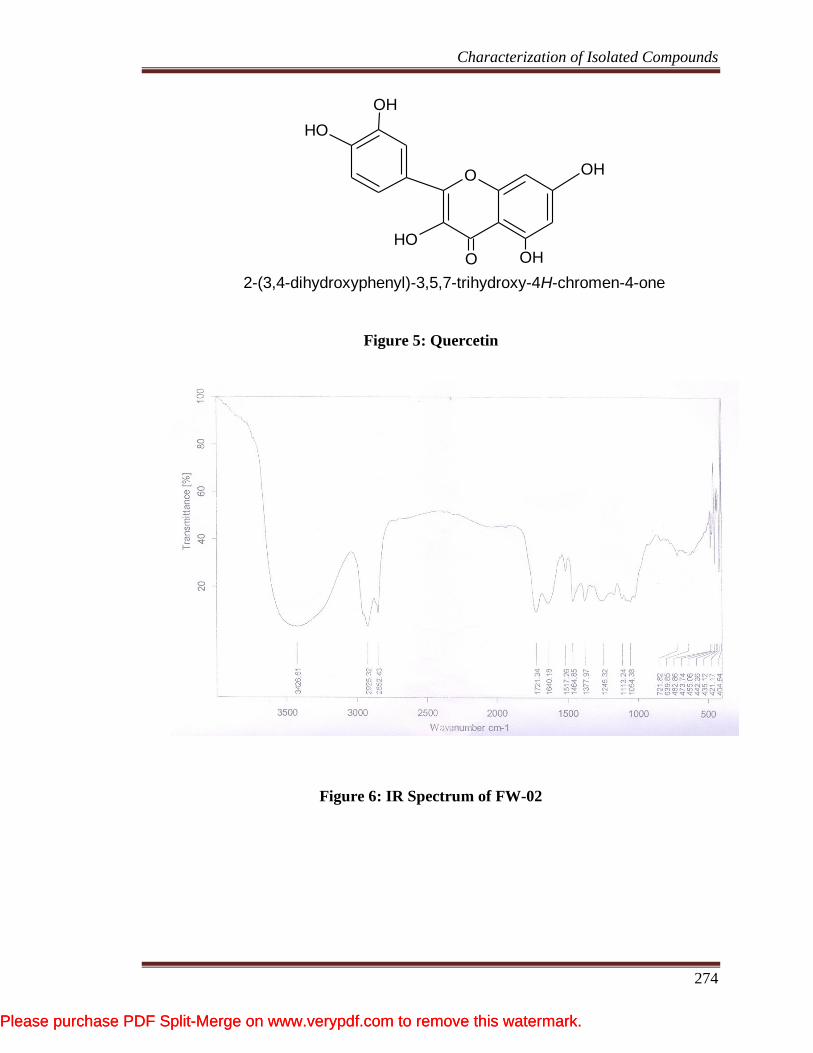
2-(3,4-dihydroxyphenyl)-3,5,7-trihydroxy-4H-chromen-4-one
Figure 5: Quercetin
Figure 6: IR Spectrum of FW-02
Please purchase PDF Split-Merge on www.verypdf.com to remove this watermark.Please purchase PDF Split-Merge on www.verypdf.com to remove this watermark.
Characterization of Isolated Compounds
275
Figure 7: MASS Spectrum of FW-02
Figure 8: 1H NMR Spectrum of FW-02
Please purchase PDF Split-Merge on www.verypdf.com to remove this watermark.Please purchase PDF Split-Merge on www.verypdf.com to remove this watermark.

Material and Methods
276
MATERIAL AND METHODS
Anti-Microbial Activity1:
Anti-Bacterial Activity:
Method: Agar diffusion method was used to carry out this study.
Preparation of Test Solutions:
Test samples of the plant extract were prepared in DMSO (Dimethyl Sulfoxide)
and the final volume made with distilled water to get 25 and 50 mg/ml concentrations.
Preparation of Standard Solutions:
Ciprofloxacin was the reference standard drugs prepared in distilled water to get
75 l/ml, 50 l/ml, 25 l/ml, 10 l/ml, and 5 l/ml.
Test Organisms:
1. Enterococcus faecalis gram positive
2. Staphylococcus aereus
3. Bacillus subtilis
4. Shigella sonnei
5. Klebsiallea pneumonia gram negative
6. Escherichia coli
7. Salmonella typhi
8. Proteus vulgaris
Mueller Hinton media was prepared using following ingredients:
1. Casein hydrolysate (enzymic) 17.5 g
2. Beef infusion 30.0 g
3. Soluble starch 1.5 g
Please purchase PDF Split-Merge on www.verypdf.com to remove this watermark.Please purchase PDF Split-Merge on www.verypdf.com to remove this watermark.
Material and Methods
277
4. Agar 20.0 g
5. Distilled water Q.S. to 1000ml
The final pH of the medium after sterilization at 1.1 kg/cm2 to 7.4 ± 0.2 (at 25
ºC),
(121 º C) for 15 minutes was adjusted
Nutrient Agar
1. Beef extract 3.0 g
2. Peptone 5.0 g
3. Sodium chloride 5.0 g
4. Agar 5.0 g
5. Distilled water Q.S. to 1000ml
pH 7.2
The above were dissolved in one liter distilled water and sterilized at 121 ºC for
15 minutes.
Method:
The antibacterial activity of the extract was assayed using the disc diffusion
method. For inoculum preparation and assay of antibacterial activity, Muller-Hinton agar
was used. The bacteria were sub cultured and routinely maintained on both nutrient agar
and Muller-Hinton agar. Antimicrobial activity was evaluated using the agar diffusion
technique in Petri dishes. Each extract was loaded on sterile filter paper discs and air
dried. Indicator microbes were spread on Muller-Hinton agar plates with sterile effusion
the discs were placed on plates. After incubation for 24 hours at 30 °C, a clear zone
around a disc was evidence of antimicrobial activity. Discs loaded with the extracting
agents were tested as controls.
Please purchase PDF Split-Merge on www.verypdf.com to remove this watermark.Please purchase PDF Split-Merge on www.verypdf.com to remove this watermark.
Material and Methods
278
Anti-Fungal Activity:
Method: Agar diffusion method was used to carry out this study.
Preparation of Test Solutions:
Test samples of the plant extract were prepared in DMSO (Dimethyl Sulfoxide)
and the final volume made with distilled water to get 25 and 50 mg/ml concentrations.
Preparation of Standard Solutions:
Fluconazole was the reference standard drugs prepared in distilled water to get
75 l/ml, 50 l/ml, 25 l/ml, 10 l/ml, and 5 l/ml.
Test Organisms:
1. Candida albicans
2. Aspergillus fumigates
3 .Dreschlera turcica
4. Fusarium verticillioides
Preparation of potato dextrose broth:
1. Peeled potato 200-300g
2. Dextrose 5g
3. Agar 20.0 g
4. Distilled water Q.S. to 1000ml
The final pH of the medium after sterilization at 1.1 kg/cm2
to 7.4 ± 0.2 (at 25ºC),
(121ºC) for 15 minutes was adjusted.
Nutrient Agar
1. Beef extract 3.0 g
2. Peptone 5.0 g
Please purchase PDF Split-Merge on www.verypdf.com to remove this watermark.Please purchase PDF Split-Merge on www.verypdf.com to remove this watermark.

Material and Methods
279
3. Sodium chloride 5.0 g
4. Agar 5.0 g
5. Distilled water Q.S. to 1000ml
pH 7.2
The above were dissolved in one liter distilled water and sterilized at 121 ºC for
15 minutes.
Method
The antibacterial activity of the extract was assayed using the disc diffusion
method. For inoculum preparation and assay of antibacterial activity, Muller-Hinton agar
was used. The bacteria were sub cultured and routinely maintained on both nutrient agar
and Muller-Hinton agar. Antimicrobial activity was evaluated using the agar diffusion
technique in Petri dishes. Each extract was loaded on sterile filter paper discs and air
dried. Indicator microbes were spread on Muller-Hinton agar plates with sterile effusion
the discs were placed on plates. After incubation for 24 hours at 30°C, a clear zone
around a disc was evidence of antimicrobial activity. Discs loaded with the extracting
agents were tested as controls.
Please purchase PDF Split-Merge on www.verypdf.com to remove this watermark.Please purchase PDF Split-Merge on www.verypdf.com to remove this watermark.

Results and Discussion
280
RESULTSAND DISCUSSION
Anti Microbial Studies Reports:
The disc diffusion method was used to determine zones of inhibition of Flemingia
wightiania. extracts (n-Hexane, Ethyl acetate, Methanol and Aqueous). The MEFW and
AEFW showed significant activity against Staphylococcus aureus, Bacillus subtilis in
gram positive and Escherichia coli, Proteus vulgaris in gram negative at the
concentration of 75 µgms. HEFW and EAEFW extracts showed less significant activity.
In Anti fungal activity the MEFW and AEFW showed significant activity against
Candida albicans, Asperigillus fumigates Dreschlera turcica and Fusarium verticillioides
at the concentration of 75 µgms.
HEFW and EAEFW extracts showed less significant activity. These extracts were
compared with Fluconazole which is used as a standard.
Please purchase PDF Split-Merge on www.verypdf.com to remove this watermark.Please purchase PDF Split-Merge on www.verypdf.com to remove this watermark.

Results and Discussion
281
Table 1: Anti bacterial Activity and Extracts of Flemingia wightiania:
Staphylococcus aureus Enterococcus faecalis Klebsiella pneumonia Escherichia coli
Concentration
in µgms
75 50 25 10 5 75 50 25 10 5 75 50 25 10 5 75 50 25 10 5
n-Hexane 14 12 11 9.5 - 12 9 - - - 10 - - - - 15 12 9.5 - -
Ethyl acetate 15 13.5 12.5 10 - 10 - - - - 9.5 - - - - 13 10 9 - -
Methanol 20 17 15.5 12 11 16 13 11 10 9.5 17 15.5 13.5 11 10 19 17 16 14 12
Aqueous 17 14 12 10 9 15 13 9 - - 16 12.5 10.5 9.5 - 14 12 11 10 9
Bacillus subtilis Shigella sonnei Salmonella typhi Proteus vulgaris
Concentration
in µgms
75 50 25 10 5 75 50 25 10 5 75 50 25 10 5 75 50 25 10 5
n-Hexane 16 14 12 10 - 13 10 9 - - 11 9 - - - 16 12.
5
10 - -
Ethyl acetate 15.
5
13 12 10 - 11 10 - - - 9 - - - - 14 10 - - -
Methanol 19 16 14 10 9 17 15.
5
12 10 9.5 18 16 13 11 10 18 13 10 9 1
Aqueous 18 16 15 12 10 15 12 9 - - 16 12 10.
5
9 - 15 12 10 9 -
Standard
(Ciprofloxacin)
22 20 18 17 14 21 20 18 16 15 22 19.
5
17 15 13 23.
5
19.
5
17 16 14
Please purchase PDF Split-Merge on www.verypdf.com to remove this watermark.Please purchase PDF Split-Merge on www.verypdf.com to remove this watermark.

Results and Discussion
282
Table 2: Anti fungal Activity and Extracts of Flemingia wightiania:
Candida albicans Aperigillus fumigatus Dreschlera turcica Fusarium verticillioides
Concentration
in µgms
75 50 25 10 5 75 50 25 10 5 75 50 25 10 5 75 50 25 10 5
n-Hexane 14 12.5 10 - - 16 14.5 13 10 - 15 11 9 - - 15 13 12 10 -
Ethyl acetate 10 - - - - 13 10 - - - 12 10 - - - 14 11 9 - -
Methanol 18 15.5 13.5 12 10 17 16 14 11 9 17 14 11 10 - 17 15.5 12 10 9
Aqueous 16 14 12 11 9 15 12 11 9.5 - 17 13 11 10 9 15.5 13 11.5 9 -
Standard
(Flucanazole)
20.5 17 15.5 12.5 11 20 17 16 13 10 20.5 17 15.5 12.5 11 20 17 16 13 10
Please purchase PDF Split-Merge on www.verypdf.com to remove this watermark.Please purchase PDF Split-Merge on www.verypdf.com to remove this watermark.

Results and Discussion
283
Please purchase PDF Split-Merge on www.verypdf.com to remove this watermark.Please purchase PDF Split-Merge on www.verypdf.com to remove this watermark.
Material and Methods
283
MATERIAL AND METHODS
Animals Used In Study
Albino wistar rats weighing 150-200 g and Albino mice 20-30 g was procured
from Biogen, Bangalore. They were maintained in the animal house of Gautham College
of Pharmacy. Animals were maintained under controlled condition of temperature at
27 ± 2o
C and 12 hour light-dark cycles. They were housed in polypropylene cages and
had a free access to standard pellets (Amruth) and water ad libitum. The animals housing
and handling were in accordance with CPCSEA guidelines.
All the studies conducted were approved by the Institutional Animal Ethical
Committee (IAEC) of Gautham College of Pharmacy, Bangalore, Karnataka. (REF-
IAEC/012/12/2010) according to prescribed guidelines of Committee for the Purpose of
Control and Supervision of Experiments on Animals (Reg No: 491/01/c/CPCSEA), Govt.
of India.
Analgesic Activity
i. Acetic acid Induced Writhing in Mice2:
Albino mice weighing 20-30 mg/kg were divided into six groups of six in each
group. One hour after the administration of the test drug and diclofenac sodium
(10 mg/kg i.p), the mice were given intraperitoneal injection of 0.7%v/v acetic acid
solution (volume of injection 0.1ml 10g), the mice were placed individually into glass
beakers and 5 minutes, were allowed to elapse. The number of writhes produced in these
animals was counted for 15 minutes. For scoring purposes, a writhe is indicated by
stretching of the abdomen with simultaneous stretching of at least one hind limb. The
formula for computing present inhibition was;
Please purchase PDF Split-Merge on www.verypdf.com to remove this watermark.Please purchase PDF Split-Merge on www.verypdf.com to remove this watermark.

Material and Methods
284
Group-I: Distilled water will be supplied and served as control.
Group-II: Animals received a dose of 10 mg/kg of Diclofenac sodium i.p. and served
as standard
Group-III: Animals received a dose of 300 mg/kg of HEFW p.o.
Group-IV: Animals received a dose of 300 mg/kg of EAEFW p.o.
Group-V: Animals received a dose of 300 mg/kg of MEFW p.o.
Group-VI: Animals received a dose of 300 mg/kg of AEFW p.o.
ii. Tail Flick Method3:
Albino wistar rats weighing 150-230 mg/kg were divided into six groups of six in
each group. The tail flick latency was assessed by analgesiometer. A light beam is
focused (exerting radiant heat) to the proximal third of the tail. The rat tries to pull the tail
away and rotates the head this reaction is known as escape reaction. The reaction time is
recorded ½, 1, 2, 3, 4, 5 and 6 hours following intra peritoneal administration of the
standard and oral administration of the test compounds. The strength of the current
passing through the naked nichrome wire was kept constant at 6 amperes. The distance
between the heat source and tail skin was 1.5 cm. The site of application of the radiant
heat in the tail was maintained at 2.5 cm measured from the root of the tail. The cutoff
reaction time was fixed at 10 seconds to avoid tissue damage.
Group-I: Distilled water will be supplied and served as control.
Group-II: Group-II: Animals received a dose of 10 mg/kg of Diclofenac sodium i.p.
and served as standard
Group-III: Animals received a dose of 300 mg/kg of HEFW p.o.
Group-IV: Animals received a dose of 300 mg/kg of EAEFW p.o.
Please purchase PDF Split-Merge on www.verypdf.com to remove this watermark.Please purchase PDF Split-Merge on www.verypdf.com to remove this watermark.
Material and Methods
285
Group-V: Animals received a dose of 300 mg/kg of MEFW p.o.
Group-VI: Animals received a dose of 300 mg/kg of AEFW p.o.
iii. Hot plate Method4:
Albino mice weighing 20-30 mg/kg were divided into six groups of six in each
group. The temperature is controlled for 55 ± 1ºC. The animals were placed into the
Perspex cylinder on the heated surface and the time (sec) to discomfort reaction ( licking
paws or jumping) was recorded as response latency, period to and 30, 60, 90, 120 and
180 minutes following intra peritoneal administration of the standard and oral
administration of the test compounds. A latency period of 15 seconds was identified as
complete analgesia and the measurement was terminated if it exceeded the latency period
in order to avoid injury.
Group-I: Distilled water will be supplied and served as control.
Group-II: Animals received a dose of 10 mg/kg of Pentazocine lactate i.p. and served
as standard
Group-III: Animals received a dose of 300 mg/kg of HEFW p.o.
Group-IV: Animals received a dose of 300 mg/kg of EAEFW p.o.
Group-V: Animals received a dose of 300 mg/kg of MEFW p.o.
Group-VI: Animals received a dose of 300 mg/kg of AEFW p.o.
Please purchase PDF Split-Merge on www.verypdf.com to remove this watermark.Please purchase PDF Split-Merge on www.verypdf.com to remove this watermark.
Results and Discussion
286
RESULTS AND DISCUSSION
Analgesic Activity
i. Acetic acid Induced Writhing in Mice
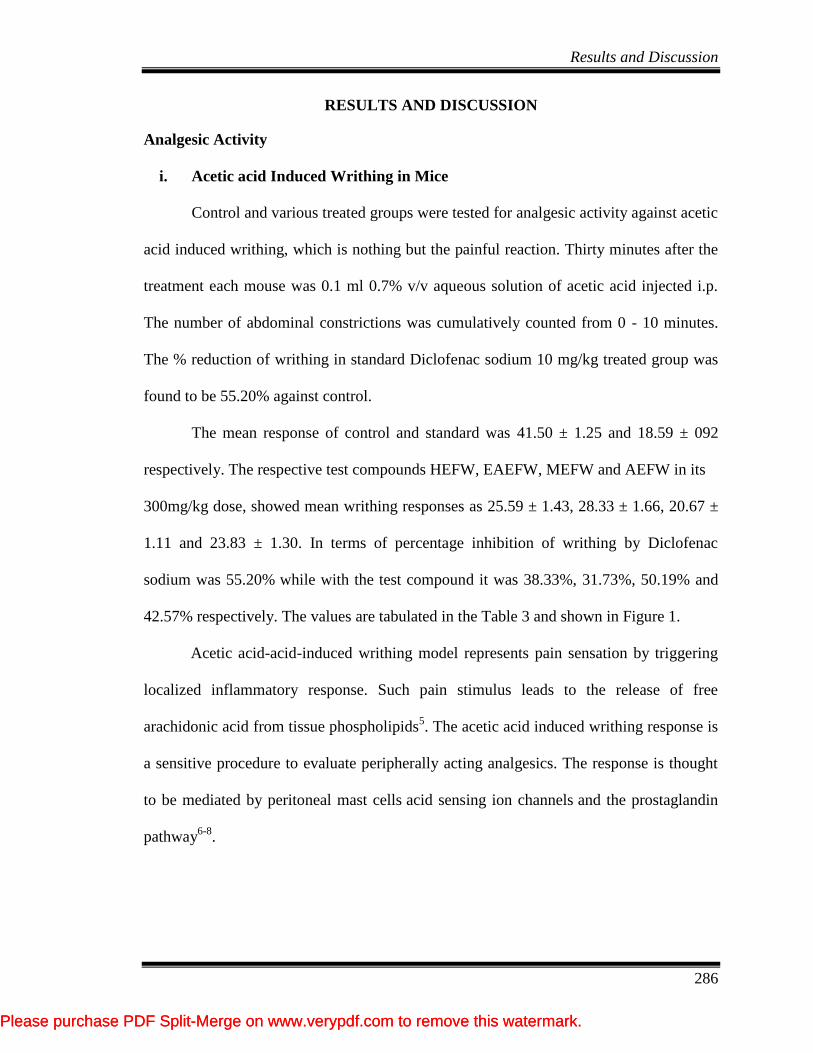
Control and various treated groups were tested for analgesic activity against acetic
acid induced writhing, which is nothing but the painful reaction. Thirty minutes after the
treatment each mouse was 0.1 ml 0.7% v/v aqueous solution of acetic acid injected i.p.
The number of abdominal constrictions was cumulatively counted from 0 - 10 minutes.
The % reduction of writhing in standard Diclofenac sodium 10 mg/kg treated group was
found to be 55.20% against control.
The mean response of control and standard was 41.50 ± 1.25 and 18.59 ± 092
respectively. The respective test compounds HEFW, EAEFW, MEFW and AEFW in its
300mg/kg dose, showed mean writhing responses as 25.59 ± 1.43, 28.33 ± 1.66, 20.67 ±
1.11 and 23.83 ± 1.30. In terms of percentage inhibition of writhing by Diclofenac
sodium was 55.20% while with the test compound it was 38.33%, 31.73%, 50.19% and
42.57% respectively. The values are tabulated in the Table 3 and shown in Figure 1.
Acetic acid-acid-induced writhing model represents pain sensation by triggering
localized inflammatory response. Such pain stimulus leads to the release of free
arachidonic acid from tissue phospholipids5. The acetic acid induced writhing response is
a sensitive procedure to evaluate peripherally acting analgesics. The response is thought
to be mediated by peritoneal mast cells acid sensing ion channels
and the prostaglandin
pathway6-8
.
Please purchase PDF Split-Merge on www.verypdf.com to remove this watermark.Please purchase PDF Split-Merge on www.verypdf.com to remove this watermark.
Results and Discussion
287
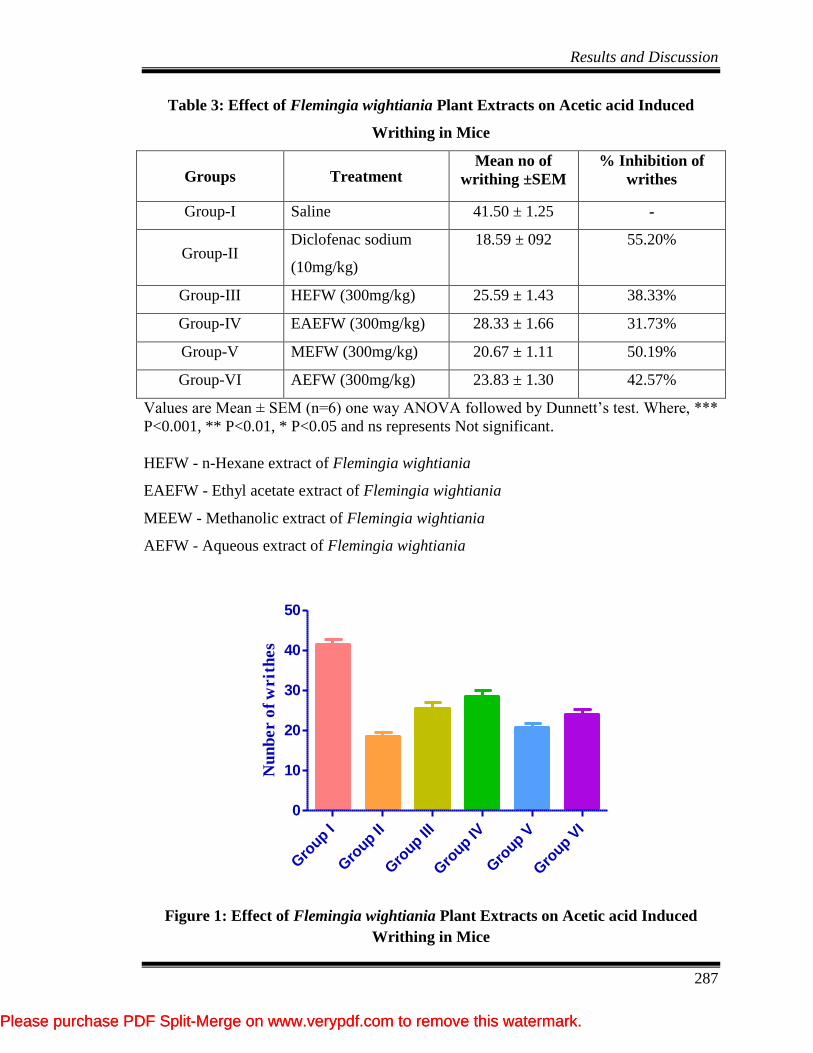
Table 3: Effect of Flemingia wightiania Plant Extracts on Acetic acid Induced
Writhing in Mice
Groups Treatment Mean no of
writhing ±SEM
% Inhibition of
writhes
Group-I Saline 41.50 ± 1.25 -
Group-II Diclofenac sodium
(10mg/kg)
18.59 ± 092 55.20%
Group-III HEFW (300mg/kg) 25.59 ± 1.43 38.33%
Group-IV EAEFW (300mg/kg) 28.33 ± 1.66 31.73%
Group-V MEFW (300mg/kg) 20.67 ± 1.11 50.19%
Group-VI AEFW (300mg/kg) 23.83 ± 1.30 42.57%
Values are Mean ± SEM (n=6) one way ANOVA followed by Dunnett’s test. Where, ***
P<0.001, ** P<0.01, * P<0.05 and ns represents Not significant.
HEFW - n-Hexane extract of Flemingia wightiania
EAEFW - Ethyl acetate extract of Flemingia wightiania
MEEW - Methanolic extract of Flemingia wightiania
AEFW - Aqueous extract of Flemingia wightiania
Gro
up I
Gro
up II
Gro
up III
Gro
up IV
Gro
up V
Gro
up VI
0
10
20
30
40
50
Nu
nb
er o
f w
rit
hes
Figure 1: Effect of Flemingia wightiania Plant Extracts on Acetic acid Induced
Writhing in Mice
Please purchase PDF Split-Merge on www.verypdf.com to remove this watermark.Please purchase PDF Split-Merge on www.verypdf.com to remove this watermark.
Results and Discussion
288
ii. Tail Flick Method in Rats
In the tail flick method, the increase in latency period at different time points
significantly differed (P<0.001) compared to baseline values within the same drug treated
groups. The extracts and diclofenac sodium caused significant increase (P<0.001) in the
percentage reaction time whilst the control and dose of extracts (300 mg/kg). The
percentage increase in reaction time was dose dependent. At all the specified time
intervals, the percentage of tail flick elongation time differed significantly (P<0.001)
between the extracts and diclofenac sodium at the doses of plant extracts, being greater
for diclofenac sodium. At the peak of activity, MEFE and AEFW extracts showed
(P<0.001) and significantly of tail flick elongation time respectively, whilst diclofenac
sodium gave (P<0.001) elongation of tail flicking time. The values are tabulated in the
Table 4 and shown in Figure 2.
Please purchase PDF Split-Merge on www.verypdf.com to remove this watermark.Please purchase PDF Split-Merge on www.verypdf.com to remove this watermark.

Results and Discussion
289
Table 4: Effect of Flemingia wightiania Plant Extracts on Tail Flick Method Test in Rats
Groups Treatment Reaction Time (Sec)
0 hr ½ hr 1 hr 2 hr 3 hr 4 hr 5 hr 6 hr
Group-I Saline 4.51 ± 0.29 4.48 ± 0.23 5.05 ± 0.34 5.30 ± 0.28 5.70 ± 0.38 5.76 ± 0.36 4.86 ± 0,57 5.65 ± 0.51
Group-II Diclofenac sodium
(10mg/kg)
4.71 ± 0.31 8.86 ±
0.39***
10.05 ±
0.45***
11.52 ±
0.98***
12.32 ±
0.77***
13.17 ±
1.19***
14.28
±0.90***
13.62 ±
0.63***
Group-
III
HEFW
(300mg/kg)
4.50 ± 0.27 7.10 ±
0.62ns
7.86 ±
0.80*
9.13 ±
0.68**
9.33 ±
0.57**
10.13 ±
0.81**
11.12 ±
0.82***
9.48 ±
0.84**
Group-
IV
EAEFW
(300mg/kg)
4.71 ± 0.48 6.95 ±
0.86ns
7.71 ±
0.74ns
8.61 ± 1.01* 8.71 ± 0.63* 9.80 ±
0.75**
10.90 ±
0.90***
8.86 ± 0.82*
Group-
V
MEFW
(300mg/kg)
4.43 ± 0.44 8.51 ±
0.99**
9.71 ±
0.87***
10.58 ±
0.56***
11.25 ±
0.86***
12.02 ±
0.87***
13.07
±0.65***
11.13 ± 0.69
***
Group-
VI
AEFW
(300mg/kg)
4.70 ± 0.24 7.60 ±
0.83*
8.60 ±
0.97**
9.86 ±
0.96**
10.47 ±
0.66***
11.33 ±
0.63***
12.58 ±
0.74***
9.93 ±
0.73***
Values are Mean ± SEM (n=6) one way ANOVA followed by Dunnett’s test. Where, *** P<0.001, ** P<0.01, * P<0.05 and ns
represents Not significant.
HEFW - n-Hexane extract of Flemingia wightiania
EAEFW - Ethyl acetate extract of Flemingia wightiania
MEEW - Methanolic extract of Flemingia wightiania
AEFW - Aqueous extract of Flemingia wightiania
Please purchase PDF Split-Merge on www.verypdf.com to remove this watermark.Please purchase PDF Split-Merge on www.verypdf.com to remove this watermark.

Results and Discussion
290
0 hr
1/2
hr1
hr2
hr3
hr4
hr5
hr6
hr
0
5
10
15
20
Group I Group II Group III Group IV
Group V Group VI
Reacti
on
tim
e (
Sec)
Figure 2: Effect of Flemingia wightiania Plant Extracts on Tail Flick Method test in mice
Please purchase PDF Split-Merge on www.verypdf.com to remove this watermark.Please purchase PDF Split-Merge on www.verypdf.com to remove this watermark.
Results and Discussion
291
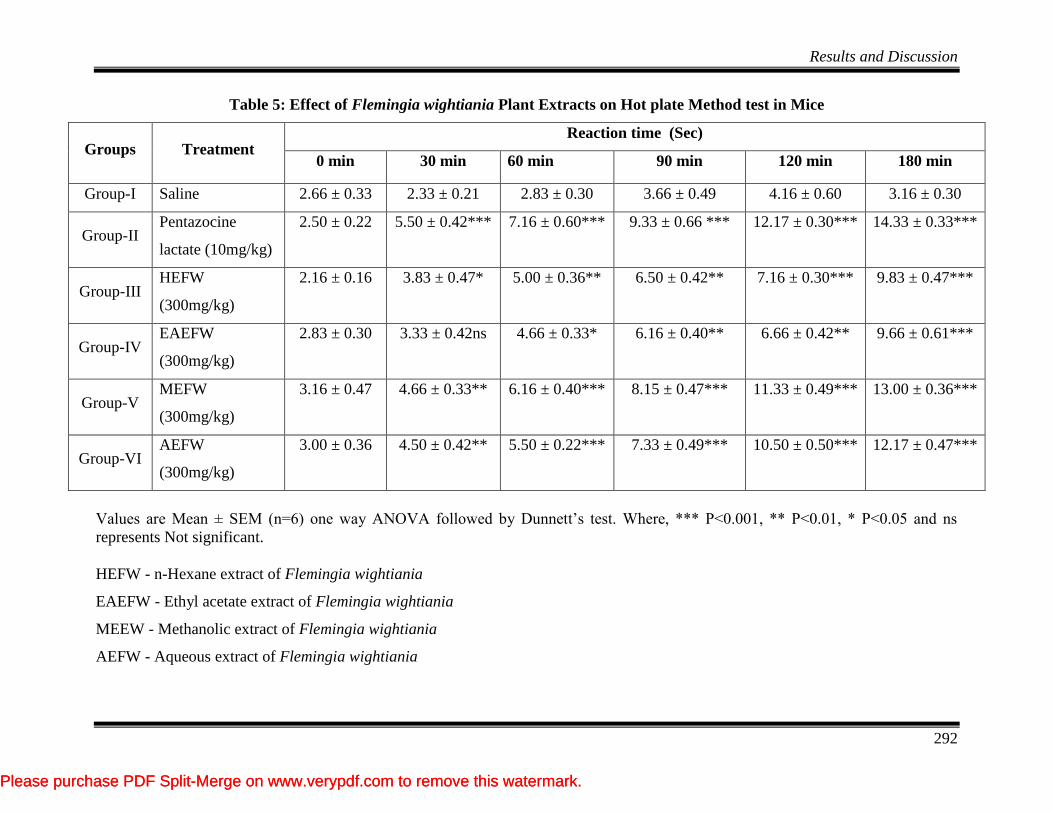
iii. Hot plate Method in Mice
The standard pentazocine lactate (10 mg/kg) was given i.p., n-Hexane, Ethyl
acetate, Methanol and Aqueous extracts given orally, in a dose of 300 mg/kg, elicited a
significant analgesic activity in the hot plate method as evidenced by increase in latency
time in seconds as compared with vehicle control. The increase in latency time was dose
dependant. Latency time was noted 30, 60, 90,120 and 180 minutes after administration
of vehicle, standard and plant extracts. The values are tabulated in the Table 5 and shown
in Figure 3.
To evaluate the analgesic activity, hot plate method was chosen. In this method
pentazocine lactate (10 mg/kg) was used as reference standard. The HEFW, EAEFW,
MEFW and AEFW extracts of Flemingia wightiania produced antinociception against
thermal induced pain stimuli in mice at various time points of post treatment. The hot
plate test is considered to be selective for opioid like compounds, which are centrally
acting analgesic in several animal species. The hot plate method has been found to be
suitable for evaluation of centrally acting analgesic9,10
. The HEFW, EAEFW, MEFW
and AEFW (300 mg/kg p.o.) increase the reaction time in dose dependent manner to the
thermal stimulus.
Please purchase PDF Split-Merge on www.verypdf.com to remove this watermark.Please purchase PDF Split-Merge on www.verypdf.com to remove this watermark.
Results and Discussion
292
Table 5: Effect of Flemingia wightiania Plant Extracts on Hot plate Method test in Mice
Groups Treatment Reaction time (Sec)
0 min 30 min 60 min 90 min 120 min 180 min
Group-I Saline 2.66 ± 0.33 2.33 ± 0.21 2.83 ± 0.30 3.66 ± 0.49 4.16 ± 0.60 3.16 ± 0.30
Group-II Pentazocine
lactate (10mg/kg)
2.50 ± 0.22 5.50 ± 0.42*** 7.16 ± 0.60*** 9.33 ± 0.66 *** 12.17 ± 0.30*** 14.33 ± 0.33***
Group-III HEFW
(300mg/kg)
2.16 ± 0.16 3.83 ± 0.47* 5.00 ± 0.36** 6.50 ± 0.42** 7.16 ± 0.30*** 9.83 ± 0.47***
Group-IV EAEFW
(300mg/kg)
2.83 ± 0.30 3.33 ± 0.42ns 4.66 ± 0.33* 6.16 ± 0.40** 6.66 ± 0.42** 9.66 ± 0.61***
Group-V MEFW
(300mg/kg)
3.16 ± 0.47 4.66 ± 0.33** 6.16 ± 0.40*** 8.15 ± 0.47*** 11.33 ± 0.49*** 13.00 ± 0.36***
Group-VI AEFW
(300mg/kg)
3.00 ± 0.36 4.50 ± 0.42** 5.50 ± 0.22*** 7.33 ± 0.49*** 10.50 ± 0.50*** 12.17 ± 0.47***
Values are Mean ± SEM (n=6) one way ANOVA followed by Dunnett’s test. Where, *** P<0.001, ** P<0.01, * P<0.05 and ns
represents Not significant.
HEFW - n-Hexane extract of Flemingia wightiania
EAEFW - Ethyl acetate extract of Flemingia wightiania
MEEW - Methanolic extract of Flemingia wightiania
AEFW - Aqueous extract of Flemingia wightiania
Please purchase PDF Split-Merge on www.verypdf.com to remove this watermark.Please purchase PDF Split-Merge on www.verypdf.com to remove this watermark.

Results and Discussion
293
0 min
30 min
60 min
90 min
120 min
180 min
0
5
10
15
20
Group I Group II Group III Group IV
Group V Group VI
Rea
ctio
n t
ime
(S
ec)
Figure 3: Effect of Flemingia wightiania Plant Extracts on Hot plate Method test in Mice
Please purchase PDF Split-Merge on www.verypdf.com to remove this watermark.Please purchase PDF Split-Merge on www.verypdf.com to remove this watermark.
Results and Discussion
294
Please purchase PDF Split-Merge on www.verypdf.com to remove this watermark.Please purchase PDF Split-Merge on www.verypdf.com to remove this watermark.
Material and Methods
294
MATERIAL AND METHODS
Anti-Inflammatory Activity
A. Acute Anti inflammatory Activity
i. Formalin-induced Paw Oedema in Rats 11
Acute inflammation was induce by injecting formalin (0.1 ml of 1% suspension in
0.9% saline) in sub-plantar region and paw volume was measured 0, 1, 2, 3, 4 and 5 hours
with the help of Plethysmometer.
All the treatment compounds compound were administered 30 minutes prior to
formalin. Acute inflammation was induced in right hind paw. A mark was put on the leg
second at the leg at the mallaleous region to facilitate the dipping of the leg to the same
level at the second and subsequent times.
The initial reading was taken at 0th
hour, i.e., immediately after injecting formalin
and the procedure was repeated at 1, 2, 3, 4 and 5 hours after formalin injection. The
difference between 0 hour reading and one of the subsequent reading provides the actual
edema volume at the time. The mean paw volume at different times was calculated and
compared with the control and the percentage inhibition was then calculated by using the
formula;
Group-I: Distilled water will be supplied and served as control.
Group-II: Animals received a dose of 10 mg/kg of Diclofenac sodium i.p. and served
as standard
Group-III: Animals received a dose of 300 mg/kg of HEFW p.o.
Group-IV: Animals received a dose of 300 mg/kg of EAEFW p.o.
Group-V: Animals received a dose of 300 mg/kg of MEFW p.o.
Please purchase PDF Split-Merge on www.verypdf.com to remove this watermark.Please purchase PDF Split-Merge on www.verypdf.com to remove this watermark.
Material and Methods
295
Group-VI: Animals received a dose of 300 mg/kg of AEFW p.o.
B. Chronic Anti inflammatory Activity
i. Formalin Induced Paw Oedema12
Albino wistar rats weighing 170-230 g were divided into six groups of six in each
group. All these animals were fasted for 18 hours before the beginning of the experiment
and water was given ad libitum. In animals of all the groups chronic inflammation was
produced by sub plantar injection of 20µl of freshly prepared 2% suspension of formalin
in normal saline in right hind paw of rat was used as the oedematogenic agent. Animals
were treated with drugs for 6 consecutive days.
The paw volume was measured using a plethysmometer before and 6 days after
formalin challenge in each group. The increase in paw volume and percent of inhibition
was calculated.
Group-I: Distilled water will be supplied and served as control.
Group-II: Animals received a dose of 100 mg/kg of Diclofenac sodium i.p. and served
as standard
Group-III: Animals received a dose of 300 mg/kg of HEFW p.o.
Group-IV: Animals received a dose of 300 mg/kg of EAEFW p.o.
Group-V: Animals received a dose of 300 mg/kg of MEFW p.o.
Group-VI: Animals received a dose of 300 mg/kg of AEFW p.o.
Please purchase PDF Split-Merge on www.verypdf.com to remove this watermark.Please purchase PDF Split-Merge on www.verypdf.com to remove this watermark.
Results and Discussion
296
RESULTS AND DISCUSSION
Anti inflammatory Activity
A. Acute Anti inflammatory Activity
i. Formalin-induced paw Oedema in Rats
All the test compounds were tested with the diclofenac sodium as a standard drug
in the dose of 10 mg/kg for the anti-inflammatory activity.
Presently diclofenac sodium showed significant 87.14 % inhibition of
inflammation at 5th
hour (0.18 ± 0.01) when compared with control (1.40 ± 0.05)
respectively.
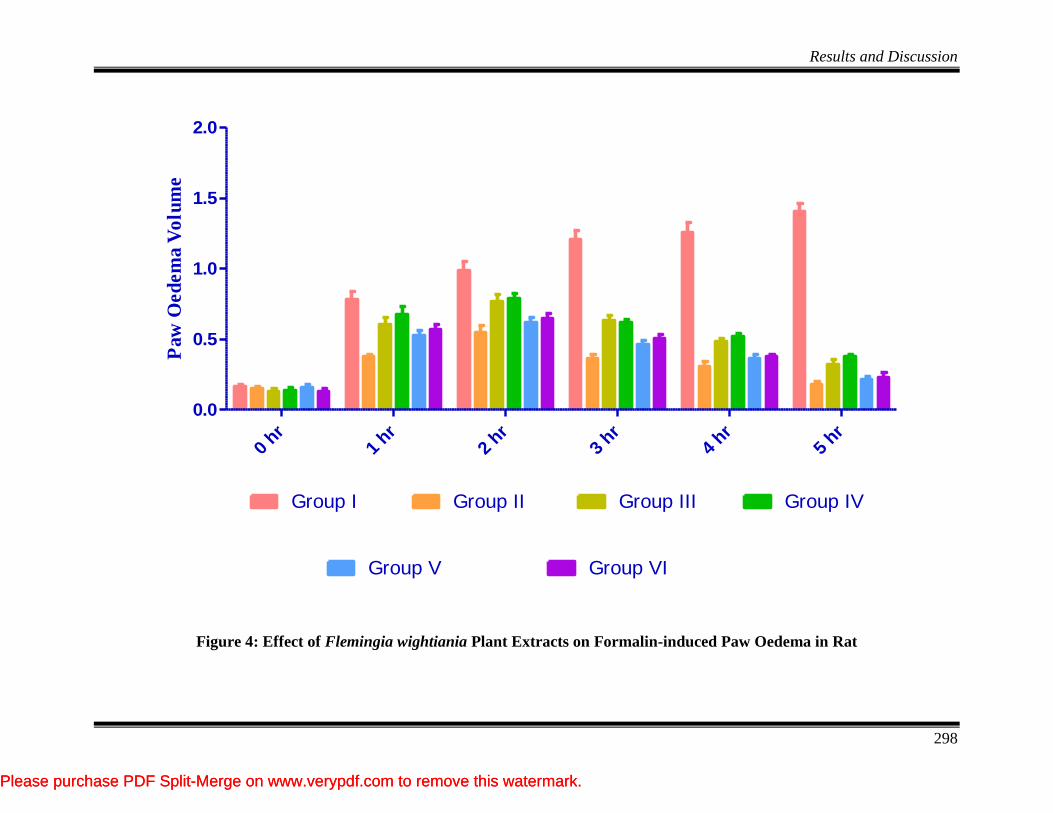
The test compounds showed maximum percentage of inhibition of oedema at 5th
hour significantly in respective dose level i.e., at 300 mg/kg the test compounds HEFW,
EAEFW, MEFW and AEFW showed 77.14%, 73.57 %, 85.00% and 83.57%. The values
are tabulated in the Table 6 and shown in Figure 4.
It is well known that inhibition of formalin-induced pedal oedema in rats is
one of the most suitable test procedures to screen anti-arthritic and anti-inflammatory
agents as it closely resembles human arthritis13
. Injection of formalin subcutaneously
into hind paw of rats produces localized inflammation and pain. The nociceptive
effect of formalin is biphasic, an early neurogenic component followed by a later
tissue mediated response14
. Thus formalin-induced arthritis is a model used for the
evaluation of an agent with probable anti-proliferative activity. This experiment is
associated with the proliferative phase of inflammation. Results with Flemingia
wightiania of HEFW, EAEFW, MEFW and AEFW are showed quite compatible with
those of the standard drug diclofenac sodium. Therefore, the test drug appears to be
effective against formalin-induced arthritis.
Please purchase PDF Split-Merge on www.verypdf.com to remove this watermark.Please purchase PDF Split-Merge on www.verypdf.com to remove this watermark.

Results and Discussion
297
Table 6: Effect of Flemingia wightiania Plant Extracts on Formalin-induced Paw Oedema in Rats
Groups Treatment
0 hr 1hr 2hr 3hr 4 hr 5 hr % Inhibition
Group-I Saline 0.66 ± 0.01 0.78 ± 0.05 0.99 ± 0.05 1.20 ± 0.06 1.25 ± 0.07 1.40 ± 0.05 -
Group-II Diclofenac sodium
(10mg/kg)
0.15 ± 0.01 0.37 ± 0.02*** 0.55 ± 0.04*** 0.36 ± 0.2*** 0.30 ± 0.03*** 0.18 ± 0.01*** 87.14 %
Group-III HEFW
(300mg/kg)
0.13 ± 0.01 0.60 ± 0.04* 0.76 ± 0.05** 0.63 ± 0.03*** 0.48 ± 0.02*** 0.32 ± 0.05*** 77.14%
Group-IV EAEFW
(300mg/kg)
0.14 ± 0.02 0.67 ± 0.06ns 0.79 ± 0.03* 0.61 ± 0.02*** 0.51 ± 0.02*** 0.37 ± 0.01 *** 73.57 %
Group-V MEFW
(300mg/kg)
0.15 ± 0.02 0.52 ± 0.03** 0.61 ± 0.03*** 0.46 ± 0.02*** 0.36 ± 0.02*** 0.21 ±0.02*** 85.00%
Group-VI AEFW
(300mg/kg)
0.13 ± 0.01 0.56 ± 0.03** 0.65 ± 0.03*** 0.50 ± 0.02*** 0.37 ± 0.02*** 0.23 ± 0.03*** 83.57%
Values are Mean ± SEM (n=6) one way ANOVA followed by Dunnett’s test. Where, *** P<0.001, ** P<0.01, * P<0.05 and ns
represents Not significant.
HEFW - n-Hexane extract of Flemingia wightiania
EAEFW - Ethyl acetate extract of Flemingia wightiania
MEEW - Methanolic extract of Flemingia wightiania
AEFW - Aqueous extract of Flemingia wightiania
Please purchase PDF Split-Merge on www.verypdf.com to remove this watermark.Please purchase PDF Split-Merge on www.verypdf.com to remove this watermark.
Results and Discussion
298
0 hr
1 hr
2 hr
3 hr
4 hr
5 hr
0.0
0.5
1.0
1.5
2.0
Group I Group II Group III Group IV
Group V Group VI
Paw
Oed
em
a V
olu
me
Figure 4: Effect of Flemingia wightiania Plant Extracts on Formalin-induced Paw Oedema in Rat
Please purchase PDF Split-Merge on www.verypdf.com to remove this watermark.Please purchase PDF Split-Merge on www.verypdf.com to remove this watermark.
Results and Discussion
299
B. Chronic Anti inflammatory Activity
i. Formalin-induced paw Oedema in Rats
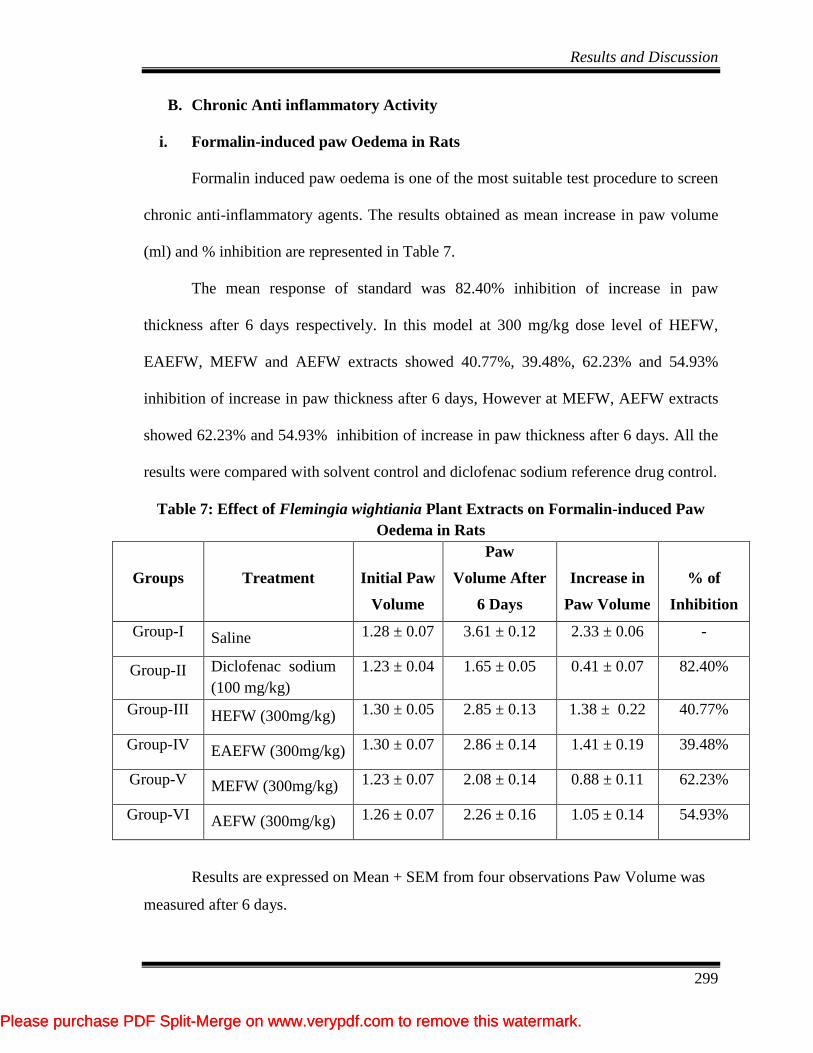
Formalin induced paw oedema is one of the most suitable test procedure to screen
chronic anti-inflammatory agents. The results obtained as mean increase in paw volume
(ml) and % inhibition are represented in Table 7.
The mean response of standard was 82.40% inhibition of increase in paw
thickness after 6 days respectively. In this model at 300 mg/kg dose level of HEFW,
EAEFW, MEFW and AEFW extracts showed 40.77%, 39.48%, 62.23% and 54.93%
inhibition of increase in paw thickness after 6 days, However at MEFW, AEFW extracts
showed 62.23% and 54.93% inhibition of increase in paw thickness after 6 days. All the
results were compared with solvent control and diclofenac sodium reference drug control.
Table 7: Effect of Flemingia wightiania Plant Extracts on Formalin-induced Paw
Oedema in Rats
Groups
Treatment
Initial Paw
Volume
Paw
Volume After
6 Days
Increase in
Paw Volume
% of
Inhibition
Group-I Saline 1.28 ± 0.07 3.61 ± 0.12 2.33 ± 0.06 -
Group-II Diclofenac sodium
(100 mg/kg)
1.23 ± 0.04 1.65 ± 0.05 0.41 ± 0.07 82.40%
Group-III HEFW (300mg/kg) 1.30 ± 0.05 2.85 ± 0.13 1.38 ± 0.22 40.77%
Group-IV EAEFW (300mg/kg) 1.30 ± 0.07 2.86 ± 0.14 1.41 ± 0.19 39.48%
Group-V MEFW (300mg/kg) 1.23 ± 0.07 2.08 ± 0.14 0.88 ± 0.11 62.23%
Group-VI AEFW (300mg/kg) 1.26 ± 0.07 2.26 ± 0.16 1.05 ± 0.14 54.93%
Results are expressed on Mean + SEM from four observations Paw Volume was
measured after 6 days.
Please purchase PDF Split-Merge on www.verypdf.com to remove this watermark.Please purchase PDF Split-Merge on www.verypdf.com to remove this watermark.

Material and Methods
300
EXPERIMENTAL WORK
Material and Methods
Animals Used In Study
Albino wistar rats weighing 150-200 g and Albino mice 20-30 g was procured
from Biogen, Bangalore. They were maintained in the animal house of Gautham College
of Pharmacy. Animals were maintained under controlled condition of temperature at
27 ± 2º C and 12 hour light-dark cycle. They were housed in polypropylene cages and had
a free access to standard pellets (Amruth) and water ad libitum. The animals housing and
handling were in accordance with CPCSEA guidelines.
All the studies conducted were approved by the Institutional Animal Ethical
Committee (IAEC) of Gautham College of Pharmacy, Bangalore, Karnataka. (REF-
IAEC/012/12/2010) according to prescribed guidelines of Committee for the Purpose of
Control and Supervision of Experiments on Animals (Reg No: 491/01/c/CPCSEA), Govt.
of India.
Determination of Acute Toxicity (LD50)15
Animals
Female Albino rats of weighing 150-220 g were used for the study. They were
nulliparous and non-pregnant. These were acclimatized to laboratory condition for one
week prior to start of dosing.
Preparation of Dose
n-Hexane, Ethyl acetate extracts (HEFW, EAEFW) was dissolved in tween 80,
Methanol and Aqueous extracts of Flemingia wightiania (MEFW, AEFW) were
Please purchase PDF Split-Merge on www.verypdf.com to remove this watermark.Please purchase PDF Split-Merge on www.verypdf.com to remove this watermark.
Material and Methods
301
dissolved in saline/water, to prepare a dose of 2000 mg/kg. The doses were selected
according to the OECD guideline No. 425.
Procedure
The procedure was divided into two phases. Phase I (observation made on day
one) and Phase II (observed the animals for next 14 days of drug administration). Two
sets of healthy female rats (each set of 3 rats) were used for this experiment. First set of
animals were divided into three groups, each of one in a group. Animals were fasted
overnight with water ad libitum. Animals received a single dose of 2000 mg/kg was
selected for the test, as the test item was a source from herb. After administration of
extract, food was withheld for 3-4 hours. If the animal dies, conduct the main test to
determine the LD50. If the animal survives, dose four additional animals sequentially so
that a total of five animals are tested. However, if three animals die, the limit test is
terminated and the main test is performed. The LD50 is greater than 2000 mg/kg, if three
or more animals survive. If an animal unexpectedly dies late in the study, and there are
other survivors, it is appropriate to stop dosing and observe all animals to see if other
animals will also die during a similar observation period. Late deaths should be counted
the same as other deaths. The same procedure was repeated with another set of animals to
nullify the errors.
Antidiabetic Activity
A. Single Dose Study in Normal Rats16
Albino wistar rats weighing 150-200 mg/kg were divided into six groups of six in
each group. Animals were fasted overnight for 16 hours prior to the experiment. The
blood glucose levels were measured just prior to and 1, 2, 4, 8, 12 and 24 hours after drug
Please purchase PDF Split-Merge on www.verypdf.com to remove this watermark.Please purchase PDF Split-Merge on www.verypdf.com to remove this watermark.

Material and Methods
302
administration. The blood glucose levels were measured from the tail vein by using
Sugarcheck glucometer manufactured by Wockhardt.
Group-I: Distilled water will be supplied and served as control.
Group-II: Animals received a dose of 5 mg/kg of Glibenclamide p.o. and served as
standard
Group-III: Animals received a dose of 300 mg/kg of HEFW p.o.
Group-IV: Animals received a dose of 300 mg/kg of EAEFW p.o.
Group-V: Animals received a dose of 300 mg/kg of MEFW p.o.
Group-VI: Animals received a dose of 300 mg/kg of AEFW p.o.
B. Oral Glucose Tolerance Test in Normal Rats (OGTT) 17
The oral glucose tolerance test was performed in rats weighing 150-200 g. The
animals were fasted for 16 hr before the experiment but allowed free access to water.
These Rats were divided into six groups, six in each group. Rats of all groups were
loaded with glucose 2 g/kg p.o 30 minutes after drug administration. Blood samples were
collected from the tail vein prior to drug administration and at 1, 2 and 3 hour of glucose
administration.
Group-I: Animals received distilled water and after 30 minutes a glucose load of
2 g/kg is administered p.o. which was served as control.
Group-II: Animals received a dose of 5 mg/kg of Glibenclamide p.o. and after 30
minutes a glucose load of 2 g/kg is administered p.o which was served as standard.
Group-III: Animals received a dose of 300 mg/kg of HESP p.o. and after 30 minutes a
glucose load of 2 g/kg is administered p.o.
Please purchase PDF Split-Merge on www.verypdf.com to remove this watermark.Please purchase PDF Split-Merge on www.verypdf.com to remove this watermark.
Material and Methods
303
Group-IV: Animals received a dose of 300 mg/kg of EAEFW p.o. and after 30
minutes a glucose load of 2 g/kg is administered p.o.
Group-V: Animals received a dose of 300 mg/kg of MEFW p.o. and after 30 minutes a
glucose load of 2 g/kg is administered p.o.
Group-VI: Animals received a dose of 300 mg/kg of AEFW p.o. and after 30 minutes
a glucose load of 2 g/kg is administered p.o.
C. Effect of Extracts in Streptozotocin Induced Diabetic Rats18, 19
Substances used in study
Streptozotocin (Sigma-Aldrich laboratories)
Citrate buffer pH 4.5 (I.P)
Unless otherwise specified all the chemicals and reagents used are of analytical
grade.
Preparation of Streptozotocin (STZ) Solution
STZ was dissolved in ice-cold citrate buffer of pH 4.5 and a single intraperitoneal
injection was administered within five minutes to avoid degradation.
Preparation of Buffers and Solutions
Preparation of Citrate Buffer
Solution-A was prepared by dissolving 1.92 g of Citric Acid in 100 ml of distilled water
to give 0.1 M citric acid solution.
Solution-B was prepared by dissolving 2.94 g of Tri-sodium Citrate in 100 ml of distilled
water to give 0.1M Sodium citrate solution.
Please purchase PDF Split-Merge on www.verypdf.com to remove this watermark.Please purchase PDF Split-Merge on www.verypdf.com to remove this watermark.
Material and Methods
304
To 28 ml of solution-A, 22 ml of solution-B was added and diluted to 100 ml with
distilled water to give citrate buffer of pH 4.4. The pH of this solution was adjusted to 4.5
with 0.1 M sodium citrate solution.
Experimentally Induced Diabetes Mellitus20
Female Wistar rats weighing 150-200 g were used for this study. The animals
were overnight fasted for 16 hours before the induction of diabetes. Diabetes was induced
by a single dose of 45 mg/kg body weight of streptozotocin by intraperitoneal route.
After a period of 3 days blood glucose levels were checked by snipping the tail of STZ
treated fasted rats. Rats showing the blood glucose levels more than 300 mg/dl is taken
into the study21
.
Experimental Procedure
Diabetes was induced in fasted female Albino wistar rats (150-200g) by intraperitoneal
injection of 45mg/kg body weight of STZ except Group I. After 72 hours, animals with
fasting blood glucose levels higher than 300 mg/dl were selected and used.
Group-I: Animals received distilled water only and served as normal control.
Group-II: Animals received distilled water only and served as diabetic control
Group-III: Animals received a dose of 5 mg/kg of Glibenclamide p.o. and served as
standard
Group-IV: Animals received a dose of 300 mg/kg of HEFW p.o.
Group-V: Animals received a dose of 300 mg/kg of EAEFW p.o.
Group-VI: Animals received a dose of 300 mg/kg of MEFW p.o.
Group-VII: Animals received a dose of 300 mg/kg of AEFW p.o.
Please purchase PDF Split-Merge on www.verypdf.com to remove this watermark.Please purchase PDF Split-Merge on www.verypdf.com to remove this watermark.
Material and Methods
305
The study was carried out for 21 days. Fasting blood glucose levels were
measured before the administration of extracts. It was recorded as 0 day. The doses of
the extracts (n-Hexane, Ethyl acetate, Methanol and Aqueous) along with the standard
(Glibenclamide) were given daily to the animals for 21 days. The blood glucose levels
were checked on 0, 7, 14 and 21 day of the treatment period. Blood was collected from
snipping of the rat tail. Blood glucose levels were measured by using the glucometer
Sugarcheck.
Analytical Method Used in the Study
Collection of Blood and Serum Samples:
At the end of the experiment blood was collected by cardiac puncture from each
rat under mild ether anaesthesia. Some part of blood samples were used for the estimation
of haemoglobin levels and remaining was allowed to clot for 30 minutes at room
temperature and they were centrifuged at 3000 rpm for 10 minutes. The serum was used
for the study of biochemical parameters.
Collection of Tissue:
The animals were scarified pancreas and liver were collected. Pancreas was used
for the histopathological study and liver was used for the estimation of SOD, GSH and
TBARS.
Physical Parameters:
A. Determination of Body Weight:
Body weight of the entire animal in each group was noted on the 0, 7, 14 and 21
day of the experiment period. The weight difference was calculated.
Please purchase PDF Split-Merge on www.verypdf.com to remove this watermark.Please purchase PDF Split-Merge on www.verypdf.com to remove this watermark.
Material and Methods
306
B. Determination of Wet Liver Weight:
Animals were sacrificed and livers were isolated and washed with saline and
weights determined by using an electronic balance. The liver weights were expressed
with respect to its body weight i.e. gm/100gm.
Estimation of Biochemical Parameters
A. Estimation of Serum Albumin Levels22,23
Principle
Albumin binds with Bromocresol green (BCG) at pH 4.2 causing a shift in
absorbance of the yellow BCG dye. The blue green colour formed is proportional to the
concentration of albumin present, when measured photometrically between 580-630 nm
with maximum absorbance at 625 nm.
Albumin + Bromocresol Green Green albumin BCG complex
Procedure:
Pipette into tubes marked Blank Standard Test
Albumin Reagent 1000μl 1000µl 1000μl
Distilled Water 10µl -- --
Standard -- 10μl --
Test -- -- 10µl
Mix well, read the absorbance of standard and each test at 630 nm (580-630 nm) against
reagent blank, after one minute incubation at 37 ºC.
Calculation:
Albumin (g/dl) = l
Please purchase PDF Split-Merge on www.verypdf.com to remove this watermark.Please purchase PDF Split-Merge on www.verypdf.com to remove this watermark.

Material and Methods
307
B. Estimation of Serum Urea24,25
Principle
Urease breaks down urea into ammonia and carbon dioxide in alkaline medium.
Ammonia liberated from the breakdown of urea reacts with hypochlorite and salicylate to
form dicarboxyindophenol. This reaction is catalysed by the presence of Nitroprusside.
The intensity of the colour produced by the reaction is directly proportional to
concentration of urea present in the sample and it is measured photometrically at 600 nm.
(600 - 630 nm.)
Reaction:
Urea + H2O 2NH3 + CO2
NH3 + Salicylate + CIO 2, 2 dicarboxylindophenol
Procedure:
Reagent Blank Standard Test
Working reagent 1 ml 1ml 1ml
Standard - 10µl -
Sample - - 10µl
Mix well and incubate 37 ºC For 5 min.
Step 2
Reagent 2
1ml 1ml 1ml
Mix well and incubate at 37 ºC for 5 minutes. Measure the absorbance of standard
and sample against the reagent blank at 600 nm (580-630 nm) within 60 minutes.
Calculation:
Urea Conc. =
Sodium
Nitroprusside
Urease
e
Please purchase PDF Split-Merge on www.verypdf.com to remove this watermark.Please purchase PDF Split-Merge on www.verypdf.com to remove this watermark.
Material and Methods
308
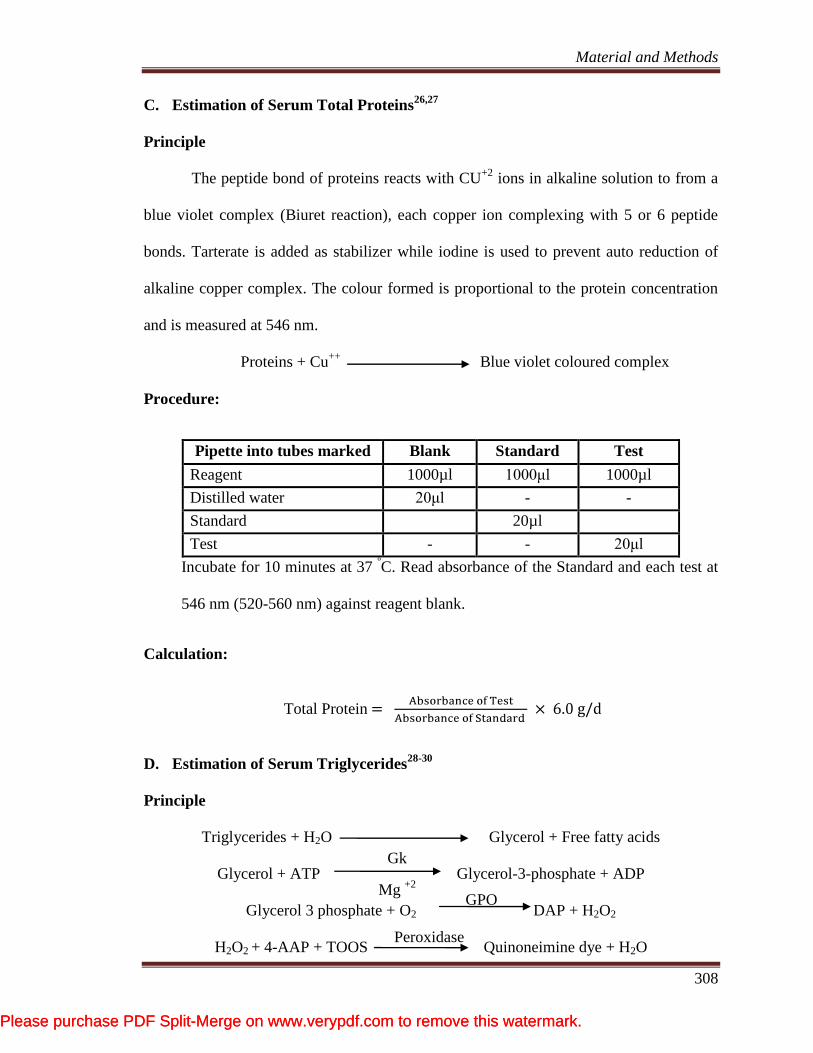
C. Estimation of Serum Total Proteins26,27
Principle
The peptide bond of proteins reacts with CU+2
ions in alkaline solution to from a
blue violet complex (Biuret reaction), each copper ion complexing with 5 or 6 peptide
bonds. Tarterate is added as stabilizer while iodine is used to prevent auto reduction of
alkaline copper complex. The colour formed is proportional to the protein concentration
and is measured at 546 nm.
Proteins + Cu++
Blue violet coloured complex
Procedure:
Pipette into tubes marked Blank Standard Test
Reagent 1000µl 1000μl 1000µl
Distilled water 20μl - -
Standard 20µl
Test - - 20μl
Incubate for 10 minutes at 37 ºC. Read absorbance of the Standard and each test at
546 nm (520-560 nm) against reagent blank.
Calculation:
Total Protein
D. Estimation of Serum Triglycerides28-30
Principle
Triglycerides + H2O Glycerol + Free fatty acids
Glycerol + ATP Glycerol-3-phosphate + ADP
Glycerol 3 phosphate + O2 DAP + H2O2
H2O2 + 4-AAP + TOOS Quinoneimine dye + H2O
Gk
Mg +2
GPO
Peroxidase
Please purchase PDF Split-Merge on www.verypdf.com to remove this watermark.Please purchase PDF Split-Merge on www.verypdf.com to remove this watermark.

Material and Methods
309
Procedure:
Pipette in tubes marked Blank Standard Test
Working reagent 1000μl 1000μl 1000µl
Distilled water 10μl -- --
Standard -- 10µl --
Sample -- -- 10µl
Mix and incubate for 10 mins at 37 ºC read the absorbance of standard and
each sample at 546/670 nm on bichromatic analyzers against reagent blank.
Calculation:
Triglycerides (mg/dl) = )
E. Estimation of Serum Cholesterol31-33
Principle
The cholesterol esters are hydrolysed by enzyme cholesterol esterase to give free
cholesterol and fatty acid molecules. This free cholesterol gets oxidized in presence of
cholesterol oxidase to liberate cholset-4-en-3-one and H2O2. Liberated H2O2 by this
reaction combines with phenol and 4 aminoantipyrine in presence of peroxidase to form
red colour quinonimine complex, the intensity of which is measured at 505 nm. (490-
530) it is directly proportional to cholesterol conc. present in sample.
Reaction:
Cholesterol esters + H2O Cholesterol +fatty acids
Cholesterol + O2 Choles-4-en-3-one + H2O2
2H2O2 + Phenol + 4- Amino antipyrine Quinoneimine +4H2O
Cholesterol Estarase
Cholesterol Oxidase
Esterase Peroxidase
Please purchase PDF Split-Merge on www.verypdf.com to remove this watermark.Please purchase PDF Split-Merge on www.verypdf.com to remove this watermark.

Material and Methods
310
Procedure:
Reagents Blank Standard Test
Enzyme reagent 1ml 1ml 1ml
Standard - 10µl -
Sample - - 10µl
Mix well and incubate for 5 minutes at 37 ºC. Mix well and measure the absorbance
of standard and test against the reagent blank at 505 nm (490-530).
Calculation:
Cholesterol Conc. (mg/dl) =
F. Estimation of Serum HDL- Cholesterol
Preparation:
Take 0.5 ml of serum/plasma in to glass tube. Add 50 µl precipitating reagent.
Mix well, leave it at R.T. For 10 minutes. Centrifuge at 3000 r.p.m. for 10 minutes. Take
the clear Supernatant for HDL Cholesterol estimation.
Procedure:
Reagents Blank Standard Test
Enzyme reagent 1ml 1ml 1ml
Standard - 10µl -
Supernatant Sample - - 10µl
Mix well and incubate for 5 minutes at 37 ºC Measure the absorbance of HDL and
Std. at 510 nm.
Calculation:
HDL Cholesterol mg % =
Please purchase PDF Split-Merge on www.verypdf.com to remove this watermark.Please purchase PDF Split-Merge on www.verypdf.com to remove this watermark.
Material and Methods
311
Low density lipoprotein (LDL) and very low density lipoprotein (VLDL) values
were calculated by using Friedewalds formula as given below102
.
VLDL= TG/5
LDL= TC – (HDL + VLDL)
G. Estimation of Haemoglobin Levels34
Principle
Haemoglobin levels are estimated by using a simple method described by
Sahali’s. The haemoglobin contained in a known quantity of blood is converted into acid
haematin by means of HCl. This colour is then compared with a standard tube containing
acid haematin.
Haemoglobin + 0.1 N HCl Acid haematin
Procedure
Place 5 drops of 0.1N HCl in the graduated tube (Shale tube) and place it beside
the colour comparator. Pipette out the blood with the help of micropipette up to the mark
20 mm. transfer it immediately into the graduated tube mix it well. Add distilled water,
drop by drop, each time mixing the solution with the stirring rod. Keep adding water and
mixing until the colour of the solution matches the standard on either side. It is compared
under the natural light. Note the readings on the tube.
Estimation of Antioxidant Activity
Livers of the animals were homogenized with ice-chilled 10% Phosphate buffer
and centrifuge at 2000 rpm to 10 minutes. The supernatant liquid is used for the
estimation of following parameters.
Please purchase PDF Split-Merge on www.verypdf.com to remove this watermark.Please purchase PDF Split-Merge on www.verypdf.com to remove this watermark.
Material and Methods
312
A. Superoxide Dismutase Levels35
Principle
The enzyme is necessary for survival in all oxygen metabolizing cells. It is found
in the cytosol and inter membrane space of mitochondria of eukaryotic cells. It contains
copper and zinc. In normal cells, this radical alone is the precursor of hydrogen peroxide.
Superoxide dismutase scavenges the super oxide (O-2
) and thus provides a first
line defense against free radical damage. SOD’s are a family of metalloenzyme that
catalyze the dismutation of super oxide anion (O-2
) to hydrogen peroxide and molecular
oxygen in the following manner.
2H2O2 + 2O- → 2H2O + O2.
In the erythrocytes, the super oxide anion (O-2
) interacts with peroxides to form
hydroxyl radicals (OH-), which causes heamolyses in the absence of SOD activity. SOD
measurement was carried out on the ability of SOD to inhibit spontaneous oxidation of
epinephrine to adrenochrome.
Procedure
0.2 ml of the supernatant was added to 2.5 ml of 0.05M carbonate buffer
(pH 10.2) equilibrated in the spectrophotometer for 2-3 minutes. The reaction was then
initiated by the addition of 0.3 ml of freshly prepared 0.3 mM adrenaline as substrate to
the buffered-supernatant mixture which was quickly mixed by inversion and the
absorbance taken. The reference corvette contained 2.5 ml of the carbonate buffer, 0.3 ml
of the substrate and 0.2 ml of distilled water. The increase in absorbance at 420 nm due to
the adenochrome formed was monitored every 30 seconds for 120 seconds. 1 unit of
SOD activity was given as the amount of SOD necessary to cause 50% inhibition of the
Please purchase PDF Split-Merge on www.verypdf.com to remove this watermark.Please purchase PDF Split-Merge on www.verypdf.com to remove this watermark.
Material and Methods
313
auto-oxidation of adrenaline to adenochrome during 120 seconds. The results are
expressed as unit (U) of SOD activity per mg of tissue.
Calculation
SOD=
Unit: Units/ mg Protein.
B. Thiobarbituric Acid Reactive Substances Assay36
Procedure
The assay is based on the reaction of thiobarbituric acid (TBA) with
malondialdehyde (MDA), a breakdown product derived from many oxidized molecules.
The resulting chromogen formed is measured at its absorbance maximum 532 nm.
Briefly, to a test tube containing 0.1 ml homogenate, 1 ml of TBA reagent containing
equal proportions of 0.375% TBA, 15% TCA and 0.25 N HCl was added and placed in a
boiling water bath for 30 minutes. Then the mixture was placed in crushed ice for
10 minutes followed by centrifugation at 6000 rpm for 5 minutes. The absorbance of the
clear pink color supernatant was measured at 532 nm against appropriate blank. TBARS
concentrations of the samples were calculated using the extinction co-efficient of MDA
which is 1.56×10⁵mmol
−1cm
−1 as 99% of TBARS is MDA.
Calculation
LPO= -
Unit: nmol MDA / min X mg protein.
Please purchase PDF Split-Merge on www.verypdf.com to remove this watermark.Please purchase PDF Split-Merge on www.verypdf.com to remove this watermark.
Material and Methods
314
C. Glutathione Estimation37
GSH + DNTB GS-TNB + TNB.
The assay is based on the principle of Ellman’s reaction. The sulfhydryl group of
glutathione reacts with DTNB (5,5’-dithiobis-2-nitrobenzoic acid) and produces a yellow
coloured 5-thio-2-nitrobenzoic acid (TNB). Measurement of the absorbance of TNB at
412nm provides an accurate estimation of glutathione in a sample. Briefly, 0.5ml of
homogenate is mixed with 0.1 ml of 25% TCA to precipitate proteins and centrifuged at
4000 rpm for 5 minutes. Then 0.3 ml of the supernatant was mixed with 0.5 ml of 0.1M
phosphate buffer (pH 7.4) and 0.2ml of 10 mM DTNB. This mixture was incubated for
10 minutes and the absorbance was measured at 412 nm against appropriate blanks. The
extinction coefficient (εmM
) for TNB is 14.15.
Enzyme in units/ml =-
Histopathological Study38
Processing of Isolated Pancreas
The animals were sacrificed and the pancreas of each animal was isolated. The
isolated pancreas was cut into small pieces and preserved and fixed in 10% formalin for
two days. Following this was the washing step where by the pancreas pieces were washed
in running water for about 12 hours. This was followed by dehydration with isopropyl
alcohol of increasing strength (70%, 80% and 90%) for 12 hours each. Then the final
dehydration is done using absolute alcohol with about three changes for 12 hours each.
The clearing was done by using chloroform with two changes for 15 to 20
minutes each. After clearing, the pancreas pieces were subjected to paraffin infiltration in
automatic tissue processing unit.
Please purchase PDF Split-Merge on www.verypdf.com to remove this watermark.Please purchase PDF Split-Merge on www.verypdf.com to remove this watermark.
Material and Methods
315
The pancreas pieces were washed with running water to remove formalin
completely. To remove the water, alcohol of increasing strengths was used since it is a
dehydrating agent. Further alcohol was removed by using chloroform and chloroform
removed by paraffin infiltration.
Embedding in Paraffin Vacuum:
Hard paraffin was melted and the hot paraffin was poured into L-shaped blocks.
The pancreas pieces were then dropped into the molten paraffin quickly and allow
cooling.
Sectioning:
The blocks were sectioned by using microtome to get sections of thickness of 5 .
The sections were taken on a micro slide on which a egg albumin (sticking substance)
was applied. The sections were allowed to remain in an oven at 60 ºC for 1 hour. Paraffin
melts and egg albumin denatures, thereby fixes tissues to slide.
Staining:
Eosin is an acid stain. Hence it stains all the cell constituents pink which are basic
in nature, eg: Cytoplasm. Haematoxylin basic stain which stains all the acidic cell
components blue eg: DNA in the nucleus.
Procedure:
1. Deparaffinized the sections by washing with chloroform for about 15 minutes.
2. Hydrate the sections by washing in isopropyl alcohol of decreasing strength
(100%, 90%, 80% and 70%).
3. Finally washed with water.
4. Stained with haematoxylin for 15 minutes.
Please purchase PDF Split-Merge on www.verypdf.com to remove this watermark.Please purchase PDF Split-Merge on www.verypdf.com to remove this watermark.

Material and Methods
316
5. Rinsed in tap water.
6. Differentiated in 1% acid alcohol by 10 quick dips. Checked the differentiation
with a microscope. Nuclei were distinct and the back ground was very light (or
colourless).
7. Washed in tap water.
8. Dipped in (Lithium carbonate) until sections become bright blue (3-5 dips).
9. Washed in running tap water for 10 to 20 minutes, if washing is inadequate eosin
will not stain evenly.
10. Stained with eosin for 15 seconds – 2 minutes depending on the age of the eosin
and the depth of the counter stain desired. For even staining results, dip slides
several times before allowing them to set in the eosin for the desired time.
11. Dehydrated in 95% isopropyl and absolute isopropyl alcohol until excess eosin is
removed, 2 changes of 2 minutes each (check under microscope).
12. An absolute isopropyl alcohol 2 changes of 3 minutes each.
13. Chloroform 2 changes of 2 minutes each.
14. Mounted in DPX (Desterene dibutyl phthalate xylene).
Results:
Nuclei - Blue colour
Cytoplasm - Various shades of pink identifying different tissue components.
All the sections of the tissues were examined under microscope for the analyzing
the altered architecture of the pancreas tissue due to Streptozotocin treatment and
improved pancreas architecture due to pretreatment with test extracts and standard drug.
Please purchase PDF Split-Merge on www.verypdf.com to remove this watermark.Please purchase PDF Split-Merge on www.verypdf.com to remove this watermark.
Material and Methods
317
Statistical Analysis:
The values are expressed as Mean ± SEM. The data was analysed by using one
way ANOVA followed by Dunnett’s test using Graph pad prism software. Statistical
significance was set at P ≤ 0.05.
Please purchase PDF Split-Merge on www.verypdf.com to remove this watermark.Please purchase PDF Split-Merge on www.verypdf.com to remove this watermark.
Results and Discussion
318
RESULTS AND DISCUSSION
Acute Toxicity Studies (LD50)
In both phase I and Phase II procedures, none of the animals show any toxicity
upon the single administration of HEFW, EAEFW, MEFW and AEFW (2000 mg/kg).
Hence the procedure is repeated by increasing the dose of extracts (3000 mg/kg). None of
the animals had shown any toxicity. Thus, 1/10th
of maximum dose (300 mg/kg) tested
was selected for the present study.
Anti diabetic activity
Single Dose Study in Normal Rats
Hypoglycaemic activity of HEFW, EAEFW, MEFW and AEFW were studied on
normal rats and the results were tabulated in Table 8 and showed in Figure 5.
HEFW shows its action at time interval of 2 and 4 hour (P<0.05) and a much
reduced activity at the time interval of 8, 12, 24 hours (P <0.01). But it has no significant
activity at the time interval of 1st hour.
EAEFW shows its action at time interval 4, 8 and 12th
hr (P<0.05) and a much
reduced activity at the time interval 24 hr (P <0.01). But it has no significant activity at
the time interval of 1st and 2
nd hours when compared to control.
MEFW shows a significant reduction in the blood glucose levels at 2, 4, 8, and 12
and 24 hours, onset of action is shown at 1hr after the treatment. Less significant
reduction in blood glucose levels was shown at 1st hour (P<0.05). A maximum blood
glucose reduction was shown at 24th
hour (P<0.001) compared to the normal untreated
group.
AEFW shows a significant action in reducing the blood glucose levels at the time
interval of 2 hour (P<0.05) after the treatment. Less significant reduction in blood
Please purchase PDF Split-Merge on www.verypdf.com to remove this watermark.Please purchase PDF Split-Merge on www.verypdf.com to remove this watermark.

Results and Discussion
319
glucose levels was shown at 4th
hour (P<0.01). It also show a marked decrease in the 8,
12 and 24 hours (P<0.001). But it has no significant activity at the time interval of 1 hour
when compared to control.
Glibenclamide showed it effect from 1 hour after treatment the onset of
Glibenclamide starts from 1 hour after the treatment. It reduces maximum blood glucose
levels at 12 hours (P<0.001). Glibenclamide significantly reduced the blood glucose
levels after treatment in normal rats. All the blood glucose levels of treated group were
compared with the normal control group animals.
Single dose study for 24 hours was carried out in normoglycemic rats. MEFW and
AEFW showed maximum decrease in blood glucose levels at 24th
hour compared to
normal group. MEFW also showed a significant decrease from the 1st hour of the drug
administration. AEFW showed a significant decrease in blood glucose level at 24th
hour
compared to normal levels. It also showed its activity from the 2nd
hour after the drug
administration when compared with the normal control.
Glibenclamide (5mg/kg) showed a maximum decrease of blood glucose levels in
normoglycemic rats at 24th
hour of our study. But HEFW and EAEFW did not show its
effect for 24 hours when compared with the normal rats. It may produce hypoglycemia in
normal animals by stimulating the pancreatic beta-cells to produce more insulin and by
increasing the glycogen deposition in the liver39
.
Please purchase PDF Split-Merge on www.verypdf.com to remove this watermark.Please purchase PDF Split-Merge on www.verypdf.com to remove this watermark.

Results and Discussion
320
Table 8: Effect of Flemingia wightiania Plant Extracts on Blood Glucose Levels on Single Dose Study in Normal Rats
Groups Treatment Blood Glucose Levels (mg/dl)
0 1 2 4 8 12 24
Group-I Saline 94.33 ± 3.63 94.33 ± 4.08 91.50 ± 2.79 89.67 ± 2.29 84.67 ± 3.93 81.33 ±
3.11
78.83 ±
2.04
Group-II Glibenclamide
(5mg/kg) 89.50 ± 4.53
72.50 ±
1.97***
54.17 ±
4.96***
56.83 ±
2.35***
46.50 ±
4.27***
47.33 ±
4.12***
43.00 ±
4.12***
Group-III HEFW
(300mg/kg) 84.17 ± 3.88 82.67 ± 3.77
ns 76.33 ± 3.91* 77.00 ± 2.87*
69.00 ±
1.31**
65.83 ±
2.1**
63.00 ±
2.35**
Group-IV EAEFW
(300mg/kg) 82.67 ± 2.96 82.00 ± 1.48
ns 85.67 ± 4.49
ns 78.83 ± 2.57*
73.00 ±
2.80*
69.00 ±
2.62*
61.50 ±
2.62**
Group-V MEFW
(300mg/kg) 82.33 ± 4.89 79.17 ± 3.76*
71.33 ±
2.43**
68.67 ±
2.57***
63.33 ±
2.18***
60.67 ±
1.85***
58.67 ±
1.54***
Group-VI AEFW
(300mg/kg) 86.83 ± 5.90 81.50 ± 4.93
ns 76.17 ± 4.14* 73.83 ± 3.91**
66.67 ±
2.43***
63.33 ±
2.43***
59.33 ±
2.30***
Values are Mean ± SEM (n=6) one way ANOVA followed by Dunnett’s test. Where, *** P<0.001, ** P<0.01, * P<0.05 and
ns represents Not significant.
HEFW - n-Hexane extract of Flemingia wightiania
EAEFW - Ethyl acetate extract of Flemingia wightiania
MEEW - Methanolic extract of Flemingia wightiania
AEFW - Aqueous extract of Flemingia wightiania
Please purchase PDF Split-Merge on www.verypdf.com to remove this watermark.Please purchase PDF Split-Merge on www.verypdf.com to remove this watermark.

Results and Discussion
321
Fastin
g1
hr2
hr4
hr8
hr
12 h
r
24 h
r
0
50
100
150
Group I Group II Group III Group IV
Group V Group VI
Time in Hours
Blo
od
Glu
cose
Lev
els
(mg
/dl)
Figure 5: Effect of Flemingia wightiania Plant Extracts on Blood Glucose Levels on Single Dose Study in Normal Rats
Please purchase PDF Split-Merge on www.verypdf.com to remove this watermark.Please purchase PDF Split-Merge on www.verypdf.com to remove this watermark.
Results and Discussion
322
Oral Glucose Tolerance Test in Normal Rats
The effect of HEFW, EAEFW, MEFW and AEFW on glucose tolerance test was
tabulated in the Table 9 and shown in Figure 6.
HEFW show a significant decrease in blood glucose levels, when administration
30 minutes before glucose loading. It showed a significant activity at the time intervals of
2 and 3 hour (P< 0.01). Significant reduction was more at 3rd
hour when compared with
the 2nd
hour.
Most significant decrease in blood glucose levels was observed when the MEFW
was administered 30 minutes before glucose loading. Where as a most significant
reduction was more at 3rd
hour (P<0.001) when compared with the 1 and 2nd
hour.
Where as AEFW also show a significant decrease blood glucose levels, when
administration 30 minutes before glucose loading. It showed a very less significant
activity at the time intervals of 1and 2nd
hour (P< 0.01) when compared with 3rd
hour (P<
0.001).
But EAEFW showed a much reduced activity (P<0.05) compare with the
Methanol, Aqueous and n-Hexane extract. It showed its effect at 30 minutes after glucose
administration.
Glibenclamide showed its potent antidiabetic activity in normal rats it bring backs
the elevated blood glucose levels to normal levels compared to normal control group at
3rd
hour (P<0.001).
Overall the different extracts of Flemingia wightiania had showed a significant
decrease in the blood glucose levels when compared with the normal control group rats at
time intervals 1, 2 and 3rd
hour.
Please purchase PDF Split-Merge on www.verypdf.com to remove this watermark.Please purchase PDF Split-Merge on www.verypdf.com to remove this watermark.

Results and Discussion
323
Oral glucose tolerance test was studied on the normal rats. The lowering of
glucose can be better seen in assay of glucose tolerance40
. The fasting blood glucose
levels decreases in glibenclamide, MEFW and AEFW treated rats. HAFW and EAEFW
shows a reduced activity. Such a phenomenon was already seen in the indigenous plants
and reported41,42
. The lowering of glucose levels is may be due to the inhibition of
intestinal absorption, or it may act by potentiating the secretion of insulin and by increase
in the utilization of glucose levels in muscles43
.
Please purchase PDF Split-Merge on www.verypdf.com to remove this watermark.Please purchase PDF Split-Merge on www.verypdf.com to remove this watermark.
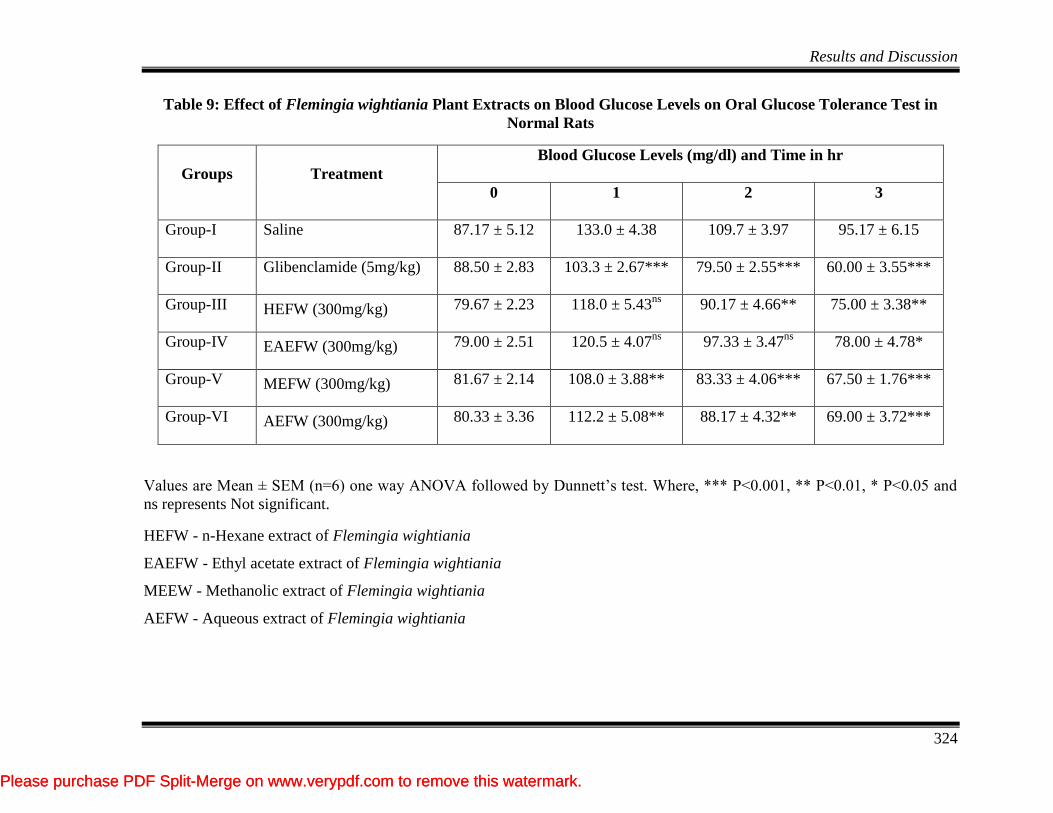
Results and Discussion
324
Table 9: Effect of Flemingia wightiania Plant Extracts on Blood Glucose Levels on Oral Glucose Tolerance Test in
Normal Rats
Groups Treatment
Blood Glucose Levels (mg/dl) and Time in hr
0 1 2 3
Group-I Saline 87.17 ± 5.12 133.0 ± 4.38 109.7 ± 3.97 95.17 ± 6.15
Group-II Glibenclamide (5mg/kg) 88.50 ± 2.83 103.3 ± 2.67*** 79.50 ± 2.55*** 60.00 ± 3.55***
Group-III HEFW (300mg/kg) 79.67 ± 2.23 118.0 ± 5.43ns
90.17 ± 4.66** 75.00 ± 3.38**
Group-IV EAEFW (300mg/kg) 79.00 ± 2.51 120.5 ± 4.07ns
97.33 ± 3.47ns
78.00 ± 4.78*
Group-V MEFW (300mg/kg) 81.67 ± 2.14 108.0 ± 3.88** 83.33 ± 4.06*** 67.50 ± 1.76***
Group-VI AEFW (300mg/kg) 80.33 ± 3.36 112.2 ± 5.08** 88.17 ± 4.32** 69.00 ± 3.72***
Values are Mean ± SEM (n=6) one way ANOVA followed by Dunnett’s test. Where, *** P<0.001, ** P<0.01, * P<0.05 and
ns represents Not significant.
HEFW - n-Hexane extract of Flemingia wightiania
EAEFW - Ethyl acetate extract of Flemingia wightiania
MEEW - Methanolic extract of Flemingia wightiania
AEFW - Aqueous extract of Flemingia wightiania
Please purchase PDF Split-Merge on www.verypdf.com to remove this watermark.Please purchase PDF Split-Merge on www.verypdf.com to remove this watermark.
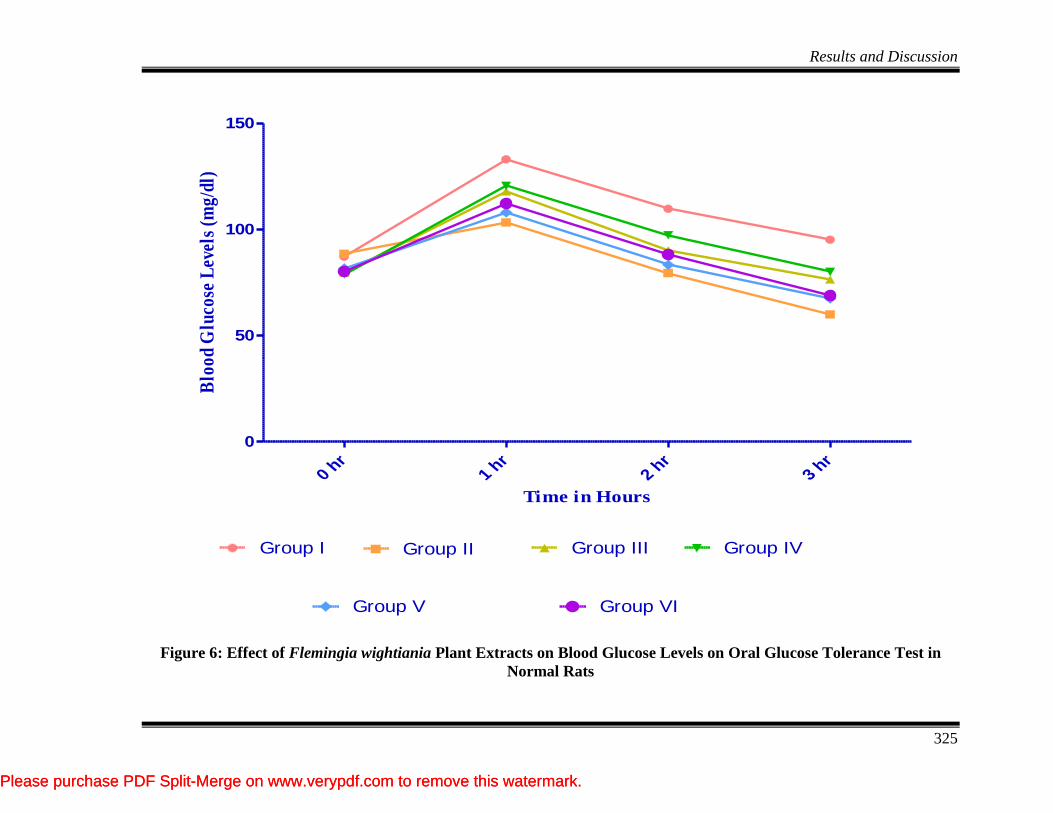
Results and Discussion
325
0 hr
1 hr
2 hr
3 hr
0
50
100
150
Group I Group II Group III Group IV
Group V Group VI
Time in Hours
Blo
od
Glu
cose
Lev
els
(mg
/dl)
Figure 6: Effect of Flemingia wightiania Plant Extracts on Blood Glucose Levels on Oral Glucose Tolerance Test in
Normal Rats
Please purchase PDF Split-Merge on www.verypdf.com to remove this watermark.Please purchase PDF Split-Merge on www.verypdf.com to remove this watermark.

Results and Discussion
326
Effect of Extracts in Streptozotocin Induced Diabetic Rats
A chronic study of 21 days was done in STZ induced diabetic rats with Flemingia
wightiania plant extracts and the results of blood glucose levels are tabulated in the
Table 10 and they are also shown in Figure 7.
Blood glucose levels on day zero showed no significant intra group variation.
Administration of streptozotocin (45 mg/kg, i.p.) in 0.01M citrate buffer (pH 4.5) showed
a significant increase in fasting blood glucose levels (387.2 ± 28.41mg/dl). After 21 days,
diabetic control rats exhibited significantly higher blood glucose levels (331.7 ± 10.19
mg/dl) as compared to the normal control rats (106.0 ± 5.13 mg/dl).
Diabetic rats treated with the HEFW also shown a significant activity when
compared with the diabetic control rats. Blood glucose levels on 21 day was 159.8 ±
11.47 which is less when compared with the initial blood glucose level 392.8 ± 25.04 on
0 day of treatment.
Diabetic rats treated with a MEFW for 21 days lowers the blood glucose levels
from 392.3 ± 17.28 to 123.5 ± 5.23 (P<0.001). It also shows a significant activity in
decreasing the blood glucose levels on 7th
and 14th
day. (317.8 ± 13.52 and 218.0 ± 9.76).
Similarly diabetic rats treated with the AEFW also shown a significant activity
when compared with the diabetic control rats. Blood glucose levels on 21 day was 133.0
± 9.14 which is less when compared with the initial blood glucose level 376.8 ± 16.45 on
0 day of treatment.
A daily treatment of EAEFW for a period of 21 days lowers the blood glucose
levels in diabetic treated rats. Blood glucose levels on 7th
and 14th
day (341.2 ± 9.76 and
Please purchase PDF Split-Merge on www.verypdf.com to remove this watermark.Please purchase PDF Split-Merge on www.verypdf.com to remove this watermark.
Results and Discussion
327
270.2 ± 12.75 respectively) of treatment also show a significant reduce in blood glucose
levels when compared with the diabetic control group of animals.
Glibenclamide showed its potent antidiabetic activity and reduced the blood
glucose levels of diabetic rats to the level significantly (399.8 ± 25.04 to 109.0 ± 6.14) at
day 21. It elevated blood glucose levels on 7th
and 14th
day were 294.0 ± 23.90 and 194.0
± 13.06 respectively. Which is having a high significant activity P<0.001.
Streptozotocin (STZ), a broad spectrum antibiotic has been widely used for
inducing the diabetes mellitus in animals. STZ enters the β-cell via a glucose transporter
(GLUT2) and cause alkylation of DNA. DNA damage induces activation of poly ADP-
ribosylation leads to depletion of cellular NAD+
and ATP. Increased ATP-
dephosphorylation causes release of superoxide radicals, consequently hydrogen peroxide
and hydroxyl radicals are also generated. And also a toxic amount of nitric oxide44
was
liberated after the treatment of STZ which inhibits the aconitase activity and participates
in DNA damage. As a result of STZ action, β-cells undergo the destruction by necrosis45
.
As it was explained, that STZ damages β-cells in pancreas there is increased
blood glucose levels in STZ treated rats. A prolonged treatment (21 days) of diabetic rats
with the HAFW, EAEFW, MEFW and AEFW showed a significant reduction in the
blood glucose levels than the untreated rats. This hypoglycaemic activity may be due to
the stimulation of surviving β-cells to release more insulin. Flemingia wightiania may act
by inhibiting hepatic gluconeogenesis or inhibiting α-glucosidase enzyme in the intestine,
which is the enzyme helpful for breakdown of disaccharides to form glucose46
.
Please purchase PDF Split-Merge on www.verypdf.com to remove this watermark.Please purchase PDF Split-Merge on www.verypdf.com to remove this watermark.

Results and Discussion
328
Table 10: Effect of Flemingia wightiania Plant Extracts on Blood Glucose Levels in STZ Induced Diabetic Rats
Groups Treatment Blood Glucose Levels (mg/dl)
0 day 7 day 14 day 21 day
Group-I Saline 95.83 ± 5.58 92.67 ±5.62*** 98.50 ± 5.81*** 106.0 ± 5.13***
Group-II Saline + STZ (45mg/kg) 387.2 ± 28.41 398.7 ± 22.90 366.5 ± 12.30 331.7 ± 10.19
Group-III Glibenclamide (5mg/kg) + STZ (45mg/kg) 399.8 ± 25.04 294.0 ± 23.90*** 194.0 ± 13.06*** 109.0 ± 6.14***
Group-IV HEFW(300mg/kg) + STZ (45mg/kg) 392.8 ± 25.04 329.2 ± 14.75* 244.2 ± 12.75*** 159.8 ± 11.47***
Group-V EAEFW (300mg/kg) + STZ (45mg/kg) 383.8 ± 11.49 341.2 ± 9.76ns
270.2 ± 12.75*** 192.2 ± 9.76***
Group-VI MEFW (300mg/kg) + STZ (45mg/kg) 392.3 ± 17.28 317.8 ± 13.52** 218.0 ± 9.76*** 123.5 ± 5.23***
Group-VII AEFW (300mg/kg) + STZ (45mg/kg) 376.8 ± 16.45 324.0 ± 15.10* 232.3 ± 17.00*** 133.0 ± 9.14***
Values are Mean ± SEM (n=6) one way ANOVA followed by Dunnett’s test. Where, *** P<0.001, ** P<0.01, * P<0.05 and ns
represents Not significant.
All the values are compared with the diabetic control group.
HEFW - n-Hexane extract of Flemingia wightiania
EAEFW - Ethyl acetate extract of Flemingia wightiania
MEEW - Methanolic extract of Flemingia wightiania
AEFW - Aqueous extract of Flemingia wightiania
Please purchase PDF Split-Merge on www.verypdf.com to remove this watermark.Please purchase PDF Split-Merge on www.verypdf.com to remove this watermark.
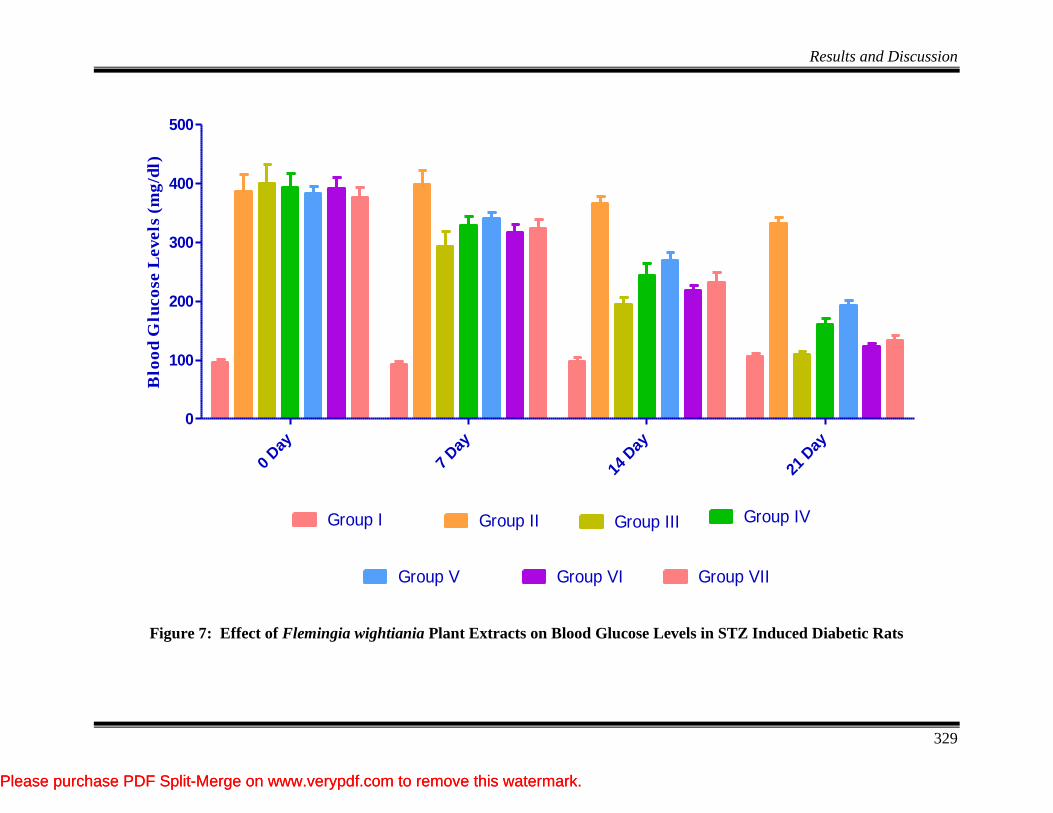
Results and Discussion
329
0 Day
7 Day
14 D
ay
21 D
ay
0
100
200
300
400
500
Group I Group II Group III Group IV
Group V Group VI Group VII
Blo
od
Glu
co
se L
evels
(m
g/d
l)
Figure 7: Effect of Flemingia wightiania Plant Extracts on Blood Glucose Levels in STZ Induced Diabetic Rats
Please purchase PDF Split-Merge on www.verypdf.com to remove this watermark.Please purchase PDF Split-Merge on www.verypdf.com to remove this watermark.
Results and Discussion
330
Effect of extract on Physical Parameters of STZ induced diabetic rats:
i. Body Weight
There is a significant change seen in the body weight of animals after the
treatment inducing diabetes with STZ. The decreased body weight of the animals were
significantly regains when compare with the diabetic control animals after treatment for
21 days with the extract. And also the body weight of normal control group was
significantly increased compared to initial body weight. The changes in body weight of
the animals during 0, 7, 14 and 21 days was tabulated in the Table 11 and shown in
Figure 8.
ii. Wet Liver Weight
Rats treated with STZ shown a decrease in the liver weight of untreated diabetic
rats, where as in treated rats there is a significant restoration of wet liver weight which is
near to the normal levels. The values of the wet liver weight were tabulated in the
Table 11 and shown in Figure 9.
Induction of diabetes with STZ is associated with a characteristic reduce in body
weight than the normal rats, this may be due to the wasting and loss of tissue protein.
Whereas, diabetic rats treated with HAFW, EAEFW, MEFW and AEFW showed an
improved result when compared with normal diabetic control. Which may be due to the
protective effect in controlling muscle wasting i.e., reversal of gluconeogenesis and may
also be due to the improvement of glycemic control47
.
A decrease in the liver weight observed in diabetic animals, this is may be due to
insufficient release of insulin may causes decrease in the storage of glucose as glycogen
Please purchase PDF Split-Merge on www.verypdf.com to remove this watermark.Please purchase PDF Split-Merge on www.verypdf.com to remove this watermark.
Results and Discussion
331
in liver. After 21 days of treatment with Flemingia wightiania in diabetic animals, an
increased in the liver weight is observed than the untreated rats. A less significant
increase in liver weight is seen in HEFW treated diabetic rats. EAEFW shows did not
show significant increase in liver weight is seen in treated diabetic rats. This result is may
be the extract is having insulin like action which is reported as by Viswanathan et al48
.
Please purchase PDF Split-Merge on www.verypdf.com to remove this watermark.Please purchase PDF Split-Merge on www.verypdf.com to remove this watermark.
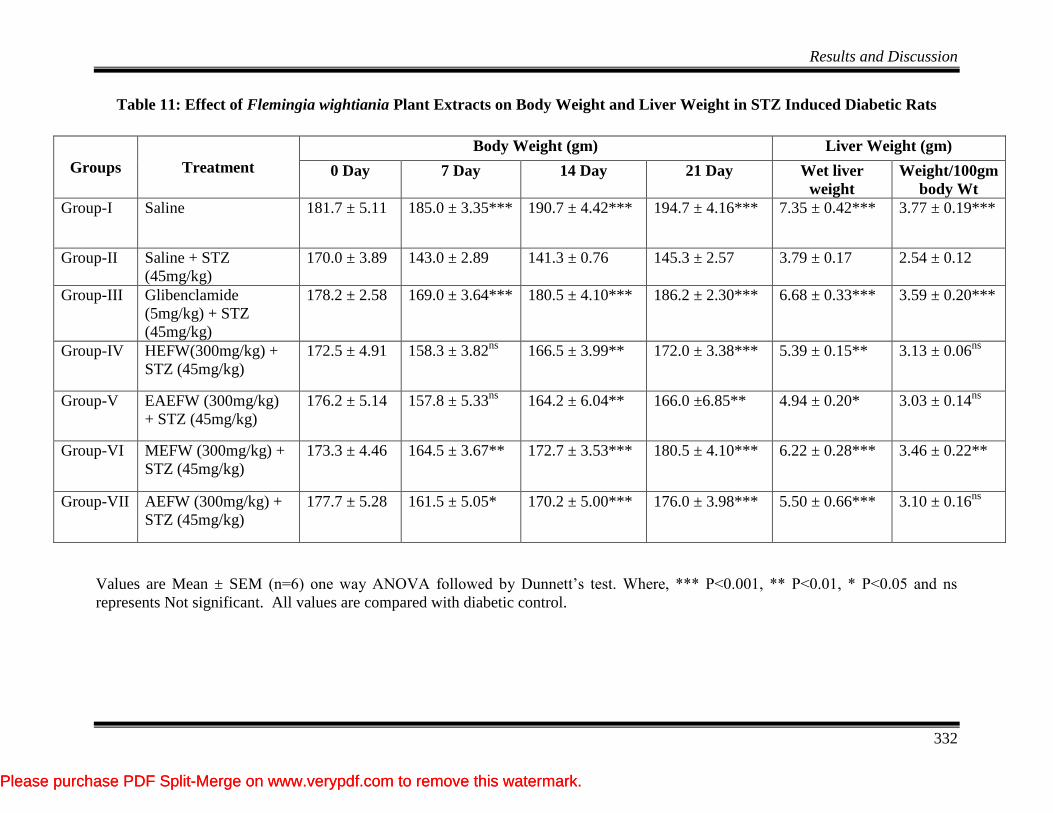
Results and Discussion
332
Table 11: Effect of Flemingia wightiania Plant Extracts on Body Weight and Liver Weight in STZ Induced Diabetic Rats
Groups Treatment
Body Weight (gm) Liver Weight (gm)
0 Day 7 Day 14 Day 21 Day Wet liver
weight
Weight/100gm
body Wt
Group-I Saline 181.7 ± 5.11 185.0 ± 3.35*** 190.7 ± 4.42*** 194.7 ± 4.16*** 7.35 ± 0.42*** 3.77 ± 0.19***
Group-II Saline + STZ
(45mg/kg)
170.0 ± 3.89 143.0 ± 2.89 141.3 ± 0.76 145.3 ± 2.57 3.79 ± 0.17 2.54 ± 0.12
Group-III Glibenclamide
(5mg/kg) + STZ
(45mg/kg)
178.2 ± 2.58 169.0 ± 3.64*** 180.5 ± 4.10*** 186.2 ± 2.30*** 6.68 ± 0.33*** 3.59 ± 0.20***
Group-IV HEFW(300mg/kg) +
STZ (45mg/kg)
172.5 ± 4.91 158.3 ± 3.82ns
166.5 ± 3.99** 172.0 ± 3.38*** 5.39 ± 0.15** 3.13 ± 0.06ns
Group-V EAEFW (300mg/kg)
+ STZ (45mg/kg)
176.2 ± 5.14 157.8 ± 5.33ns
164.2 ± 6.04** 166.0 ±6.85** 4.94 ± 0.20* 3.03 ± 0.14ns
Group-VI MEFW (300mg/kg) +
STZ (45mg/kg)
173.3 ± 4.46 164.5 ± 3.67** 172.7 ± 3.53*** 180.5 ± 4.10*** 6.22 ± 0.28*** 3.46 ± 0.22**
Group-VII AEFW (300mg/kg) +
STZ (45mg/kg)
177.7 ± 5.28 161.5 ± 5.05* 170.2 ± 5.00*** 176.0 ± 3.98*** 5.50 ± 0.66*** 3.10 ± 0.16ns
Values are Mean ± SEM (n=6) one way ANOVA followed by Dunnett’s test. Where, *** P<0.001, ** P<0.01, * P<0.05 and ns
represents Not significant. All values are compared with diabetic control.
Please purchase PDF Split-Merge on www.verypdf.com to remove this watermark.Please purchase PDF Split-Merge on www.verypdf.com to remove this watermark.
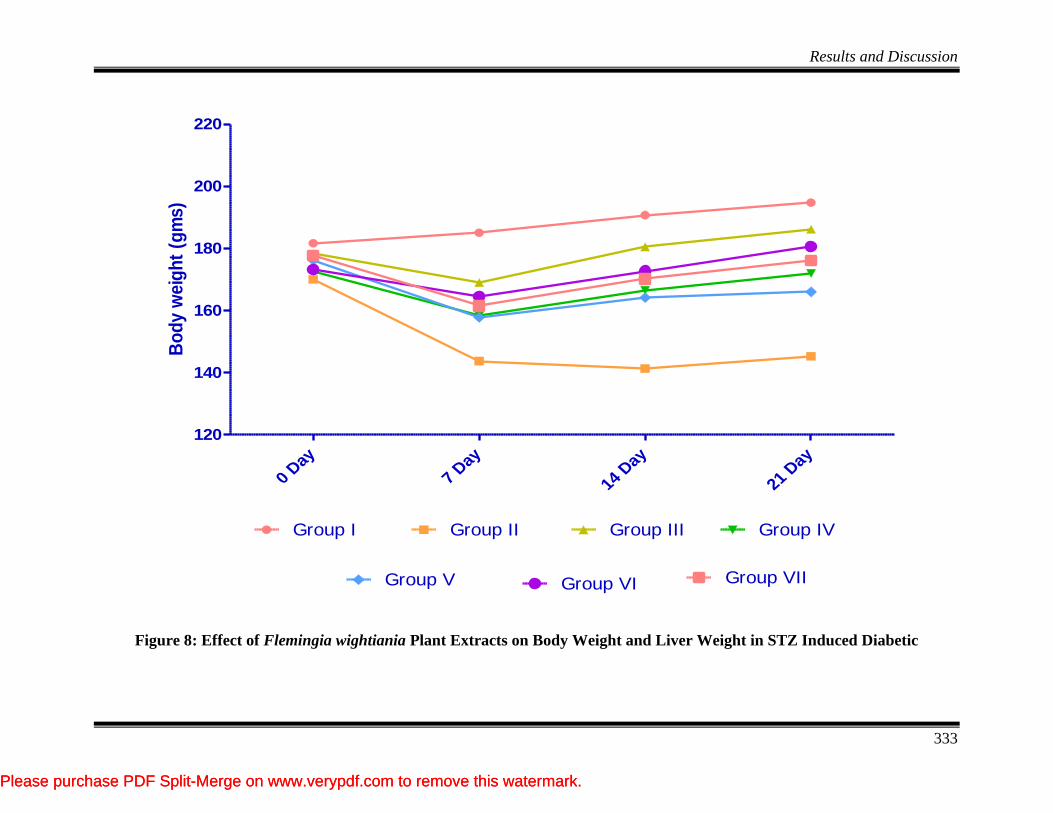
Results and Discussion
333
0 Day
7 Day
14 D
ay
21 D
ay
120
140
160
180
200
220
Group I Group II Group III Group IV
Group V Group VI Group VII
Bo
dy w
eig
ht
(gm
s)
Figure 8: Effect of Flemingia wightiania Plant Extracts on Body Weight and Liver Weight in STZ Induced Diabetic
Please purchase PDF Split-Merge on www.verypdf.com to remove this watermark.Please purchase PDF Split-Merge on www.verypdf.com to remove this watermark.
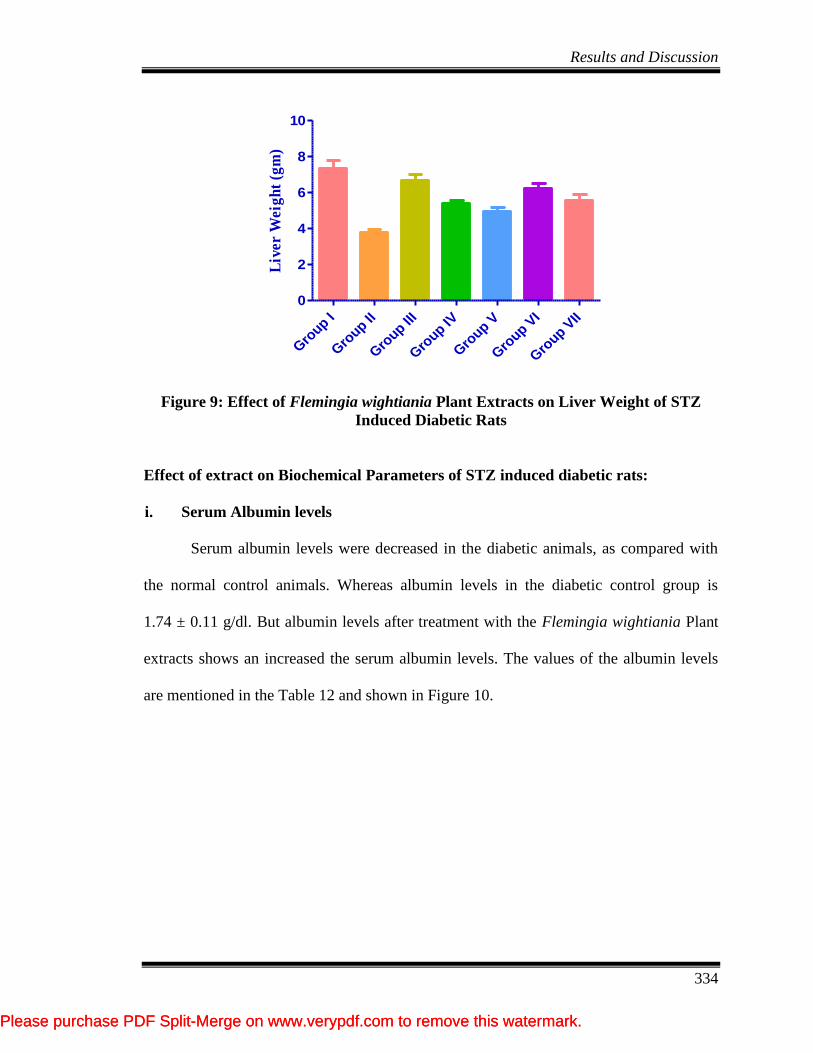
Results and Discussion
334
Gro
up I
Gro
up II
Gro
up III
Gro
up IV
Gro
up V
Gro
up VI
Gro
up VII
0
2
4
6
8
10
Liv
er W
eig
ht
(gm
)
Figure 9: Effect of Flemingia wightiania Plant Extracts on Liver Weight of STZ
Induced Diabetic Rats
Effect of extract on Biochemical Parameters of STZ induced diabetic rats:
i. Serum Albumin levels
Serum albumin levels were decreased in the diabetic animals, as compared with
the normal control animals. Whereas albumin levels in the diabetic control group is
1.74 ± 0.11 g/dl. But albumin levels after treatment with the Flemingia wightiania Plant
extracts shows an increased the serum albumin levels. The values of the albumin levels
are mentioned in the Table 12 and shown in Figure 10.
Please purchase PDF Split-Merge on www.verypdf.com to remove this watermark.Please purchase PDF Split-Merge on www.verypdf.com to remove this watermark.
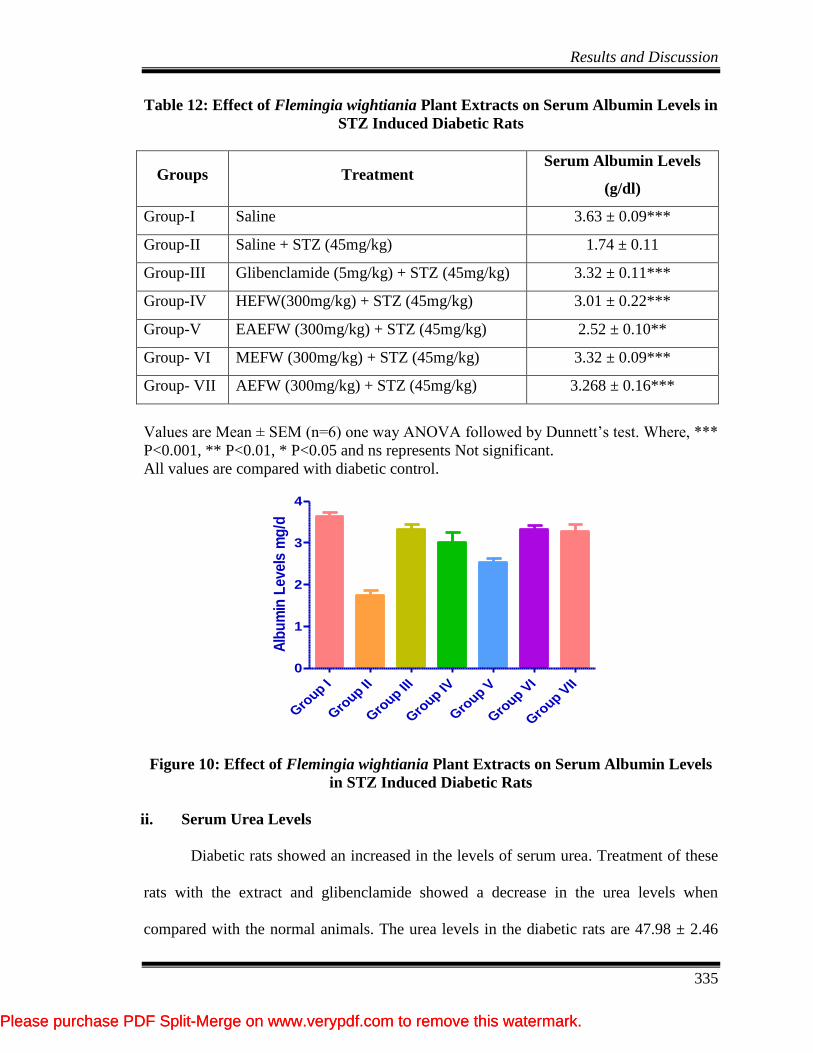
Results and Discussion
335
Table 12: Effect of Flemingia wightiania Plant Extracts on Serum Albumin Levels in
STZ Induced Diabetic Rats
Groups Treatment Serum Albumin Levels
(g/dl)
Group-I Saline 3.63 ± 0.09***
Group-II Saline + STZ (45mg/kg) 1.74 ± 0.11
Group-III Glibenclamide (5mg/kg) + STZ (45mg/kg) 3.32 ± 0.11***
Group-IV HEFW(300mg/kg) + STZ (45mg/kg) 3.01 ± 0.22***
Group-V EAEFW (300mg/kg) + STZ (45mg/kg) 2.52 ± 0.10**
Group- VI MEFW (300mg/kg) + STZ (45mg/kg) 3.32 ± 0.09***
Group- VII AEFW (300mg/kg) + STZ (45mg/kg) 3.268 ± 0.16***
Values are Mean ± SEM (n=6) one way ANOVA followed by Dunnett’s test. Where, ***
P<0.001, ** P<0.01, * P<0.05 and ns represents Not significant.
All values are compared with diabetic control.
Gro
up I
Gro
up II
Gro
up III
Gro
up IV
Gro
up V
Gro
up VI
Gro
up VII
0
1
2
3
4
Alb
um
in L
evels
mg
/d
Figure 10: Effect of Flemingia wightiania Plant Extracts on Serum Albumin Levels
in STZ Induced Diabetic Rats
ii. Serum Urea Levels
Diabetic rats showed an increased in the levels of serum urea. Treatment of these
rats with the extract and glibenclamide showed a decrease in the urea levels when
compared with the normal animals. The urea levels in the diabetic rats are 47.98 ± 2.46
Please purchase PDF Split-Merge on www.verypdf.com to remove this watermark.Please purchase PDF Split-Merge on www.verypdf.com to remove this watermark.
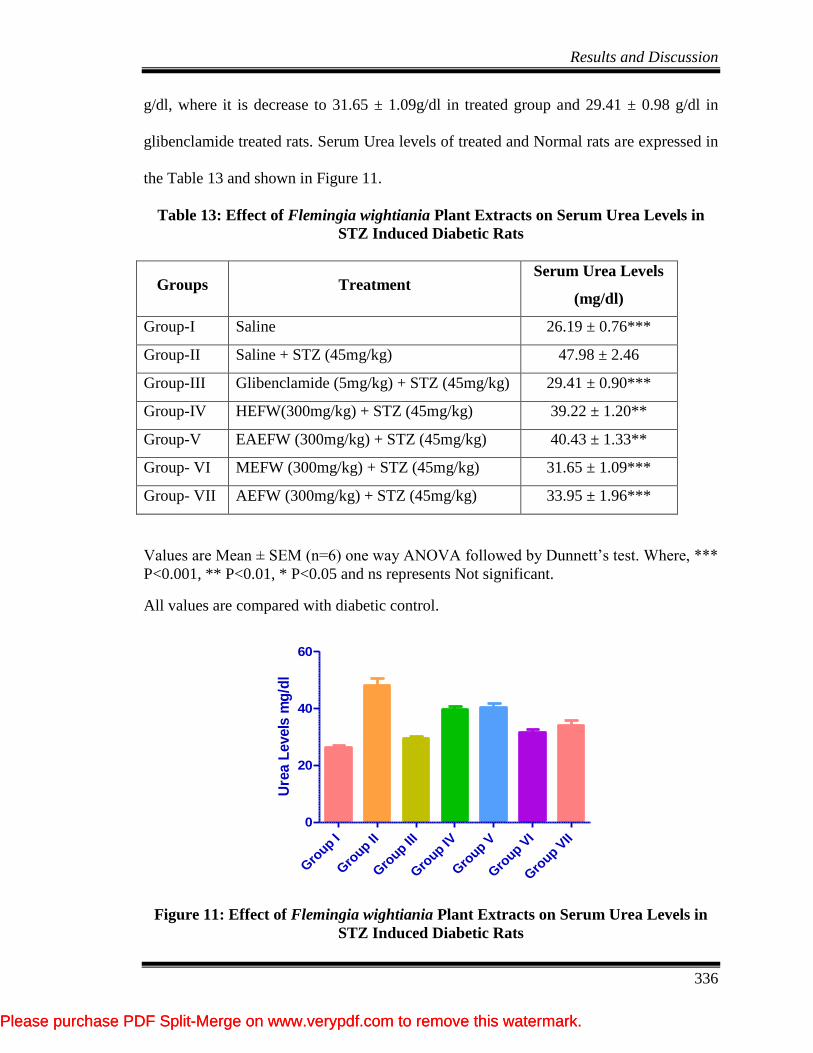
Results and Discussion
336
g/dl, where it is decrease to 31.65 ± 1.09g/dl in treated group and 29.41 ± 0.98 g/dl in
glibenclamide treated rats. Serum Urea levels of treated and Normal rats are expressed in
the Table 13 and shown in Figure 11.
Table 13: Effect of Flemingia wightiania Plant Extracts on Serum Urea Levels in
STZ Induced Diabetic Rats
Groups Treatment Serum Urea Levels
(mg/dl)
Group-I Saline 26.19 ± 0.76***
Group-II Saline + STZ (45mg/kg) 47.98 ± 2.46
Group-III Glibenclamide (5mg/kg) + STZ (45mg/kg) 29.41 ± 0.90***
Group-IV HEFW(300mg/kg) + STZ (45mg/kg) 39.22 ± 1.20**
Group-V EAEFW (300mg/kg) + STZ (45mg/kg) 40.43 ± 1.33**
Group- VI MEFW (300mg/kg) + STZ (45mg/kg) 31.65 ± 1.09***
Group- VII AEFW (300mg/kg) + STZ (45mg/kg) 33.95 ± 1.96***
Values are Mean ± SEM (n=6) one way ANOVA followed by Dunnett’s test. Where, ***
P<0.001, ** P<0.01, * P<0.05 and ns represents Not significant.
All values are compared with diabetic control.
Gro
up I
Gro
up II
Gro
up III
Gro
up IV
Gro
up V
Gro
up VI
Gro
up VII
0
20
40
60
Ure
a L
evels
mg
/dl
Figure 11: Effect of Flemingia wightiania Plant Extracts on Serum Urea Levels in
STZ Induced Diabetic Rats
Please purchase PDF Split-Merge on www.verypdf.com to remove this watermark.Please purchase PDF Split-Merge on www.verypdf.com to remove this watermark.
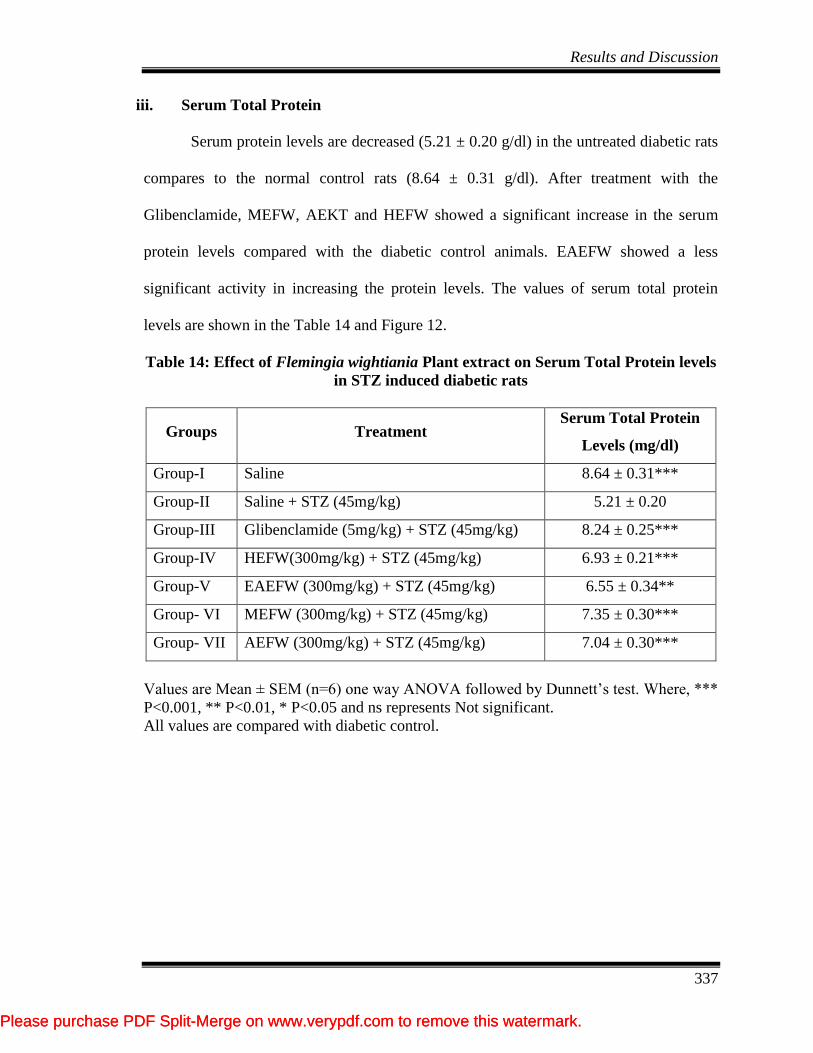
Results and Discussion
337
iii. Serum Total Protein
Serum protein levels are decreased (5.21 ± 0.20 g/dl) in the untreated diabetic rats
compares to the normal control rats (8.64 ± 0.31 g/dl). After treatment with the
Glibenclamide, MEFW, AEKT and HEFW showed a significant increase in the serum
protein levels compared with the diabetic control animals. EAEFW showed a less
significant activity in increasing the protein levels. The values of serum total protein
levels are shown in the Table 14 and Figure 12.
Table 14: Effect of Flemingia wightiania Plant extract on Serum Total Protein levels
in STZ induced diabetic rats
Groups Treatment Serum Total Protein
Levels (mg/dl)
Group-I Saline 8.64 ± 0.31***
Group-II Saline + STZ (45mg/kg) 5.21 ± 0.20
Group-III Glibenclamide (5mg/kg) + STZ (45mg/kg) 8.24 ± 0.25***
Group-IV HEFW(300mg/kg) + STZ (45mg/kg) 6.93 ± 0.21***
Group-V EAEFW (300mg/kg) + STZ (45mg/kg) 6.55 ± 0.34**
Group- VI MEFW (300mg/kg) + STZ (45mg/kg) 7.35 ± 0.30***
Group- VII AEFW (300mg/kg) + STZ (45mg/kg) 7.04 ± 0.30***
Values are Mean ± SEM (n=6) one way ANOVA followed by Dunnett’s test. Where, ***
P<0.001, ** P<0.01, * P<0.05 and ns represents Not significant.
All values are compared with diabetic control.
Please purchase PDF Split-Merge on www.verypdf.com to remove this watermark.Please purchase PDF Split-Merge on www.verypdf.com to remove this watermark.
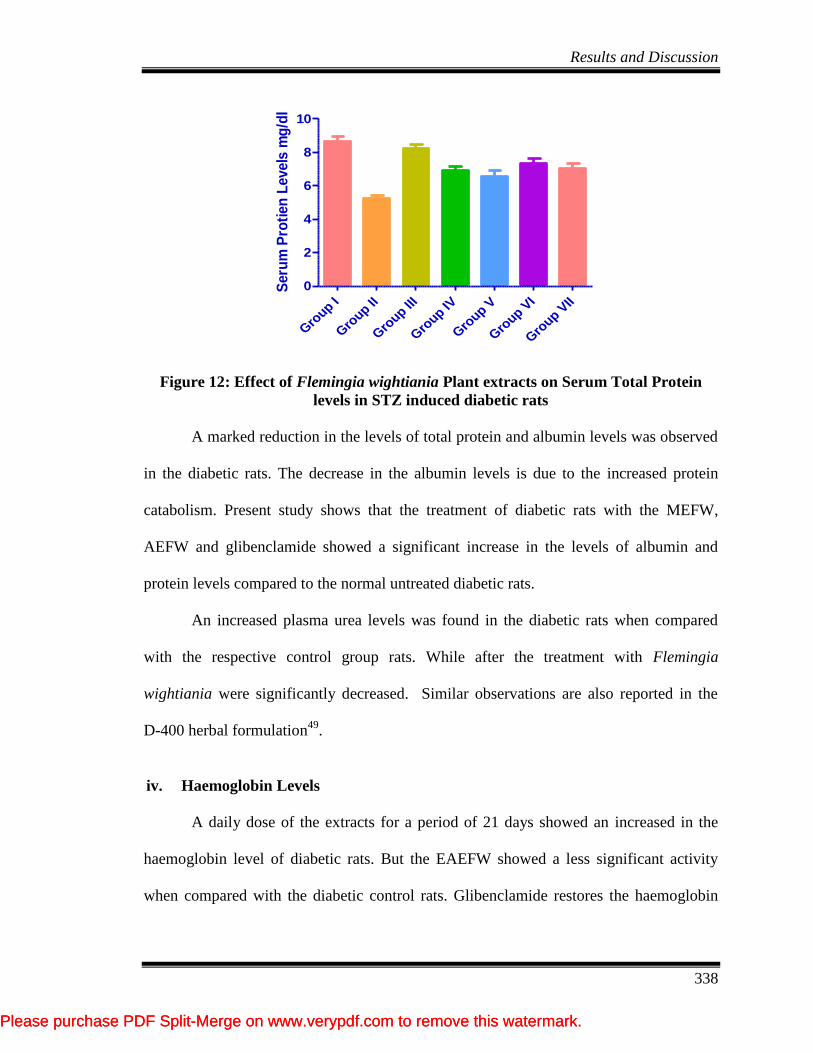
Results and Discussion
338
Gro
up I
Gro
up II
Gro
up III
Gro
up IV
Gro
up V
Gro
up VI
Gro
up VII
0
2
4
6
8
10
Seru
m P
roti
en
Levels
mg
/dl
Figure 12: Effect of Flemingia wightiania Plant extracts on Serum Total Protein
levels in STZ induced diabetic rats
A marked reduction in the levels of total protein and albumin levels was observed
in the diabetic rats. The decrease in the albumin levels is due to the increased protein
catabolism. Present study shows that the treatment of diabetic rats with the MEFW,
AEFW and glibenclamide showed a significant increase in the levels of albumin and
protein levels compared to the normal untreated diabetic rats.
An increased plasma urea levels was found in the diabetic rats when compared
with the respective control group rats. While after the treatment with Flemingia
wightiania were significantly decreased. Similar observations are also reported in the
D-400 herbal formulation49
.
iv. Haemoglobin Levels
A daily dose of the extracts for a period of 21 days showed an increased in the
haemoglobin level of diabetic rats. But the EAEFW showed a less significant activity
when compared with the diabetic control rats. Glibenclamide restores the haemoglobin
Please purchase PDF Split-Merge on www.verypdf.com to remove this watermark.Please purchase PDF Split-Merge on www.verypdf.com to remove this watermark.

Results and Discussion
339
levels to normal levels after treatment. The values are tabulated in the Table 15 and
shown in Figure13.
The haemoglobin levels of the diabetic group of rats were found to be reduced
significantly as against the normal haemoglobin levels of the normal group of rats; this is
due to an increased formation of its glycosylated form. During hyperglycaemic condition
protein synthesis is attenuated or reduced in all the tissues and thus the synthesis of
haemoglobin also reduced50
.
Table 15: Effect of Flemingia wightiania Plant Extracts on Haemoglobin Levels in
STZ Induced Diabetic Rats
Groups Treatment Haemoglobin
(mg/dl)
Group-I Saline 12.73 ± 0.32***
Group-II Saline + STZ (45mg/kg) 8.63 ± 0.54
Group-III Glibenclamide (5mg/kg) + STZ (45mg/kg) 12.37 ± 0.39***
Group-IV HEFW(300mg/kg) + STZ (45mg/kg) 11.60 ± 0.34***
Group-V EAEFW (300mg/kg) + STZ (45mg/kg) 10.93 ± 0.39**
Group- VI MEFW (300mg/kg) + STZ (45mg/kg) 12.03 ± 0.38***
Group- VII AEEW (300mg/kg) + STZ (45mg/kg) 11.80 ± 0.27***
Values are Mean ± SEM (n=6) one way ANOVA followed by Dunnett’s test. Where, ***
P<0.001, ** P<0.01, * P<0.05 and ns represents Not significant.
All values are compared with diabetic control.
Please purchase PDF Split-Merge on www.verypdf.com to remove this watermark.Please purchase PDF Split-Merge on www.verypdf.com to remove this watermark.

Results and Discussion
340
Gro
up I
Gro
up II
Gro
up III
Gro
up IV
Gro
up V
Gro
up VI
Gro
up VII
0
5
10
15
Hae
mo
glo
bin
(m
g/d
l)
Figure 13: Effect of Flemingia wightiania Plant Extracts on Haemoglobin Levels in
STZ Induced Diabetic Rats
v. Serum Lipid Profile
The lipid profile was evaluated by estimating triglycerides (TG), total cholesterol
(TC), HDL-Cholesterol (HDL-C), LDL-Cholesterol (HDL-C), VLDL-Cholesterol
(VLDL-C) in normal and diabetic animals. The STZ diabetic animals showed a
significant increased in the TG, TC, LDL-C and VLDL-C levels and suppression of
HDL-C levels compared to control group (Table 16 and Figure 14). But after treatment
with the root extracts and glibenclamide diabetic animals Showed decrease in the TG,
TC, LDL-C and VLDL-C levels and increase in the HDL-C levels compared to untreated
diabetic rats.
Under normal condition, insulin activates enzyme lipoprotein lipase and
hydrolyses triglycerides. Insulin deficiency results in failure to activate the enzymes there
by causing hypertriglyceridemia51
. This altered lipid metabolism leads to diabetic
complications. Practically it has been observed that there is an altered in levels of serum
cholesterol and triglycerides levels in STZ treated rats, causes hypercholesterolemia and
hyper-triglyceridemia52
.
Please purchase PDF Split-Merge on www.verypdf.com to remove this watermark.Please purchase PDF Split-Merge on www.verypdf.com to remove this watermark.
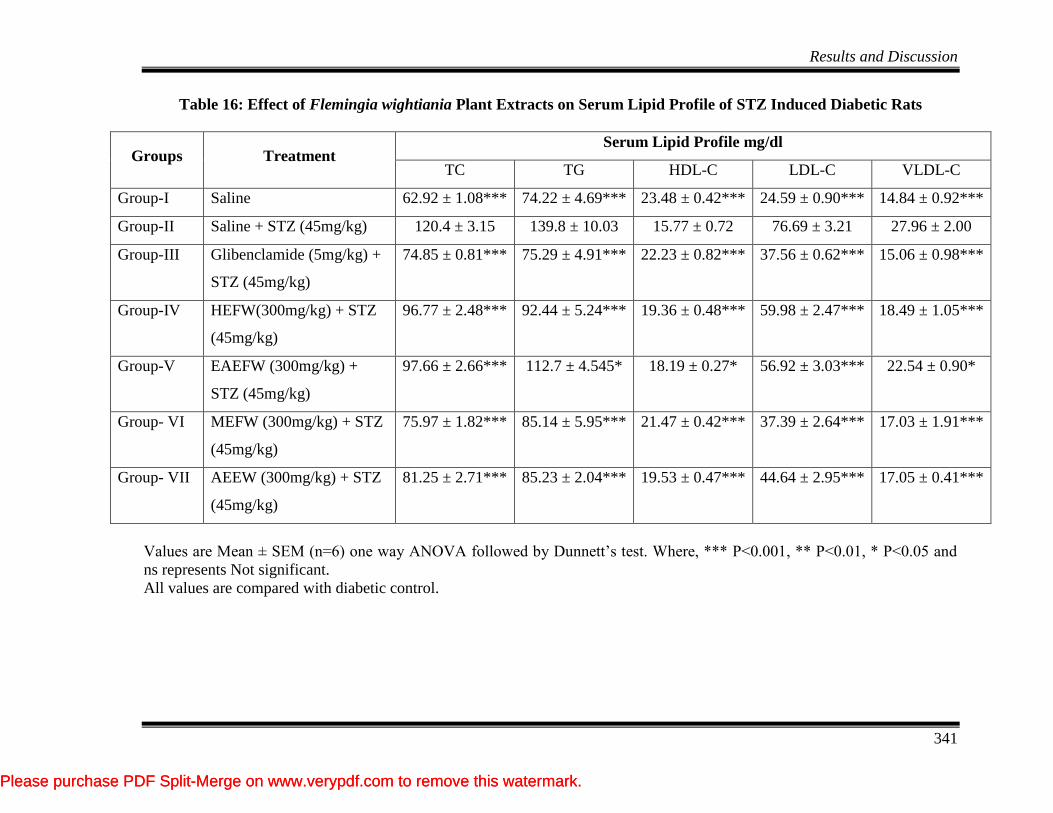
Results and Discussion
341
Table 16: Effect of Flemingia wightiania Plant Extracts on Serum Lipid Profile of STZ Induced Diabetic Rats
Groups Treatment Serum Lipid Profile mg/dl
TC TG HDL-C LDL-C VLDL-C
Group-I Saline 62.92 ± 1.08*** 74.22 ± 4.69*** 23.48 ± 0.42*** 24.59 ± 0.90*** 14.84 ± 0.92***
Group-II Saline + STZ (45mg/kg) 120.4 ± 3.15 139.8 ± 10.03 15.77 ± 0.72 76.69 ± 3.21 27.96 ± 2.00
Group-III Glibenclamide (5mg/kg) +
STZ (45mg/kg)
74.85 ± 0.81*** 75.29 ± 4.91*** 22.23 ± 0.82*** 37.56 ± 0.62*** 15.06 ± 0.98***
Group-IV HEFW(300mg/kg) + STZ
(45mg/kg)
96.77 ± 2.48*** 92.44 ± 5.24*** 19.36 ± 0.48*** 59.98 ± 2.47*** 18.49 ± 1.05***
Group-V EAEFW (300mg/kg) +
STZ (45mg/kg)
97.66 ± 2.66*** 112.7 ± 4.545* 18.19 ± 0.27* 56.92 ± 3.03*** 22.54 ± 0.90*
Group- VI MEFW (300mg/kg) + STZ
(45mg/kg)
75.97 ± 1.82*** 85.14 ± 5.95*** 21.47 ± 0.42*** 37.39 ± 2.64*** 17.03 ± 1.91***
Group- VII AEEW (300mg/kg) + STZ
(45mg/kg)
81.25 ± 2.71*** 85.23 ± 2.04*** 19.53 ± 0.47*** 44.64 ± 2.95*** 17.05 ± 0.41***
Values are Mean ± SEM (n=6) one way ANOVA followed by Dunnett’s test. Where, *** P<0.001, ** P<0.01, * P<0.05 and
ns represents Not significant.
All values are compared with diabetic control.
Please purchase PDF Split-Merge on www.verypdf.com to remove this watermark.Please purchase PDF Split-Merge on www.verypdf.com to remove this watermark.
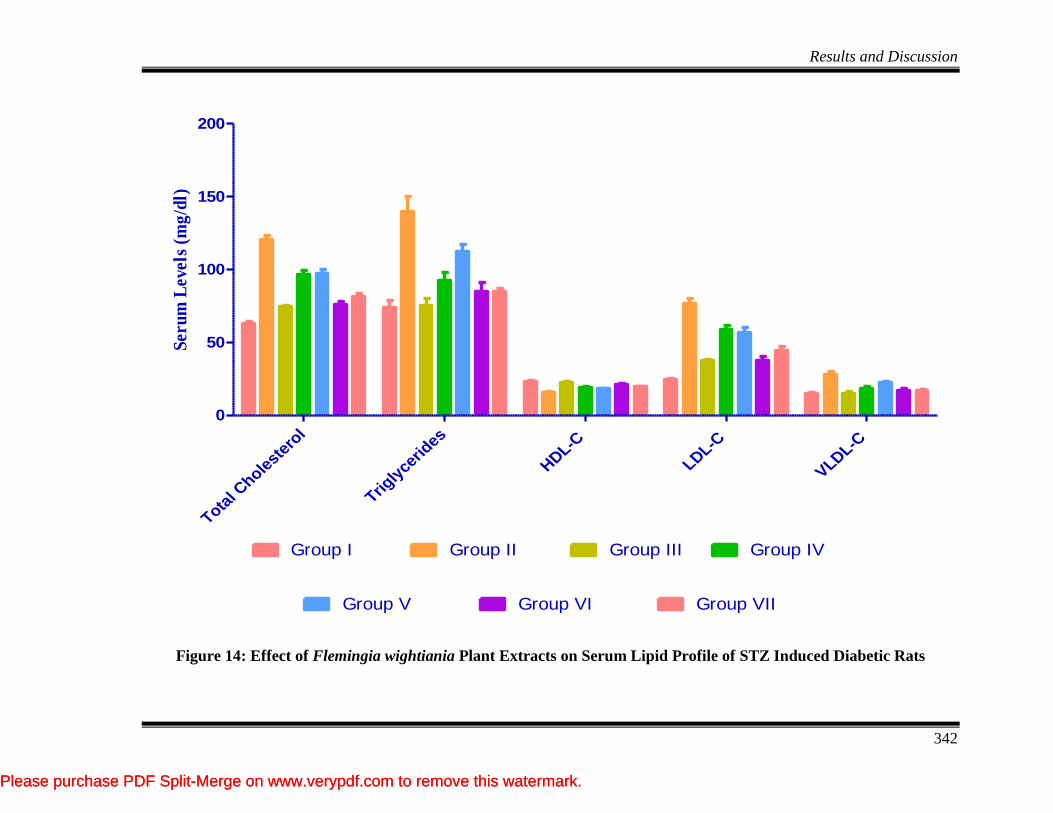
Results and Discussion
342
Total C
holest
erol
Trigly
cerid
es
HDL-C
LDL-C
VLDL-C
0
50
100
150
200
Group I Group II Group III Group IV
Group V Group VI Group VII
Ser
um
Lev
els
(mg
/dl)
Figure 14: Effect of Flemingia wightiania Plant Extracts on Serum Lipid Profile of STZ Induced Diabetic Rats
Please purchase PDF Split-Merge on www.verypdf.com to remove this watermark.Please purchase PDF Split-Merge on www.verypdf.com to remove this watermark.

Results and Discussion
343
Effect of Extracts on Antioxidant Levels
i. Superoxide Dismutase Levels
Diabetic rats exhibited significant lower SOD (8.38 ± 0.46) as compared to those
of control rats (13.70 ± 0.39) treatment with the root extract significantly elevated the
reduce SOD levels. MEFW, AEFW, HEFW, EAEFW and Glibenclamide showed a
marked decrease in the SOD levels (P< 0.001) compared to the diabetic control. These
values are tabulated in the Table 17 and Figure 15.
Superoxide dismutase is an enzymatic antioxidant which reduces superoxide
radical to hydrogen peroxide and oxygen. A decrease in the antioxidant activity in liver
results in the accumulation of free radicals (hydroxyl radical) in diabetic rats.
Administration of the HEFE, EAEFE, MEFW, AEFW and glibenclamide increased the
activity of SOD levels to a significant level of P<0.001. While the SOD levels of
untreated diabetic control rats having lowered levels. The Flemingia wightiania may act
by either directly scavenging the reactive oxygen metabolites or by increasing the anti-
oxidant molecules.
Table 17: Effect of Flemingia wightiania Plant Extracts on SOD Levels in STZ
Induced Diabetic Rats
Groups Treatment SOD U/mg
protein
Group-I Saline 13.70 ± 0.39***
Group-II Saline + STZ (45mg/kg) 8.38 ± 0.46
Group-III Glibenclamide (5mg/kg) + STZ (45mg/kg) 12.90 ± 0.40***
Group-IV HEFW(300mg/kg) + STZ (45mg/kg) 11.71 ± 0.36***
Group-V EAEFW (300mg/kg) + STZ (45mg/kg) 10.96 ± 0.32***
Group- VI MEFW (300mg/kg) + STZ (45mg/kg) 12.45 ± 0.25***
Group- VII AEEW (300mg/kg) + STZ (45mg/kg) 12.09 ± 0.24***
Please purchase PDF Split-Merge on www.verypdf.com to remove this watermark.Please purchase PDF Split-Merge on www.verypdf.com to remove this watermark.

Results and Discussion
344
Values are Mean ± SEM (n=6) one way ANOVA followed by Dunnett’s test. Where, ***
P<0.001, ** P<0.01, * P<0.05 and ns represents Not significant.
All values are compared with diabetic control.
Gro
up I
Gro
up II
Gro
up III
Gro
up IV
Gro
up V
Gro
up VI
Gro
up VII
0
5
10
15
Su
pero
xid
e D
ism
uta
se
(U/m
g P
ro
tein
)
Figure 15: Effect of Flemingia wightiania Plant Extracts on SOD Levels in STZ
Induced Diabetic Rats
ii. Thiobarbuturic Acid Reactive Substance Levels (TBARS)
Rats treated with STZ had a TBARS level of 3.67 ± 0.26 nmoles of MDA/ 100
mg of tissue when measured on day 21. This was significantly higher when compared to
levels in normal control rats of 0.93 ± 0.05 nmoles of MDA/ 100 mg of tissue.
Diabetic rats treated with MEFW had a lipid peroxidation levels of 1.49 ± 0.09
nmoles of MDA/ 100 mg of tissue and also rats treated with the AEFW, HEFW and
EAEFW treated rats having a TBARS levels of 1.74 ± 0.16, 1.91 ± 0.11 and 2.12 ± 0.14
nmoles of MDA/ 100 mg of tissue. Where as in glibenclamide treated rats the levels are
restored to normal levels of 1.27 ± 0.08 nmoles of MDA/ 100 mg of tissue. These values
are expressed in Table 18 and shown in Figure 16.
Please purchase PDF Split-Merge on www.verypdf.com to remove this watermark.Please purchase PDF Split-Merge on www.verypdf.com to remove this watermark.

Results and Discussion
345
In diabetes, lipid peroxidation is one of the characteristic features of chronic
diabetes. The increased free radicals react with the polyunsaturated fatty acids in cell
membrane leading to lipid peroxidation. This in turn results in the development of free
radicals. Low levels of lipoxygenase peroxides stimulate the release of insulin. But, if the
concentration of this peroxidase increases it results in uncontrolled release of lipid
peroxidation. The most commonly used indicator of lipid peroxidation is TBARS. There
was a significant elevation of TBARS in liver tissue in diabetic control animals when
compared to the normal rats. Administration of HEFE, EAEFE, MEFW, AEFW and
glibenclamide significantly reduce the TBARS levels. The effect shown is may be due to
prevention of potential glycation of anti-oxidant enzymes.
Table 18: Effect of Flemingia wightiania Plant Extracts on TBARS Levels in STZ
Induced Diabetic Rats
Groups Treatment
TBARS (nmoles of
MDA/ 100 mg of
tissue)
Group-I Saline 0.93 ± 0.05 ***
Group-II Saline + STZ (45mg/kg) 3.67 ± 0.26
Group-III Glibenclamide (5mg/kg) + STZ (45mg/kg) 1.27 ± 0.08 ***
Group-IV HEFW(300mg/kg) + STZ (45mg/kg) 1.91 ± 0.11 ****
Group-V EAEFW (300mg/kg) + STZ (45mg/kg) 2.12 ± 0.14 ***
Group- VI MEFW (300mg/kg) + STZ (45mg/kg) 1.49 ± 0.09***
Group- VII AEEW (300mg/kg) + STZ (45mg/kg) 1.74 ± 0.16***
Values are Mean ± SEM (n=6) one way ANOVA followed by Dunnett’s test. Where, ***
P<0.001, ** P<0.01, * P<0.05 and ns represents Not significant.
All values are compared with diabetic control.
Please purchase PDF Split-Merge on www.verypdf.com to remove this watermark.Please purchase PDF Split-Merge on www.verypdf.com to remove this watermark.
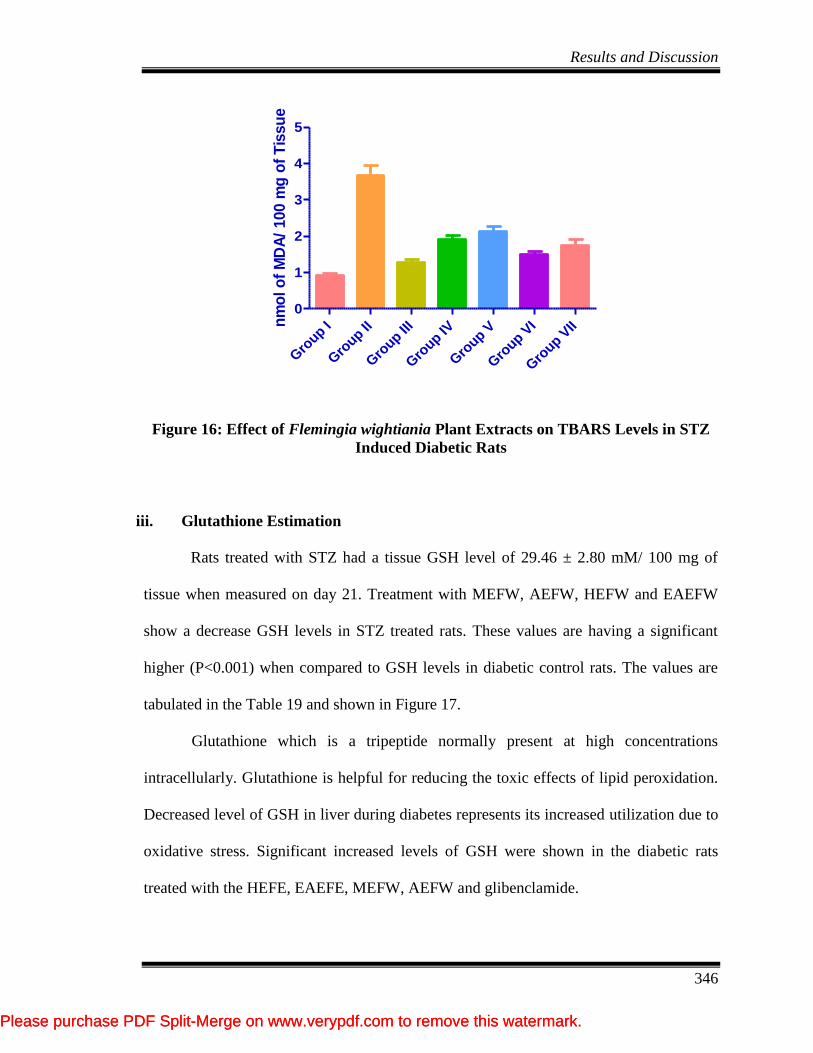
Results and Discussion
346
Gro
up I
Gro
up II
Gro
up III
Gro
up IV
Gro
up V
Gro
up VI
Gro
up VII
0
1
2
3
4
5
nm
ol o
f M
DA
/ 100 m
g o
f T
issu
e
Figure 16: Effect of Flemingia wightiania Plant Extracts on TBARS Levels in STZ
Induced Diabetic Rats
iii. Glutathione Estimation
Rats treated with STZ had a tissue GSH level of 29.46 ± 2.80 mM/ 100 mg of
tissue when measured on day 21. Treatment with MEFW, AEFW, HEFW and EAEFW
show a decrease GSH levels in STZ treated rats. These values are having a significant
higher (P<0.001) when compared to GSH levels in diabetic control rats. The values are
tabulated in the Table 19 and shown in Figure 17.
Glutathione which is a tripeptide normally present at high concentrations
intracellularly. Glutathione is helpful for reducing the toxic effects of lipid peroxidation.
Decreased level of GSH in liver during diabetes represents its increased utilization due to
oxidative stress. Significant increased levels of GSH were shown in the diabetic rats
treated with the HEFE, EAEFE, MEFW, AEFW and glibenclamide.
Please purchase PDF Split-Merge on www.verypdf.com to remove this watermark.Please purchase PDF Split-Merge on www.verypdf.com to remove this watermark.
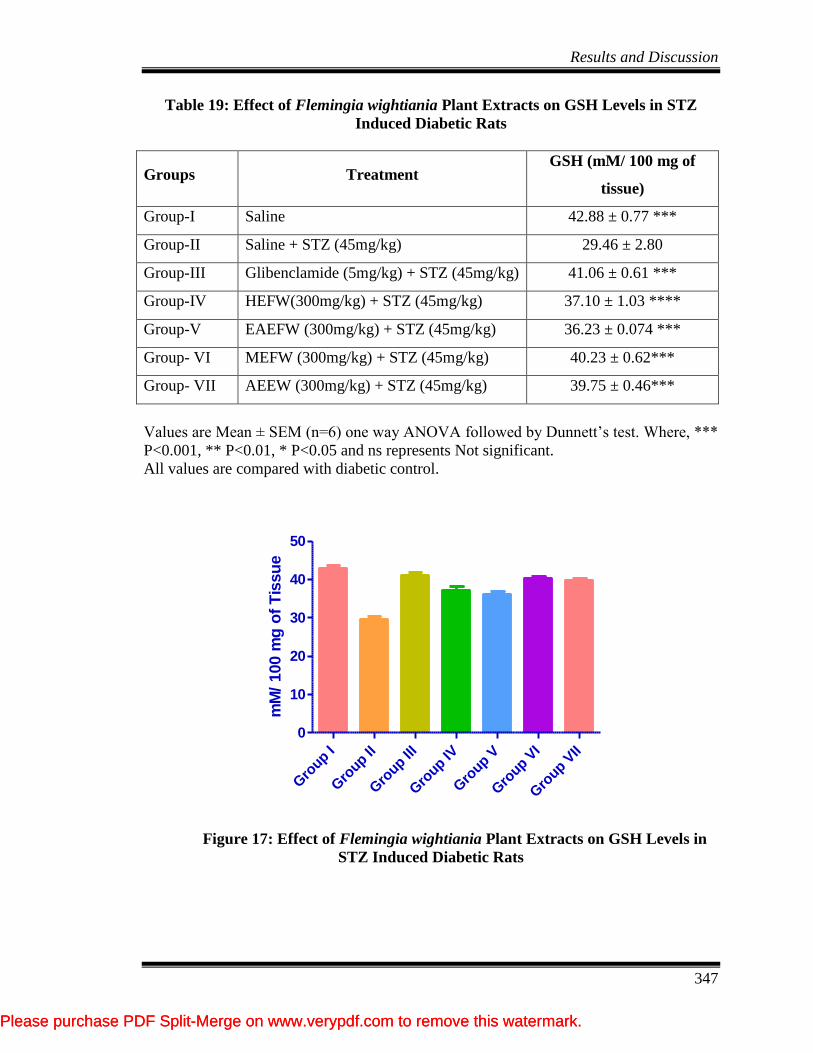
Results and Discussion
347
Table 19: Effect of Flemingia wightiania Plant Extracts on GSH Levels in STZ
Induced Diabetic Rats
Groups Treatment GSH (mM/ 100 mg of
tissue)
Group-I Saline 42.88 ± 0.77 ***
Group-II Saline + STZ (45mg/kg) 29.46 ± 2.80
Group-III Glibenclamide (5mg/kg) + STZ (45mg/kg) 41.06 ± 0.61 ***
Group-IV HEFW(300mg/kg) + STZ (45mg/kg) 37.10 ± 1.03 ****
Group-V EAEFW (300mg/kg) + STZ (45mg/kg) 36.23 ± 0.074 ***
Group- VI MEFW (300mg/kg) + STZ (45mg/kg) 40.23 ± 0.62***
Group- VII AEEW (300mg/kg) + STZ (45mg/kg) 39.75 ± 0.46***
Values are Mean ± SEM (n=6) one way ANOVA followed by Dunnett’s test. Where, ***
P<0.001, ** P<0.01, * P<0.05 and ns represents Not significant.
All values are compared with diabetic control.
Gro
up I
Gro
up II
Gro
up III
Gro
up IV
Gro
up V
Gro
up VI
Gro
up VII
0
10
20
30
40
50
mM
/ 100 m
g o
f T
issu
e
Figure 17: Effect of Flemingia wightiania Plant Extracts on GSH Levels in
STZ Induced Diabetic Rats
Please purchase PDF Split-Merge on www.verypdf.com to remove this watermark.Please purchase PDF Split-Merge on www.verypdf.com to remove this watermark.

Results and Discussion
348
Histopathological Study of Pancreas
i. Group –I (Normal Control + Saline)
Section studied shows pancreatic lobules separated by connective tissue septa.
The pancreatic lobules consist largely of the exocrine acini and their intralobular ducts.
Most of the lobules show small, round, light-staining islets of langerhans. The centre of
islet cells consist of aggregates of small Beta-cells (70%, Short-arrow) having basophilic
granules, while the periphery comprises of large Alpha-cells (25%, Long-arrow) having
eosinophilic granules. Intervening these cells are seen thin walled capillaries.
ii. Group –II (Diabetic Control + Streptozotocin 45 mg/kg)
Section studied shows pancreatic lobules separated by connective tissue septa.
The number of islets appears reduced in number. The center of islet cells consist of
quantitative decrease in Beta-cells (30%, Long-arrow) having basophilic granules, while
the periphery comprises of large Alpha-cells (65%, Short-arrow) having eosinophilic
granules. Also seen are some degenerated beta cells and lymphocytic infiltration amidst
these islet cells.
iii. Group –III (Streptozotocin [45mg/kg] + Glibenclamide [5mg/kg])
Section studied shows pancreatic lobules separated by connective tissue septa.
Most of the lobules show large areas of light-staining islets of langerhans. The center of
islet cells consist of Beta-cells (60%, long-arrow) having basophilic granules, while the
periphery comprises of Alpha-cells (35%, short-arrow) having eosinophilic granules.
Also seen are few congested vascular spaces amidst these islet cells.
Please purchase PDF Split-Merge on www.verypdf.com to remove this watermark.Please purchase PDF Split-Merge on www.verypdf.com to remove this watermark.

Results and Discussion
349
iv. Group – IV (Streptozotocin [45mg/kg] + n-Hexane extract [300mg/kg])
Section studied shows pancreatic lobules separated by connective tissue septa.
The pancreatic lobules consist largely of the exocrine acini and their intralobular ducts.
Most of the lobules show small, round, light-staining islets of langerhans. The center of
islet cells consist of aggregates of small Beta-cells (60%, Short-arrow), while the
periphery comprises of large Alpha-cells (35%, Long-arrow). Intervening these cells are
seen thin walled capillaries.
v. Group – V (Streptozotocin [45mg/kg] + Ethyl acetate extract [300mg/kg])
Section studied shows pancreatic lobules separated by connective tissue septa.
The number of islets appears reduced in number. The center of islet cells consist of
quantitative decrease in Beta-cells (55%, long-arrow), while the periphery comprises of
large Alpha-cells (40%, short-arrow). Also seen are some degenerated beta cells.
vi. Group – VI (Streptozotocin [45mg/kg] + Methanol extract [300mg/kg])
Section studied shows pancreatic lobules separated by connective tissue septa.
Most of the lobules show large areas of light-staining islets of langerhans. The center of
islet cells consist of quantitative increase in Beta-cells (70%, short-arrow), while the
periphery comprises of Alpha-cells (25%, long-arrow). Also seen are congested vascular
spaces amidst these cells.
vii. Group – VI (Streptozotocin [45mg/kg] + Aqueous extract [300mg/kg])
Section studied shows pancreatic lobules separated by connective tissue septa.
The center of islet cells consist of small Beta-cells (65%, Short - arrow), while the
periphery comprises of large Alpha-cells (30%, Long - arrow).
Please purchase PDF Split-Merge on www.verypdf.com to remove this watermark.Please purchase PDF Split-Merge on www.verypdf.com to remove this watermark.

Results and Discussion
350
The histological evidence shown the authenticated injury caused by STZ and the
protection offered by HEFE, EAEFE, MEFW, AEFW and glibenclamide in pancreatic
cells are shown. Microscopically examination revealed loss of architecture and cell
necrosis with inflammatory collections in the central zone in STZ induced rats.
Histopathological study shows that Flemingia wightiania has the capacity to increase
islet cell mass. However, the expansion was better with MEFW and AEFW.
Glibenclamide a sulfonylurea derivative shows its action by stimulating the
pancreatic β-cells. This drugs act sensitive potassium (K ATP) channel present on the β-
cell membrane causes depolarization and triggers the opening of voltage dependent
calcium channels. This influx causes release of insulin from the stored granules in β-islet
cells of pancreas. In the same way the plant Flemingia wightiania also may have a similar
action in treatment of diabetes53
.
Group I Group II
Group III Group IV
Please purchase PDF Split-Merge on www.verypdf.com to remove this watermark.Please purchase PDF Split-Merge on www.verypdf.com to remove this watermark.

Results and Discussion
351
Group V Group VI
Group VII
Figure 18: Histopathology of Pancreas
Group –I (Normal control- Saline)
Group –II (Diabetic control-Streptozotocin 45 mg/kg)
Group –III (Streptozotocin [45mg/kg] + Glibenclamide [5mg/kg])
Group – IV (Streptozotocin [45mg/kg] + HEFW [300mg/kg])
Group – V (Streptozotocin [45mg/kg] + EAEFW [300mg/kg])
Group – VI (Streptozotocin [45mg/kg] + MEFW [300mg/kg])
Group – VII (Streptozotocin [45mg/kg] + AEFW [300mg/kg])
Please purchase PDF Split-Merge on www.verypdf.com to remove this watermark.Please purchase PDF Split-Merge on www.verypdf.com to remove this watermark.

Bibliography
352
BIBLIOGRAPHY
1. Murray P. R., Baron E. J., Pfallar M A, Tenover F. C., Yolke R. H. (1995) Manual of
clinical microbiology. 6th
edition. Washington, DC: ASM. pp.68.
2. Mokarram Hossain M.D., Israt Jahan Biva, et al. (2009) Central nervous system
depressant and analgesic activity of Aphanamixis polystachya (Wall.) parker leaf extract
in mice. Afr. J. Pharm. Pharmacol. 3(5):282-286.
3. Anar Patel., Timir Patel., et al. (2010) Evaluation of Anti inflammatory and Analgesic
activity of roots of Rubia cordifolia in rats. J.Pharm.Sci.Res. 2(12): 349-355.
4. Sunetra Patwardhan., Ghansham Sakhare. (2009) Evaluation of Analgesic Activity of
Cassia Fistula on Albino Mice. Pharmacologyonline. 2: 887-893.
5. Ahmed F., Hossain M. H., Rahman A. A., Shahid I. Z. (2006) Antinociceptive and
sedative effects of the bark of cerbera odollam Gaertn Ori Pharm. Exp. Med. 6: 344-348.
6. Ronaldo A. R., Mariana L. V., Sara M. T., Adriana B. P. P., Steve P., Ferreira S. H.,
Fernando Q. C. (2000) Involvement of resident macrophages and mast cells in the
writhing nociceptive response induced by zymosan and acetic acid in mice. Eur. J.
Pharmacol. 387: 111-118.
7. Voilley N. (2004)BAcid-Sensing Ion Channels (ASICs): New targets for the analgesic
effects of Non-Steroid Anti-Inflammatory Drugs (NSAIDs). Curr. Drug Targets- Inflam.
Aller. 3: 71-79.
8. Hossain M. M., Ali M. S., Saha A., Alimuzzaman M. (2006) Antinociceptive activity of
whole plant extracts of Paederia foetida. Dhaka Univ. J. Pharm. Sci 5: 67-69.
9. Ahamed K.N., Kumar V., Raja S., Mukherjee P.K. (2005) Anti-nociceptive and Anti-
inflammatory activity of Araucaria bidwilli Hook. Iranian J Pharm Ther. 105-9.
Please purchase PDF Split-Merge on www.verypdf.com to remove this watermark.Please purchase PDF Split-Merge on www.verypdf.com to remove this watermark.

Bibliography
353
10. Hosseinzadeh H., Younesi H. (2002) Anti-nociceptive and Anti-inflammatory effects
Crocus sativus L. and petal extracts in mice. BMC Pharmacol. 2: 7-13.
11. Yogesh Baravalia., Yogeshkumar Vaghasiya., Sumitra Chanda (2012). Brine Shrimp
Cytotoxicity, Anti-inflammatory and Analgesic Properties of Woodfordia fruticosa Kurz
Flowers. Iranian J Pharm Res. 11(3):851-861.
12. Bikash Kumar Nanda., Jyotirmoyee Jena., et al. (2010) Anti-inflammatory activity of
whole parts of Sphaeranthus indicus Linn. Der Pharmacia Lettre. 2 (1):181-188.
13. Margolius H.S. (1989) Tissue kallikrienes and kinins regulation and rolesin hypertensive
and diabetic diseases. Annu Rev Pharmacol Toxicol. 29:343-8.
14. Greenwald, R.A. (1991) Animal model for evaluation of arthritic drugs. Met Fin Exp Clin
Pharmacol. 13:75–83.
15. OECD Guidelines for the Testing of Chemical. Acute Oral Toxicity – Up and Down
Procedure (UDP) [Internet]. 2008 [Cited 2011 September 25]. Available from:
http://iccvam.niehs.nih.gov/SuppDocs/FedDocs/OECD/OEC Dtg425.pdf.
16. Jimam N.S., Wannang N.N., Omale S and Gotom B. (2010) Evaluation of the
hypoglycemic activity of Cucumis metuliferus (Cucurbitaceae) fruit pulp extract in
normoglycemic and alloxan-induced hyperglycemic rats. J Young Pharm. 2(4): 384-387.
17. Dolly Jaiswal., Prashant Kumar Rai., Amit Kumar., Shikha Mehta., Geeta Watal. (2009)
Effects of Moringaoleifera Lam. Leaves aqueous extract therapy on hyperglycemic rats. J
Ethanopharmacol. 123: 392-396.
18. Singh S.N., Vats P., Suri S., Shyam R., Kumria M.M.L., Ranganathan S., et al. (2001)
Effect of an antidiabetic extract of Catharanthus roseus on enzymatic activities in
streptozotocin induced diabetic rats. J Ethanopharmacol. 76: 269-77.
Please purchase PDF Split-Merge on www.verypdf.com to remove this watermark.Please purchase PDF Split-Merge on www.verypdf.com to remove this watermark.

Bibliography
354
19. Dolly Jaiswal., Prasanth Kumar Rai., Amit Kumar., Shikha Mehta., Geeta Watal. (2009)
Effect of Moringa oleifera Lam. leaves aqueous extract therapy on hypoglycemic rats. J
Ethanopharmacol. 123: 392-396.
20. Alain Jundo., Andre E Lambert., Westren Stauffacher., Albert E Renold. (1969)
Diabetogenic action of streptozotocin: relationship of dose to metabolic response. J Clin
Invest. 48: 2129-2139.
21. Pushparaj P.N., Low H.K., Manikandan J., Tan B.K.H., Tan C.H. (2007) Antidiabetic
effect of Cichorium intybus in streptozotocin induced diabetic rats. J Ethanopharmacol.
111: 430-434.
22. Doumas B.T., Arends R,L., Pinto P.C. (1972) In standard Methods of Clinical Chemistry.
Academic Press Chicago. 7:75-189.
23. Tietz NW (Ed). (1966) Textbook of Clinical Chemistry. W.B.Saunders. p.589.
24. Fawcett J.K., Scott J.E. (1960) A rapid and precise method for the determination of urea.
Clin J Path. 13:156-159.
25. Spectrophotometric and Patton C.J., Crouch S.R. (1977) kinetics investigation of the
Berthelot reaction for the determination of ammonia. Anal chem. 49:464-469.
26. Tietz NW (Ed). (1986) Textbook of Clinical Chemistry. W.B.Saunders. p.579.
27. Goodwin J.F., et al. (1965) Automation in Anal. Chem. Technicon Syumposia p. 315-320.
28. Jocobs N.J., Van Denmark P. (1960) Enzymatic determination of serum triglyceride. J
Arch Biochem Biophys. 88:250-255.
29. Trinder P. (1969) Determination of Glucose in blood using glucose-oxidase with an
alternative oxygen acceptor. Ann Clin Biochem. 6:24-27.
Please purchase PDF Split-Merge on www.verypdf.com to remove this watermark.Please purchase PDF Split-Merge on www.verypdf.com to remove this watermark.
Bibliography
355
30. Burit C.A., Ashwood E.R. (1994) Tietz Textbook of Clinical Chemistry, 2nd
edn.
Philadelphia, W.B.Saunders. p.2209.
31. Richmond. (1973) Colorimetric method of determination of total cholesterol and high-
density lipoprotein cholesterol (HDLc). Clin Chem. 19:1350-1356.
32. Overview and Recommendations. (1988) Current Strtus of Blood Cholestrol
Measurement. Clin Chem. 34(1):193-201.
33. Allain C.C., et al. (1974) Enzymatic determination of total serum cholesterol. Clin Chem.
20:470-475.
34. Stanley Alstead. (1940) Observations on Sahli’s Haemoglobinometer. Postgrad Med J. p.
278-286.
35. Adjene J.O., Avbunudiogba J.A., Igbigbi P.S. (2011) Oxidative stress induced by chronic
administration of Efavirenz on the intracranial visual relay centers of adult wister rats.
Biology and Medicine. 3(5):16-24.
36. Gelvan D., Saltman P. (1990) Different cellular targets of Cu- and Fe-catalyzed oxidation
observed using a Cu-compatible thiobarbiturate acid assay. Biochim Biophys Acta.
1035:353–360.
37. Ellman G.L. (1959) Tissue sulfhydryl groups. Arch Biochem Biophys. 82:70–77.
38. Luna L.G. (1986) Manual of Histology and staining methods of Armed Forces institute of
Pathology. 3rd
edn. New York: McGraw Hill .p.1-31.
39. Jimam N.S., Wannang N.N., Omale S., Gotom B. (2010) Evaluation of the hypoglycemic
activity of Cucumis metuliferus (Cucurbitaceae) fruit pulp extract in normoglycemic and
alloxan-induced hyperglycemic rats. J Young Pharm. 2(4): 384-387.
Please purchase PDF Split-Merge on www.verypdf.com to remove this watermark.Please purchase PDF Split-Merge on www.verypdf.com to remove this watermark.

Bibliography
356
40. Versphol E.J. (2002) Recommended testing in diabetic research. Planta Med. 68(7): 581-
90.
41. Achyut N. K., Rajesh K.G., Santhosh K.S., Sandhya D., Geeta wa. (2006) Hypoglycemic
and antihyperglycemic activity of Aegele marmelos seed extract in normal and diabetic
rats. J Ethanopharmacol. 107: 374-379.
42. Dolly J., Prasanth K. R., Amit K., Shikha M., Geeta W. (2009) Effect of Moringa oleifera
Lam. leaves aqueous extract therapy on hypoglycemic rats. J Ethanopharmacol. 123: 392-
396.
43. Venkatesh S., Reddy G.D., Reddy B.M., Lakshmi M.L. Antidiabetic activity of helicteres
isora root. Available from: URL: http://pdffinder.net/. Anti-diabetic-activity-of-helicteres-
isora-root. (Acessed on 10-7-2011).
44. John T., John A.C., Sasanka R., Alan B., Michael L.M. (1993) Biochemical evidence for
nitric oxide formation from Streptozotocin in isolated pancreatic islets. Biochem Biophy
Res Comm. 197(3): 1458-1464.
45. Szkudelski T. (2001) The mechanism of Alloxan and Streptozotocin action in B cells of
the rat pancreas. Physiol Res.50: 536-546.
46. Venkateswaran S., Pari L.( 2003) Effect of Coccinia indica leaves on antioxidant status in
streptozotocin-induced diabetic rats. J Ethanopharmacol. 84: 163-168.
47. Salahuddin M., Jalalpure S.S. (2010) Evaluation of Antidiabetic activity of Cassia glauca
Lam. leaf in Streptozotocin induced diabetic rats. Iranian J Pharm Ther. 9(1): 29-33.
48. Annamalai P., Subramaniam S., Viswanathan K.P. (2004) Influence of Casearia esculenta
root extract on protein metabolism and marker enzymes in streptozotocin induced diabetic
rats. Pol J Pharmacol. 56: 587-593.
Please purchase PDF Split-Merge on www.verypdf.com to remove this watermark.Please purchase PDF Split-Merge on www.verypdf.com to remove this watermark.
Bibliography
357
49. Mitra S.K., Gopumadhavan S., Muralidhar T.S., Anturlikar S.D, SujathaM.B. (1996)
Effect of a herbomineral preparation D-400 in streptozotocin induced diabetic rats. J
Ethnopharmacol. 54(1): 41-46.
50. Tao Xia, Qin Wang.( 2006) Antihyperglycemic effect of Cucurbita ficifolia fruit extract in
streptozotocin induced diabetic rats. Fitoterpia.77: 530-533.
51. Venkateswaran S., Pari L. (2003) Effect of Coccinia indica leaves on antioxidant status in
streptozotocin-induced diabetic rats. J Ethanopharmacol.; 84: 163-168.
52. Eidi A., Eidi M., Esmaeili E. (2006) Antidiabetic effect of garlic (Allium sativum L.) in
normal and streptozotocin-induced diabetic rats. Phytomedicine.13: 624-629.
53. Laurence Brunton, Keith Parker, Donald Blumenthal, Iain Buxton. (2006) Goodman and
Gilman’s. Manual of Pharmacology and therapeutics. 11th ed. Mc Graw Hill companies
(NY). pp. 1037-1058.
Please purchase PDF Split-Merge on www.verypdf.com to remove this watermark.Please purchase PDF Split-Merge on www.verypdf.com to remove this watermark.
Summary
358
SUMMARY
Chapter I
The general introduction of natural chemistry and importance of present research
work was given and also brief introduction on phyto constituents were presented.
Introduction to plants sources of drugs and some important medicinal plants used drugs
and their traditional use in treating diseases.
Chapter II
In this chapter gives detailed literature survey that is made on the selected plats
Mollugo oppositifolia, Smilax Perfoliata and Flemingia wightiania. A careful study of
literature revealed that on work is done on the whole plant of Mollugo oppositifolia. A
brief review on smilax species which includes phytochemical constituents, biological
activities and uses previously reported from other species and also literature review on
smilax perfoliata were included literature. Regarding the plant Flemingia wightiana the
literature study revealed that phytochemical constituents, biological activities and uses
previously reported from the species.
Chapter III
Chapter-III deals with the present work on Mollugo oppositifolia. The process of
extraction from the dried plant material of Mollugo oppositifolia, isolation and
characterization of the compounds from the methanolic extract of whole plant of Mollugo
oppositifolia are documented in this chapter.
Please purchase PDF Split-Merge on www.verypdf.com to remove this watermark.Please purchase PDF Split-Merge on www.verypdf.com to remove this watermark.
Summary
359
Compound MO-01 was obtained as white needles from 25% ethylacetate-hexane
fraction and has a molecular formula C35H60O6, m.p. 280-282 ºC. It gave positive result
for LB test for sterols. MO-01 was characterized as β-sitosterol glucoside.
Compound MO-02 was obtained as Flourescent yellow powder from 75% ethyl
acetate–methanol fraction and has a molecular formula C21H19O10, m.p – 236 ºC. It gave
positive result for Schinoda test for flavonoids. MO-02 was characterized as vitexin.
Compound MO-03 was obtained from 35% ethyl acetate –methanol fraction. It
was obtained as Dark brownish Crystals, having melting point 260-262 ºC. It showed
positive for Molisch’test, Saponin’s test. MP-03 was not characterized due to paucity of
sample.
Chapter IV
The n-Hexane, Ethyl acetate, Methanol and Aqueous extracts of Mollugo
oppositifolia shows significant zone of inhibition against bacteria and fungi.
In this study the n-Hexane, Ethyl acetate, Methanol and Aqueous extracts of
Mollugo oppositifolia is evaluated for its Analgesic activity of acetic acid induced
writhing in mice, tail flick method in rats and hot plate method in mice. The Methanol
and Aqueous extracts produced significantly analgesic activity. n-Hexane and Ethyl
acetate extracts showed less activity.
Anti-inflammatory activity evaluated was acute and chronic models of
inflammation. The acute inflammatory property the formalin induced paw oedema in rats
was employed and for acute anti-inflammatory activity, formalin-induced paw oedema in
rats was used. The result of study showed that methanol and aqueous extracts of Mollugo
Please purchase PDF Split-Merge on www.verypdf.com to remove this watermark.Please purchase PDF Split-Merge on www.verypdf.com to remove this watermark.
Summary
360
oppositifolia has showed significantly acute anti inflammatory activity. It also showed
significantly chronic anti inflammatory activity. n-Hexane and Ethyl acetate extracts
showed a less effect compare to the other two extracts.
The effect of extracts was investigated in normal rats and glucose over loaded
rats. The extracts were subjected to comparative evaluation of antidiabetic activity in
STZ (45 mg/kg) induced diabetic rats for a period of 21 days. The extracts showed a
significant glycemic control effect in normal rats and glucose over loaded rats. The
methanol and aqueous extracts showed a significant reduced in the blood glucose levels,
lipid profile and serum biomarkers in diabetic rats. n-Hexane and ethyl acetate extracts
showed a less effect compare to the other two extracts. The extracts also showed a
correspondent effect in enzymatic and non-enzymatic levels in diabetic rats. The whole
plant of Mollugo oppositifolia extracts showed an increased β-cell mass in islets of
pancreas.
Overall the whole plant extracts of Mollugo oppositifolia are having anti-
microbial, analgesic, anti-inflammatory and anti-diabetic effect and also antioxidant
activity in diabetic rats.
Chapter V
In this chapter phytochemical screening of the ethyl acetate extract of the entire
plant of Smilax perfoliata and the experimental work on Smilax perfoliata were
described. The extraction, isolation and characterization of the compounds from the ethyl
acetate extract of this plant are documented in this chapter.
Please purchase PDF Split-Merge on www.verypdf.com to remove this watermark.Please purchase PDF Split-Merge on www.verypdf.com to remove this watermark.
Summary
361
From the experimental work column chromatography afforded two compounds
designated as SP-01 and SP-02. These compounds were identified as 1, 3, 6 and 8 tetra
hydroxy anthraquinone and Rutin by spectral studies and by comparison with
authenticated sample.
Chapter VI
The n-Hexane, ethyl acetate, methanol and aqueous extracts of Smilax Perfoliata
shows significant zone of inhibition against bacteria and fungi.
In this study the n-Hexane, ethyl acetate, methanol and aqueous extracts of Smilax
Perfoliata is evaluated for its Analgesic activity of acetic acid induced writhing in mice,
tail flick method in rats and hot plate method in mice. The aqueous and methanol extracts
produced significantly analgesic activity. n-Hexane and ethyl acetate extracts showed less
activity.
Anti-inflammatory activity evaluated was acute and chronic models of
inflammation. The acute inflammatory property the formalin induced paw oedema in rats
was employed and for acute anti-inflammatory activity, formalin-induced paw oedema in
rats was used. The result of study showed that aqueous and methanol extracts of Smilax
Perfoliata has showed significantly acute anti inflammatory activity. It also showed
significantly chronic anti inflammatory activity. n-Hexane and Ethyl acetate extracts
showed a less effect compare to the other two extracts.
The effect of extracts was investigated in normal rats and glucose over loaded
rats. The extracts were subjected to comparative evaluation of antidiabetic activity in
STZ (45 mg/kg) induced diabetic rats for a period of 21 days. The extracts showed a
Please purchase PDF Split-Merge on www.verypdf.com to remove this watermark.Please purchase PDF Split-Merge on www.verypdf.com to remove this watermark.

Summary
362
significant glycemic control effect in normal rats and glucose over loaded rats. The
aqueous and methanol extracts showed a significant reduced in the blood glucose levels,
lipid profile and serum biomarkers in diabetic rats. n-Hexane and Ethyl acetate extracts
showed a less effect compare to the other two extracts. The extracts also showed a
correspondent effect in enzymatic and non-enzymatic levels in diabetic rats. The whole
plant of Smilax Perfoliata extracts showed an increased β-cell mass in islets of pancreas.
Overall the whole plant extracts of Smilax Perfoliata are having anti- microbial,
analgesic, anti-inflammatory and anti-diabetic effect and also antioxidant activity in
diabetic rats.
Chapter VII
In this chapter phytochemical examination of the extract of the entire plant
Flemingia wightiana and the experimental work on Flemingia wightiana were described.
The extraction, isolation and characterization of the compounds from the Ethyl acetate
extract of this plant are documented in this chapter. From the experimental work on
column chromatography afforded two compounds designated as FW1, FW-2. These
compounds were identified neo Flemingin –D, quercetin by spectral studies and by
comparison with authenticated sample.
Chapter VIII
The n-Hexane, ethyl acetate, methanol and aqueous extracts of Flemingia
wightiania shows significant zone of inhibition against bacteria and fungi.
Please purchase PDF Split-Merge on www.verypdf.com to remove this watermark.Please purchase PDF Split-Merge on www.verypdf.com to remove this watermark.
Summary
363
In this study the n-Hexane, Ethyl acetate, Methanol and Aqueous extracts of
Flemingia wightiania is evaluated for its Analgesic activity of acetic acid induced
writhing in mice, tail flick method in rats and hot plate method in mice. The Methanol
and Aqueous extracts produced significantly analgesic activity. n-Hexane and Ethyl
acetate extracts showed less activity.
Anti-inflammatory activity evaluated was acute and chronic models of
inflammation. The acute inflammatory property the formalin induced paw oedema in rats
was employed and for acute anti-inflammatory activity, formalin-induced paw oedema in
rats was used. The result of study showed that methanol and aqueous extracts of
Flemingia wightiania has showed significantly acute anti inflammatory activity. It also
showed significantly chronic anti inflammatory activity. n-Hexane and ethyl acetate
extracts showed a less effect compare to the other two extracts.
The effect of extracts was investigated in normal rats and glucose over loaded
rats. The extracts were subjected to comparative evaluation of antidiabetic activity in
STZ (45 mg/kg) induced diabetic rats for a period of 21 days. The extracts showed a
significant glycemic control effect in normal rats and glucose over loaded rats. The
methanol and aqueous extracts showed a significant reduced in the blood glucose levels,
lipid profile and serum biomarkers in diabetic rats. n-Hexane and ethyl acetate extracts
showed a less effect compare to the other two extracts. The extracts also showed a
correspondent effect in enzymatic and non-enzymatic levels in diabetic rats. The whole
plant of Flemingia wightiania extracts showed an increased β-cell mass in islets of
pancreas.
Please purchase PDF Split-Merge on www.verypdf.com to remove this watermark.Please purchase PDF Split-Merge on www.verypdf.com to remove this watermark.

Summary
364
Overall the whole plant extracts of Flemingia wightiania are having anti-
microbial, analgesic, anti-inflammatory and anti-diabetic effect and also antioxidant
activity in diabetic rats.
Please purchase PDF Split-Merge on www.verypdf.com to remove this watermark.Please purchase PDF Split-Merge on www.verypdf.com to remove this watermark.