EXPERIMENTAL VALIDATION OF A TDR-BASED SYSTEM FOR MEASURING LEAK DISTANCES
20
Progress In Electromagnetics Research, Vol. 132, 71–90, 2012 EXPERIMENTAL VALIDATION OF A TDR-BASED SYSTEM FOR MEASURING LEAK DISTANCES IN BURIED METAL PIPES A. Cataldo 1, * , G. Cannazza 1 , E. De Benedetto 1 , and N. Giaquinto 2 1 Department of Engineering for Innovation, University of Salento, via Monteroni, Lecce 73100, Italy 2 Department of Electrical and Electronic Engineering, Politecnico di Bari, Bari 70125, Italy Abstract—In this paper, the experimental validation of a time domain reflectometry (TDR)-based method for pinpointing water leaks in underground metal pipes is presented. The method relies on sensing the local change in the dielectric characteristics of the medium surrounding the leak point. The experimental validation of the method was carried out through measurements performed on a pilot plant (experimental case P1) and through on-the-field measurements performed on two ‘already-installed pipes’, i.e., already operating and connected to the water distribution system (experimental cases P2 and P3). For the pilot plant, different leak conditions were imposed and the corresponding TDR responses were acquired and analyzed. For the on- the-field measurements, TDR measurements were performed on pipes for which a leak-detection crew had preliminarily individuated the possible presence of leaks (through traditional leak-detection methods). Finally, in view of the practical implementation of the proposed TDR- based leak-detection system, a data-processing procedure (which gives an automatic evaluation of the position of the leak) is also presented. 1. INTRODUCTION The individuation of leaks is extremely important for the optimization and rationalization of water resources. Nevertheless, the techniques that are currently used for the detection of leaks in buried pipes (which are mainly based on electro-acoustic methods), are extremely Received 14 August 2012, Accepted 11 September 2012, Scheduled 21 September 2012 * Corresponding author: Andrea Cataldo ([email protected]).
Transcript of EXPERIMENTAL VALIDATION OF A TDR-BASED SYSTEM FOR MEASURING LEAK DISTANCES

Progress In Electromagnetics Research, Vol. 132, 71–90, 2012
EXPERIMENTAL VALIDATION OF A TDR-BASEDSYSTEM FOR MEASURING LEAK DISTANCES INBURIED METAL PIPES
A. Cataldo1, *, G. Cannazza1, E. De Benedetto1, andN. Giaquinto2
1Department of Engineering for Innovation, University of Salento, viaMonteroni, Lecce 73100, Italy2Department of Electrical and Electronic Engineering, Politecnico diBari, Bari 70125, Italy
Abstract—In this paper, the experimental validation of a timedomain reflectometry (TDR)-based method for pinpointing waterleaks in underground metal pipes is presented. The method relieson sensing the local change in the dielectric characteristics of themedium surrounding the leak point. The experimental validation of themethod was carried out through measurements performed on a pilotplant (experimental case P1) and through on-the-field measurementsperformed on two ‘already-installed pipes’, i.e., already operating andconnected to the water distribution system (experimental cases P2 andP3). For the pilot plant, different leak conditions were imposed and thecorresponding TDR responses were acquired and analyzed. For the on-the-field measurements, TDR measurements were performed on pipesfor which a leak-detection crew had preliminarily individuated thepossible presence of leaks (through traditional leak-detection methods).Finally, in view of the practical implementation of the proposed TDR-based leak-detection system, a data-processing procedure (which givesan automatic evaluation of the position of the leak) is also presented.
1. INTRODUCTION
The individuation of leaks is extremely important for the optimizationand rationalization of water resources. Nevertheless, the techniquesthat are currently used for the detection of leaks in buried pipes(which are mainly based on electro-acoustic methods), are extremely
Received 14 August 2012, Accepted 11 September 2012, Scheduled 21 September 2012* Corresponding author: Andrea Cataldo ([email protected]).
72 Cataldo et al.
time-consuming and require highly-experienced personnel [1, 2].Additionally, traditional methods can be affected by errors in the leaklocalization when the measurements cannot be performed in optimaloperating conditions (e.g., high hydraulic pressure in the pipeline,absence of environmental noise or interference and suitability of thepipe material to the sound propagation). As a consequence, thedevelopment of new leak detection methods is considered as the key forfavoring the control and monitoring possibilities. In this regard, muchresearch effort is constantly dedicated to the development of innovativemethodologies for leak detection, also resorting to methods based onautoregressive models [3], continuous wave sensors [4], and so on.
In [5–7], the authors have described a time domain reflectometry(TDR)-based method for leak detection. TDR is a well-establishedmonitoring technique that has been used for many differentapplications, such as dielectric and spectroscopic characterizations ofmaterials [8–11]; quantitative and qualitative control of liquids [12, 13];investigation of vegetable oils [14–16]; impedance measurements [17];dynamic structure analysis [18, 19]; fault diagnosis on wires [20, 21];distributed pressure profile [22]; soil moisture measurements [23–26];characterization of electronic devices devices and components [27–30]; etc. The method proposed by the authors is based on sensingthe change of dielectric characteristics that occurs in the soil whenwater escapes from the pipe. The presence of water (whose relativedielectric permittivity is approximately equal to 80) provokes a local,detectable change of the dielectric characteristics of the soil (whoserelative dielectric permittivity, in ‘dry conditions’, does not usuallyexceed 2–3).
In the present paper, the performance and the practical feasibilityof the method are evaluated, thus showing that the proposed leak-detection system yields accurate measurements of the position of theleaks in actual experimental conditions.
A first set of results (case P1) was obtained through experimentson a pilot plant (specifically installed for the purpose of validating theleak-detection system). The plant consisted in a 100 m long buriedmetal pipe, connected to the water distribution system. In the pipe,two leaks were intentionally created, so that it was possible to assessi) the sensitivity of the method as a function of the amount of timein which the leakage had been present; and, most importantly, ii) thepossibility of pinpointing two simultaneous leaks.
A second set of results was obtained in the context of an extensiveexperimental leak-detection campaign, performed on a number ofalready installed metallic pipes (i.e., pipes that were already operatingand connected to the water distribution system). TDR measurements

Progress In Electromagnetics Research, Vol. 132, 2012 73
were performed on pipes where a leak-detection crew had preliminarilyindividuated the possible presence of leaks. For the sake of brevity,only two experimental cases (cases P2, P3) of the aforementionedexperimental campaign are reported herein; however, these cases arerepresentative of the typical results obtained on the field.
Finally, with regards to the accurate localization of the leak, thepaper also describes a dedicated data-processing algorithm that wasspecifically implemented to automatically assess the leak positions andto enhance the measurement accuracy. The results reported in thispaper were obtained by means of the implemented algorithm.
The paper is organized as follows. Section 2 describes themeasurement method, recalling the theoretical background, itspractical application, and the employed equations. Section 3 describesthe details of the experimental campaign and reports the rawmeasurement results. Section 4 discusses the method to extractaccurate estimates of leaks positions from the TDR waveforms, andthe signal processing algorithm employed to obtain the estimates.Section 5 reports and discusses the final quantitative experimentalresults. Section 6 contains final considerations and conclusions.
2. DESCRIPTION OF THE MEASUREMENT METHOD
2.1. Theoretical Background
As described in [5], the TDR-based leak detection system exploits thephysical principles of TDR-based investigation of materials. Generally,this kind of measurements relies on the analysis of the signal that isreflected when an appropriate electromagnetic (EM) signal (typically,a voltage step signal with very fast rise-time) is propagated alonga probe (sensing element) inserted in the material under test. Thereflected signal, in fact, carries useful information on the dielectriccharacteristics of the material in which the sensing element is inserted.Therefore, through a suitable data-processing, it is possible to retrieveother intrinsic (qualitative and quantitative) characteristics of theconsidered material [31].
In TDR measurements, the time-dependent reflection coefficient(ρ) of the material/device under test can be directly displayed as afunction of the apparent distance (dapp) traveled by the signal thatpropagates along the sensing element. In turn, ρ is defined as the ratiobetween the amplitude of the signal that is reflected by the systemunder test (vrefl) and the amplitude of the signal generated by theTDR instrument (vinc) [32]:
ρ =vrefl
vinc, (1)

74 Cataldo et al.
where −1 ≤ ρ ≤ +1, and vinc and vrefl are function of dapp.The quantity dapp can be considered as the distance that would
be traveled by the EM signal in the same interval of time, if thesignal were propagating at c, which is the speed of light in vacuum(c ≈ 3 · 108 ms−1). dapp can be associated to the ‘actual’ physicallength traveled by the signal (d), through the following equation:
dapp =√
εapp d =c tt2
, (2)
where tt is the travel time (round-trip time taken by the signal totravel the physical distance d) and εapp is referred to as apparentrelative dielectric permittivity of the medium in which the signalpropagates [33]. It is worth noting that for low-loss, low-dispersivematerials, εapp can be considered practically constant in a widefrequency range [34]. The behavior of ρ is strictly associated withthe impedance variations along the electrical path traveled by the EMsignal. A constant value of ρ means that the dielectric characteristics inthat ‘portion of path’ are practically uniform. Vice versa, variations ofρ indicate that the dielectric characteristics (and, hence, the electricalimpedance) change along the traveled electrical path.
2.2. Description of the Measurement System
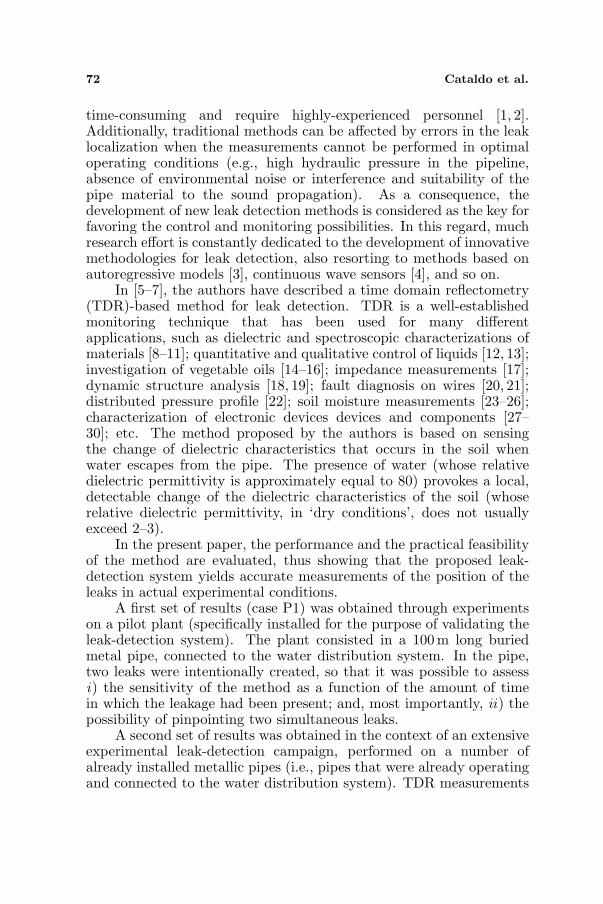
The upper sketch of Figure 1 shows a schematization of the typicalexperimental setup. The capital letters indicate the most significantpoints of the apparatus. The sensing element consists of a two-conductor transmission line (TL): the metal pipe acts as one of theelectrodes and a metallic wire (laid down on the road surface, incorrespondence of and parallel to the pipe) acts as the second electrode.The reflectometric signal propagates along this two-conductor TL; asa result, the soil becomes the propagation medium.
In presence of a water leak, there will be a local change ofthe dielectric characteristics of the soil (in fact, water has a highrelative dielectric permittivity with respect to soil); therefore, incorrespondence of a leak, there will be a change of the reflectogram(generally, a relative minimum is observed). A schematization of areflectogram in presence of two leaks (at point E1 and E2) is shown inthe lower sketch of Figure 1. For each leak, the reflectogram directlyprovides, in principle, the apparent position of the leak, Lapp
Ei ; and,through a suitable data-processing, it is possible to retrieve the actualposition of the leak, LEi (in this case, i = 1, 2).
From Figure 1, it is also possible to see the other elements of themeasurement apparatus. A coaxial cable (with an approximate lengthof 3m) is connected to the TDR output port (this allows reducing the
Progress In Electromagnetics Research, Vol. 132, 2012 75
Figure 1. Schematization of the experimental apparatus (uppersketch) and corresponding schematized TDR waveform in presence oftwo leaks (lower sketch).
effect of undesired impedance mismatches [5]); in turn, the beginningof the metallic wire is connected to the signal pin of the coaxial cable(point B). The length of the metallic wire must be chosen accordinglyto the length of pipe that is being inspected; in fact, the length of thiswire is the length of the sensing element (Lse). The end of the sensingelement (i.e., the distal end of the wire, point D) is left open-ended.Finally, a short wire is used to connect the outer conductor of the TDRoutput port to the valve stem of the underground metal pipe (point A).
With reference to the TDR waveform schematized in Figure 1, theabscissa dapp indicates the apparent distance as directly displayed inthe reflectogram; the quantity Lapp
E1 indicates the apparent distance ofthe leak E1 from point B; and Lapp
E2 indicates the apparent distance of

76 Cataldo et al.
the leak E2 from point B.In normal operating conditions of the pipe (i.e., if no leak is
present), ρ would have a constant value along the length of the sensingelement. On the other hand, the presence of water associated to aleak causes a local variation of the measured ρ (typically associated tothe presence of a relative minimum of the amplitude of the reflectedsignal).
As reported in [5], the physical position of the i-th leak isindividuated through the following equation:
LEi ≈Lapp
Ei√εapp
=Lapp
Ei
Lappse /Lse
=dapp
Ei − d appB(
dappD − dapp
B
)/Lse
. (3)
Therefore, to calculate the position of the leak from Eq. (3), it isnecessary to determine dapp
B , dappD , and dapp
Ei .On a final note, it is worth mentioning that the employment
of the proposed system is not limited to the topology depicted inFigure 1. In particular, the proposed system can also be used for treenetworks and branched pipelines; in fact, in these cases, it is enough toappropriately move the metallic wire so as to make it follow the pathof the underground pipe that is being tested (even when the pipe hasa hairpin bend).
3. DESCRIPTION OF THE EXPERIMENTALCAMPAIGN AND DISCUSSION OF THE RAWMEASUREMENT RESULTS
3.1. Description of the Apparatus
As schematized in Figure 1, the measurement apparatus includes aTDR instrument, a laptop with the system management software, ametallic wire (which, together with the pipe, forms the sensing element)and the accessories needed for the connections. Since the goal of thework is to demonstrate the practical feasibility of the measurementmethod, it is important to provide a few practical details for performingcorrect and successful on-the-field measurements.
Considering the specific application, it is preferable to use acompact, portable TDR instrument, with possibility of being battery-powered. The metallic wire must be anchored to the road surface (withnails or adhesive tape), thus guaranteeing the stability of the mutualdistance of the electrodes while the measurement is being performed.As aforementioned, the other electrode (i.e., the underground metalpipe) must be contacted to the reference ground of the output port ofthe TDR unit. It must be pointed out that this step is particularly

Progress In Electromagnetics Research, Vol. 132, 2012 77
important: in fact, although theoretically obvious, it is non-trivial, andof paramount practical importance, to guarantee the stable electricalcontinuity between reference ground and metal pipe. Unfortunately,rust on the valve stem may compromise the electrical continuity:therefore, it is always necessary to verify the electrical continuitythrough a portable multimeter. As a rule of thumb, based on theexperience of the authors, to ensure a good electrical continuity, themeasured resistance between (A) and (F) must be as low as 1–2 Ω. Incase the value of electrical resistance is higher, then it is necessary toabrade with sandpaper the contact point to the pipe.
TDR measurements presented in the paper were performedthrough the Hyperlabs HL1500. This TDR instrument is a low-cost, portable unit, which makes it particularly useful for on-the-field applications. The HL1500, which is a single-port instrument,generates a step-like signal with a rise time of 200 ps; the amplitude ofthe signal is 250 mV. The output port has a BNC connector, and theoutput impedance is 50Ω. Each TDR measurement reported hereinwas acquired with 2048 measurements points and was the result of 128automatic averages.
3.2. Tests on the Pilot Plant
To test the suitability of the proposed system under imposed leakageconditions (in particular, to assess the performance of the system inpresence of two leaks) and in correspondence of an increasing amountof leaked water (in particular, in correspondence of an incipient leak),a new metal pipe was installed and connected to the water distributionsystem. The installed pipe was made of gray cast iron; it was 100 m-long and had a diameter of 150 mm [6]. The topology of the pilotplant was similar to that depicted in the upper sketch of Figure 1, i.e.,a straight pipeline with no derivations.
For this experimental case (P1), TDR measurements wereperformed in three different conditions:(i) with no leakage;(ii) causing water leakage from two different points (E1 and E2);(iii) causing water leakage from just one point (E1).In order to cause different leak conditions, two holes were intentionallycreated on the pipe, at reference (known) positions E1 and E2: inparticular, the hole at point E2 was significantly bigger than thehole at point E1. With reference to the schematization of Figure 1,distances were set as follows: L0
∼= 2.0m; L0 + LE1∼= 29.0m; and
L0 + LE2∼= 60.0m. After the holes had been created, the pipe was
buried approximately 1 m underground.

78 Cataldo et al.
(a) (b)
Figure 2. Raw TDR waveforms for the pilot-test case of P1 when no-leak is present (reference waveform), (a) in presence of one leak, andin the simultaneous presence of two leaks, (b) zoom of the beginningof the waveforms.
First operating condition: no leakage. This condition representsthe standard operating condition of the ‘undamaged’ pipe. In fact,although the holes were present, the gate valve was closed (i.e., nowater ran through the pipe and, hence, there was no water leakage).The acquired TDR waveform is shown in Figure 2(a) (red curve withcircles). From this waveform, it can be seen that the value of ρ isapproximately constant at 0.7, until dapp ≈ 160m, where the end ofthe sensing element begins to be sensed.
Second operating condition: simultaneous water leakage from twodifferent points. Successively, the gate valve was opened, and waterbegan running through the pipe. As a result, water also began leakingthrough the holes at E1 and E2. After approximately three hours,a TDR waveform was acquired (curve with squares in Figure 2(a).It can be seen that two local minima appear, each corresponding toone leakage point. Indeed, the most significant variation of ρ startsto occur at approximately dapp ≈ 100m, due to the bigger amountof water escaping from the hole at point E2. The other minimumbegins to be noticeable (at approximately dapp ≈ 47m), since the wateramount in proximity of E1 begins to be considerable, thus leading toa corresponding variation of the TDR response.
Third operating condition: water leakage just from one point. Forobtaining this condition, the leak at point E2 was repaired by placinga split sleeve repair clamp. After the repair, in order not to influencesuccessive measurement, the length of pipe in correspondence of pointE2 was buried with dry soil (i.e., not with the wet soil that was removedduring the intervention repair).

Progress In Electromagnetics Research, Vol. 132, 2012 79
In this condition (i.e., with only one unrepaired hole at pointE1), the gate valve was opened and water was made run throughthe pipe for approximately 24 hours. Finally, another TDR waveformwas acquired (blue curve with triangles in Figure 2(a)). Two majorconclusions can be drawn from this curve: i) that the local minimumin correspondence of the leak at point E1 is more evident (because ofthe higher amount of water that had leaked for a total of 27 hours);and most importantly ii) that in correspondence of the point E2, thevalue of the reflection coefficient is, practically, equal to that previouslymeasured in the no-leakage condition, as a result of the fact that theleakage was eliminated.
3.3. Tests Performed through an on-the-field MeasurementCampaign
Additional experiments were carried out on already-installed metalpipes. In practice, a leak-detection crew had individuated the possiblepresence of leaks in a number of pipes (the crew had used traditionalmethods: listening rod, geophones and correlator). Successively, thesame pipes were inspected through the proposed TDR-based system.Finally, the presence (or absence) of the ‘supposed’ leak was verifiedex post (through excavation during the repair intervention).
The reported experimental cases are referred to as P2 and P3.For each considered case, the same experimental apparatus shown inFigure 1 was used. For P2 and P3, the diameter of the metallic wirewas 5mm and the length (Lse) was 98.9 m (chosen according to thelength of pipe to be inspected). The length of the coaxial cable was3m in all the considered cases. It is worth mentioning that, in both thecases P2 and P3, the considered pipes were straight pipelines, without
Figure 3. TDR waveforms acquired in the experimental cases P2 andP3.

80 Cataldo et al.
derivations (at least, in the inspected portions of pipes). Figure 3shows the results obtained in the experimental cases P2 and P3. Itcan be seen that there are strong variations caused by large amount ofwater leakage, which occurs approximately at an apparent distance of100m and 80 m, for P2 and P3, respectively. Finally, the open-endedtermination (point D) occurs at an apparent distance of approximately200m.
4. EVALUATION OF THE POSITION OF THE LEAKS
In the previous section, the points B, D and Ei in the TDR signal havebeen located quite roughly through a qualitative analysis of the TDRwaveform. Nevertheless, to determine the position of the leak usingEq. (3), it is necessary to accurately evaluate the quantities dapp
B , dappD ,
and dappEi . For this purpose, a proper processing of the TDR data must
be carried out.The abscissa dapp
B is easy to determine precisely (i.e., withnegligible ambiguity and high repeatability). In fact, it correspondsto the abrupt change in ρ, caused by the high impedance mismatchat the physical point B. In this point, the TDR signal exhibits a clearabrupt jump, with ρ going from a very low value to a positive value(approximately 0.8 in the considered cases).
The abscissae dappD corresponds to the end of the transmission line
formed by the wire and the pipe; this quantity can be individuatedas the maximum of the derivative ρ′. In fact, for an ideal open-circuited termination, the ρ curve in correspondence of the end of thesensing element should be a vertical line that reaches approximately 1.In practical applications, because the soil acts as a load at the endof the sensing element and because of the dissipative effects of thepropagation medium (which slows down the electromagnetic signal),the end of the line appears ‘smeared’. Generally, the end of the sensingelement falls in correspondence of the point where ρ has the maximumpositive slope (i.e., at the maximum of ρ′).
Finally, the quantity dappEi corresponds to the leakage point. As
already seen in the previous section, the leaked water causes thepresence of a dip (typically, a local minimum) in the TDR waveform,in correspondence of the leakage point. Based on the shape of this dip,it is possible to make some considerations.
When the dip is not wide, it generally means that the variationof ρ occurs within a limited area; hence, it is reasonable to assumethat only a small amount of water has escaped and/or the leak is onlyincipient. In these cases, dapp
Ei is best inferred as the local minimum ofthe dip of the ρ curve (or, zero-crossing of the derivative).

Progress In Electromagnetics Research, Vol. 132, 2012 81
On the other hand, when the dip is wide (i.e., it extends for severalmeters of apparent length), it is reasonable to assume that there is abig amount of escaped water. In this case, the position of the leakis best inferred as the inflection point that leads to the dip in the ρcurve. In fact, the falling portion of the dip in the ρ curve roughlycorresponds to the area in which the soil ‘starts to be sensed’ as wet.This point is individuated as the point with maximum negative slopeof ρ (i.e., as the local minimum of ρ′) [35, 36]. As will be detailed in thefollowing paragraphs, the experimental results so far have confirmedthe aforementioned considerations.
The individuation of the position of points D and Ei directly fromthe raw TDR waveform (i.e., from the TDR signal as acquired by theinstrument) may be quite difficult. In fact, in practical applications,the ρ curve is noisy and the correct interpretation is not a trivial task.As a direct consequence, also calculating the first derivative of theraw TDR signal would lead to a very noisy ρ′ curve, which wouldcompromise the accuracy in the evaluation of the involved distances.For these reasons, to obtain a less-noisy ρ curve (and/or a less noisyρ′), a dedicated algorithm was implemented in MATLAB. The data-processing performed by the algorithm is based on the well-knownNicolson method for the spectral analysis and filtering of step-likesignals [37].
The algorithm also includes the operations for calculating theposition of the leaks.
4.1. Data Processing for the Automatic Pinpointing of theLeak
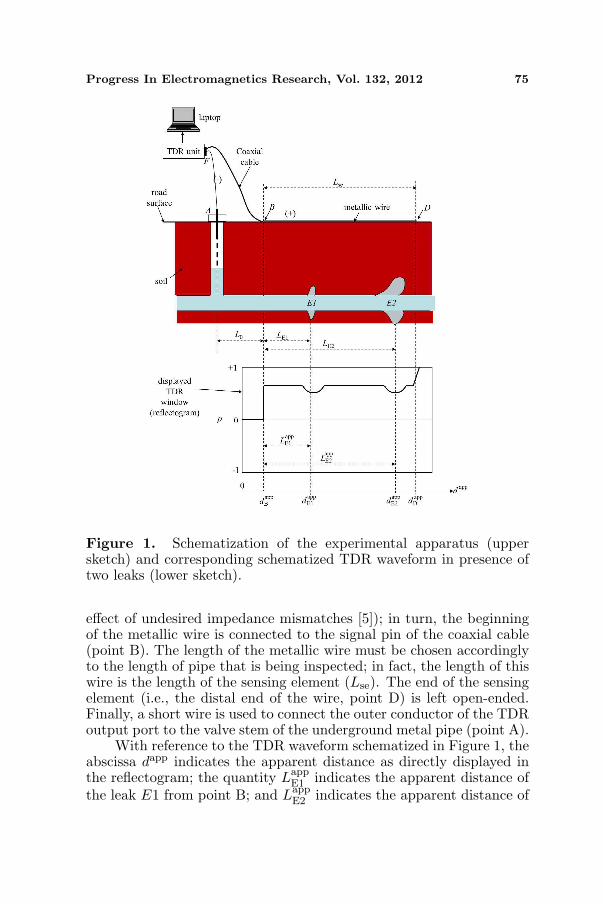
In this subsection, the algorithm is described referring to theexperimental case P2. The basic operations performed by thealgorithm are summarized in Figure 4. It is worth mentioning that,although for the sake of clarity the reported elaboration refers tothe presence of only one leak (and the subscript ‘i’ is dropped), thealgorithm can also successfully be used to individuate multiple leaks.
The first step is to select a suitable portion of the TDR waveform,thus windowing out those portions of the signal that do not carry usefulinformation on the position of the leak and that, on the contrary, couldjeopardize the FFT-based fitting of the curve.
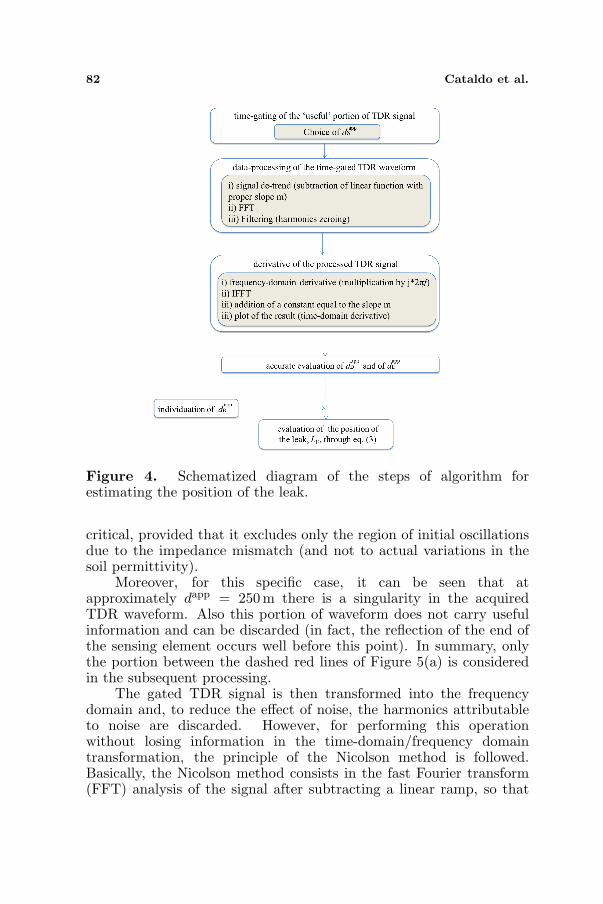
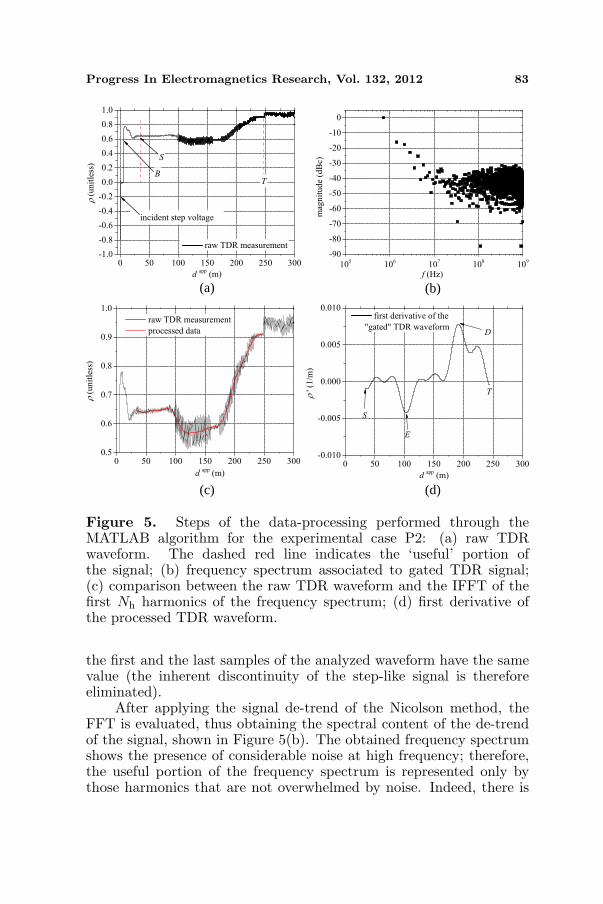
With regards to the case P2, Figure 5(a) shows the acquired TDRwaveform. Since the sensing element begins at point B, the portionof waveform before this point can be discarded. Indeed, because ofthe presence of impedance mismatch, it is preferable to window out allthe portion of the waveform up to the point where the signal appearsto have settled to a constant value (point S). The choice of S is not
82 Cataldo et al.
Figure 4. Schematized diagram of the steps of algorithm forestimating the position of the leak.
critical, provided that it excludes only the region of initial oscillationsdue to the impedance mismatch (and not to actual variations in thesoil permittivity).
Moreover, for this specific case, it can be seen that atapproximately dapp = 250 m there is a singularity in the acquiredTDR waveform. Also this portion of waveform does not carry usefulinformation and can be discarded (in fact, the reflection of the end ofthe sensing element occurs well before this point). In summary, onlythe portion between the dashed red lines of Figure 5(a) is consideredin the subsequent processing.
The gated TDR signal is then transformed into the frequencydomain and, to reduce the effect of noise, the harmonics attributableto noise are discarded. However, for performing this operationwithout losing information in the time-domain/frequency domaintransformation, the principle of the Nicolson method is followed.Basically, the Nicolson method consists in the fast Fourier transform(FFT) analysis of the signal after subtracting a linear ramp, so that
Progress In Electromagnetics Research, Vol. 132, 2012 83
(a) (b)
(c) (d)
Figure 5. Steps of the data-processing performed through theMATLAB algorithm for the experimental case P2: (a) raw TDRwaveform. The dashed red line indicates the ‘useful’ portion ofthe signal; (b) frequency spectrum associated to gated TDR signal;(c) comparison between the raw TDR waveform and the IFFT of thefirst Nh harmonics of the frequency spectrum; (d) first derivative ofthe processed TDR waveform.
the first and the last samples of the analyzed waveform have the samevalue (the inherent discontinuity of the step-like signal is thereforeeliminated).
After applying the signal de-trend of the Nicolson method, theFFT is evaluated, thus obtaining the spectral content of the de-trendof the signal, shown in Figure 5(b). The obtained frequency spectrumshows the presence of considerable noise at high frequency; therefore,the useful portion of the frequency spectrum is represented only bythose harmonics that are not overwhelmed by noise. Indeed, there is

84 Cataldo et al.
not a fixed rule on the number of harmonics (Nh) to be considered‘useful’; as a rule of thumb it is important to consider only thoseharmonics that are clearly distinguishable from noise.
Once the Nh harmonics are chosen, the inverse fast Fouriertransform (IFFT) is applied, then the Nicolson scaling is removedand finally the corresponding filtered TDR waveform is obtained.Figure 5(c) compares the raw TDR waveform with the filtered TDRwaveform. It can be seen that in the filtered waveform, noise isdramatically reduced.
Successively, the derivative of the signal is evaluated, and dappD is
assessed as the local maximum of ρ′ (Figure 5(d)). As for the quantitydapp
E , based on the shape of the dip in correspondence of the leak inthe P2 case, it was calculated as the local minimum of ρ′.
All these quantities are finally used by the algorithm to calculatethe physical position of the leak, LE, through Eq. (3).
It should be pointed out that the derivative in the time domainmight be also calculated by taking the IFFT of the signal and thenthe differences between consecutive samples. Nevertheless, this mightintroduce errors; in fact, the sampling interval must be assumed tobe small enough to substitute an infinitesimal increment. Theseerrors (which are often negligible in many practical case) is totallyabsent when calculating the derivative in the frequency domain(multiplication of the harmonics at frequency fh by j2πfh (wherej = (−1)1/2), and then taking the IFFT).
5. FINAL EXPERIMENTAL RESULTS
The processing algorithm described in the previous section wasapplied for determining the position of the leaks in all the reportedexperimental cases. For each case, Table 1 summarizes the length of
Table 1. Summarized results in the pinpointing of the leak for thereported experimental cases P1, P2, and P3.
Experimental case Lse Nh LactE1 Leval
E1 LactE2 Leval
E2
(m) (m) (m) (m) (m)
P1 (2 leaks) 96.9 14 27 20.1* 58 54.3
P1 (1 leak) 96.9 10 27 27.9* - -
P2 98.9 6 53.6 51.4 - -
P3 98.9 7 42 39.9 - -
**value calculated as the local minimum of the ρ curve

Progress In Electromagnetics Research, Vol. 132, 2012 85
the used wire (Lse); the actual position of the i-th leak as imposed or asverified after excavation (Lact
Ei ); the number of harmonics included inthe data processing (Nh); and the position of the i-th leak as evaluatedthrough the described algorithm (Leval
Ei ).Results show that there is an overall good agreement between
the evaluated position and the actual position of the leaks. Thisdemonstrates that, in practical applications, the proposed TDR-basedsystem can be successfully used to determine the unknown position ofleaks in already-installed underground metal pipes.
It should be pointed out that, except for the leak E1 in P1 (in twodifferent cases indicated with an asterisk), the positions of the leaksreported in Table 1 were obtained by searching for the local minimum ofthe ρ′ curve. In fact, as mentioned in[5], in presence of profuse leakage(big amount of water escaped and/or the leak has been present forlonger times), the position of the leak is individuated accurately as thelocal minimum of the ρ′ (i.e., the inflection point that leads to the localminimum of ρ). This is the condition of cases P2, P3, in which theleaks had been present for a long time before the TDR measurementswere performed. This also occurs for leak E2 of case P1: in fact, thehole provoked in E2 was bigger and, similarly to the previous cases, itled to a much bigger amount of escaped water. Basically, the reason isthat the big amount of water slows down the propagation of the signal.
On the other hand, in presence of an incipient leak (in which thereis little water and/or water has had little time to diffuse through thesoil), the position of the leak is best inferred as the local minimum ofthe ρ curve. This is the case of leak E1 in the P1 case, in which asmall hole was provoked and TDR measurements were performed onlyhours later.
As a further demonstration of these considerations, it is worthmentioning that when the position of the leak at E1 in the P1 casewas evaluated by searching for the local minimum of ρ (rather thansearching for the local minimum of ρ′), the value of Leval
E was 10 m inthe case of one leak and 14m in the presence of two leaks: both thesevalues are quite different from the actual position of the leak (27 m).It is important to mention a specific aspect regarding the evaluationof εapp for solving Eq. (3). The fact that the obtained results areaffected only by a small error (when comparing the evaluated positionof the leak with the reference position) demonstrates that, in each case,having considered the soil as homogeneous (and, hence, considering theoverall εapp practically constant, rather than using a specific dielectricmixing model for describing the dielectric characteristics of the soil),does not represent a problematic source of error.
Finally, with respect to the practical implementation of the
86 Cataldo et al.
method, it is worth making some considerations on the performanceof the proposed system in presence of or after rain. Although theproposed leak-detection method is based on detecting changes in thevalue of the soil permittivity, in general, the performance of theproposed system is expected not to be dramatically influenced by rain(unless the street is flooded with water). Clearly, the performance ofthe system after heavy rain depends on how much the soil gets soakedwith water. As a rule of thumb, it can be said that the system workscorrectly as long as the permittivity of the soil in proximity of theleak is sufficiently different from the permittivity of the surroundingsoil. Unfortunately, a definitive value may not be given, because it isnot trivial to measure a-priori the permittivity of the soil in proximityof the leak. However, in the experience of the authors, the typicalscenarios that may occur can be grouped into two main categories:
1) If the road surface on which the metallic wire is laid downis asphalt, then water is often drained by the asphalt itself and doesnot penetrate (excessively) the soil below. In such a condition, theperformance of the system is not influenced by rain (similarly, if theroad surface is made with stone, water does not penetrate below).
2) If the road surface is soil (for example, in countryside areas)then the penetration of water due to rain might be considerable(depending on the soil structure) and the performance of the system,in such circumstance, may not be adequate. However, in this case,in order to understand whether the condition of the soil allows anoptimal performance of the leak-detection method, it is possible toobtain a prompt estimation of the approximate value of permittivityof the soil; hence, deducing the amount of rain water that has soakedthe soil (if any). Such a measurement can be done preliminarily withthe same TDR instrument that would be used for inspecting the pipe.In fact, it is possible to use the well-known three-rod probes connectedto the TDR instrument and inserted in the soil [38]. This preliminarymeasurement could be performed every time that there are doubtson whether the (dielectric/moisture) characteristics of the soil maycompromise the accuracy of the method.
6. CONCLUSION
In this work, the experimental validation of an innovative method forpinpointing water leaks in underground metal pipes was presented.The reported experimental data were obtained from measurementson a pilot plant (in which leaks were intentionally created at knownpositions and for a known time) and through on-the-field measurements(in these cases, the actual position of the leaks was found after

Progress In Electromagnetics Research, Vol. 132, 2012 87
excavation). Additionally, the processing algorithm for the automaticevaluation of the position of the leak was described in detail. Theexperimental cases reported herein showed that the proposed systemcan be used to accurately pinpoint the position of the leak, alsoin presence of multiple leaks along the same length of pipe underinvestigation. It must be highlighted that the proposed systemdramatically reduces the inspection time required by traditionalmethods and, additionally, it can be employed regardless of theoperating conditions of the pipe (i.e., no need for high water pressure).The reported results, in particular, demonstrate that, by employingthe proposed TDR method, it is possible to inspect hundreds-of-meterslong buried pipes in a single shot.
REFERENCES
1. Farley, M. and S. Trow, Losses in Water Distribution Networks,1st Edition, IWA Publishing, London, UK, 2003.
2. Puust, R., Z. Kapelan, D. A. Savic, and T. Koppel, “A review ofmethods for leakage management in pipe networks,” Urban WaterJournal, Vol. 7, No. 1, 25–45, 2010.
3. Wang, G., D. Dong, and C. Fang, “Leak detection for transportpipelines based on autoregressive modeling,” IEEE Transactionson Instrumentation and Measurement, Vol. 42, No. 1, 68–71, 1993.
4. Bimpas, M., A. Amditis, and N. Uzunoglu, “Detection of waterleaks in supply pipes using continuous wave sensor operating at2.45GHz,” Journal of Applied Geophysics, Vol. 70, No. 3, 226–236,2010.
5. Cataldo, A., G. Cannazza, E. De Benedetto, and N. Giaquinto, “Anew method for detecting leaks in underground water pipelines,”IEEE Sensors Journal, Vol. 12, No. 6, 1660–1667, 2012.
6. Cataldo, A., G. Cannazza, E. De Benedetto, and N. Giaquinto,“Performance evaluation of a TDR-based system for detection ofleaks in buried pipes,” Proceedings of IEEE 2012 InternationalInstrumentation and Measurement Technology Conference, 792–795, Graz, Austria, May 2012.
7. “Apparatus and method for detection and localization ofleaks and faults in underground pipes,” WO Patent PendingBA2011A000034, 2011.
8. Cataldo, A., L. Catarinucci, L. Tarricone, F. Attivissimo, andA. Trotta, “A frequency-domain method for extending TDRperformance in quality determination of fluids,” MeasurementScience and Technology, Vol. 18, No. 3, 675–688, 2007.

88 Cataldo et al.
9. Hager, III, N. E., “Broadband time-domain-reflectometry dielec-tric spectroscopy using variable-time-scale sampling,” Review ofScientific Instruments, Vol. 64, No. 4, 887–891, 1994.
10. Moradi, G. and A. Abdipour, “Measuring the permittivityof dielectric materials using STDR approach,” Progress InElectromagnetics Research, Vol. 77, 357–365, 2007.
11. Nozaki, R. and T. K. Bose, “Broadband complex permittivitymeasurements by time-domain spectroscopy,” IEEE Trans.Instrum. Meas., Vol. 39, No. 6, 945–951, 1990.
12. Cataldo, A., L. Catarinucci, L. Tarricone, F. Attivissimo,and E. Piuzzi, “A combined TD-FD method for enhancedreflectometry measurements in liquid quality monitoring,” IEEETransactions on Instrumentation and Measurement, Vol. 58,No. 10, 3534–3543, 2009.
13. Piuzzi, E., A. Cataldo, and L. Catarinucci, “Enhancedreflectometry measurements of permittivities and levels inlayered petrochemical liquids using an ‘in-situ’ coaxial probe,”Measurement, Vol. 42, No. 5, 685–696, 2009.
14. Cataldo, A., E. Piuzzi, G. Cannazza, E. De Benedetto, andL. Tarricone, “Quality and anti-adulteration control of vegetableoils through microwave dielectric spectroscopy,” Measurement,Vol. 43, No. 8, 1031–1039, 2010.
15. Cataldo, A., E. Piuzzi, G. Cannazza, and E. De Benedetto,“Dielectric spectroscopy of liquids through a combined approach:evaluation of the metrological performance and feasibility studyon vegetable oils,” IEEE Sensors Journal, Vol. 9, No. 10, 1226–1233, 2009.
16. Cataldo, A., E. Piuzzi, G. Cannazza, and E. De Benedetto,“Classification and adulteration control of vegetable oils based onmicrowave reflectometry analysis,” Journal of Food Engineering,Vol. 112, No. 4, 338–345, 2012.
17. Liu, Y., L. Tong, W.-X. Zhu, Y. Tian, and B. Gao, “Impedancemeasurements of nonuniform transmission lines in time domainusing an improved recursive multiple reflection computationmethod,” Progress In Electromagnetics Research, Vol. 117, 149–164, 2011.
18. Bishop, J., D. Pommerenke, and G. Chen, “A rapid-acquisitionelectrical time-domain reflectometer for dynamic structure anal-ysis,” IEEE Transactions on Instrumentation and Measurement,Vol. 60, No. 2, 655–661, 2011.
19. Furse, C., P. Smith, and M. Diamond, “Feasibility of reflectometryfor nondestructive evaluation of prestressed concrete anchors,”

Progress In Electromagnetics Research, Vol. 132, 2012 89
IEEE Sensors Journal, Vol. 9, No. 11, 1322–1329, 2009.20. Griffiths, L. A., R. Parakh, C. Furse, and B. Baker, “The invisible
fray: A critical analysis of the use of reflectometry for fraylocation,” IEEE Sensors Journal, Vol. 6, No. 3, 697–706, 2006.
21. Schuet, S., D. Timucin, and K. Wheeler, “A model-basedprobabilistic inversion framework for characterizing wire faultdetection using TDR,” IEEE Transactions on Instrumentationand Measurement, Vol. 60, No. 5, 1654–1663, 2011.
22. Scheuermann, A. and C. Huebner, “On the feasibility of pressureprole measurements with time-domain reflectometry,” IEEETransactions on Instrumentation and Measurement, Vol. 58,No. 2, 467–474, 2009.
23. O’Connor, K. M. and C. H. Dowding, GeoMeasurements byPulsing TDR Cables and Probes, CRC Press, UK, Jan. 1999.
24. Cataldo, A., G. Monti, E. De Benedetto, G. Cannazza,and L. Tarricone, “A noninvasive resonance-based method formoisture content evaluation through microstrip antennas,” IEEETransactions on Instrumentation and Measurement, Vol. 58,No. 5, 1420–1426, 2009.
25. Cataldo, A., G. Monti, G. Cannazza, E. De Benedetto,and L. Tarricone, “A non-invasive approach for moisturemeasurements through patch antennas,” Proc. IEEE Int. Instrum.Meas. Technol. Conf., 1012–1015, Victoria, BC, May 2008.
26. Serdyuk, V. M., “Dielectric study of bound water in grain atradio and microwave frequencies,” Progress In ElectromagneticsResearch, Vol. 84, 379–406, 2008.
27. Cataldo, A., G. Monti, E. De Benedetto, G. Cannazza,L. Tarricone, and L. Catarinucci, “Assessment of a TD-basedmethod for characterization of antennas,” IEEE Transactions onInstrumentation and Measurement, Vol. 58, No. 5, 1412–1419,2009.
28. Cataldo, A., G. Monti, E. De Benedetto, G. Cannazza,L. Tarricone, and L. Catarinucci, “A comparative analysis ofreflectometry methods for characterization of antennas,” Proc.IEEE Int. Instrum. Meas. Technol. Conf., 240–243, Victoria, BC,May 2008.
29. Cataldo, A., G. Monti, E. De Benedetto, and G. Cannazza, “Areliable low-cost method for accurate characterization of antennasin time domain,” Metrology and Measurement Systems, Vol. 15,No. 4, 571–583, 2008.
30. Okhovvat, M. and R. Fallahi, “Measurement of antenna reflection

90 Cataldo et al.
coefficient in time domain,” Proc. 11th International Conferenceon Mathematical Methods In Electromagnetic Theory, 328–330,Kharkiv, Ukraine, Jun. 2006.
31. Cataldo, A. and E. De Benedetto, “Broadband reflectometry fordiagnostics and monitoring applications,” IEEE Sensors Journal,Vol. 11, No. 2, 451–459, 2011.
32. Dyer, S. A., Survey of Instrumentation and Measurement, JohnWiley & Sons Inc., USA, 2001.
33. Mohamed, A. M. O., Principles and Applications of Time DomainElectrometry in Geoenvironmental Engineering, Taylor & FrancisGroup, Great Britain, 2006.
34. Robinson, D. A., S. B. Jones, J. M. Wraith, D. Or, andS. P. Friedman, “A review of advances in dielectric andelectrical conductivity measurement in soils using time domainreflectometry,” Vadose Zone Journal, Vol. 2, No. 4, 444–475, 2003.
35. Chung, C. C. and C. P. Lin, “Apparent dielectric constant andeffective frequency of TDR measurements: Influencing factors andcomparison,” Vadose Zone Journal, Vol. 8, No. 3, 548–556, 2009.
36. Robinson, D. A., M. G. Schaap, D. Or, and S. B. Jones, “Onthe effective measurement frequency of time domain reflectometryin dispersive and nonconductive dielectric materials,” WaterResources Research, Vol. 41, No. 2, W02 007.1–W02 007.9, 2005.
37. Nicolson, A. M., “Forming the fast fourier transform of a stepresponse in time-domain metrology,” Electronic Letters, Vol. 9,No. 14, 317–318, 1973.
38. Cataldo, A., G. Cannazza, E. De Benedetto, L. Tarricone, andM. Cipressa, “Metrological assessment of TDR performance formoisture evaluation in granular materials,” Measurement, Vol. 42,No. 2, 254–263, 2009.