Experimental Study of the Influence of Different Liquids ... · distribution is affected by pass...
9
The University of Manchester Research Experimental Study of the Influence of Different Liquids on the Transformer Cooling Performance DOI: 10.1109/TPWRD.2019.2895533 Document Version Accepted author manuscript Link to publication record in Manchester Research Explorer Citation for published version (APA): Daghrah, M., Wang, Z., Liu, Q., Hilker, A., & Gyore, A. (2019). Experimental Study of the Influence of Different Liquids on the Transformer Cooling Performance. IEEE Transactions on Power Delivery, 34(2), 588-595. https://doi.org/10.1109/TPWRD.2019.2895533 Published in: IEEE Transactions on Power Delivery Citing this paper Please note that where the full-text provided on Manchester Research Explorer is the Author Accepted Manuscript or Proof version this may differ from the final Published version. If citing, it is advised that you check and use the publisher's definitive version. General rights Copyright and moral rights for the publications made accessible in the Research Explorer are retained by the authors and/or other copyright owners and it is a condition of accessing publications that users recognise and abide by the legal requirements associated with these rights. Takedown policy If you believe that this document breaches copyright please refer to the University of Manchester’s Takedown Procedures [http://man.ac.uk/04Y6Bo] or contact [email protected] providing relevant details, so we can investigate your claim. Download date:29. Dec. 2019
Transcript of Experimental Study of the Influence of Different Liquids ... · distribution is affected by pass...

The University of Manchester Research
Experimental Study of the Influence of Different Liquids onthe Transformer Cooling PerformanceDOI:10.1109/TPWRD.2019.2895533
Document VersionAccepted author manuscript
Link to publication record in Manchester Research Explorer
Citation for published version (APA):Daghrah, M., Wang, Z., Liu, Q., Hilker, A., & Gyore, A. (2019). Experimental Study of the Influence of DifferentLiquids on the Transformer Cooling Performance. IEEE Transactions on Power Delivery, 34(2), 588-595.https://doi.org/10.1109/TPWRD.2019.2895533
Published in:IEEE Transactions on Power Delivery
Citing this paperPlease note that where the full-text provided on Manchester Research Explorer is the Author Accepted Manuscriptor Proof version this may differ from the final Published version. If citing, it is advised that you check and use thepublisher's definitive version.
General rightsCopyright and moral rights for the publications made accessible in the Research Explorer are retained by theauthors and/or other copyright owners and it is a condition of accessing publications that users recognise andabide by the legal requirements associated with these rights.
Takedown policyIf you believe that this document breaches copyright please refer to the University of Manchester’s TakedownProcedures [http://man.ac.uk/04Y6Bo] or contact [email protected] providingrelevant details, so we can investigate your claim.
Download date:29. Dec. 2019
Page 1 of 8
1
Abstract—Mineral oil is traditionally used in liquid immersed 2
transformers to act as a coolant, an information carrier, and as 3
an electrical insulator. Emerging alternative transformer liquids 4
provide advantages, such as improved fire safety and better 5
biodegradability, of which transformer operators would like to 6
utilize. In this paper, an experimental study is conducted to 7
compare the thermal performance of a mineral hydrocarbon 8
transformer oil, a gas-to-liquid hydrocarbon transformer oil, and 9
a synthetic ester transformer liquid as coolants in a zig-zag disc 10
type winding model. Comparisons are made under liquid 11
directed cooling modes and under liquid natural cooling modes. 12
It was found that under both cooling modes, the mineral based 13
transformer oil and the gas-to-liquid based transformer oil 14
behaved almost with comparable liquid flow and temperature 15
distributions. Under liquid directed cooling modes, the synthetic 16
ester gave more uniform flow distribution and delayed the 17
occurrence of liquid reverse flow compared to the other oils. 18
Under liquid natural cooling modes and using the zig-zag disc 19
type winding model, synthetic ester due to its higher viscosity 20
caused lower inlet flow rate to develop under the specific tested 21
retrofilling conditions which resulted in less uniform oil flow 22
distribution within the pass and higher hot spot temperature. 23
Index Terms—Transformer, Experiment, Particle Image 24
Velocimetry, Mineral Oil, Gas-To-Liquid Oil, Synthetic Ester 25
I. INTRODUCTION 26
ransformer life expectancy is affected by the ageing of 27
paper insulation within the winding, which is determined 28
by its experienced temperature. The hot spot temperature 29
( 𝐻𝑆𝑇 ) can be defined as the hottest temperature in the 30
transformer winding structure which causes the severest paper 31
ageing. In disc type power transformers, liquid is circulated 32
through cooling ducts within the transformer winding to 33
transport heat from within the winding to the external cooling 34
medium. The thermal and physical properties of the liquid, 35
such as density ( 𝜎) , kinematic viscosity (𝑣) , thermal 36
conductivity (𝑘𝑐), and specific heat (𝐶𝑝), influence its cooling 37
performance [1, 2]. Cooling performance is characterized by 38
first the heat transfer coefficient, which is a local cooling 39
factor, and second by liquid flow distribution within the 40
winding, which is a global cooling factor [3]. 41
This Manuscript received on xx xx xxxx. 42 Muhammad Daghrah, Zhongdong Wang and Qiang Liu are with the 43
School of Electrical and Electronic Engineering at The University of 44
Manchester, Manchester, M13 9PL, UK (e-mail: zhongdong.wang@ 45 manchester.ac.uk). 46
Adree Hilker is with Shell Global Solutions (Deutschland) – GmbH 47
Attila Gyore is with M&I Materials, Manchester, M32 0ZD, UK 48
49
NOMENCLATURE
𝜎 Density (𝑘𝑔/𝑚3)
𝑣 Kinematic viscosity (𝑚𝑚2/𝑠)
𝐶𝑝 Specific heat (𝐽/𝑘𝑔. 𝐾)
𝑅𝑒 Pass inlet Reynold number 𝑅𝑒 = 𝐷ℎ× 𝑉𝑖𝑛/ 𝑣
𝐻𝑑 Winding model radial cooling duct height (𝑚)
𝑊𝑑 Winding model axial cooling duct width (𝑚)
𝑘𝑐 Thermal conductivity of liquid (𝑊/𝑚. 𝐾)
𝛽𝑇ℎ Volumetric thermal expansion coefficient of liquid (1/𝐾)
𝑉𝑖𝑛 Winding model inlet velocity (𝑚/𝑠)
𝑃𝐿 Pressure loss over winding model (𝑃𝑎)
𝑇𝐵 Winding model bottom liquid temperature (℃)
𝑃𝑙𝑜𝑠𝑠 Power loss injection in each plate (𝑊)
𝑉𝑚𝑎𝑥 Maximum velocity in radial cooling duct (𝑚/𝑠)
𝑉𝑎𝑣 Average velocity in radial cooling duct (𝑚/𝑠)
𝐷ℎ Hydraulic diameter of axial duct (𝑚)
𝐴𝑐 Inlet cross sectional area of axial cooling duct (𝑚2)
𝑊𝑝 Wet perimeter of axial cooling duct (𝑚)
𝐻𝑆𝑇𝑟𝑖𝑠𝑒 Hot spot temperature rise over 𝑇𝐵 (𝐾)
𝑇𝑡𝑜𝑝 Winding model top liquid temperature (℃)
𝑝𝑇ℎ Thermosyphon driving force (𝑃𝑎)
𝑔 Acceleration of gravity (𝑚/𝑠2)
∆𝐻 Height difference between centres of radiator and winding (𝑚)
∆𝑇 Liquid temperature increase from 𝑇𝐵 to 𝑇𝑡𝑜𝑝 (𝐾)
𝑃𝑙𝑜𝑠𝑠,𝑡𝑜𝑡𝑎𝑙 Total losses in the winding model (𝑊)
�̇� Winding model inlet mass flow rate (𝑘𝑔/𝑠)
𝑓𝑖 Friction coefficient of component 𝑖 in the hydraulic loop
𝐿𝑖 Equivalent pipe hydraulic length of component 𝑖 (𝑚)
𝐶 Constant
𝑅𝑖 Richardson number (𝑅𝑖 = 𝐺𝑟/𝑅𝑒2)
𝐺𝑟 Grashof number
𝑇𝑚𝑤 Mean winding temperature (℃)
𝑇𝑚𝑜 Mean liquid temperature (℃)
50
Under Liquid Directed (OD or KD) cooling modes, the flow 51
distribution is affected by pass inlet Reynold number (𝑅𝑒), 52
and by the winding geometries such as the radial cooling duct 53
height ( 𝐻𝑑) , the axial cooling duct width (𝑊𝑑) , and the 54
number of discs per pass [4, 5]. Under Liquid Natural (ON or 55
KN) cooling modes, the developed liquid flow rate is affected 56
by the thermosyphon pressure induced forces within the 57
winding structure and the total pressure loss within the 58
transformer hydraulic loop [6-8]. 59
Mineral oils are traditionally used as the insulating and 60
cooling media in power transformers. Recently alternative 61
transformer liquids, such as ester based liquids and gas-to-62
liquid based oils, emerged as alternatives in power 63
transformers compared to mineral oils. Ester based liquids are 64
biodegradable and have high flash and fire points. A 65
comparison was made for the thermal performance of a 50 66
Experimental Study of the Influence of
Different Liquids on the Transformer Cooling
Performance
Muhammad Daghrah, Zhongdong Wang, Member, IEEE, and Qiang Liu, Member, IEEE, Andree
Hilker, Attila Gyore, Member, IEEE
T

Page 2 of 8
MVA, 141 kV/13 kV transformer that was filled in with 1
mineral oil and natural ester [9]. It was reported that under 2
KNAN cooling mode an increase in the 𝐻𝑆𝑇 by 12 ℃ was 3
observed in the low voltage winding when filled with natural 4
ester compared to when filled with mineral oil. Hence, it was 5
concluded that retrofilling transformers designed for mineral 6
oil with natural ester requires careful considerations. The 7
impact of mineral oils and ester based liquids on transformer 8
winding temperatures was investigated [10]. It was observed 9
that when using ester liquid the flow velocities within radial 10
cooling ducts were lower, compared to when using mineral 11
oil, which was the reported reason for the increase in the 12
winding temperatures. A 15 MVA, single phase, 154 kV/22.9 13
kV transformer was filled with mineral oil and then with 14
natural ester [11]. Temperature rise tests were conducted and 15
an increase of near 16 ℃ in recorded 𝐻𝑆𝑇 was observed in the 16
low voltage winding after retrofilling using natural ester. 17
Though it was indicated that ester filled transformer would 18
have the same expected life despite it operates at higher 𝐻𝑆𝑇 19
compared to the expected life when the transformer is filled 20
with mineral oil. A model for a 66 MVA, 225/26.4 kV 21
transformer was studied both experimentally and numerically 22
with 3D CFD simulations under ON cooling regime [12]. 23
Better prediction accuracy was achieved when simulating a 24
3D domain exclusive only to the winding structure and setting 25
up the boundary conditions from experimental measurements 26
of winding inlet oil flow and inlet temperature. In [13], oil 27
flow measurements were conducted using optical methods 28
under OD cooling modes with tests conducted under pass inlet 29
Reynold numbers from 667 to 4000. The winding geometries 30
were 6 plates/pass and both radial and vertical cooling ducts 31
were 6 mm each. It was indicated that 2D CFD predictions 32
over-estimated plate temperatures whereas 3D CFD 33
predictions matched well with temperature measurements. In 34
another study, it was found that higher inlet flow rate and 35
higher inlet oil temperature caused higher deviations from 36
experimental measurements [14]. 37
In this paper, an experimental study is carried out to 38
compare the thermal performance between different 39
transformer liquids in terms of liquid flow and temperature 40
distributions in a zig-zag disc type winding model under 41
imitated directed and natural cooling modes. Used 42
experimental setup is introduced in section II. Comparisons of 43
the thermal performances of tested liquids under OD/KD 44
cooling modes are presented in section III. Comparisons of the 45
thermal performances of tested liquids under ON/KN cooling 46
modes are presented in section IV. Discussion and conclusions 47
are given in sections V and VI, respectively. 48
II. EXPERIMENTAL DESCRIPTION 49
A. Experimental setup 50
Used experimental setup, as shown in Fig. 1, consists of a 51
disc type winding model, a radiator, a pump and a flow meter. 52
The pump is used to force the liquid to circulate through the 53
system. The winding inlet velocity (𝑉𝑖𝑛) is measured using a 54
positive displacement flow meter with 0.5% accuracy of 55
reading. A throttling valve is used to set and control 𝑉𝑖𝑛 as 56
desired. The pressure loss over the winding model (𝑃𝐿 ) is 57
measured under directed cooling mode using differential 58
pressure sensors with ± 10 Pa accuracy. The liquid is heated 59
within the winding model and circulated through the radiator 60
to be cooled down. To control the winding bottom liquid 61
temperature (𝑇𝐵), an external controlled heater was connected 62
in series with the winding model. The winding model consists 63
of 3 passes, where each pass consists of 10 aluminium plates 64
modelling disc segments [5, 15-17]. Each plate was made with 65
dimensions 100 mm × 104 mm × 10 mm, and can be heated 66
using two resistive cylindrical heaters embedded within the 67
plate. Power losses ( 𝑃𝑙𝑜𝑠𝑠 ) in plates are controlled. 68
Thermocouples were used to record average plate 69
temperatures within the winding model with accuracy ± 1 ºC. 70
Each plate was embedded with two thermocouples and their 71
average is used as a representative average plate temperature. 72
The winding model was constructed from polycarbonate 73
sheets and the sheets were milled to create 𝐻𝑑 = 4 mm and 𝑊𝑑 74
= 10 mm. Particle Image Velocimetry (PIV) system was used 75
to measure liquid flow rates within radial cooling ducts of the 76
third pass in the winding model. The PIV system consists of 77
dual head laser source, laser optics, a camera, a synchronizer, 78
and a software to process captured images [18]. The PIV 79
system records velocities by tracking the movement of seeding 80
particles within the flow. The seeding particles used in this 81
study were silver coated hollow gas spheres with diameter 82
range from 10 to 14 microns. The laser source fires two 83
consecutive pulses with known time difference and the camera 84
captures correspondingly two raw images. Using the time 85
difference between the two laser pulses and the seeding 86
particles displacement in the captured pair of images, liquid 87
velocities within cooling ducts are calculated using the 88
software. 89
90 Fig. 1.Sketch of experimental setup, the laser sheet was 15 mm in the z-91 direction away from the wall near the camera 92
,Vin
Third p
ass
TB
Ttop
Secon
d p
ass
Camera field of view

Page 3 of 8
As indicated on Fig. 1, PIV measurements are conducted 1
near the end of a radial cooling duct in the direction of flow 2
and the laser sheet was positioned 15 mm in the z-direction 3
farther from the winding model wall near the camera. The 4
camera field of view is 2 cm. More detailed descriptions of the 5
PIV system and oil flow measurement in radial cooling duct 6
are presented in [18]. 7
Liquid flow profile within a radial cooling duct is a laminar 8
profile in typical transformer operating conditions. Using the 9
PIV system, the maximum velocity ( 𝑉𝑚𝑎𝑥 ) of its quasi-10
parabolic shape is extracted from the PIV image. The average 11
duct velocity (𝑉𝑎𝑣) is approximately related to 𝑉𝑚𝑎𝑥 using 𝑉𝑎𝑣 12
= 𝑉𝑚𝑎𝑥 /1.5. It was checked that this approximation is 13
acceptable within 10% comparison accuracy both 14
experimentally, by comparing summations of volumetric flow 15
rates in the third pass radial cooling ducts to that measured by 16
a flow meter at the inlet of the winding model, and by 17
comparing to CFD simulations in our previous publication 18
[19]. The experimental setup and the PIV system were 19
presented in more detail in [18, 19]. 20
B. Liquids under investigations 21
Three different liquids were used. Firstly, a mineral 22
hydrocarbon based transformer oil (MO) [20]. Secondly, a gas 23
to liquid hydrocarbon based transformer oil (GTL) [21]. The 24
third liquid was a synthetic ester based transformer liquid (SE) 25
[22]. Table I summarizes the values of key thermal parameters 26
of the liquids at three different operating temperatures. The 27
system is filled with liquid using a liquid tank connected to the 28
experimental setup. Air can leave the experimental setup 29
through both bleeds above the winding model and the radiator. 30
Before using different liquid, a strict procedure was used to 31
drain the old liquid from the system before testing the next 32
liquid. Drainage of the old liquid was conducted by 33
dismantling and cleaning the winding model and the pipe 34
work and by flushing the radiator with the new liquid. 35
TABLE I 36
THERMAL PROPERTIES OF USED LIQUIDS 37
Liquid properties at operating
temperatures (ºC)
𝜎
𝑘𝑔
𝑚3
𝑣
𝑚𝑚2
𝑠
𝑘𝑐
𝑊
𝑚. 𝐾
𝐶𝑝
𝐽
𝑘𝑔. 𝐾
𝛽𝑇ℎ
1
𝐾
Mineral oil
(MO)
40 858 9.2 0.132 1794 N/A
60 845 5.2 0.130 1877 0.00078
80 832 3.4 0.128 1956 N/A
Gas-to-
liquid
(GTL)
40 793 9.6 0.142 2271 0.00081
60 780 5.6 0.140 2365 0.00081
80 767 3.7 0.138 2458 0.00084
Synthetic
ester
(SE)
40 956 28 0.143 1933 0.00077
60 941 14 0.141 1994 0.00078
80 926 8 0.139 2023 0.00079
III. COMPARISON UNDER DIRECTED COOLING MODES 38
Under OD/KD cooling modes, liquid is forced to circulate 39
within the winding using a pump. Washers within the winding 40
structure force the liquid to flow in a zig-zag fashion. 41
According to [4, 19], liquid flow distribution is influenced by 42
dimensionless numbers such as the 𝑅𝑒 number and 43
geometrical based dimensionless numbers 𝛼 , 𝛽 , and 𝛾 [4]. 44
Since the 𝑅𝑒 is defined as 𝑅𝑒 = (𝐷ℎ × 𝑉𝑖𝑛)/𝑣 , only 𝑣 and 𝑉𝑖𝑛 45
affect the 𝑅𝑒 for fixed winding geometry. Higher 𝑣 causes 46
lower 𝑅𝑒 resulting in more uniform liquid flow distribution 47
within the winding radial cooling ducts [4, 19]. The uniformity 48
of liquid flow distribution is indicative to the fair share of flow 49
rates amongst the pass radial cooling ducts. 𝑣 is a temperature 50
dependent parameter, which is also related to liquid type. 51
A. Liquid flow and temperature distributions under different 52
Vin 53
To investigate the influence of different liquids on liquid 54
flow and temperature distributions, experiments were 55
conducted under four different 𝑉𝑖𝑛 of 0.1 m/s, 0.2 m/s, 0.27 56
m/s, and 0.3 m/s. Uniform loss distribution in each plate with 57
𝑃𝑙𝑜𝑠𝑠 = 50 W/plate, which is equivalent to 2010 W/m2, was 58
applied. 𝑇𝐵 was fixed to 70 ºC. 59
Fig. 2 shows liquid flow and temperature distributions in 60
the third pass within the winding model at 𝑉𝑖𝑛 of 0.1 m/s. 61
Liquid flow distributions of MO and GTL are almost identical 62
whereas SE caused slightly more uniform flow distribution 63
which means that there is a more fairer share of oil velocities 64
amongst pass radial cooling ducts compared to MO or GTL. A 65
fully uniform flow distribution would indicate that each 66
cooling duct would have the same flow rate. 67
The calculated 𝑅𝑒 of SE is almost half that of the other oils 68
as shown in Table II. Liquid flow distributions for tested 69
liquids are relatively uniform which lead to uniform 70
temperature distributions. Temperature profiles of tested 71
liquids are almost comparable. 72
Fig. 3 represents liquid flow and temperature distributions 73
at 𝑉𝑖𝑛 of 0.27 m/s. At this relatively high inlet liquid velocity, 74
liquid reverse flow starts to occur in duct 1 for both MO and 75
GTL. The flow distribution using GTL is almost the same 76
compared to MO as they have close inlet pass Reynold 77
numbers. Due to its higher 𝑣, SE causes more uniform flow 78
distribution and so offers more resistance to liquid reverse 79
flow phenomenon. Compared to the previous test under 𝑉𝑖𝑛 of 80
0.1 m/s, liquid flow distributions are less uniform which 81
directly cause less uniform temperature profiles. The 82
occurrence of liquid reverse flow causes higher 𝐻𝑆𝑇𝑟𝑖𝑠𝑒 for 83
both MO and GTL compared to SE. 84
TABLE II 85
TESTS SUMMARY UNDER DIRECTED COOLING MODE WITH 𝑇𝐵 = 70 ºC 86
𝑉𝑖𝑛 [m/s]
Liquid Type 𝑇𝑡𝑜𝑝
[K] 𝑅𝑒*
𝐻𝑆𝑇𝑟𝑖𝑠𝑒
[K] 𝐻𝑆𝑇
location
Reverse
flow
0.1
MO 78.6 443 17.5 Plate 4 No
GTL 78.1 387 17.9 Plate 4 No
SE 76.7 173 18.6 Plate 3 No
0.2
MO 74.7 887 14.3 Plate 1 No
GTL 74.6 774 15.3 Plate 1 No
SE 71.8 346 13.4 Plate 1 No
0.27
MO 73.7 1183 17.6 Plate 1 Yes
GTL 73.8 1032 17.2 Plate 1 Yes
SE 74.1 461 12.4 Plate 1 No
0.3
MO 73.8 1330 15.9 Plate 1 Yes
GTL 73.5 1161 16.6 Plate 1 Yes
SE 73.4 520 12.3 Plate 1 No
* 𝑅𝑒 was calculated using 𝑣 at 𝑇𝐵 = 70 ºC and 𝐷ℎ = 0.018 m 87

Page 4 of 8
1 Fig. 2 Liquid flow and temperature distributions under directed cooling modes 2
with Vin = 0.1 m/s, Ploss = 2010 W/m2, and TB = 70 ºC. 3
4 Fig. 3. Liquid flow and temperature distributions under directed cooling 5 modes with Vin = 0.27 m/s, Ploss = 2010 W/m2, and TB = 70 ºC. 6
7
B. Pressure loss under isothermal conditions with uniform 8
liquid temperature = 70 ºC 9
At a fixed winding geometry and 𝑉𝑖𝑛, higher viscosity liquid 10
would lead to higher pressure losses in the winding. Under 11
isothermal testing conditions with uniform liquid temperature 12
of 70 ºC, 𝑃𝐿 was measured under a range of 𝑉𝑖𝑛 from 0.05 m/s 13
to 0.35 m/s for the three different liquids as shown in Fig. 4. 14
Pressure measurement ports were fixed on the centre line of 15
the first pass inlet washer and the centre line of the third pass 16
outlet washer. 17
MO and GTL cause comparable pressure loss over the 18
winding model. SE causes higher pressure loss over the 19
winding model compared to the other two liquids. 20
To summarize, three main observations are being made. 21
First, with higher 𝑉𝑖𝑛, liquid flow distribution in the third pass 22
radial cooling ducts is less uniform for all liquids and this 23
directly results in less uniform temperature profiles. Less 24
uniform reflects that more liquid flows in top radial cooling 25
ducts compared to bottom cooling ducts which cause higher 26
temperatures in bottom plates. Second, MO and GTL showed 27
similar liquid flow and temperature distributions whereas SE 28
caused more uniform liquid flow and temperature 29
distributions. Hence, SE offered higher resistance to the 30
occurrence of liquid reverse flow. Third, assuming a 31
retrofilling scenario with the same pump and so fixed pressure 32
loss over the winding of 300 Pa as shown in Fig. 4, SE would 33
cause lower 𝑉𝑖𝑛 close to 0.22 m/s compared to the two other 34
liquids which would cause 𝑉𝑖𝑛 close to 0.27 m/s. Lower 𝑉𝑖𝑛 , 35
and higher 𝑣 , indicate lower 𝑅𝑒 . Lower 𝑅𝑒 leads to more 36
uniform flow distributions within the winding passes [4, 19]. 37
With lower 𝑅𝑒 , liquid reverse flow is less likely to occur 38
under SE. Under 𝑉𝑖𝑛 = 0.27 m/s, liquid reverse flow occurred 39
under MO and GTL and it did not occur under SE and so the 40
HST was lower when using SE. 41
42 Fig. 4. Measured PL over the winding model under isothermal conditions with 43
uniform liquid temperature = 70 ºC. 44
IV. COMPARISON UNDER NATURAL COOLING MODES 45
Under ON/KN cooling modes, the flow is driven by the 46
developed thermosyphon force (𝑝𝑇ℎ ) within the transformer 47
hydraulic cooling loop. At steady state, 𝑉𝑖𝑛 is reached when 48
𝑝𝑇ℎ is equal to the total pressure loss in the hydraulic loop [6]. 49
According to [6], 𝑝𝑇ℎ can be calculated using (1). ∆𝑇 can be 50
related to the total electric losses in the winding (𝑃𝑙𝑜𝑠𝑠,𝑡𝑜𝑡𝑎𝑙) 51
and to the inlet mass flow rate (𝑚)̇ as presented in (2). �̇� is 52
related to 𝑉𝑖𝑛 using 𝜎 and 𝐴𝑐 as shown in (3). 𝑃𝐿 can be 53
calculated by adding all pressure drops around the hydraulic 54
loop. Darcy – Weisback equation shown in (4) can be used for 55
evaluation of pressure drops within individual sections of the 56
winding model and transformer loop [6, 23, 24]. 57
𝑝𝑇ℎ = 𝑔𝜎𝑜𝛽𝑇ℎ∆𝑇∆𝐻 (1)
where 𝜎𝑜 is the liquid density at a reference temperature, 58
𝛽𝑇ℎ is the liquid thermal expansion coefficient, 𝑔 is the 59
acceleration of gravity, ∆𝐻 is the height difference between 60
radiator and winding centres, and ∆𝑇 is the increase in liquid 61
temperature across the winding as defined in (2). 62
∆𝑇 =𝑃𝑙𝑜𝑠𝑠,𝑡𝑜𝑡𝑎𝑙
�̇� × 𝐶𝑝
(2)
�̇� = 𝜎 × 𝐴𝑐 × 𝑉𝑖𝑛 (3)
𝑃𝐿,𝑖 = 𝑓𝑖 ×𝐿𝑖
𝐷ℎ,𝑖
× 𝜎 ×𝑉𝑖𝑛,𝑖
2
2 (4)
where 𝑓𝑖 is the friction coefficient, 𝐿𝑖 is the equivalent duct 63
length, and the 𝑖 subscript refers to the 𝑖 component in the 64

Page 5 of 8
hydraulic loop 1
In the following analysis, a global view of the hydraulic 2
loop of the experimental setup is considered in which the 3
entire hydraulic loop is lumped and modelled with an 4
equivalent pipe in order to relate liquid only parameters, such 5
as viscosity, density, and thermal expansion coefficient, to the 6
inlet velocity developed naturally by the systems’ 7
thermosyphon induced pressure. This approach does not look 8
into detailed modelling of pressure losses internal to the 9
winding model ducts and joints. For this detailed modelling of 10
pressure losses, readers can refer to published work related to 11
network modelling [24-29]. Network models are less accurate 12
but they demand less computational resources compared to 13
CFD simulations. As such, they are used by designers in early 14
stages during the transformer design iteration process. 15
Assuming that at a specific steady state operating point, the 16
experimental setup hydraulic loop can be modelled as an 17
equivalent pipe with an equivalent length 𝐿𝑒𝑞 and an 18
equivalent hydraulic diameter 𝐷ℎ,𝑒𝑞 such that the flow is 19
laminar. Laminar flow is a reasonable assumption for ON/KN 20
cooling modes. Also, assume that average inlet liquid flow 21
velocity equals to 𝑉𝑖𝑛 and pressure drop over the pipe equals 22
to 𝑃𝐿 . 23
In this case, the equivalent friction coefficient 𝑓𝑒𝑞 can be 24
presented by (5). To relate 𝑉𝑖𝑛 to liquid only dependent 25
properties, first, (3) is substituted in (2) and the resulting (2) is 26
substituted in (1). Then, (5) is substituted in (4). By equating 27
resulting (1) and (4), i.e. 𝑝𝑇ℎ = 𝑃𝐿 , (6) is produced. The first 28
term in (6) is related to the winding model geometries and to 29
the total power losses whereas the second term is related to 30
only liquid properties. In the current experimental setup, (6) 31
can be used approximately to answer the question as what 32
would be the new 𝑉𝑖𝑛 if using a new liquid in the winding 33
model under the same winding model power losses and 34
geometrical conditions compared to the old liquid case to 35
reflect a retrofilling scenario. 36
𝑓𝑒𝑞 =𝐶
𝑅𝑒=
𝐶 × 𝑣
𝐷ℎ,𝑒𝑞 × 𝑉𝑖𝑛
(5)
where 𝐶 is a constant which depends on the flow regime 37
and the pipe shape 38
𝑉𝑖𝑛2 = {
2𝑔 × 𝐷ℎ,𝑒𝑞2 × ∆𝐻 × 𝑃𝑙𝑜𝑠𝑠,𝑡𝑜𝑡𝑎𝑙
𝐶 × 𝐴𝑐 × 𝐿𝑒𝑞
} × {𝛽𝑇ℎ
𝑣 × 𝐶𝑝 × 𝜎 } (6)
In tests conducted henceforth, 𝑃𝑙𝑜𝑠𝑠 is fixed to 30 W/plate 39
which is equivalent to 1200 W/m2. 𝑇𝐵 is maintained at 60 ºC. 40
𝑉𝑖𝑛 is still controlled by external pump and valve. To check 41
whether the testing conditions can represent natural cooling 42
regime within the winding model, Richardson number (𝑅𝑖) is 43
calculated for all conducted tests. 𝑅𝑖 is presented in (8) and 44
defined as the ratio of Grashof number (𝐺𝑟), shown in (7), to 45
the 𝑅𝑒 number square. According to [30], if 𝑅𝑖 << 1, then the 46
cooling regime is considered OD/KD dominated regime. If 47
𝑅𝑖 >> 1 , then the cooling regime is considered ON/KN 48
dominated regime. 49
𝐺𝑟 =𝑔𝛽𝑇ℎ𝐷ℎ
3
𝑣2× (𝑇𝑚𝑤 − 𝑇𝑚𝑜 ) (7)
𝑅𝑖 = 𝐺𝑟/𝑅𝑒2 (8)
where 𝑇𝑚𝑤 is the mean winding temperature and 𝑇𝑚𝑜 is the 50
mean liquid temperature. 51
In the following, performances of different liquids are 52
compared under two different approaches. The first approach, 53
section A, is designed to run experiments under fixed Vin. The 54
second approach is to compare MO and SE under a more 55
realistic scenario in which the system determines Vin based on 56
equation 6 57
A. Flow and temperature distributions under different Vin 58
Tests were conducted with three different 𝑉𝑖𝑛 of 0.026 m/s, 59
0.021 m/s, and 0.017 m/s which are within the expected range 60
of ON/KN transformers [7]. Table III represents key test 61
results with the calculated 𝑅𝑖 number for each test. It is 62
observed that lower 𝑉𝑖𝑛 causes less uniform liquid flow and 63
temperature distributions, i.e. more dominated natural cooling 64
regimes, which are reflected in higher 𝑅𝑖 numbers. In general 65
under ON/KN cooling modes, more liquid flows into pass 66
bottom cooling ducts and less liquid flows into pass top 67
cooling ducts [8]. Individual tests are discussed as follows. 68
Fig. 5 shows recorded liquid flow and temperature 69
distributions at steady state for tests under 𝑉𝑖𝑛 of 0.026 m/s. 70
Liquid flow and temperature distributions follow almost an 71
opposite trend to that under OD/KD cooling modes. MO and 72
GTL have almost the same liquid flow distributions whereas 73
SE has relatively more uniform flow distribution contributing 74
to higher flow rates into pass top cooling ducts. For both MO 75
and GTL, oil stagnation was observed in duct 11 but it did not 76
occur for SE. Occurrence of oil stagnation under natural 77
cooling was also reported using CFD simulations in [31, 32]. 78
Therefore, SE has lower 𝐻𝑆𝑇𝑟𝑖𝑠𝑒 compared to the other 79
liquids. Using SE, it can be observed that the 𝑅𝑒 number is 80
almost half of the other liquids and the 𝑅𝑖 number is slightly 81
lower. 82
Results under 𝑉𝑖𝑛 of 0.021 m/s are shown in Fig. 6. Liquid 83
stagnation occurs in duct 10 under both MO and GTL whereas 84
it did not occur when testing under SE. Liquid stagnation 85
causes a large increase in temperature of nearby plate; in this 86
case it is plate 9. Liquid flow distribution was almost identical 87
when testing using MO and GTL and it was more uniform 88
when testing with SE. As a result of liquid stagnation not 89
occurring under SE, 𝐻𝑆𝑇𝑟𝑖𝑠𝑒 was lower compared to the other 90
liquids. In comparison to tests under 𝑉𝑖𝑛 of 0.026 m/s, higher 91
𝑅𝑖 numbers are observed which indicate more dominating 92
ON/KN regimes. 93
TABLE III 94
SUMMARY OF TEST RESULTS UNDER ON/KN COOLING MODE WITH 95 CALCULATED DIMENSIONLESS PARAMETERS. TESTS WERE CONDUCTED UNDER 96
TB = 60 ºC 97
Liquid Type* 𝑇𝑡𝑜𝑝
[ºC]
𝑇𝑚𝑤 [ºC]
𝐻𝑆𝑇𝑟𝑖𝑠𝑒 [K]
𝑅𝑒* 𝐺𝑟* 𝑅𝑖
Tests conducted under Vin = 0.026 m/s
MO 80.4 80.3 36.5 117 28436 2.1
GTL 76.6 77.5 33.6 102 20435 2
SE 77.3 78.3 25.8 46 3939 1.9
Tests conducted under Vin = 0.021 m/s
MO 83.7 85 49.2 97.7 36968 3.9
GTL 80.6 82.9 47.5 85 26645 3.7

Page 6 of 8
SE 81.2 80.4 36.5 38.2 3919 2.7
Tests conducted under Vin = 0.017 m/s
MO 87.7 89.8 54 78.2 44584 7.3
GTL 82.6 86.1 54 68.2 32396 7
SE 83.5 85.2 52 30.5 5450 5.8
* 𝑅𝑒 and 𝐺𝑟 were calculated using 𝑣 at 𝑇𝐵 = 70 ºC and 𝐷ℎ = 0.018 m 1
Results under 𝑉𝑖𝑛 of 0.017 m/s are shown in Fig 7. With 2
lower 𝑉𝑖𝑛 , more dominating natural cooling regime is 3
produced with higher 𝑅𝑖 numbers. Similar to previous tests, 4
MO and GTL gave almost identical flow distributions. Liquid 5
reverse flow occurred under both MO and GTL, in duct 8 and 6
duct 9, whereas liquid stagnation occurred under SE in duct 7
10. It was observed that higher viscosity liquids delay the 8
occurrence of oil stagnation top of the pass under natural 9
cooling modes. Because of the occurrence of liquid reverse 10
flow and liquid stagnation, the differences in the 𝐻𝑆𝑇𝑟𝑖𝑠𝑒 11
between the liquids were minimum amongst the conducted 12
tests in this section. 13
14 Fig. 5. Liquid flow and temperature distributions under ON/KN cooling mode 15
with Vin = 0.026 and TB = 60 ºC. 16 17
18 Fig. 6. Liquid flow and temperature distributions under ON/KN cooling 19
modes with Vin = 0.021 m/s and TB = 60 ºC. 20
21
B. Comparison of MO and SE under a specific retrofilling 22
scenario 23
In the previous section, the performances of different 24
liquids were compared under fixed 𝑉𝑖𝑛 which is not reflective 25
to actual transformer retrofilling condition. However, as 26
demonstrated in (6) the liquid properties influence the 27
developed 𝑉𝑖𝑛 under ON/KN cooling modes. 28
29 Fig. 7. Liquid flow and temperature distributions under ON/KN cooling 30
modes with Vin = 0.017 m/s and TB = 60 ºC. 31
It was reported in literature that when retrofilling a power 32
transformer with a new liquid, in point of view of thermal 33
aspects, careful considerations need to be made since the 𝐻𝑆𝑇 34
may be increased [9-11]. The main reason for the increase in 35
the 𝐻𝑆𝑇 is the reduction of the developed 𝑉𝑖𝑛 when using a 36
different liquid which has higher viscosity. Under the present 37
experimental setup, 𝑉𝑖𝑛 is controlled instead of allowing the 38
system to determine its value similar to what was conducted in 39
[17]. For this reason, (6) can be used, though requires further 40
verifications, to approximately answer the question as of what 41
would be the naturally developed 𝑉𝑖𝑛 when using a new liquid 42
under the same winding model geometries and operating 43
conditions, presented in the first term in (6), so that different 44
liquids performances are judged fairly. As an example, a 45
specific case study is discussed in which SE is compared to 46
MO in a hypothetical retrofilling scenario. According to (6) 47
and the liquids information shown in Table I at temperature 70 48
ºC, MO would have an inlet velocity (𝑉𝑖𝑛,𝑀𝑂) of 1.69 times 49
higher than that of SE (𝑉𝑖𝑛,𝑆𝐸), i.e. 𝑉𝑖𝑛,𝑀𝑂 = 1.69 × 𝑉𝑖𝑛,𝑆𝐸 . It is 50
very important to emphasize here that this relationship is only 51
valid for the related testing conditions and the studied winding 52
arrangements. Further experimental validations are required to 53
justify the validity of (6) in a broader context. 54
Tests were conducted under uniform losses of 𝑃𝑙𝑜𝑠𝑠 = 30 55
W/plate or equivalently 1200 W/m2. 𝑇𝐵 was maintained at 60 56
ºC. The winding model geometries are relatively close to the 57
specified low voltage winding of a 22 kV, 250 MVA 58
transformers mentioned in [25]. Table IV provides a summary 59
of key test results in which 𝑉𝑖𝑛,𝑀𝑂 = 0.028 m/s and 𝑉𝑖𝑛,𝑆𝐸 = 60
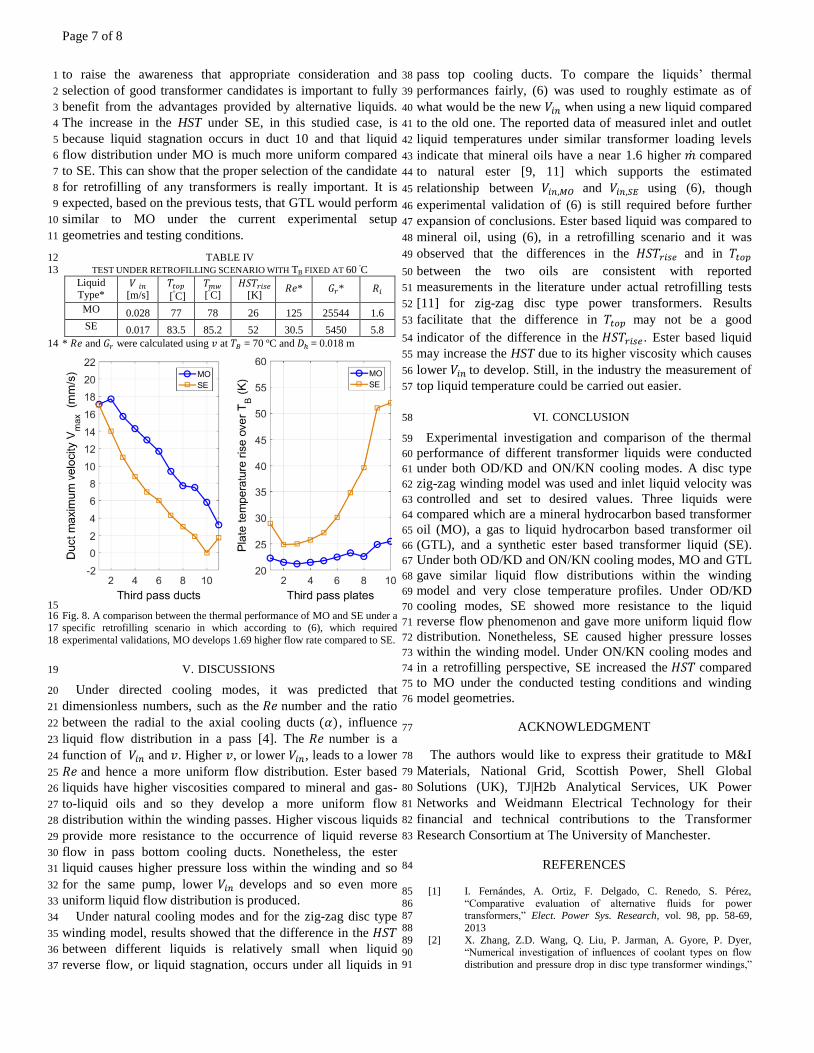
0.017 m/s. Test results are presented in Fig. 8. A difference in 61
the 𝐻𝑆𝑇𝑟𝑖𝑠𝑒 between MO and SE of 26 ºC was recorded while 62
only 6 ºC difference in 𝑇𝑡𝑜𝑝 was recorded between the two 63
liquids. Though this case may be the worst case possible of a 64
bad retrofilling choice for ON/KN transformer, it is intended 65
Page 7 of 8
to raise the awareness that appropriate consideration and 1
selection of good transformer candidates is important to fully 2
benefit from the advantages provided by alternative liquids. 3
The increase in the HST under SE, in this studied case, is 4
because liquid stagnation occurs in duct 10 and that liquid 5
flow distribution under MO is much more uniform compared 6
to SE. This can show that the proper selection of the candidate 7
for retrofilling of any transformers is really important. It is 8
expected, based on the previous tests, that GTL would perform 9
similar to MO under the current experimental setup 10
geometries and testing conditions. 11
TABLE IV 12
TEST UNDER RETROFILLING SCENARIO WITH TB FIXED AT 60 ºC 13
Liquid Type*
𝑉 𝑖𝑛 [m/s]
𝑇𝑡𝑜𝑝 [ºC]
𝑇𝑚𝑤 [ºC]
𝐻𝑆𝑇𝑟𝑖𝑠𝑒
[K] 𝑅𝑒* 𝐺𝑟* 𝑅𝑖
MO 0.028 77 78 26 125 25544 1.6
SE 0.017 83.5 85.2 52 30.5 5450 5.8
* 𝑅𝑒 and 𝐺𝑟 were calculated using 𝑣 at 𝑇𝐵 = 70 ºC and 𝐷ℎ = 0.018 m 14
15 Fig. 8. A comparison between the thermal performance of MO and SE under a 16 specific retrofilling scenario in which according to (6), which required 17
experimental validations, MO develops 1.69 higher flow rate compared to SE. 18
V. DISCUSSIONS 19
Under directed cooling modes, it was predicted that 20
dimensionless numbers, such as the 𝑅𝑒 number and the ratio 21
between the radial to the axial cooling ducts (𝛼), influence 22
liquid flow distribution in a pass [4]. The 𝑅𝑒 number is a 23
function of 𝑉𝑖𝑛 and 𝑣. Higher 𝑣, or lower 𝑉𝑖𝑛, leads to a lower 24
𝑅𝑒 and hence a more uniform flow distribution. Ester based 25
liquids have higher viscosities compared to mineral and gas-26
to-liquid oils and so they develop a more uniform flow 27
distribution within the winding passes. Higher viscous liquids 28
provide more resistance to the occurrence of liquid reverse 29
flow in pass bottom cooling ducts. Nonetheless, the ester 30
liquid causes higher pressure loss within the winding and so 31
for the same pump, lower 𝑉𝑖𝑛 develops and so even more 32
uniform liquid flow distribution is produced. 33
Under natural cooling modes and for the zig-zag disc type 34
winding model, results showed that the difference in the 𝐻𝑆𝑇 35
between different liquids is relatively small when liquid 36
reverse flow, or liquid stagnation, occurs under all liquids in 37
pass top cooling ducts. To compare the liquids’ thermal 38
performances fairly, (6) was used to roughly estimate as of 39
what would be the new 𝑉𝑖𝑛 when using a new liquid compared 40
to the old one. The reported data of measured inlet and outlet 41
liquid temperatures under similar transformer loading levels 42
indicate that mineral oils have a near 1.6 higher �̇� compared 43
to natural ester [9, 11] which supports the estimated 44
relationship between 𝑉𝑖𝑛,𝑀𝑂 and 𝑉𝑖𝑛,𝑆𝐸 using (6), though 45
experimental validation of (6) is still required before further 46
expansion of conclusions. Ester based liquid was compared to 47
mineral oil, using (6), in a retrofilling scenario and it was 48
observed that the differences in the 𝐻𝑆𝑇𝑟𝑖𝑠𝑒 and in 𝑇𝑡𝑜𝑝 49
between the two oils are consistent with reported 50
measurements in the literature under actual retrofilling tests 51
[11] for zig-zag disc type power transformers. Results 52
facilitate that the difference in 𝑇𝑡𝑜𝑝 may not be a good 53
indicator of the difference in the 𝐻𝑆𝑇𝑟𝑖𝑠𝑒 . Ester based liquid 54
may increase the HST due to its higher viscosity which causes 55
lower 𝑉𝑖𝑛 to develop. Still, in the industry the measurement of 56
top liquid temperature could be carried out easier. 57
VI. CONCLUSION 58
Experimental investigation and comparison of the thermal 59
performance of different transformer liquids were conducted 60
under both OD/KD and ON/KN cooling modes. A disc type 61
zig-zag winding model was used and inlet liquid velocity was 62
controlled and set to desired values. Three liquids were 63
compared which are a mineral hydrocarbon based transformer 64
oil (MO), a gas to liquid hydrocarbon based transformer oil 65
(GTL), and a synthetic ester based transformer liquid (SE). 66
Under both OD/KD and ON/KN cooling modes, MO and GTL 67
gave similar liquid flow distributions within the winding 68
model and very close temperature profiles. Under OD/KD 69
cooling modes, SE showed more resistance to the liquid 70
reverse flow phenomenon and gave more uniform liquid flow 71
distribution. Nonetheless, SE caused higher pressure losses 72
within the winding model. Under ON/KN cooling modes and 73
in a retrofilling perspective, SE increased the 𝐻𝑆𝑇 compared 74
to MO under the conducted testing conditions and winding 75
model geometries. 76
ACKNOWLEDGMENT 77
The authors would like to express their gratitude to M&I 78
Materials, National Grid, Scottish Power, Shell Global 79
Solutions (UK), TJ|H2b Analytical Services, UK Power 80
Networks and Weidmann Electrical Technology for their 81
financial and technical contributions to the Transformer 82
Research Consortium at The University of Manchester. 83
REFERENCES 84
[1] I. Fernándes, A. Ortiz, F. Delgado, C. Renedo, S. Pérez, 85
“Comparative evaluation of alternative fluids for power 86 transformers,” Elect. Power Sys. Research, vol. 98, pp. 58-69, 87
2013 88
[2] X. Zhang, Z.D. Wang, Q. Liu, P. Jarman, A. Gyore, P. Dyer, 89 “Numerical investigation of influences of coolant types on flow 90
distribution and pressure drop in disc type transformer windings,” 91

Page 8 of 8
in Int. Conf. on Condition Monitoring and Diagnosis (CMD), pp. 1
52-55, 2016 2
[3] J. Zhang, X. Li, “Oil cooling for disk-type transformer winding-3 part I: theory and model development,” IEEE Tran. Power Del., 4
vol. 21, pp. 1318-1325, 2006 5
[4] X. Zhang, Z.D. Wang, Q. Liu, “Prediction of Pressure Drop and 6 Flow Distribution in Disc Type Transformer Windings in an OD 7
Cooling Mode,” IEEE Tran. Power Del., vol. 32, pp. 1655-1664, 8
2017 9 [5] M. Nakadate, K. Toda, K. Sato, D. Biswas, C. Nakagawa, T. 10
Yanari, “Gas cooling performance in disc winding of large-11
capacity gas-insulated transformers,” IEEE. Trans. Power. Del., 12 vol. 11, no. 2, pp. 903-908, 1996 13
[6] M. Yamaguchi, T. Kumasaka, Y. Inui, S. Ono, “The Flow Rate in 14
a Self-Cooled Transformers,” IEEE Trans. Power Apparatus and 15 Syst. vol. PAS-100, pp. 956-963, 1981 16
[7] J. Zhang, X. Li, “Coolant flow distribution and pressure loss in 17
ONAN transformer winding part II: optimization of design 18 parameters,” IEEE Trans. Power Del., vol. 19, pp. 194-199, 2004 19
[8] F. Torriano, M. Chaaban, P. Picher, “Numerical study of 20
parameters affecting the temperature distribution in a disc-type 21 transformer winding,” Appl. Therm. Eng., vol. 30, pp. 2034-2044, 22
2010 23
[9] R. Girgis, M. Bernesjö, G.K. Frimpong, “Detailed performance of 24 a 50 MVA transformer filled with a natural ester oil versus mineral 25
oil,” in CIGRE 2010, A2_107_2010, Paris 26
[10] J. Hajek, J. Kranenborg, P. Sundqvist, et al., “Considerations for 27 the Design, Manufacture, and Retro-filling of Power Transformers 28
with High Fire Point, Biodegradable Ester Fluids,” Proc. CIGRE 29
Gen. Session, A2_203, 2012 30 [11] K. Dongjin, K. Kyosun, W. Jungwook, K. Yungsig, “Hot spot 31
temperature for 154 kV transformer filled with mineral oil and 32
natural ester fluid,” IEEE Trans. Diel. Elect. Ins., vol. 19, pp. 33 1013-1020, 2012 34
[12] F. Torriano, H. Campelo, M. Quintela, P. Labbé, and P. Picher, 35
“Numerical and experimental thermofluid investigation of different 36 disc-type power transformer winding arrangements,” International 37
Journal of Heat and Fluid Flow, vol. 69, pp. 62-72, 2018 38
[13] S. Tenbohlen, N. Schmidt, C. Breuer, S. Khandan, and R. 39 Lebreton, “Investigation of Thermal Behavior of an Oil-Directed 40
Cooled Transformer Winding,” IEEE Tran. Power Del., vol. 33, 41
pp. 1091-1098, 2018. 42
[14] N. Schmidt, S. Tenbohlen, S. Chen, and C. Breuer, “Numerical and 43
experimental investigation of the temperature distribution inside 44 oil-cooled transformer windings,” in 18th International Symposium 45
on High Voltage Engineering, p. 25, 2013. 46
[15] P. Allen, O. Szpiro, E. Campero, “Thermal analysis of power 47 transformer windings,” Electric Manchines and Electromagnetics, 48
vol. 6, 1981 49
[16] J-M. Mufuta, “Comparison of experimenttal values and numerical 50 simulation on a set-up simulating the cross-section of a disc-type 51
transformer,” Int. Jour. Therm. Sciences, vol. 38, pp. 424-435, 52
1999 53 [17] J. Zhang, X. Li, M. Vance, “Experiments and modeling of heat 54
transfer in oil transformer winding with zigzag cooling ducts,” 55
Appl. Therm. Eng., vol. 28, pp. 36-48, 2008 56 [18] M. Daghrah, Z.D. Wang, Q. Liu, Ch. Krause, P.W.R. Smith, 57
“Characterization of Oil Flow within Radial Cooling Ducts of Disc 58
Type Transformer Windings Using Particle Image Velocimetry,” 59 Electr. Ins. Magazine,2018 (submitted) 60
[19] X. Zhang, M. Daghrah, Z. Wang, Q. Liu, P. Jarman, and M. Negro, 61
"Experimental Verification of Dimensional Analysis Results on 62 Flow Distribution and Pressure Drop for Disc-Type Windings in 63
OD Cooling Modes," IEEE. Trans. Power. Del., vol. 33, no. 4, pp. 64
1647-1656, 2018. 65 [20] Available: http://www.nynas.com/en/product-areas-66
solutions/transformer-oils/oils/nytro-gemini-x/ (2017) 67
[21] Available: http://www.shell.com/business-customers/lubricants-68 for-business/shell-diala-electrical-oils.html (2017) 69
[22] Available: http://www.midel.com/productsmidel/midel-70
7131/thermal-properties (2017) 71 [23] M. Pivrnec, P. Allen, K. Havliček, “Calculation of the forced, 72
direcred oil-circulation rate through a transformer cooling 73
systems,” in IEEE Proceedings C Generation, Transmission and 74 Distribution, pp. 306-312, 1987 75
[24] A. Weinläder, W. Wu, S. Tenbohlen, and Z.D Wang, "Prediction 76
of the oil flow distribution in oil-immersed transformer windings 77
by network modelling and computational fluid dynamics," IET 78 electric power applications, vol. 6, no. 2, pp. 82-90, 2012. 79
[25] A. J. Oliver, “Estimation of transformer winding temperatures and 80
coolant flows using a general network method,” IEE Proceedings 81 C Generation, Transmission and Distribution, vol. 127, pp. 395-82
405, 1980. 83
[26] E. Rahimpour, M. Barati, and M. Schäfer, “An investigation of 84 parameters affecting the temperature rise in windings with zigzag 85
cooling flow path,” Appl. Therm. Eng., vol. 27, pp. 1923-1930, 86
2007. 87 [27] Z. R. Radakovic and M. S. Sorgic, “Basics of detailed thermal-88
hydraulic model for thermal design of oil power transformers,” 89
IEEE Tran. Power Del., vol. 25, pp. 790-802, 2010. 90 [28] Z. Radakovic, U. Radoman, and P. Kostic, "Decomposition of the 91
hot-spot factor," IEEE Tran. Power Del., vol. 30, no. 1, pp. 403-92
411, 2015. 93 [29] J. Coddé, W. Van der Veken, and M. Baelmans, "Assessment of a 94
hydraulic network model for zig–zag cooled power transformer 95
windings," Appl. Therm. Eng., vol. 80, pp. 220-228, 2015. 96 [30] F. Torriano, P. Picher, M. Chaaban, “Numerical investigation of 97
3D flow and thermal effects in a disc-type transformer winding,” 98
Appl. Therm. Eng., vol. 40, pp. 121-131, 201 99 [31] A. Skillen, A. Revell, H. Iacovides, and W. Wu, "Numerical 100
prediction of local hot-spot phenomena in transformer windings," 101
Appl. Therm. Eng., vol. 36, pp. 96-105, 2012. 102 [32] X. Zhang, Z.D Wang, Q. Liu, P. Jarman, and M. Negro, 103
"Numerical investigation of oil flow and temperature distributions 104
for ON transformer windings," Appl. Therm. Eng., vol. 130, pp. 1-105 9, 2018. 106
107
108