EXPERIMENTAL STUDY OF LITHIUM-ION CELLS WITH HIGH …
53
The Pennsylvania State University The Graduate School EXPERIMENTAL STUDY OF LITHIUM-ION CELLS WITH HIGH LOADING NMC622 CATHODE AND NMP-FREE PROCESS A Thesis in Mechanical Engineering by Ya-Chen Tsai Ó 2019 Ya-Chen Tsai Submitted in Partial Fulfillment of the Requirements for the Degree of Master of Science August 2019
Transcript of EXPERIMENTAL STUDY OF LITHIUM-ION CELLS WITH HIGH …

The Pennsylvania State University
The Graduate School
EXPERIMENTAL STUDY OF LITHIUM-ION CELLS WITH HIGH LOADING NMC622
CATHODE AND NMP-FREE PROCESS
A Thesis in
Mechanical Engineering
by
Ya-Chen Tsai
Ó 2019 Ya-Chen Tsai
Submitted in Partial Fulfillment
of the Requirements
for the Degree of
Master of Science
August 2019

ii
The thesis of Ya-Chen Tsai was reviewed and approved* by the following:
Chao-Yang Wang Professor and William E. Diefenderfer Chair of Mechanical Engineering Thesis Advisor
Donghai Wang Professor of Mechanical Engineering
*Signatures are on file in the Graduate School
Danial Haworth Professor of Mechanical Engineering Associate Head for Graduate Programs of Mechanical Engineering

iii
ABSTRACT
A set of lithium-ion pouch cells consisting of thick NMC622 cathodes with high loading
(~21.65 mg/cm2) and graphite anodes (~12.1 mg/cm2) were tested under C/3 and 1C cycling.
Three different cathode coatings utilized binder with NMP-free process is developed. The aim of
this study is to investigate the cycling performance of such cathodes compared to the baseline
cathode with NMP-PVDF binder. NMP-free and NMP-PVDF based cells have discharge capacity
retention of 87.9% and 88.7% after 600 cycles, respectively. The cycle life for both groups is
expected to reach more than 1000 cycles at C/3 cycling. Fresh and aged cells were characterized
by various techniques, including C-rate test, electrochemical impedance spectroscopy (EIS),
direct current resistance (DCR) test. The NMP-free cells were found to have larger resistance
than the NMP-PVDF cells, and the significant increase of resistance on the cathode side of which
also found from the EIS measurement. Moreover, it is found that the rate capability became poor
after 600 cycles, especially for cells with NMP-free binder at higher C-rate. Further improvement
is required for a high loading lithium-ion battery with the NMP-free binder, focusing on getting
high energy density with good rate capability and longer cycle life of LIB.

iv
TABLE OF CONTENTS
LIST OF FIGURES .................................................................................................................. v
LIST OF TABLES ................................................................................................................... vii
ACKNOWLEDGEMENTS ..................................................................................................... viii
Chapter 1 Introduction ............................................................................................................. 1
1.1 Background to LIB ...................................................................................................... 2 1.2 Study Objective ........................................................................................................... 4 1.3 Thesis Outline .............................................................................................................. 5
Chapter 2 Literature Review ................................................................................................... 6
2.1 Nickel-rich NMC Cathode .......................................................................................... 6 2.2 Development of Thick Electrode ................................................................................ 7 2.3 Cell Aging Mechanisms ............................................................................................. 8 2.4 Motivation of this Study ............................................................................................. 10
Chapter 3 Experimental Design and Method .......................................................................... 11
3.1 Cell Design ................................................................................................................. 11 3.2 Experiment Facility .................................................................................................... 13 3.3 Testing Procedures ..................................................................................................... 15
3.3.1 Characterization Test ....................................................................................... 15 3.3.2 Long-Term Cycling Test ................................................................................. 19
Chapter 4 Results and Discussion ........................................................................................... 20
4.1 Initial characterization of fresh cells ........................................................................... 20 4.1.1 Initial C-rate characterization .......................................................................... 20 4.1.2 Initial EIS characterization .............................................................................. 22 4.1.3 Initial DCR testing ........................................................................................... 23
4.2 Cell Aging ................................................................................................................... 26 4.2.1 Capacity Fade .................................................................................................. 26 4.2.2 Power Fade ...................................................................................................... 31 4.2.3 Impedance Rise ................................................................................................ 33 4.2.4 C-rate and DCR test ......................................................................................... 37
Chapter 5 Conclusion .............................................................................................................. 39
References ................................................................................................................................ 41
Appendix Fitting Result for Experimental EIS Measurement ............................................... 44

v
LIST OF FIGURES
Figure 1-1: The intercalation mechanism in a Li-ion battery (shown in the discharging process) [2] ....................................................................................................................... 3
Figure 3-1: (a) The connection of the pouch cells on the cell holders. (b) The environmental chamber .................................................................................................... 14
Figure 3.2: The Arbin testing station with 32 channels used in this study. ............................. 14
Figure 3-3: (a)The Solartron Modulab XM ECS testing machine (b) the connection with testing pouch cell .............................................................................................................. 14
Figure 3-4: The current and voltage profile for c-rate test. ..................................................... 16
Figure 3-5: The Nyquist impedance plot for a LIB, Ztotal = Z’+Z’’. ........................................ 17
Figure 3-6: (a) The simplified Randles circuit [29], (b) The modified circuit with CPE [30]. ................................................................................................................................... 18
Figure 4-1: The beginning-of-life (BOL) performance of 6 types of pouch cells based on different C-rate discharging from C/10, C/5, C/3, 1C, 2C, and 3C. ................................. 20
Figure 4-2: The beginning-of-life (BOL) impedance from EIS testing results for 6 types of pouch cells. ................................................................................................................... 22
Figure 4-3: The discharge capacity retention for all types of (a)at C/3 rate for 100 cycles(b)with 1C rate for 200 cycles. ............................................................................... 24
Figure 4-4: The discharge capacity retention for all types of (a) at C/3 rate for 600 cycles (# 5 for 400 cycles), (b) with 1C rate for 1400 cycles (#5 for 600 cycles), the peak at each 200-cycle interval denotes a C/3-cycle characterization. ......................................... 27
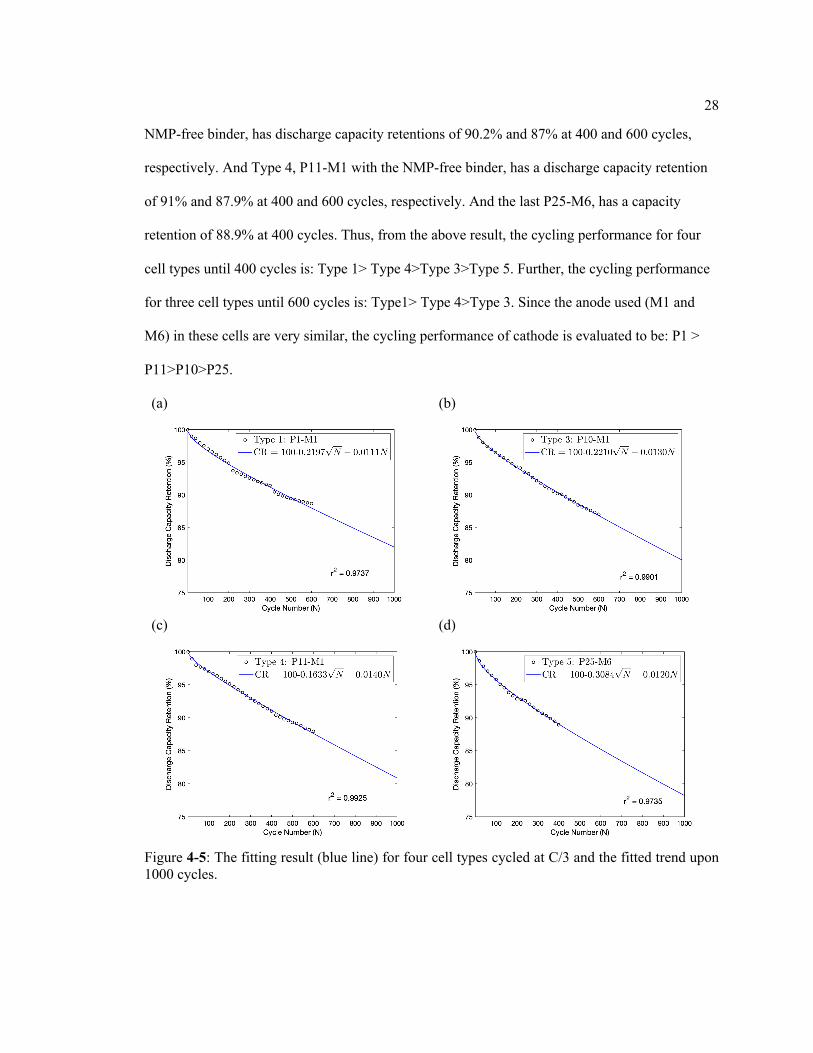
Figure 4-5: The fitting result (blue line) for four cell types cycled at C/3 and the fitted trend upon 1000 cycles. .................................................................................................... 28
Figure 4-6: The discharge capacity retention % for 1C at every 200 cycles. ........................... 30
Figure 4-7: The voltage and specific capacity profile at 1st, 200th, 400th and 600th cycles (a) type1, (b)type3, (c) type4 and (d) type 5. .................................................................... 31
Figure 4-8: The EIS spectrum for 4 cell types (a) fresh (b) 200 cycles (c) 400 cycles (d) 600 cycles. ........................................................................................................................ 34
Figure 4-9: The equivalent circuit model used for fitting experimental EIS data. ................... 34
Figure 4-10: The fitting result for EIS at 200-cycle increment (a) type1: P1-M1, (b)type 3: P10-M1, (c) type 4: P11-M1 and (d) type 5: P25-M6. ................................................. 35

vi
Figure 4-11: The total resistance (Rtot) value (a) type 1 (b) type 3 (c) type 4 (d) type 5. ......... 36
Figure 4-12: The impedance evolution for type 4. ................................................................... 36
Figure 4-13: The C-rate test after (a) 200 cycles (b) 400 cycles (c) 600 cycles. The DCR test (d) discharge resistance (e) charge resistance. ........................................................... 37

vii
LIST OF TABLES
Table 1-1: Several alternatives for cobalt oxide in market ...................................................... 3
Table 3-1: The detailed properties of positive electrode design .............................................. 11
Table 3-2: The detailed properties of negative electrode design ............................................. 11
Table 3-3: Pouch cell names and its properties ........................................................................ 13
Table 3-4: The element used in the circuit. .............................................................................. 18
Table 4-1 The C-rate result all cells type at BOL. ................................................................... 21
Table 4-2: The discharge and charge resistance from initial DCR testing and the initial C/3 discharge capacity for 6 cell types. ............................................................................ 23
Table 4-3: The cell voltage for four cell types from fresh to aged stage. ................................. 32

viii
ACKNOWLEDGEMENTS
I would first express my sincerest thanks to my advisor, Dr. Chao-Yang Wang, for giving
me the opportunity to work on this project. I am grateful for his support and patience throughout
the thesis process. His leadership and insights toward research have helped me learn much more
than I’ve ever imagined. I would also like to thank Dr. Donghai Wang for agreeing to be my
thesis reader. I gratefully acknowledge the financial support from PPG for this work.
Secondly, I would like to thank our group members in Electrochemical Engine Center:
Shanhai, Yongjun, Ryan, Teng, Jianan and Jinyong. They have given me insightful advices and
help throughout the time I work in ECEC. I would also like to thank my friends in State College
for their help and support.
Last but not least, I would like to thank my parents and my brother for their support,
encouragement and love during my master’s program at Pennsylvania State University.

1
Chapter 1
Introduction
Since the first Li-ion battery was launched in the market by Sony in 1991, the
rechargeable Li-ion battery (LIB) has become one of the most utilized electrochemical storage
devices in our daily life. Li-ion batteries have been applied in a wide variety of division from the
small portable electronics to automotive applications. As the electronic devices gets smaller, such
as cell phones, tablets and laptops, LIB has become an ideal candidate in these portable devices
due to its lightweight and high energy density. On the other hand, as the environment issues are
noticed by more and more countries around the globe, reducing the greenhouse gas (GHG)
emission, carbon dioxide (CO2), has become one of the important consensuses to slow down the
global warming effect. A large portion of pollution sources come from the transportation sector.
The conventional gas-powered car burns fossil fuel, resulting in large amount of GHG emit into
the atmosphere. In order to gradually reduce our demand on fossil fuel in transportation sector,
much more people nowadays move their attention to electric vehicles industry and see it as the
sustainable solution for our environment around the world.
With the high demand for sustainable environment and the development of Li-ion
battery, researchers have delved into the electric vehicle application for the past decade, from
hybrid electric vehicles (HEV) and plug-in electric vehicle (PHEV) to the electric vehicles
nowadays (EV). One of the most common battery types applied in today’s EV is Li-ion battery,
and thus the growth in EV demand has led the Li-ion battery to a greater potential in the market.
This automotive application is feasible because of its high energy density and good service life.

2
Moreover, the cost-effectiveness of electric vehicle is expected to improve significantly in the
near future [1].
1.1 Background to LIB
Over the past decade, the Li-ion battery has become the dominant electrochemical energy
storage in commercialized electric vehicles due to their numerous benefits, such as light weight,
high energy content, low self-discharge rates. Thus, in the current industry, most of the
companies choose to use the Li-ion battery for manufacturing their electric vehicle, from BMW,
Tesla, Honda, to Toyota, etc.
LIBs are composed of three main parts: positive electrode (aluminum foil as current
collector), negative electrode (copper foil as current collector) and the electrolyte. In between the
positive and negative electrode, there is a separator to prevent the short circuit occurred in the
cell. Different configurations such as cylindrical, prismatic and pouch cells are designed for
various uses. In a battery system, a single cell is used, or several cells are connected in series or in
parallel. In addition, it is often equipped with a battery management system for controlling
purposes.
Unlike other conventional electrochemical rechargeable batteries, the electrochemical
mechanism in a LIB is called intercalation, which means the lithium-ion migrates back and forth
between the electrodes during charging and discharging and are intercalated into the active
materials. In the reduced state, the lithium-ions are stored in between layers of electrodes. Upon
oxidation, the lithium ions are transported into the electrolyte and migrate to the electrode on the
other side, where the reduction process reinserts lithium ion between the electrode layers [2].

3
Figure 1-1: The intercalation mechanism in a Li-ion battery (shown in the discharging process) [2]
The traditional positive electrode material of a LIB is lithium cobalt oxide, LiCoO2, with
a layered structure. It has been used in small portable electronics for many years. However, due to
the high cost of cobalt and safety concern [3], efforts are put into the development of alternative
electrode materials for future EV application. Table 1-1 gives several commercial cathode
materials for LIB. Among them, the nickel manganese cobalt oxide (NMC) has become one of
the most promising class of cathode active materials. Nowadays, the commercial NMC111 is
continuously altered toward high nickel content for reducing cost and acquiring higher capacity.
Table 1-1: Several alternatives for cobalt oxide in market
Compound Abbreviation Chemical Structure Manganese Oxide LMO LiMn2O4
Nickel manganese cobalt oxide NMC LiMi1/3Mn 1/3Co1/3O2 Nickel cobalt aluminum oxide NCA LiNi0.8Co0.15Al0.05O2
Iron phosphate LFP LiFePO4

4
Lithium metal is used as anode initially with its high specific capacity (3860mAh/g) and
large negative potential. However, it is only used in coin cell nowadays, since the lithium can be
deposited as dendrite, which will grow through the separator and then lead to short circuit in the
cell. Today, the most common active material of anode is graphite carbon, which is a lithium
interaction material. During charging the lithium ions are intercalated into graphite between its
layers while during discharging lithium ions go to the opposite direction [2].
In addition to the active material on the electrode, binder is required to hold the active
material adhesive with the current collector. In the conventional Li-ion battery manufacturing
process, the use of polyvinylidene fluoride (PVDF) binder with N-methyl-2-pyrrolidone (NMP)
solvent is the most common technique, especially in cathode. However, the NMP solvent is toxic,
so alternatives are developed to eliminate the use of solvent by a water-soluble binder, such as
styrene-butadiene rubber (SBR) or new fabrication method. On the other hand, for the anode, it is
found that styrene-butadiene rubber/carboxymethylcellulose (SBR/CMC) binder system performs
better than PVDF binder on anode [4].
LIB use nonaqueous organic solvent as their electrolyte. Unlike other rechargeable
batteries, Li-ion cannot use aqueous electrolytes since its operation will be well outside the
decomposition potential of water. Instead, carbonates are used. Propylene carbonates (PC) is
initially applied in the LIB. By far, the use of ethylene carbonate (EC), dimethyl carbonate
(DMC) and ethyl methyl carbonate (EMC) is more common in the industry.
1.2 Study Objective
In this study, pouch cells with high loading electrode that utilize graphite and NMC622
as active material for anode and cathode are fabricated and tested. This study will focus the
discussion on the performance of different cathode coating types. The baseline cathode with

5
NMP-PVDF binder, is compared with several cathode coating with NMP-free binder. These cells
are characterized under several tests to evaluate their performance. The main obstacle for the cell
performance and cycle life is believed to be the resistance and transportation of ions due to thick
cathode. The expecting performance and overall goal for this study is to acquire capacity
retention above 85% of its initial C/3 capacity after 300 cycles at C/3 rate cycling. The 80%
retention can be seen as standard cutoff line for an effective cell. The testing data will be analyzed
and provide an insight for the future research on high loading electrode.
1.3 Thesis Outline
The thesis begins with the introduction of lithium-ion battery, followed by the literature
review of the previous studies, regarding the nickel-rich NMC cathode, high loading electrode,
and the aging mechanism of the battery. Next, the experiment facility and testing procedure is
presented. Then, the results are discussed, followed by the final conclusion of the study.

6
Chapter 2
Literature Review
This chapter will discuss about the previous studies regarding the nickel rich cathode
material in LIB, then the studies in high loading cell, and last, the aging mechanism of the lithium
ion battery.
2.1 Nickel-rich NMC Cathode
The layered lithium nickel-rich manganese and cobalt-containing oxides, usually termed
NMC, have been widely used as cathode active material for EV batteries nowadays. Great effort
has been made toward on the synthesis of NMC materials [5][6]. Among these layer structured
materials, Li[Ni1/3Co1/3Mn1/3]O2 (NMC111) has already been commercialized for automotive
application. However, NMC111 will not meet the requirement for next generation EV
applications, since its specific capacity of ~155 mAh/g is quite low [7]. In addition, reducing the
Co content in the electrode is preferable, since Ni is much more cost-effective than scarce Co
material.
Thus, in order to supply the increasing EV applications demand and lower the cost, new
materials of nickel-rich NMC (Li(Nix Mny Coz )O2) (x+y+z = 1, x≥0.5) is developed. Among
them, Li(Ni0.6Mn0.2Co0.2)O2 (NMC622) and Li(Ni0.8Mn0.1Co0.1)O2 (NMC811) are the
most common candidate for Ni-rich cathode recently. It delivers higher capacity than NMC111
due to the higher nickel content which is the main active redox species (Ni2+ ⇆ Ni4+) in the host
structure [8].

7
However, there is a trade-off between capacity and thermal stability of NMC cathodes.
Noh et al. [9] reported that a linear decrease in the thermal stability is found when the discharge
capacity is raised as the Ni content increases. In addition, the capacity retention is reported to
have poor performance as the Ni content increases, as higher surface reactivity result in shorter
cycle life. Moreover, the rate capability of Ni-rich cathode is reported to have worse performance
when compared to structure similar NMC111 [10], which is due to lower electronic conductivity
from less Co content in the Ni-rich NMC cathode.
2.2 Development of Thick Electrode
Increasing electrode thickness is an effective way to achieve high energy densities for a
LIB. In addition, the use of thick electrode gives the possibility to reduce the production cost
[12]. Several studies have reported the effect of thick electrode. Zheng et al. [11] studied the cell
with NMC111 cathode and LFP anode of different active material loading. They observed that
enhanced energy densities from increasing the thickness of electrode is accompanied by a
significant loss of power density. Singh et al. [12] prepared single-sided 70µm and 320 μm NMC
111 and graphite anode cells. The pouch cell with thicker electrodes show 19% higher volumetric
energy density at C/5 in comparison to thin electrode. In addition, thick electrode only shows
good performance at medium to small C-rate.
Danner et al. [13] modeled the experimental study from Singh et al. [12] with 3D micro-
structure resolved simulations, and it showed good agreement, which provided an insight into
limiting factors for thick electrode cells. They found at high C-rate the limitation of lithium ion
transport is attributed to significant loss in capacity. Small inhomogeneities in carbon black
distribution did not affect the performance of electrode. Another numerical modelling was
conducted from Du et al. [14] to study the energy-power density relationship. The energy density

8
was found to have a maximum point versus electrode thickness (critical thickness) at given
discharging C-rates. Also, cell polarization and active material underutilization were found to
offset the advantage of high-volume ratio of active materials in thick electrodes.
Lee et al. [15] studied the rate limitation for high loading electrode > 25g/cm2 under C/3
and 1C.They found the galvanostatic charge/discharge behaviors at high rate and the cycling
performance at C/3 rate are more closely related to the electronic conductivity than the ion
conductivity. Heubner et al. [16] investigated the effect of thickness and porosity for NMC622
cathode for high energy cell. Batteries with thicker electrode increase specific ohmic, charge
transfer and contact resistance while reducing the effective Li-ion diffusivity in the electrolyte.
Reducing the porosity increases the specific ohmic and charge transfer resistance while reducing
the contact resistance and the effective Li-ion diffusivity in the electrolyte.
2.3 Cell Aging Mechanisms
Battery aging, increasing cell impedance, capacity decay and power fade comes from
multiple and complex mechanism, and it is also strongly dependent on the operating conditions.
For carbon electrode, ageing effect is mainly attributed to changes at electrode/electrolyte surface,
which is the solid electrolyte interphase (SEI) formation and growth [17]. In the first few cycles
for cycling, there is a large irreversible capacity loss due to SEI layer formation, resulting in a
decrease in initial capacity. The SEI layer continue to grow during the long-term cycling, which
usually consume not only electrolyte, but also active, cyclable lithium, thus leading to capacity
fade for the LIB [18].
As the long-term cycling proceed, lithium plating and lithium dendrite tends to form and
eventually result in malfunction of the batteries. The lithium metal will deposit on the SEI surface
of the anode during charging, which is often occur in low temperature (below 25 °C) and high

9
charging rate. When the lithium deposit and dendrite continue to grow between the anode and
separator, a short circuit create and eventually result in thermal runaway and battery failure
[17][19].
Several studies have utilized model-based analysis to simulate battery ageing processes
[20] [21] [22]. Yang et al. [23] modeled the aged cell induced by SEI and lithium plating by a
transition model from linear to non-linear. Cell aging is found to be linear with the cycle number
at the early stage of cycling, meaning the capacity loss linearly with a slightly resistance increase.
In addition, SEI is found to be the dominant ageing mechanism in this early stage. As the cycling
proceed, lithium plating is triggered and the cell ageing transit from linear to highly nonlinear.
The dramatic increase in lithium plating rate result in rapid loss of lithium inventory and
significantly rise in resistance at the later stage of LIB cycle life.
Moreover, for the cycle life performance for NMC cathodes, Zheng et al. [11] reported
the long-term cycling performance for thick NMC111 and found that the performance is largely
deteriorated, which is attributed to the high internal resistance and poor mechanical integrity of
thicker electrode. Ma et al. [24] investigated the rollover failure of cycling NMC532/graphite
pouch cell. They found the impedance growth after rollover completely originated from the
positive side while the negative side did not change at all. Also, by lowering the electrode loading
can delay the occurrence of rollover. Jung el at. [25] studied the aging phenomena and of
NMC111, NMC622 and NMC811. The capacity fades of these cells are found to be due to
significant increase in the polarization of NMC cathode while the polarization of anode remained
rather constant. In addition, the highest specific energy of ~650mWh/gNMC with a stable cycling at
1C was obtained at a high voltage of NMC622-graphite cell cycled up to 4.4V.

10
2.4 Motivation of this Study
As the demand for electric vehicle is getting higher for the next decade, higher energy
densities and more environmentally friendly lithium-ion battery need to be developed. Therefore,
in this study, a set of pouch cells that utilized cathode of high loading NMC622 as active material
with NMP-free binder are prepared and compared with the performance of baseline cells that use
NMP-PVDF binder.

11
Chapter 3
Experimental Design and Method
3.1 Cell Design
A total of 21 pouch cells were prepared for performance evaluation. These cells were
made from combinations of different types of cathode and anode. There are five types of
NMC622 cathode and three types of graphite anode to be used in the pouch cell fabrication. Table
3-1 shows the properties of the positive electrodes, and Table 3-2 shows the properties of the
negative electrodes. The total thickness for double-sided electrodes (including Al and Cu foil) is
175~180 𝜇𝑚 and 195 𝜇𝑚, for positive and negative electrodes, respectively. Note that the
thickness of MU anode is only 130𝜇𝑚.
Table 3-1: The detailed properties of positive electrode design
Cathode Name
Active Material Loading (mg/cm2)
Approximate areal capacity (mAh/cm2)
Binder System
Formula (AM:CA:B)
P1 21.6 3.69 NMP-PVDF 93:03:04 P10 21.1 3.61 NMP-free 93:03:04 P11 20.8 3.55 NMP-free 93:03:04 P25 19.5 3.33 NMP-free 93:03:04
Table 3-2: The detailed properties of negative electrode design
Anode Name
Active Material Loading (mg/cm2)
Approximate areal capacity (mAh/cm2)
Binder System
Formula (AM:CA:B)
M1 12.1 4.24 CMC/SBR 96.5:0.5:3 M6 12.1 4.24 CMC/SBR 97:00:03 MU 11.1 3.89 CMC/SBR N/A

12
The active material loading is the prescribed value and the approximate areal capacity is
determined based on measurement of the total area-specific mass of electrode multiplied by the
mass fraction in the electrode formula, then convert it to areal capacity by applying a specific
capacity of 171 mAh/g for NMC622 and 350 mAh/g for graphite. Besides from P1 cathode
utilized NMP-PVDF binder, other cathode binders used the NMP-free process instead. As for the
anode binder, SBR/CMC binder is utilized, and the SBR/CMC ratio is maintained at 1:2. Note
that graphite anode M1 and graphite anode M6 are very similar, with only a slightly difference in
the formula, thus, in this study, it is seen as the same type of anode.
Six cell types were fabricated from these different types of positive and negative
electrodes. The separator is 25 𝜇𝑚 in thickness, and the electrolyte is 1.0 M lithium
hexafluorophsphate (LiPF6) dissolved in ethylene carbonate (EC): ethylmethyl carbonate (EMC)
(3:7 by wt. with 2% vinylene carbonate). The design discharge capacity are approximately 2.57
Ah and 2.29 Ah for the cells with 9 cathode layers and 8 cathode layers, respectively. The
calculation of design capacity for 9 cathode layers is shown as Equation 3-1.
Q'()*+, = 9layers × 7)*'()89:;(<
× =>.@ABCD
8)*'(× 20.65C+IJKLDD
BCD × 171COP+= 2.57Ah (3-1)
The approximate N/P ratio (where “N” is the negative electrode, or anode during cell
discharging and “P” is the positive electrode, or cathode during cell discharging) in Table 3-3 is
calculated from the areal capacity in Table 3-1 and Table 3-2. Using the value of areal capacity of
negative electrode divided by the corresponding value of the positive electrode. All N/P ratios in
Table 3-3 are above 1.1, which aids to prevent the lithium plating at the graphite anode [26],
except P1-MU cell has only 1.05 N/P ratio, the impact of this low ratio will further be discussed
in the following chapter.

13
Table 3-3: Pouch cell names and its properties
Cell Type Electrode (positive-negative)
Cell Count
Design Capacity (Ah) N/P ratio
Type 1 P1-M1 2 2.57 1.15 Type 2 P1-MU 4 2.29 1.05 Type 3 P10-M1 2 2.57 1.17 Type 4 P11-M1 3 2.57 1.19 Type 5 P25-M6 3 2.29 1.27 Type 6 P25-MU 4 2.29 1.17
3.2 Experiment Facility
The fabricated pouch cells were connected to testing station as Figure 3-1(a), cell holders
were used as the base plate in order to prevent the short circuit during operating. An
environmental chamber was used to maintain the testing condition at 30 °C at all times, see
Figure 3-1(b). Then a multichannel Arbin battery testing system (Model: BT 2000 with 32
channels, Arbin Instrument, USA) was used as show in Figure 3-3. In addition, the Solartron
Modulab XM ECS, Figure 3-4, was utilized for measuring the impedance of the pouch cells.

14
(a)
(b)
Figure 3-1: (a) The connection of the pouch cells on the cell holders. (b) The environmental chamber
Figure 3.2: The Arbin testing station with 32 channels used in this study.
(a)
(b)
Figure 3-3: (a)The Solartron Modulab XM ECS testing machine (b) the connection with testing pouch cell

15
3.3 Testing Procedures
Formation cycles were made before starting to characterize the cell. The purpose of
which is to format a protection layer on the graphite anode, which is called a solid electrolyte
interphase (SEI) layer. The SEI layer is found to be essential for the system performance,
especially for the long-term cycling [27]. SEI can preserve the structure of the cell assuring their
high capacity and good cycling ability.
3.3.1 Characterization Test
The following three characterizing test were performed for the fresh pouch cells and then
repeated for each 200-cycle increment. They are C-rate test, electrochemical impedance
spectroscopy (EIS), and direct current resistance characterization (DCR).
For C-Rate testing, the cell was charged to 100% SoC using constant current/constant
voltage (CCCV) standard charging protocol. The charging rate was C/3 until the upper voltage of
4.2V was reached, then held at voltage of 4.2V until the cutoff current C/20 was measured. After
resting for 30 minutes, the cell was discharged at a given C-rate until reached down to a cutoff
voltage of 2.8V. The cell was rested for another 30 minutes to start the next charging C/3 cycle.
The discharge C-rates were applied in the following order for each testing cycle: C/10, C/5, C/3,
1C, 2C and 3C, as shown in Figure 3-4. This test was conducted at 30 °C in an environmental
chamber.

16
Figure 3-4: The current and voltage profile for c-rate test.
Next, the cell was connected to the Solartron machine to measure the EIS impedance.
Before making measurement, the cell with 90% state of charge (SOC) rested for an hour. The
frequency was swept from 0.01 Hz to 50k Hz with a 5mV AC perturbation, which is a wide range
enough to cover pertinent time step scales associated with various transport and charge transfer
process in the cell. All EIS tests were conducted at 25 °C.
EIS is an effective technique to study the dynamics and properties of materials and
electrochemical systems such as batteries and fuel cell [28]. Impedance is a measure of the ability
of a circuit to resist the flow of electrical current. By applying a small sinusoidal current of fixed
frequency, a response is measured and compute the impedance. Repeat for a wide range of
frequencies. The measured impedance is calculated from Equation 3-1 at each frequency.
Zw = Ew/Iw (3-1)
where Ew is the frequency-dependent potential and Iw is the frequency-dependent current.

17
A Nyquist plot of EIS test example is shown as Figure 3-5 with frequency range from
0.01 Hz to 50k Hz and 90% SOC of a Li-ion pouch cell. The low frequency area close to a
straight line represents the diffusion phenomenon in the cell. A semi-circle in the middle
frequency typically represents the charge transfer resistance at the electrode surfaces. In the high
frequency region, typically is above 1kHz, there is a curve intersect with abscissa axes, which
reflects the battery inductance and ohmic resistance from current collector and wire.
Figure 3-5: The Nyquist impedance plot for a LIB, Ztotal = Z’+Z’’.
EIS data is usually fitted by equivalent circuit model, which can be compared with the
actual EIS measurement of the LIB. One of the most widely used equivalent circuit model for
LIB is Randles circuit [30], the simplified circuit is shown in Figure 3.6 (a). However, in real
system, these idealized circuit elements are inadequate to model electrochemical charge transfer
and double layer capacitance due to the spatial distribution of these processes [28]. Thus, a
constant phase element (CPE), which is independent of frequency, is usually used to replace Cdl
for a Li-ion cell. Table 3-4 presents the commonly used circuit element in the model. For CPE

18
impedance, where Q is a constant, ω is the radian frequency and α is usually range from 0~1, (if
n=1, an ideal capacitor, if n = 1, a resistor)
(a)
(b)
Figure 3-6: (a) The simplified Randles circuit [29], (b) The modified circuit with CPE [30].
Table 3-4: The element used in the circuit.
Equivalent Element Impedance R R C 1/jωC L jωL
Q (CPE) 1/Q(jω)n
The last characterization is the direct current resistance test (DCR), the cell was discharge
to 50% SoC and then rest for 1 hour. A pulse discharge rate of 5C was applied for 10 seconds
followed by a 40 seconds rest and then a pulse charge rate of 3.75C was applied for 10 seconds.
Charge and discharge rate were calculated using Ohm’s law as Equation 3-2.
𝑅 = TUVWXYZTVWV[VXY\
(3-2)
where the Vfinal denotes the cell voltage at the end of current pulse, and Vinitial denotes the cell
voltage before the current passed through the cell. The current I represent the given pulse current
applies to the cell and the discharge current is in negative sign. All pouch cells were tested at
30 °C in the environmental chamber.

19
3.3.2 Long-Term Cycling Test
After the characterization part, the fresh cell started to do the cycle test. For each type of
cells, 1~2 cells were subjected to cycle at the rate of C/3, while the rest of the cells were cycling
at rate of 1C for a quicker overview of the cell performance. The standard protocol is used as
follows: CCCV at rate of C/3 or 1C with the upper cutoff voltage of 4.2V and cutoff current of
C/20. The cell then rested for 5 minutes. Next, discharge at a rate of C/3 or 1C until the cutoff
voltage at 2.8 V followed by a rest for 10 minutes. This accounts for one cycle, and the whole
procedure was repeated until the next characterization test scheduled at next 200-cycle increment.
Note that only cells cycling at C/3 were taken to do the characterization test. In addition, since the
C/3 capacity represents the “true” discharge capacity of a cell, a C/3 cycle is performed to the 1C
cycled cells at every 200 cycles.

20
Chapter 4
Results and Discussion
4.1 Initial characterization of fresh cells
A set of 22 NMC622/graphite high loading pouch cells were prepared and screened in
this study. This chapter will present and discuss the result from the experimental method that
described in the previous section. In order to get the early stage evaluation of each cell types,
three characterization methods were applied to the pouch cells.
4.1.1 Initial C-rate characterization
The c-rate testing result for 6 types of pouch cell is shown in Figure 4.1 with the
discharge capacity that normalized by C/10 value as the vertical axis because of the different
layers used of cathode between types, with the corresponding discharge c-rate as the horizontal
axis.
Figure 4-1: The beginning-of-life (BOL) performance of 6 types of pouch cells based on different C-rate discharging from C/10, C/5, C/3, 1C, 2C, and 3C.

21
Table 4-1 The C-rate result all cells type at BOL.
Type Electrode
(cathode binder system)
Discharge Capacity (mAh/g)
C/5 C/3 1C 2C 3C
1 P1-M1 (NMP-PVDF) 177.23 0.982 0.960 0.874 0.777 0.466 2 P1-MU (NMP-PVDF) 149.23 0.951 0.891 0.727 0.530 0.404 3 P10-M1(NMP-free) 168.21 0.985 0.974 0.894 0.672 0.363 4 P11-M1(NMP-free) 179.61 0.995 0.982 0.928 0.744 0.423 5 P25-M6(NMP-free) 156.64 0.990 0.978 0.923 0.697 0.449 6 P25-MU(NMP-free) 149.41 0.935 0.876 0.711 0.536 0.411
The normalized discharge capacity on the y axis in Figure 4-1 is calculated by using the
discharge capacity at a certain c-rate divided by the discharge capacity at C/10, the discharge
capacity with normalized data are shown in Table 4-1. The results show that there are two distinct
groups of trend at low c-rates, from C/5 to C/3, the discharge capacity of P1-M1, P10-M1, P11-
M1and P25-M6 have similar performance (>96%), whereas P25-MU and P1-MU performs worse
and retains only ~87% (C/3 rate) of their C/10 discharge capacity. Thus, P25 and P1 with MU
anode show a relatively poor performance than usual. On the other hand, for the high c-rate
performance, larger difference can be found between each type. Among them, P1-M1 have the
best performance at high C-rate, with 77.7% and 46.6% at 2C and 3C, respectively.
However, based on the standard effective capacity retention of 80%, one can find that all
of these thick electrode cells have poor performance when running at high c-rate (>2C), which
may be limited by ion diffusion in the electrolyte. At high C-rate, the limitation of lithium ion
transport is attributed to significant loss in capacity.

22
4.1.2 Initial EIS characterization
Figure 4-2: The beginning-of-life (BOL) impedance from EIS testing results for 6 types of pouch cells.
Next, looking into the EIS testing for fresh cells, the measured impedance results for all
fresh cells at 90% SoC are shown in Figure 4-2 with a Nyquist plot, both axes are normalized
with electrode area. The intersection of the data with the abscissa corresponds to the pure ohmic
resistance and the inductive area of impedance spectrum. If there is a single arc, it is simply
attributes to the lumped charge transfer resistance. When there are two arcs, the first arc is said to
represent the resistance due to the passivated film that develop on the cathode active materials,
while the second arc represent charge-transfer resistance from both electrodes, mainly cathode.
Moreover, it is found that, the impedance largely come from the cathode, since the kinetics on the
cathode is more sluggish than the graphite anode [10]. In particular, two arcs were observed in
Type 3: P10-M1, Type 4: P11-M1, and Type 6: P25-MU, whereas the other types only show one
arc. It potentially indicates that these cathodes have already developed or already possessed an

23
additional barrier to transport on the cathode. In addition, it is observed that the cell with P1
cathode with NMP-PVDF binder possesses a lower ohmic and charge-transfer resistance, with a
single arc exist. Unlike P10- and P11- based cells, which have larger ohmic resistance and charge
transfer resistance.
4.1.3 Initial DCR testing
The pouch cells were then discharge to 50% SOC prior to the DCR testing. The result for
the internal resistance for the fresh cell is shown in Table 4-2. Again, the DCR results are also
normalized with the electrode area.
Table 4-2: The discharge and charge resistance from initial DCR testing and the initial C/3 discharge capacity for 6 cell types.
Type Electrode
(cathode binder system)
Discharge Resistance
(Ωcm2)
Charge Resistance
(Ωcm2)
Initial C/3 discharge capacity
(Ah) 1 P1-M1 (NMP-PVDF) 26.78 27.79 2.67 2 P1-MU(NMP-PVDF) 28.17 27.19 1.78 3 P10-M1(NMP-free) 64.94 55.29 2.56 4 P11-M1(NMP-free) 62.67 53.14 2.47 5 P25-M6(NMP-free) 44.63 40.19 2.07 6 P25-MU(NMP-free) 50.2 45.65 1.72
From the Table 4-2, the initial internal resistances of all cell types tested by direct current
are shown. It can be found that that Type 3 and Type 4 both have higher resistance in discharge
and charge process, which is consistent with EIS result that there were two arcs already
developed at fresh cell stage.

24
Cycling was started after the initial characterization; all cells were run under C/3 rate at
the first cycle. The initial C/3 discharge capacity is shown in Table 4-2. While the initial C/3
discharge capacity of P1-M1, P10-M1 and P11-M1 are close to (>96.1%) of design
capacity(2.57Ah), and for P25-M6 shows relative low capacity (90.1%) than the design value of
2.29Ah. However, for P1-MU and P25-MU, they only have about 77.8% and 75.1% of design
capacity, respectively. The low initial capacity for Type 2 and 6 is considered to be non-
competitive for cycling among all other the cells. This may mainly due to the Li-ion lose
occurring in the first few cycles; lithium ions extracted from the oxide during initial charge are
not fully re-inserted into the cathode, leading to loss of available capacity [31].
(a)
(b)
Figure 4-3: The discharge capacity retention for all types of (a)at C/3 rate for 100 cycles(b)with 1C rate for 200 cycles.
The initial first 100 cycles are shown in figure 4-3, it is observed the P1-MU have poor
performance even in C/3 capacity retention, it reaches down to 90% capacity retention after 100
cycles, while the other still retain above 95% at 100 cycles. Among the cells cycled in C/3 rate,
P1-M1 and P10-M1 and P11-M1 have relatively excellent retention at the early stage of cycling.
On the other hand, for the 1C cycling, all cells show the much lower retention compared to the

25
C/3 cycling performance. Especially for P25-MU, a discrete slope appeared after 100 cycles,
showing a non-stable cycling performance in the early stage.
From the initial evaluation for all cell types, regarding all the factors from resistance and
cycling, a decision point can be made that Type 2 (P1-MU) and Type 6(P25-MU) are both have
poor performance and thus not suitable for the following cycling test. It is found that both types
have relatively bad performance on rate capability based on the c-rate test, this may due to anode
used in these two types. Finally, after these two types were cycled about 100 and 200 cycles at
C/3 and 1C, respectively, the poor performance further proved that these two types with MU
graphite anode is not able to be a good candidate to meet the study objective. The reason for the
bad performance of MU-based cell is mainly believed to be the low porosity of this anode. From
Equation 4-1, the approximate porosity can be obtained.
𝜖 = 1 − _`abcd_eaefb
= 1 − ghh
ij∑ glcmcc (i = AM, CA, B) (4-1)
where m’’ is the mass of solid material per unit area of electrode, l is the thickness of the
electrode excluding the metal foil, 𝑚𝑓o is the mass fraction of the ith component of the mixture,
and 𝜌o is the density of the ith species of the mixture. Here, AM, CA and B stands for the active
material, conductive additive, and binder. This calculation can provide a good approximation of
the range in which the porosity falls. A low porosity of ~16% is obtained from the calculation for
MU anode, which is well below the typical porosity of electrode ~35%. Thus, the observed initial
and cycling capacity retention for these MU-based cells is expected. In addition, it is noticed
during the fabrication process that this MU graphite anode surface is shiny instead of a matte
surface, which typically indicates excessive calendaring of the electrode. Therefore, 2 cell types
were stopped testing and will not be included in the further discussion.

26
Based on the BOL initial screen, upon utilized the same anode, cathode P10, P11, and
P25 with NMP-free binder are found to have similar c-rate performance. However, these cathodes
perform worse at the higher c-rate, indicating that they don’t have good rate capability even in the
fresh status. This is expected for such high electrode loading due to poor kinetics inside the cell.
In addition, this can be further proved by the EIS and DCR result, both tests show that P10, P11
and P25 NMP-free cathode have larger resistance than P1 cathode. Thus, the utilization of NMP-
free process coating for P10, P11 and P25 cathode is the reason to cause a larger resistance than
NMP-PVDF based cathode in this study.
4.2 Cell Aging
4.2.1 Capacity Fade
The primary metric for success in this study is defined by cycle life, the results for
capacity evolution is extremely important. Figure 4.4 shows the cycling result at C/3 rate and 1C
rate, respectively. For C/3 cells on the left, they were stopped at each 200-cycle increment and
then characterized for c-rate, EIS and DCR test after 200 cycles; whereas for 1C cells, they were
continued cycling with 1C rate and run a C/3 characterization at each 200-cycle increment, since
the C/3 discharge capacity can be seen as the true capacity of each cell.

27
(a)
(b)
Figure 4-4: The discharge capacity retention for all types of (a) at C/3 rate for 600 cycles (# 5 for 400 cycles), (b) with 1C rate for 1400 cycles (#5 for 600 cycles), the peak at each 200-cycle interval denotes a C/3-cycle characterization.
The C/3 capacity evolution for all 4 cell types demonstrates a similar rate of capacity
fade. For the Type 1, P1-M1 with NMP-PVDF binder, has the most stable and the best retention
rate of 91.4% and 88.7 % at 400 and 600 cycles, respectively. As for Type 3, P10-M1 with the
28
NMP-free binder, has discharge capacity retentions of 90.2% and 87% at 400 and 600 cycles,
respectively. And Type 4, P11-M1 with the NMP-free binder, has a discharge capacity retention
of 91% and 87.9% at 400 and 600 cycles, respectively. And the last P25-M6, has a capacity
retention of 88.9% at 400 cycles. Thus, from the above result, the cycling performance for four
cell types until 400 cycles is: Type 1> Type 4>Type 3>Type 5. Further, the cycling performance
for three cell types until 600 cycles is: Type1> Type 4>Type 3. Since the anode used (M1 and
M6) in these cells are very similar, the cycling performance of cathode is evaluated to be: P1 >
P11>P10>P25.
(a)
(b)
(c)
(d)
Figure 4-5: The fitting result (blue line) for four cell types cycled at C/3 and the fitted trend upon 1000 cycles.

29
In order to further understand the capacity fade along the cycling process. The capacity
fade is fitted as the capacity retention as a function of cycle number. The four curves are reported
in the following as Equation 4-2(a-d):
CR%(Type1) = 100 − 0.2197√N − 0.0111𝑁 (4-2a)
CR%(Type3) = 100 − 0.2210√N − 0.0130𝑁 (4-2b)
CR%(Type4) = 100 − 0.1633√N − 0.140𝑁 (4-2c)
CR%(Type5) = 100 − 0.3084√N − 0.0120𝑁 (4-2d)
As can be seen from the figure 4-5, there are relative large capacity loss occur in the
first 200 cycles for all cell types, which may be due to the loss of lithium inventory by the
quick growth of solid-electrolyte interphase (SEI) layer on the graphite negative electrode [31].
Thus, the discharge capacity retention at the initial stage is dominated by parabolic
behavior (√N), then the trend gradually transits to linear (N) as the cycling proceeds. From the
fitting extrapolating, it is expected that three cell types can proceed to 1000 cycles without
lowering than 80% capacity retention. If no lithium plating or gas release, the approximate
cycle life of Type 1, Type 3, Type 4 and Type 5 is expected to have: 1200, 1000, 1100, 900
cycles. Therefore, it is found that even this kind of high loading cathode with NMP-free binder
can be cycling until more than 1000 cycles, especially for P11-based cathode, which have an
excellent cycle performance at C/3 rate.

30
Figure 4-6: The discharge capacity retention % for 1C at every 200 cycles.
For the 1C cycling performance, Figure 4-6 shows the characterized C/3 discharge
capacity for 1C cycling cell at each 200-cycle increment. It demonstrates the strong rate-
dependence of cell aging, as the capacity decreases significantly faster for cells cycled at 1C as
compared to cell cycled at C/3. For Type 1, 3 and 4, they reached below 80% after 600 cycles,
while for Type 5, its capacity loss is so large that it already reached down to 80% at around 200
cycles. Compared to C/3 cycling performance, 1C cycling shows much more capacity fade
rate. This is an expected result for electrodes of such high loading, which possess more
significant transport losses that produce conditions more favorable for loss of lithium
inventory. Moreover, the higher resistances observed for cells from EIS and DCR test with
NMP-free cathodes potentially exacerbate this issue by lowering the anode potential further,
which is again more favorable for aging, such as lithium plating.

31
4.2.2 Power Fade
While the capacity is the main objective of this study, power fade is also an indicator of
long term cycling as well as an instantaneous power availability in the system. Figure 4-7 shows
the power evolution for four cell types.
(a)
(b)
(c)
(d)
Figure 4-7: The voltage and specific capacity profile at 1st, 200th, 400th and 600th cycles (a) type1, (b)type3, (c) type4 and (d) type 5.

32
Table 4-3: The cell voltage for four cell types from fresh to aged stage.
Units: V Type 1: P1-M1
(PVDF-NMP)
Type 3: P10-M1
(NMP-free)
Type 4: P11-M1
(NMP-free)
Type 5: P25-M6
(NMP-free)
1 cycle 3.635 3.593 3.606 3.615
200 cycles 3.616 3.546 3.564 3.581
400 cycles 3.611 3.521 3.545 3.563
600 cycles 3.607 3.513 3.538 N/A
From the Figure 4-7, it can be observed that at the first 200-cycle increment for all cell
types have relatively larger power fade than the later 200-increment. For type 1, the power fade
from 200 to 600 cycles is relatively small. On the other hand, for type 3,4 and 5, the power
fade after 200 cycles is relatively larger than type 1. In addition, voltage decrease can be
observed through the aging process in the Figure 4-7, which may be due to the increase internal
resistance. Thus, Table 4-3 is made to demonstrate the decrease trend of average voltage for all
cell types. For type 1, the full cell voltage decreased by 24 mV and 28mV after 400 cycles and
600 cycles, respectively. For type 3, the full cell voltage decreased by 72mV and 80mV,
respectively. For Type 4, the full cell voltage decreased by 61mV and 69 mV after 400 and 600
cycles, respectively. Finally, for type 6, the full cell voltage decreased by 52 mV after 400
cycles.
According to Leng et al. [10] work on the three electrodes analysis, it is found that
the average voltage decreases mainly come from the positive electrode for this kind of thick
electrode pouch cell, when means the power performance for cathodes are worsen. Among all
types, type 1 have the best power performance, while type 3 and type 4 seems to have worse
power capability after 600 cycling. Therefore, the cell with the conventional binder, PVDF-
NMP, is found to act better in power and capacity retention rate.

33
4.2.3 Impedance Rise
It is reported that the power fade is directly related to the impedance of the cell
[10][12][33]. Thus, it is important to look into the impedance evolution in this study. The
impedance spectrum is measured at 90SOC. Figure 4-8 shows impedance measured at fresh,
200, 400, and 600 cycles for four cell types, respectively. As can be observed from the Figure
4-8, the first arch for cells with NMP-free binder increase significantly as the cycling proceed,
while type 1 cell with NMP-PVDF binder only shows little change as the cycling test proceed.
It means that the internal resistance for P10, P11 and P25 based cell increased significantly.
Moreover, it can be observed that the second arch does not show much increase in the process
for all types. We can first evaluate that P10 based cell has largest impedance along the way,
while P1 based cell has the smallest impedance.
(a)
(b)

34
(c)
(d)
Figure 4-8: The EIS spectrum for 4 cell types (a) fresh (b) 200 cycles (c) 400 cycles (d) 600 cycles.
Figure 4-9: The equivalent circuit model used for fitting experimental EIS data.
To get a further understanding of the EIS data, an equivalent circuit model is used to fit
the EIS spectrum. The equivalent circuit is show in circuit Figure 4-9. The inductance Li shows
the effect in the high frequencies, it mainly due to the cell wires or the potentiostat connections.
The pure ohm resistance, Rohm is from the electrode, electrolyte, and separator and contact
between component inside the cell. R1and CPE1 represent the behavior for the first arch in the
system, which mainly represent the surface film and electronic transport on the cathode side. As
for R2 and CPE2, which are used to fit the second arch, representing the charge-transfer
resistance on the electrode [10]. A constant phase element is used to model the depressed
semicircle, which is used to get a better fit quality than a capacitor [32]. Note that the Warburg
diffusion part (the 45° straight line in Nyquist plot) is excluded for fitting in this study.

35
Figure 4-10: The fitting result for EIS at 200-cycle increment (a) type1: P1-M1, (b)type 3: P10-M1, (c) type 4: P11-M1 and (d) type 5: P25-M6.
Figure 4-10 is the fitting result for experimental measured impedance. The fitting
model shows a good agreement with the experimental data. Except type 1 at 400 and 600
cycles that did not show good fitting, and thus the equivalent model is added an extra R3 and
CPE3 to get a better fitting result. Figure 4-11 shows the total Rtot values for the fresh and aged
cells, which is calculated by adding Rohm, R1 and R2 (plus R3 for type1) together. The
resistance increased significantly after 200 cycles of ageing for type 3,4 and 5 with NMP-free
binder, with is consistent with the power fade observed in Figure 4-7. The impedance then
gradually increased until 600 cycles. Whereas for type 1, the total resistance remained nearly
constant until 600 cycles. The detailed fitting data are included in Appendix.

36
Figure 4-11: The total resistance (Rtot) value (a) type 1 (b) type 3 (c) type 4 (d) type 5.
Looking into the impedance rise for each section of resistance. As Figure 4-12, the
ohmic resistance (Rohm) and the charge transfer resistance only increase slightly when
compared to the R1 increase until 600 cycles. The tiny change of ohmic resistance at high
frequency area reflecting the stability of electrolyte solution. On the other hand, R1
significantly rise with the cycle number, indicating the passivated film continuously growing
on the cathode active material and the electronic transport in the cathode are attributed for
impedance rise for this kind of thick electrode cells. The contribution to the total resistance is
R1 > R2 > Rohm.
Figure 4-12: The impedance evolution for type 4.

37
4.2.4 C-rate and DCR test
C-rate and direct current were tested at each 200-cycle increment to characterize the cell
status. The testing result is shown in Figure 4-13. The c-rate is normalized by the C/10 discharge
capacity, and DCR is normalized with the electrode area.
Figure 4-13: The C-rate test after (a) 200 cycles (b) 400 cycles (c) 600 cycles. The DCR test (d) discharge resistance (e) charge resistance.
Poor rate performance can be found after 600 cycles. For 2C discharge rate of type 3 and
type 4, only about 30% capacity is acquired, which is only a half of type 1 with NMP-PVDF
binder. Moreover, extremely poor performance is found in type 3 and type 4 at 3C rate, which
reached cutoff voltage of 2.8V in a few minutes. This is due to the large resistance found in the
cell as in Figure 4-13(d)(e). The resistance measured from direct current for type 3 and type 4 is

38
3~4 time larger than type 1. Also, the rate of resistance rise for type 1 relatively slower than other
cell types, and this also reflecting on each incremental c-rate test. Thus, poor rate performance for
a high energy cell is related to high internal resistance for ion transport within thick electrodes.

39
Chapter 5
Conclusion
In this study, 2.5Ah and 2.2Ah NMC622/graphite pouch cells were cycled at C/3 and 1C
rate. A combination of incremental capacity analysis, resistance measurements, and impedance
spectroscopy were used to evaluate and compare each cell type. The study objective of reaching
300 cycles at C/3 rate above 80% capacity retention is achieved for 4 cell types. After C/3 cycling
for 600 cycles, capacity retention of 87.9% and 88.7% is found for cells with NMP-free binder
and NMP-PVDF binder, respectively. Cycle life of these high loading cells is expected to have
about 1200 cycles at C/3 rate. The capacity fade is suggested to be due to SEI layer growth on
the anode and the polarization of NMC cathode. On the other hand, the anode with low porosity
is found to have worse performance.
In addition, the resistance rise is found relatively large for the NMP-free based cells when
compared cells with NMP-PVDF based cells, which result in poor rate capability at higher C-rate.
This can be reflected by the worse capacity retention at 1C cycling than C/3 cycling in this study.
The significant loss in capacity at high C-rate is suggested to be the limitation of lithium ion
transport. According to the fitted impedance result of fresh and aged cells, the ohmic resistance
and charge-transfer reaction are found to have tiny change. In fact, the large impedance rise
comes from the cathode side. This is suggested to be due to the passivated film gradually grow on
cathode active material and electronic transport in the cathode.
Some drawbacks of thick electrodes and binders are considered to cause poor
performance in this study. Thick electrodes are hard to be penetrated by lithium ions and thus
lead to underutilization of active materials. Cathode with NMP-free process may have bad

40
adhesion with current collector and insufficient mechanical integrity which lead to relatively
worse performance than NMP-PVDF based cell.
While the cycling performance for three types of cathode coatings with NMP-free binder
reach the study target, further improvements need to be made regarding the large internal
resistance rise as the cycling proceeds.

41
References
[1] Cheng, X., Hao, H., Liu, Z., & Zhao, F. (2016). Reducing Greenhouse Gas Emissions by Electric Vehicles in China: The Cost-Effectiveness Analysis. SAE Technical Paper Series.
[2] Korthauer, R. (2018). Lithium-Ion Batteries: Basics and Applications. Springer-Verlag Berlin Heidelberg.
[3] MacNeil, D.D., Dahn, J.R. (2002). The Reactions of Li0.5CoO2 with Nonaqueous
Solvents at Elevated Temperatures, Journal of The Electrochemical Society 149(7), A912– A919.
[4] Wang, R., Feng, L., Yang, W., Zhang, Y., Zhang, Y., Bai, W., . . . Guan, H. (2017).
Effect of Different Binders on the Electrochemical Performance of Metal Oxide Anode for Lithium-Ion Batteries. Nanoscale Research Letters, 12(1).
[5] Lee, K.-S., Myung, S.-T., Amine, K., Yashiro, H., Sun, Y.-K. (2007). Structural and
Electrochemical Properties of Layered Li [ Ni1 − 2xCoxMnx ] O2 ( x = 0.1 - 0.3 ) Positive Electrode Materials for Li-Ion Batteries, Journal of The Electrochemical Society, 154(10), A971-A977.
[6] Li, J., Wang, L., Zhang, Q., & He, X. (2009). Synthesis and characterization of
LiNi0.6Mn0.4−xCoxO2 as cathode materials for Li-ion batteries. Journal of Power Sources,189(1), 28-33.
[7] Belharouak, I., Sun, Y., Liu, J., & Amine, K. (2003). Li(Ni1/3Co1/3Mn1/3)O2 as a
suitable cathode for high power applications. Journal of Power Sources, 123(2), 247-252. [8] Dolotko, O., Senyshyn, A., Mühlbauer, M., Nikolowski, K., & Ehrenberg, H. (2014).
Understanding structural changes in NMC Li-ion cells by in situ neutron diffraction. Journal of Power Sources,255, 197-203.
[9] Noh, H.-J., Youn, S., Yoon, C.S., Sun,Y,-K. (2013). Comparison of the structural and
electrochemical properties of layered Li[NixCoyMnz]O2 (x = 1/3, 0.5, 0.6, 0.7, 0.8 and 0.85) cathode material for lithium-ion batteries, Journal of Power Sources, 233, 121-130.
[10] Leng, Y., Ge, S., Marple, D., Yang, X., Bauer, C., Lamp, P., & Wang, C. (2017).
Electrochemical Cycle-Life Characterization of High Energy Lithium-Ion Cells with Thick Li(Ni0.6Mn0.2Co0.2)O2and Graphite Electrodes. Journal of The Electrochemical Society, 164(6), A1037-A1049.

42
[11] Zheng, H., Li, J., Song, X., Liu, G., & Battaglia, V. S. (2012). A comprehensive understanding of electrode thickness effects on the electrochemical performances of Li-ion battery cathodes. Electrochimica Acta, 71, 258-265.
[12] Singh, M., Kaiser, J., & Hahn, H. (2015). Thick Electrodes for High Energy Lithium Ion
Batteries. Journal of The Electrochemical Society, 162(7). [13] Danner, T., Singh, M., Hein, S., Kaiser, J., Hahn, H., & Latz, A. (2016). Thick electrodes
for Li-ion batteries: A model based analysis. Journal of Power Sources, 334, 191-201. [14] Du, Z., Wood, D. L., Daniel, C., Kalnaus, S., & Li, J. (2017). Understanding limiting
factors in thick electrode performance as applied to high energy density Li-ion batteries. Journal of Applied Electrochemistry, 47(3), 405-415.
[15] Lee, B., Wu, Z., Petrova, V., Xing, X., Lim, H., Liu, H., & Liu, P. (2018). Analysis of Rate-Limiting Factors in Thick Electrodes for Electric Vehicle Applications. Journal of The Electrochemical Society, 165(3).
[16] Heubner, C., Nickol, A., Seeba, J., Reuber, S., Junker, N., Wolter, M., . . . Michaelis, A.
(2019). Understanding thickness and porosity effects on the electrochemical performance of LiNi0.6Co0.2Mn0.2O2-based cathodes for high energy Li-ion batteries. Journal of Power Sources,419, 119-126.
[17] Vetter, J., Novak, P., Wagner, M., Moller, K., Besenhard, J., Winter, M., . . .
Hammouche, A. (2005). Ageing mechanisms in lithium-ion batteries. Journel of Power Sources, 147(1), 269-281.
[18] Jalkanen, K., Karppinen, J., Skogström, L., Laurila, T., Nisula, M., & Vuorilehto, K.
(2015). Cycle aging of commercial NMC/graphite pouch cells at different temperatures. Applied Energy, 154, 160-172.
[19] Lin, C., Tang, A., Mu, H., Wang, W., & Wang, C. (2015). Aging Mechanisms of
Electrode Materials in Lithium-Ion Batteries for Electric Vehicles. Journal of Chemistry, 2015, 1-11.
[20] Ning, G., White, R. E., & Popov, B. N. (2006). A generalized cycle life model of
rechargeable Li-ion batteries. Electrochimica Acta, 51(10), 2012-2022. [21] Lüders, C. V., Keil, J., Webersberger, M., & Jossen, A. (2019). Modeling of lithium
plating and lithium stripping in lithium-ion batteries. Journal of Power Sources, 414, 41-47.
[22] Zhao, X., Yin, Y., Hu, Y., & Choe, S. (2019). Electrochemical-thermal modeling of
lithium plating/stripping of Li(Ni0.6Mn0.2Co0.2)O2/Carbon lithium-ion batteries at subzero ambient temperatures. Journal of Power Sources, 418, 61-73.

43
[23] Yang, X., Leng, Y., Zhang, G., Ge, S., & Wang, C. (2017). Modeling of lithium plating induced aging of lithium-ion batteries: Transition from linear to nonlinear aging. Journal of Power Sources, 360, 28-40.
[24] Ma, X., Harlow, J. E., Li, J., Ma, L., Hall, D. S., Buteau, S., . . . Dahn, J. R. (2019).
Editors Choice—Hindering Rollover Failure of Li[Ni0.5Mn0.3Co0.2]O2/Graphite Pouch Cells during Long-Term Cycling. Journal of The Electrochemical Society, 166(4).
[25] Jung, R., Metzger, M., Maglia, F., Stinner, C., & Gasteiger, H. A. (2017). Oxygen Release and Its Effect on the Cycling Stability of LiNixMnyCozO2(NMC) Cathode Materials for Li-Ion Batteries. Journal of The Electrochemical Society, 164(7).
[26] Kim, C., Jeong, K. M., Kim, K., & Yi, C. (2015). Effects of Capacity Ratios between
Anode and Cathode on Electrochemical Properties for Lithium Polymer Batteries. Electrochimica Acta, 155, 431-436.
[27] An, S. J., Li, J., Daniel, C., Mohanty, D., Nagpure, S., & Wood, D. L. (2016). The state
of understanding of the lithium-ion-battery graphite solid electrolyte interphase (SEI) and its relationship to formation cycling. Carbon, 105, 52-76.
[28] Alavi, S., Birkl, C., & Howey, D. (2015). Time-domain fitting of battery electrochemical
impedance models. Journal of Power Sources, 288, 345-352. [29] Common Equivalent - Gamry Instruments. (n.d.). Retrieved from
https://www.gamry.com/assets/White-Papers/Gamry-Common-Equivalent-Circuit-Models.pdf
[30] Randles, J. E. (1947). Kinetics of rapid electrode reactions. Discussions of the Faraday
Society, 1, 11. [31] Kang, S., Yoon, W., Nam, K., Yang, X., & Abraham, D. P. (2008). Investigating the
first-cycle irreversibility of lithium metal oxide cathodes for Li batteries. Journal of Materials Science,43(14), 4701-4706.
[32] Cottis, R., & Turgoose, S. (1999). Electrochemical impedance and noise. Houston, TX:
NACE International. [33] Zhang, Y., & Wang, C. (2009). Cycle-Life Characterization of Automotive Lithium-Ion
Batteries with LiNiO[sub 2] Cathode. Journal of The Electrochemical Society, 156(7).

44
Appendix
Fitting Result for Experimental EIS Measurement
a) P1-M1 Fresh 200 cycles 400 cycles 600 cycles
L (H cm2) 0.000251 0.0005 7.89E-05 9.36E-05 Rohm (Ω cm2) 8.058 8.338 5.881 5.704
R1 (Ω cm2) 20.94 23.12 14.98 13.39 CPE1A1(F cm-2) 0.001245 0.003596 1.25E-05 2.02E-05
n1 0.72866 0.70853 0.79666 0.75407 R2 (Ω cm2) 8.328 11.06 10.72 11.9
CPEA2 (F cm-2) 0.000366 0.01986 0.002171 0.0019276 n2 0.68151 0.902 0.5683 0.58892
R3 (Ω cm2) 13.94 14.87 CPE3A3 (F cm-2) 0.0148 1.51E-02
n3 0.85947 0.85025 (b)
P10-M1 Fresh 200 cycles 400 cycles 600 cycles L (H cm2) 0.000347 0.000522 9.88E-05 8.51E-05
Rohm (Ω cm2) 6.92 6.822 7.351 7.589 R1 (Ω cm2) 24.73 56.68 64.76 71.65
CPE1A1(F cm-2) 2.21E-06 2.72E-06 2.00E-06 2.23E-06 n1 0.96622 0.92565 0.95669 0.94152
R2 (Ω cm2) 26.26 28.23 29.73 30.66 CPE2A2 (F cm-2) 0.00138 0.005254 0.006013 0.007817
n2 0.5689 0.49016 0.47319 0.4686 (c)
P11-M1 Fresh 200 cycles 400 cycles 600 cycles L (H cm2) 0.000299 0.000727 0.000572 0.000105
Rohm (Ω cm2) 7.288 7.533 7.412 7.636 R1 (Ω cm2) 24.5 53.31 62.23 65.18
CPE1A1(F cm-2) 2.14E-06 2.68E-06 2.65E-06 2.21E-06 n1 0.97057 0.93038 0.92594 0.94641
R2 (Ω cm2) 22.47 28.45 30.85 31.57 CPE2A2 (F cm-2) 0.001506 0.005863 0.00749 0.009993
n2 0.57779 0.48095 0.48 0.41207
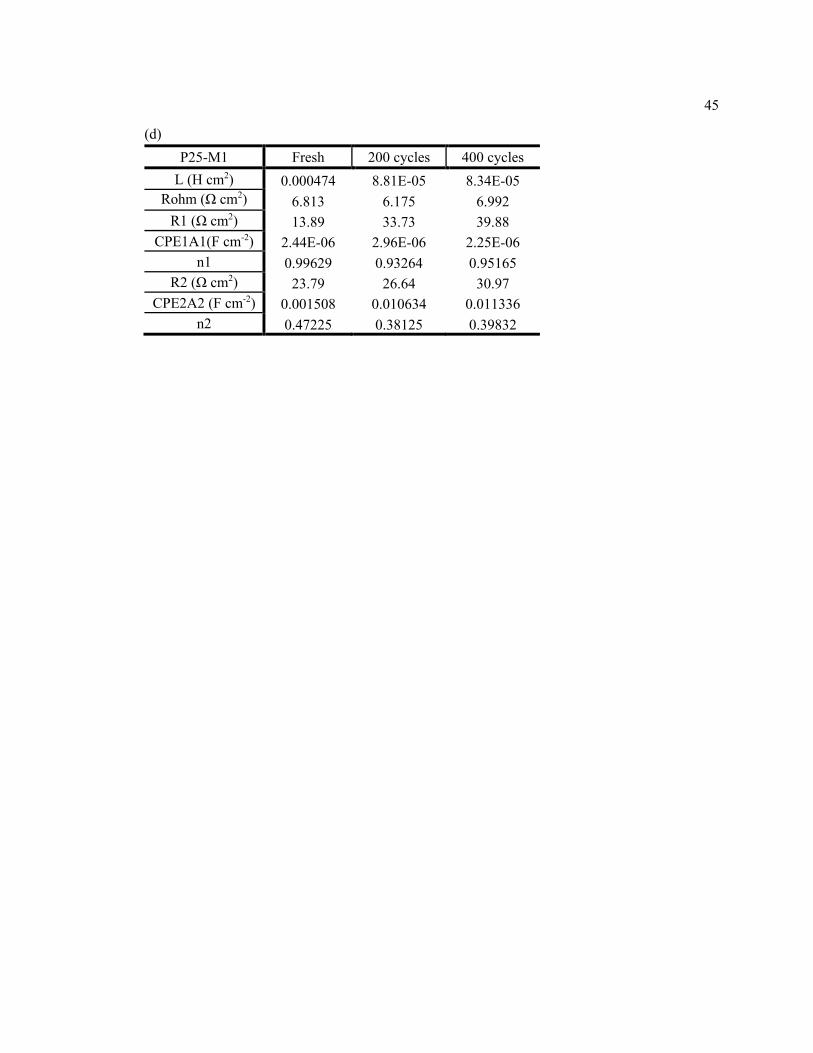
45
(d) P25-M1 Fresh 200 cycles 400 cycles
L (H cm2) 0.000474 8.81E-05 8.34E-05 Rohm (Ω cm2) 6.813 6.175 6.992
R1 (Ω cm2) 13.89 33.73 39.88 CPE1A1(F cm-2) 2.44E-06 2.96E-06 2.25E-06
n1 0.99629 0.93264 0.95165 R2 (Ω cm2) 23.79 26.64 30.97
CPE2A2 (F cm-2) 0.001508 0.010634 0.011336 n2 0.47225 0.38125 0.39832