Experimental Study of Heat Tr ansfer Mechanisms under ...
14
Experimental Study of Heat Transfer Mechanisms under Exponential Power Excursion in Plate-Type Fuel The MIT Faculty has made this article openly available. Please share how this access benefits you. Your story matters. Citation Su, G. et al. "Experimental Study of Heat Transfer Mechanisms under Exponential Power Excursion in Plate-Type Fuel." International Topical Meeting on Nuclear Reactor Thermal Hydraulics 2015 (NURETH-16), 30 August-4 September, 2015, American Nuclear Society, 2016. pp. 3111-2123. As Published http://www.proceedings.com/27758.html Publisher American Nuclear Society Version Author's final manuscript Citable link http://hdl.handle.net/1721.1/108321 Terms of Use Creative Commons Attribution-Noncommercial-Share Alike Detailed Terms http://creativecommons.org/licenses/by-nc-sa/4.0/
Transcript of Experimental Study of Heat Tr ansfer Mechanisms under ...

Experimental Study of Heat Transfer Mechanismsunder Exponential Power Excursion in Plate-Type Fuel
The MIT Faculty has made this article openly available. Please share how this access benefits you. Your story matters.
Citation Su, G. et al. "Experimental Study of Heat Transfer Mechanismsunder Exponential Power Excursion in Plate-Type Fuel."International Topical Meeting on Nuclear Reactor ThermalHydraulics 2015 (NURETH-16), 30 August-4 September, 2015,American Nuclear Society, 2016. pp. 3111-2123.
As Published http://www.proceedings.com/27758.html
Publisher American Nuclear Society
Version Author's final manuscript
Citable link http://hdl.handle.net/1721.1/108321
Terms of Use Creative Commons Attribution-Noncommercial-Share Alike
Detailed Terms http://creativecommons.org/licenses/by-nc-sa/4.0/

EXPERIMENTAL STUDY OF HEAT TRANSFER MECHANISMS UNDER
EXPONENTIAL POWER EXCURSION IN PLATE-TYPE FUEL
G. Su, M. Bucci, T.J. McKrell, J. Buongiorno
Department of Nuclear Science and Engineering
Massachusetts Institute of Technology
77 Massachusetts Avenue, 02138 Cambridge, MA, USA
[email protected], [email protected], [email protected], [email protected]
ABSTRACT
This paper presents an investigation of transient pool boiling heat transfer phenomena for water at
atmospheric pressure under rapidly escalating heat fluxes on plate-type heaters, which were used to
simulate the interface between cladding and coolant in plate-type fuel during Reactivity Initiated
Accidents (RIAs). The investigation utilized Infrared (IR) thermometry and High-Speed Video (HSV) to
gain insight into the physical phenomena and generate a database that can be used for development and
validation of accurate models of transient boiling heat transfer. The test matrix included exponential
power escalations with periods in the range from 5 to 100 milliseconds, and subcooling of 0, 25 and 75 K.
The onset of nucleate boiling (ONB), onset of significant void (OSV) and overshoot (OV) conditions
were identified. The experimental data suggest that ONB, OSV and OV temperature and heat flux
increase monotonically with decreasing period and increasing subcooling. The transient boiling curves
were measured up to the fully developed nucleate boiling (FDNB) regime.
KEYWORDS
RIA accident, Exponential Power Excursion, Heat Transfer, IR Thermometry, HSV
1. INTRODUCTION
The instantaneous extraction of a control rod from a nuclear reactor core may cause prompt criticality and
an exponential excursion of the thermal power generated within the fuel rods. The heat is transferred
from the fuel to the water coolant which then starts to boil. The heat generation rate in the fuel can be
described as q′′′(t) ∝ et τ⁄ . The period can be as short as a few milliseconds. The feedbacks caused by
the heating (Doppler in the fuel and void in the coolant) represent an important insertion of negative
reactivity. Depending on the magnitude and time scale of these feedbacks, a safe conclusion to the
accident is rapidly achieved or, in extreme cases, the fuel can melt, the molten material can be expulsed,
fragmented and possibly lead to steam explosion. Therefore, the time delay between the production of the
thermal energy within the fuel and its transfer to the coolant is key to determining the outcome of the
accident, in particular for experimental reactors using highly enriched fissile fuel, which have a very low
Doppler effect. In turn, this time delay depends on conduction heat transfer within the fuel, single-phase
convective heat transfer and eventually transient boiling heat transfer in the coolant.
Scientists have been investigating heat transfer under exponentially escalating heat fluxes since the 1950s.
Most of these investigations have been carried out in pool boiling conditions, using ribbon [1] and wire
visiting research scientist from Commissariat à l’énergie atomique et aux énergies alternative,
CEA/DEN/DANS/DM2S/STMF/LATF, 91191 Gif-sur-Yvette Cedex, France.
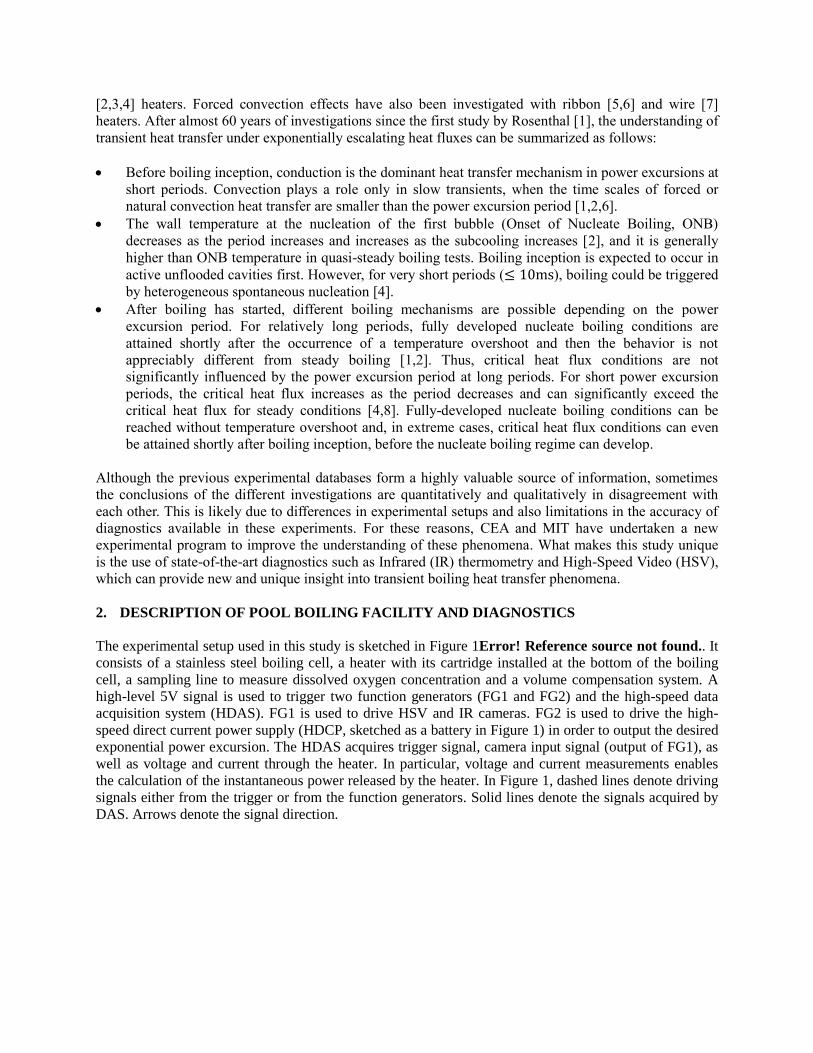
[2,3,4] heaters. Forced convection effects have also been investigated with ribbon [5,6] and wire [7]
heaters. After almost 60 years of investigations since the first study by Rosenthal [1], the understanding of
transient heat transfer under exponentially escalating heat fluxes can be summarized as follows:
Before boiling inception, conduction is the dominant heat transfer mechanism in power excursions at
short periods. Convection plays a role only in slow transients, when the time scales of forced or
natural convection heat transfer are smaller than the power excursion period [1,2,6].
The wall temperature at the nucleation of the first bubble (Onset of Nucleate Boiling, ONB)
decreases as the period increases and increases as the subcooling increases [2], and it is generally
higher than ONB temperature in quasi-steady boiling tests. Boiling inception is expected to occur in
active unflooded cavities first. However, for very short periods (≤ 10ms), boiling could be triggered
by heterogeneous spontaneous nucleation [4].
After boiling has started, different boiling mechanisms are possible depending on the power
excursion period. For relatively long periods, fully developed nucleate boiling conditions are
attained shortly after the occurrence of a temperature overshoot and then the behavior is not
appreciably different from steady boiling [1,2]. Thus, critical heat flux conditions are not
significantly influenced by the power excursion period at long periods. For short power excursion
periods, the critical heat flux increases as the period decreases and can significantly exceed the
critical heat flux for steady conditions [4,8]. Fully-developed nucleate boiling conditions can be
reached without temperature overshoot and, in extreme cases, critical heat flux conditions can even
be attained shortly after boiling inception, before the nucleate boiling regime can develop.
Although the previous experimental databases form a highly valuable source of information, sometimes
the conclusions of the different investigations are quantitatively and qualitatively in disagreement with
each other. This is likely due to differences in experimental setups and also limitations in the accuracy of
diagnostics available in these experiments. For these reasons, CEA and MIT have undertaken a new
experimental program to improve the understanding of these phenomena. What makes this study unique
is the use of state-of-the-art diagnostics such as Infrared (IR) thermometry and High-Speed Video (HSV),
which can provide new and unique insight into transient boiling heat transfer phenomena.
2. DESCRIPTION OF POOL BOILING FACILITY AND DIAGNOSTICS
The experimental setup used in this study is sketched in Figure 1Error! Reference source not found.. It
consists of a stainless steel boiling cell, a heater with its cartridge installed at the bottom of the boiling
cell, a sampling line to measure dissolved oxygen concentration and a volume compensation system. A
high-level 5V signal is used to trigger two function generators (FG1 and FG2) and the high-speed data
acquisition system (HDAS). FG1 is used to drive HSV and IR cameras. FG2 is used to drive the high-
speed direct current power supply (HDCP, sketched as a battery in Figure 1) in order to output the desired
exponential power excursion. The HDAS acquires trigger signal, camera input signal (output of FG1), as
well as voltage and current through the heater. In particular, voltage and current measurements enables
the calculation of the instantaneous power released by the heater. In Figure 1, dashed lines denote driving
signals either from the trigger or from the function generators. Solid lines denote the signals acquired by
DAS. Arrows denote the signal direction.

Figure 1. Schematic diagram of experimental setup for pool boiling tests
2.1. Boiling cell
The pool boiling cell features a concentric-double-cylinder structure made of 316L stainless steel. Boiling
of DI water takes place in the inner cell, while the outer enclosure functions as an isothermal bath. The
whole facility is surrounded by thermal insulating foam. The temperature (and thus the degree of
subcooling) of the water in the inner cell is regulated by circulating a temperature-controlled fluid through
the isothermal bath with an accuracy of ±1°C. The heater cartridge sits at the bottom of the cell and
accommodates heater samples. There are four glass windows spaced equally at 90° around the outer
surface of the boiling cell which are used for imaging the boiling phenomena on the heater surface.
2.2. Heater
Boiling was induced by a specially-designed heater (see Figure 2) installed in the boiling cell through a
graphite-macor cartridge. The heater consists of: 1) a 1 mm thick, IR quasi-transparent sapphire substrate,
2) a 0.7 μm thick, electrically conductive, IR opaque, indium tin oxide (ITO) wrapped-around coating,
and 3) 0.7 μm thick wrapped-around gold pads. The heater surface is typically nano-smooth and
hydrophilic (contact angle < 90°). However, scan electron microscope (SEM) investigations revealed the
presence of randomly distributed imperfections with typical equivalent diameter in the order of a few
microns. The desired heat flux excursion was generated by applying a transient voltage to the ITO coating
through the gold pads, using the HDCP. The heat thus generated within the ITO film (active area: 1cm ×
1cm) is partially transferred to water and partially to the sapphire substrate.

Figure 2. Heater schematic drawing (left, not to the scale), and picture (right)
2.3. Infrared (IR) camera and IR thermometry
An IRC-800 high-speed infrared camera was used to record the temperature distribution on the heater
surface, equipped with a 100mm germanium lens (f/2.3) and a 1/2” extension ring. The achieved spatial
resolution was approximately 115 microns at a frame rate of 2500 fps. An integration time of 200 μs was
used. The sensor of the IR camera captures Mid-IR (in the 3-5μm wavelength range) radiation from the
ITO heater surface, which was reflected through a gold coated mirror (see Figure 1). The gold coated
mirror’s reflectivity is more than 0.99, which ensures the purity of the IR signal after reflection. The
camera sensor detects the IR radiation intensity and outputs the signal as pixel counts. A 1D coupled
radiation-conduction model [9] was used for conversion from radiation counts to wall temperature. The
temperature distribution in the sapphire substrate and the heat flux from the ITO heater to sapphire are
also known through the solution of this coupled radiation-conduction inverse problem. Then, since the
ITO film has negligible thermal resistance and thermal capacity, the heat flux to water (see Figure 3) was
calculated as
qw′′ (t) = qtot
′′ (t) − qs′′(t) =
V(t) ∙ I(t)
Ah − qs
′′(t) (1)
Figure 3. Sketch of heat flux repartition (not to scale)
2.4. High speed video (HSV)
A Phantom 12.1 high speed video camera (Vision Research) was used for imaging the boiling process.
An AF Micro-Nikkor 200mm f/4D lens (Nikon) was deployed for “close-up” imaging of the boiling area
with a spatial resolution of 25 μm. In the present study, a sampling rate of 5,000 fps was applied with
exposure time of 90 μs. Such high spatial and temporal resolutions allowed for accurate identification of
the ONB moment. Combining HSV and IR images, the ONB moment could be identified with an
uncertainty of 100 μs (100% confidence).
2 cm

2.5. High speed direct current power supply (HDCP)
A Chroma 62050P-100-100 HDCP was applied to generate the required exponentially escalating power.
The maximum output power of the HDCP is 5kW, with maximum current and voltage of 100A and 100V
respectively. The nominal maximum voltage slew rate is 10V/ms, while the current slew rate follows the
voltage variation with respect to the electrical resistance. These high power and high slew rate features
enabled exponential heat flux excursions with periods as small as 5ms, with a precision of ± 0.1 ms.
2.6. High speed data acquisition system (HDAS)
An Agilent U2542A USB modular high speed data acquisition system (HDAS) was deployed. A shunt
was used for the conversion from the heater current to voltage (50mV/30A) with a manufacturer-specified
accuracy of 0.25%. A voltage separator was applied to reduce the voltage of the heater (up to 100V) to
the range of HDAS input (0-10V). In the present study, a sampling rate of 50 kHz (50 samples/ms) for
each channel was used. The measuring accuracy for the heater voltage and current were 0.15 mV and 11.4
mA, respectively.
2.7. Dissolved oxygen (DO) control and measurement
To quantify the presence of non-condensable gases and minimize their effect on the onset of nucleate
boiling, a system to sample water and measure the dissolved oxygen (DO) concentration was installed on
the lid of the boiling cell. A volume compensation system was also deployed to limit the contact between
water in the boiling cell and air from the environment and adjust volume changes maintaining the ambient
pressure in the boiling cell. To reduce the concentration of non-condensable gas, the DI water used in
these experiments was vigorously boiled outside and inside the boiling cell. Steady boiling on the test
surface was also carried out to eliminate non-condensable gases trapped inside surface cavities. The DO
concentration of the water sample was monitored with an Extech 407510 DO meter before and after each
series of experiments. The DO concentration measured at the operating temperatures was always steady
(typically between 2.1 and 2.5 ppm) and much lower than saturation value (typically around 8.6 ppm at
ambient conditions). Combining Young-Laplace equation and Henry’s law, we estimated that, for a DO
concentration of 2.5 ppm and cavity diameter of 5 microns, the temperature decrease at ONB would be
approximately 0.35 °C with respect to fully degased water, with a sensitivity of 0.13 °C/ppm.
3. ANALYSIS OF EXPERIMENTAL RESULTS
Transient pool boiling tests were conducted at atmospheric pressure. Various periods were tested: 5, 10,
20, 50, 70 and 100 ms. The effect of subcooling was also investigated by running tests at saturation
condition (0K), low subcooling (25K) and very high subcooling (75K). Each test condition was run three
to five times to check the repeatability of the measurements. All these tests were run with the same heater
in order to reduce the uncertainty associated with the distribution and the size of cavities available on the
boiling surface (ITO coating).
3.1. Boiling curves
Two types of boiling curves were observed: boiling curves with temperature overshoot and without
temperature overshoot.
Overshoot is experienced at high subcooling (75K) or, for relatively long periods (≥20 ms), at low
subcooling (25K) and saturation conditions. A typical boiling curve with temperature overshoot (75K
subcooling, 10 ms period) is shown in Figure 4 (left). Before ONB, the boiling curve closely follows the
single-phase transient conduction curve discussed in Section 3.2. Then, shortly after ONB, due to the

nucleation of several bubbles, the boiling curve starts to deviate from the transient conduction curve. The
power transferred to water increases and the power transferred to sapphire decreases, whereas wall
superheat does not show any significant increase. The combination of heat flux to water and wall
superheat results in an inflection of the boiling curve, which corresponds to the observed Onset of
Significant Void (OSV). After OSV, boiling becomes more and more vigorous. The heat flux to water
increases sharply while the heat flux to substrate decreases. Due to boiling, the heating surface now cools
down. Such conjugate heat transfer process among water, substrate and heating source results in a wall
temperature drop, called overshoot (OV). After OV, the wall superheat keeps decreasing and eventually
boiling is impaired. Then, when the exponential increase of the power input catches up with the power
dissipated to water, the heat fluxes to water and to substrate reach a new balance and the boiling curve
progresses towards fully developed nucleate boiling (FDNB) conditions.
A typical boiling curve without temperature overshoot is shown in Figure 4 (right). This type of boiling
curve is usually experienced for small power excursion periods (≤10 ms) at saturation conditions or low
subcooling (25K). Before OSV, the heat transfer regimes are basically the same as for the case with
overshoot. However, due to the low subcooling, the cooling effect associated with boiling is reduced.
Wall superheat increases monotonically in these conditions, which means that the power input is
increasing sufficiently fast to sustain vigorous boiling.
Figure 4. Typical boiling curve with overshoot (left) and without overshoot (right)
3.2. Single phase transient heat transfer
Figure 5. Sketch of the heater configuration (not to scale)
In single phase heat transfer, due to the large aspect ratio between lateral scales (1cm x 1cm) and
thickness (1 mm) of the heating area, the system can be modeled as one-dimensional conduction heat
transfer problem (see Figure 5). The ITO layer (labelled heater) is very thin (700 nm) and both its
thermal resistance and its thermal capacity are negligible. Therefore, the ITO can be modeled as a planar
surface energy source given by q0′′et/τ. The thermal resistance between the substrate and air is very high
compared to conduction heat transfer in the substrate and thus the air/substrate interface can be assumed
adiabatic. The equations governing the system, together with the appropriate initial and boundary
conditions are:
∂Ts
∂t= as
∂2Ts
∂xs2 (2)
∂Tw
∂t= aw
∂2Tw
∂xw2
(3)
ks
∂Ts
∂xs|
xs=Ls
− kw
∂Tw
∂xw|
xw=0
= q0′′et/τ ∀ t ≥ 0 (4)
Ts|xs=Ls= Tw|xw=0 ∀ t ≥ 0 (5)
−ks
∂Ts
∂xs|
xs=0
= 0 ∀ t ≥ 0 (6)
Tw|xw=∞ = T0 ∀ t ≥ 0 (7)
Ts|t=0 = Tw|t=0 = T0 ∀ xs, xw (8)
The asymptotic solution of the conduction problem [9] can be obtained with the Laplace transform
method. In particular, it can be shown that the heat flux to water is
qw′′ (t) = q0
′′et/τ ℰw [ℰstanh 1
√Fos
+ ℰw]⁄ (9)
and the asymptotic temperature rise, for t ≫ τ (in general 3τ is large enough) is
ΔTh (t) = Th(t) − T0 = q0′′et/τ [
ℰs
√𝜏tanh
1
√Fos
+ℰw
√𝜏]⁄ (10)
The resulting asymptotic heat transfer coefficient is
hw =qw
′′ (t)
ΔTh (t)=
ℰw
√𝜏 (11)
which only depends on the water properties and power excursion period.
A comparison between measured and analytic temperature rise for highly subcooled tests is shown in
Figure 6 (left) as a function of time normalized by the power excursion period. Figure 6 (right) shows a
comparison between measured and calculated heat transfer coefficients. The near-perfect agreement
between data and theoretical trends confirms the quality of experimental data and the validity of the
analytic solution.
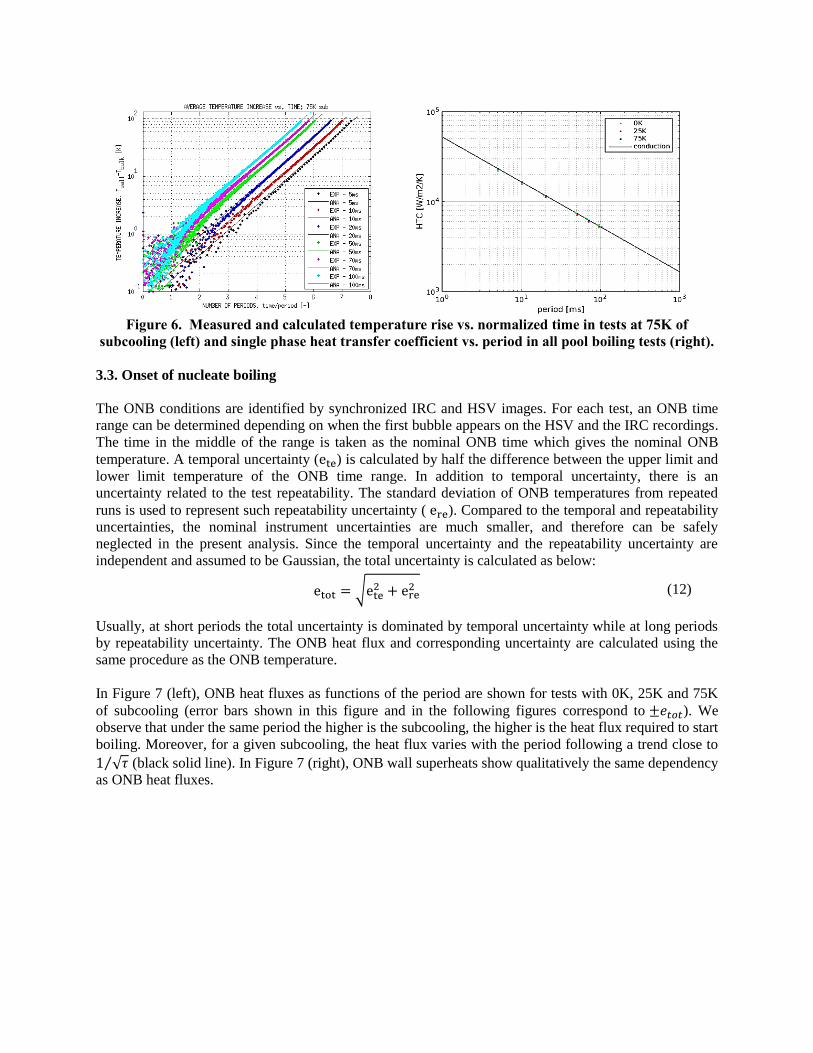
Figure 6. Measured and calculated temperature rise vs. normalized time in tests at 75K of
subcooling (left) and single phase heat transfer coefficient vs. period in all pool boiling tests (right).
3.3. Onset of nucleate boiling
The ONB conditions are identified by synchronized IRC and HSV images. For each test, an ONB time
range can be determined depending on when the first bubble appears on the HSV and the IRC recordings.
The time in the middle of the range is taken as the nominal ONB time which gives the nominal ONB
temperature. A temporal uncertainty (ete) is calculated by half the difference between the upper limit and
lower limit temperature of the ONB time range. In addition to temporal uncertainty, there is an
uncertainty related to the test repeatability. The standard deviation of ONB temperatures from repeated
runs is used to represent such repeatability uncertainty ( ere). Compared to the temporal and repeatability
uncertainties, the nominal instrument uncertainties are much smaller, and therefore can be safely
neglected in the present analysis. Since the temporal uncertainty and the repeatability uncertainty are
independent and assumed to be Gaussian, the total uncertainty is calculated as below:
etot = √ete2 + ere
2 (12)
Usually, at short periods the total uncertainty is dominated by temporal uncertainty while at long periods
by repeatability uncertainty. The ONB heat flux and corresponding uncertainty are calculated using the
same procedure as the ONB temperature.
In Figure 7 (left), ONB heat fluxes as functions of the period are shown for tests with 0K, 25K and 75K
of subcooling (error bars shown in this figure and in the following figures correspond to ±𝑒𝑡𝑜𝑡). We
observe that under the same period the higher is the subcooling, the higher is the heat flux required to start
boiling. Moreover, for a given subcooling, the heat flux varies with the period following a trend close to
1 √𝜏⁄ (black solid line). In Figure 7 (right), ONB wall superheats show qualitatively the same dependency
as ONB heat fluxes.

Figure 7. ONB heat flux (left) and wall superheat (right) versus power excursion periods
at different subcoolings
A mechanistic ONB model was derived from the combination of Hsu’s criterion [10] and the analytical
transient conduction solution [9] summarized in Section 3.2. Hsu’s criterion is based on a developing
thermal boundary layer model. It states that the bubble can grow out of the nucleation site if the saturation
temperature corresponding to the internal pressure of the vapor embryo is reached or exceeded all over its
surface. Since our surface is hydrophilic (i.e. contact angle <90), the internal pressure of the vapor
embryo at the cavity mouth can be expressed as
pv − pl =2σ
rc (13)
where we neglected the effect of non-condensable gases and 𝑟𝑐 is the radius of the cavity. By combining
Eq. 13 with the transient conduction analytic solution, the mechanistic ONB model is given by:
qw,onb′′ =
εw
√τ[Tsat(patm + 2σ/rc) − Tbulk] exp (
rc
√awτ) (14)
ΔTsat, onb = [Tsat(patm + 2σ/rc) − Tbulk] exp (rc
√awτ) − ΔTsub (15)
Application of the ONB model requires knowledge of the radius (or the distribution of radii) of the micro-
cavities (nucleation sites) on the heating surface. In our case the coordinates of the ONB nucleation site
were first identified from the IRC image. Then, the heater was examined with the SEM, making it
possible to identify the cavity that served as nucleation site at ONB. The size of the imperfection is
approximately 5 microns which corresponds to 𝑟𝑐 ≅ 2.5 𝜇𝑚. Using this value in the ONB model, the
ONB heat flux and wall superheat could be predicted and plotted in Figure 7 (solid colored lines). As
shown, the ONB model captures the trend of experimental results well.
3.4. Onset of significant void
OSV marks the start of significant negative reactivity feedback during RIAs. As introduced in Section
3.1, the inflection of the boiling curve from the transient conduction asymptote is the signature of OSV.
In addition, OSV is associated to a sharp decrease of the heat flux transferred to the sapphire substrate due
to boiling.
OSV heat fluxes and temperatures are plotted in Figures 8. Although the trends for OSV and ONB are
very similar, the values of heat flux and wall superheat for OSV are higher than the ones for ONB, as

expected. In fact, on a heater with a distribution of cavity sizes, the ONB bubbles are always generated on
the biggest unflooded cavities which require the lowest heat flux and wall superheat according to Eq. 14
and Eq. 15. However, higher heat flux and wall superheat are required to trigger nucleation of the
remaining smaller cavities which contribute to OSV.
Figure 8. OSV heat flux (left) and wall superheat (right) versus power excursion periods
at different subcoolings
3.5. Wall temperature overshoot
As discussed in Section 3.1, the occurrence of OV is determined by a conjugate heat transfer process that
involves water, substrate and heating source (ITO). OV wall superheats (if OV is present) are obtained
from the first temperature peak after OSV on the boiling curve. The results are plotted in Figure 9 as a
function of the period for tests with 0K, 25K and 75K of subcooling.
Figure 9. OV wall superheat versus power periods at different subcoolings
There is usually no temperature overshoot at short periods and small subcoolings, as emphasized by the
absence of data for 0K and 25K and low periods in Fig. 9. The variation trend for the OV wall superheat
is also similar to ONB wall superheat. For a given subcooling, the OV wall superheat increases with
decreasing power excursion periods. For a given power excursion period, the OV wall superheat increases
with increasing subcooling.

4. CONCLUSIONS AND FUTURE WORKS
In this work we performed an experimental investigation of pool boiling heat transfer under exponential
power escalations, at various degrees of subcooling (0, 25, 75 K) and different power excursion periods,
from 5 to 100 ms. This study is relevant to understanding heat transfer mechanisms in nuclear reactor fuel
during reactivity initiated accidents.The uniqueness of the data presented here stems from the use of
synchronized IR thermometry and high-speed video, which allowed clear identification and quantification
of the main features of the transient boiling curve.
The main findings of the study are as follows:
- The measured single phase heat transfer coefficient, before boiling inception, is inversely
proportional to the square root of the period. Moreover, the heat flux to water, the wall
temperature rise and the heat transfer coefficient can be predicted by analytic expressions
developed from the solution of the transient conduction problem.
- The onset of nucleate boiling was observed on the largest unflooded active cavity available on the
heater surface. ONB heat flux and superheat increases as the period decrease, and can be
predicted by a combination of the analytic transient conduction temperature profile in water and
the Hsu’s nucleation criterion.
- Measured OSV heat flux and superheat follow the same trend as ONB heat flux and superheat.
However, OSV occurs when a significant number of cavities are activated, which requires higher
superheat and heat flux compared to ONB. We may expect that OSV changes according to the
size and the distribution of active cavities available on the boiling surface.
- The transition from OSV to fully developed nucleate boiling depends on power excursion period
and subcooling. It also involves a conjugated heat transfer process between substrate and water.
In particular, we observed the presence of temperature overshoot for highly subcooled tests (75K)
or, for relatively long periods (≥20 ms), at low subcooling (25K) and saturation conditions. No
temperature overshoot was observed for short periods at low subcooling or saturation conditions.
Further efforts are required to fully understand these mechanisms and predict how and how fast
the transition from OSV to FDNB occurs in plate-type heater or in actual nuclear reactor fuel.
- In all the investigated scenarios, fully developed nucleate boiling was achieved after OSV, and no
direct transition to critical heat flux was observed.
Follow-up investigations may include the study of critical heat flux and forced convection effects under
the same exponential power escalation scenarios.
NOMENCLATURE
Latin letters Greek letters
A Thermal diffusivity [m2 s]⁄ α 1/τ [1 s]⁄
A Area [m2] ℰ Thermal effusivity [W√s m2K]⁄
Cp Specific heat [J kgK]⁄ ρ Density [kg m3]⁄
e Uncertainty [K or W m2⁄ ] 𝜎 Surface tension [N/m]
ΔT Temperature difference [K] τ Period of the exponential excursion [s] Fo Fourier number (= aτ/L2) [−]
h Heat transfer coefficient [W m2K]⁄
k Thermal conductivity [W mK]⁄
L Thickness [m]
p Pressure [Pa]
q′′ Heat flux [W m2]⁄
q′′′ Energy source [W m3]⁄
r Radius [m]
t Time [s]
T Temperature [K]
x Spatial coordinate [m]
Subscripts 0 Initial
atm Atmosphere
bulk Bulk
c Cavity
h Heater (ITO)
l Liquid
onb Onset of nucleate boiling
re Repeatability
s Substrate
sat Superheat
sub Subcooling
tot Total
te Temporal
v Vapor
w Water
ACKNOWLEDGMENTS
Ms. Carolyn P. Coyle and Dr. Reza Azizian are warmly acknowledged for their support in using the
focused ions beam and the scan electron microscope. This research project was sponsored by CEA
through contract 021439-001.
REFERENCES
1. M.W. Rosenthal, “An Experimental Study of Transient Boiling,” Nuclear Science and Engineering, 2,
pp.640-656 (1957).
2. A. Sakurai, M. Shiotsu, “Transient Pool Boiling Heat Transfer. Part 1: Incipient Boiling Superheat,”
Journal of Heat Transfer, 99, pp.547-553 (1977).
3. A. Sakurai, M. Shiotsu, “Transient Pool Boiling Heat Transfer. Part 2: Boiling Heat Transfer and
Burnout,” Journal of Heat Transfer, 99, pp.554-560 (1977).

4. A. Sakurai, “Mechanism of Transition to Film Boiling at CHF in subcooled and Pressurized Liquids
due to Steady and Increasing Heat Inputs,” Nuclear Engineering and Design, 197, pp.301-356 (2000).
5. M. Soliman, H. A. Johnson, “Transient Heat Transfer for Forced Convection over a Flat Plate of
Appreciable Thermal Capacity and Containing an Exponential Time-Dependent Heat Source,”
International Journal of Heat and Mass Transfer, 11, pp.27-38 (1968).
6. H.A. Johnson, “Transient Boiling Heat Transfer to Water,” International Journal of Heat and Mass
Transfer, 14, pp.67-82 (1971).
7. I. Kataoka, A. Serizawa, A. Sakurai, “Transient Boiling Heat Transfer under Forced Convection,”
International Journal of Heat and Mass Transfer, 26, pp.583-595 (1983).
8. W.B. Hall, W.C. Harrison, “Transient Boiling of Water at Atmospheric Pressure,” International Heat
Transfer Conference, Instit. Mech. Eng., Chicago, Illinois, (1966).
9. L.Sargentini, M.Bucci, G.Su, J.Buongiorno, T.J.Mckrell, “Experimental and analytical study of
exponential power excursion in plate-type fuel”. International Topical Meeting on Advances in
Thermal Hydraulics - 2014 (ATH '14), Reno, Nevada, June 15–19, 2014, Reno, NV.
10. Y. Y. Hsu, “On the Size Range of Active Nucleation Cavities on a Heating Surface,” Journal of Heat
Transfer, 14, pp.67-82 (1971).