
Experimental investigation of the solubility of albite and jadeite
16
Experimental investigation of the solubility of albite and jadeite in H 2 O, with paragonite + quartz at 500 and 600 °C, and 1–2.25 GPa Anke Wohlers a,b,⇑ , Craig E. Manning b , Alan B. Thompson a a Institute of Geochemistry and Petrology, ETH Zurich, 8092 Zurich, Switzerland b Department of Earth and Space Sciences, University of California, Los Angeles, CA 90095-1567, USA Received 1 September 2010; accepted in revised form 21 February 2011; available online 2 March 2011 Abstract The solubilities of the assemblages albite + paragonite + quartz and jadeite + paragonite + quartz in H 2 O were deter- mined at 500 and 600 °C, 1.0–2.25 GPa, using hydrothermal piston-cylinder methods. The three minerals are isobarically and isothermally invariant in the presence of H 2 O, so fluid composition is uniquely determined at each pressure and temper- ature. A phase-bracketing approach was used to achieve accurate solubility determinations. Albite + quartz and jade- ite + quartz dissolve incongruently in H 2 O, yielding residual paragonite which could not be retrieved and weighed. Solution composition fixed by the three-mineral assemblage at a given pressure and temperature was therefore bracketed by adding NaSi 3 O 6.5 glass in successive experiments, until no paragonite was observed in run products. Solubilities derived from experiments bounding the appearance of paragonite thus constrain the equilibrium fluid composition. Results indicate that, at a given pressure, Na, Al, and Si concentrations are higher at 600 °C than at 500 °C. At both 500 and 600 °C, solu- bilities of all three elements increase with pressure in the albite stability field, to a maximum at the jadeite–albite–quartz equi- librium. In the jadeite stability field, element concentrations decline with continued pressure increase. At the solubility maximum, Na, Al, and Si concentrations are, respectively, 0.16, 0.05, and 0.48 molal at 500 °C, and 0.45, 0.27, and 1.56 molal at 600 °C. Bulk solubilities are 3.3 and 10.3 wt% oxides, respectively. Observed element concentrations are everywhere greater than those predicted from extrapolated thermodynamic data for simple ions, monomers, ion pairs, and the silica dimer. The measurements therefore require the presence of additional, polymerized Na–Al–Si-bearing species in the solutions. The excess solubility is >50% at all conditions, indicating that polymeric structures are the predominant solutes in the P–T region studied. The solubility patterns likely arise from combination of the large solid volume change associated with the albite– jadeite–quartz equilibrium and the rise in Na–Al–Si polymerization with approach to the hydrothermal melting curves of albite + quartz and jadeite + quartz. Our results indicate that polymerization of Na–Al–Si solutes is a fundamental aspect of fluid–rock interaction at high pressure. In addition, the data suggest that high-pressure metamorphic isograds can impose unexpected controls on metasomatic mass transfer, that significant metasomatic mass transfer prior to melting should be considered in migmatitic terranes, and that polymeric complexes may be an important transport agent in subduction zones. Ó 2011 Elsevier Ltd. All rights reserved. 1. INTRODUCTION Aqueous fluids are responsible for substantial mass transfer in high pressure (P) and temperature (T) environ- ments. For example, lithologies transported to deep-crustal conditions along Barrovian P–T paths show evidence for 0016-7037/$ - see front matter Ó 2011 Elsevier Ltd. All rights reserved. doi:10.1016/j.gca.2011.02.028 ⇑ Corresponding author. Present address: German Research Centre for Geosciences (GFZ), Institute of Chemistry and Physics of Earth Materials, 14473 Potsdam, Germany. Tel.: +49 331 288 1828; fax: +49 331 288 1402. E-mail address: [email protected] (A. Wohlers). www.elsevier.com/locate/gca Available online at www.sciencedirect.com Geochimica et Cosmochimica Acta 75 (2011) 2924–2939
Transcript of Experimental investigation of the solubility of albite and jadeite

Experimental investigation of the solubility of albite and jadeitein H2O, with paragonite + quartz at 500 and 600 !C,
and 1–2.25 GPa
Anke Wohlers a,b,⇑, Craig E. Manning b, Alan B. Thompson a
a Institute of Geochemistry and Petrology, ETH Zurich, 8092 Zurich, SwitzerlandbDepartment of Earth and Space Sciences, University of California, Los Angeles, CA 90095-1567, USA
Received 1 September 2010; accepted in revised form 21 February 2011; available online 2 March 2011
Abstract
The solubilities of the assemblages albite + paragonite + quartz and jadeite + paragonite + quartz in H2O were deter-mined at 500 and 600 !C, 1.0–2.25 GPa, using hydrothermal piston-cylinder methods. The three minerals are isobaricallyand isothermally invariant in the presence of H2O, so fluid composition is uniquely determined at each pressure and temper-ature. A phase-bracketing approach was used to achieve accurate solubility determinations. Albite + quartz and jade-ite + quartz dissolve incongruently in H2O, yielding residual paragonite which could not be retrieved and weighed.Solution composition fixed by the three-mineral assemblage at a given pressure and temperature was therefore bracketedby adding NaSi3O6.5 glass in successive experiments, until no paragonite was observed in run products. Solubilities derivedfrom experiments bounding the appearance of paragonite thus constrain the equilibrium fluid composition. Results indicatethat, at a given pressure, Na, Al, and Si concentrations are higher at 600 !C than at 500 !C. At both 500 and 600 !C, solu-bilities of all three elements increase with pressure in the albite stability field, to a maximum at the jadeite–albite–quartz equi-librium. In the jadeite stability field, element concentrations decline with continued pressure increase. At the solubilitymaximum, Na, Al, and Si concentrations are, respectively, 0.16, 0.05, and 0.48 molal at 500 !C, and 0.45, 0.27, and 1.56 molalat 600 !C. Bulk solubilities are 3.3 and 10.3 wt% oxides, respectively. Observed element concentrations are everywhere greaterthan those predicted from extrapolated thermodynamic data for simple ions, monomers, ion pairs, and the silica dimer. Themeasurements therefore require the presence of additional, polymerized Na–Al–Si-bearing species in the solutions. The excesssolubility is >50% at all conditions, indicating that polymeric structures are the predominant solutes in the P–T regionstudied. The solubility patterns likely arise from combination of the large solid volume change associated with the albite–jadeite–quartz equilibrium and the rise in Na–Al–Si polymerization with approach to the hydrothermal melting curves ofalbite + quartz and jadeite + quartz. Our results indicate that polymerization of Na–Al–Si solutes is a fundamental aspectof fluid–rock interaction at high pressure. In addition, the data suggest that high-pressure metamorphic isograds can imposeunexpected controls on metasomatic mass transfer, that significant metasomatic mass transfer prior to melting should beconsidered in migmatitic terranes, and that polymeric complexes may be an important transport agent in subductionzones." 2011 Elsevier Ltd. All rights reserved.
1. INTRODUCTION
Aqueous fluids are responsible for substantial masstransfer in high pressure (P) and temperature (T) environ-ments. For example, lithologies transported to deep-crustalconditions along Barrovian P–T paths show evidence for
0016-7037/$ - see front matter " 2011 Elsevier Ltd. All rights reserved.doi:10.1016/j.gca.2011.02.028
⇑ Corresponding author. Present address: German ResearchCentre for Geosciences (GFZ), Institute of Chemistry and Physicsof Earth Materials, 14473 Potsdam, Germany. Tel.: +49 331 2881828; fax: +49 331 288 1402.
E-mail address: [email protected] (A. Wohlers).
www.elsevier.com/locate/gca
Available online at www.sciencedirect.com
Geochimica et Cosmochimica Acta 75 (2011) 2924–2939

significant compositional modification by metamorphic flu-ids (e.g., Ague, 1994a,b, 1995, 1997, 2003). Similarly, insubduction zones, slab devolatilization generates a fluidphase that is capable of major metasomatic activity (e.g.,Manning, 2004).
Despite the important role that such fluids play in lowercrustal and upper mantle processes, there are relatively fewexperimental determinations of their compositions at rele-vant P and T. Of particular importance is the determinationof the solubility of key assemblages of rock-forming silicateminerals. However, experimental studies conducted on sili-cates in H2O above 0.5 GPa chiefly focus on the solubilityof a single mineral, such as quartz (Anderson and Burn-ham, 1965; Manning, 1994; Zotov and Keppler, 2000,2002; Wang et al., 2004), albite (Anderson and Burnham,1983; Stalder et al., 2000), zircon (Ayers and Watson,1991; Newton et al., 2005, 2010), or Ca and Ca–Al silicates(Fockenberg et al., 2006, 2008; Newton and Manning,2006, 2007). Notable exceptions targeted mantle bulk com-positions or are reconnaissance in nature (Ryabchikov andBoettcher, 1980; Ryabchikov et al., 1982; Ryabchikov andMacKenzie, 1985; Schneider and Eggler, 1986; Zhang andFrantz, 2000; Newton and Manning, 2002). While suchstudies provide essential information, they offer limited in-sight into key solution properties like ionic strength, pH,and total dissolved solids in H2O multiply saturated withcrustal silicate minerals.
We experimentally determined the compositions of flu-ids in equilibrium with the assemblagesalbite + quartz + paragonite and jadeite + quartz + parag-onite in H2O, at 500 and 600 !C, 1.0–2.25 GPa. The twoassemblages uniquely fix fluid composition, pH, ionicstrength, and speciation at a given P and T in the systemNa2O–Al2O3–SiO2–H2O. These assemblages represent auseful model chemical system for the investigation offluid–rock interaction involving granitic and pelitic mineralassemblages during high-P metamorphism. Moreover,combination of results on the two assemblages yields novelinsights into solubility patterns near important reactions,including albite–jadeite–quartz equilibrium and hydrousmelting of model crustal compositions.
2. METHODS
Minerals used as starting materials were natural, singlecrystals. We utilized low albite from Amelia Courthouse,jadeite from New Idria, California (Coleman, 1961), andhigh-purity Brazilian quartz (Manning, 1994). Electronmicroprobe analyses on 8 albite and 11 jadeite grains indi-cate the purity of both albite (<0.2 wt% CaO, <0.7 wt%K2O, and <0.03 wt% FeO, MgO, TiO2, Cr2O3, MnO) andjadeite (<0.3 wt% CaO, <0.6 wt% K2O and <0.1 wt%FeO). In preparation for loading, single crystals weresmoothed with sandpaper, cleaned in an ultrasonic bath,and dried at 300 !C. These measures helped ensure themechanical integrity of each grain during an experiment.In addition to crystals, a quantity of NaSi3O6.5 glass(NS3) was added to most experiments. Glasses were pre-pared by first homogenizing a mixture of reagent-grade so-dium carbonate and powdered Brazilian quartz by grinding
in a mortar, and then pressing the mixture into a pellet. Thepellet was decarbonated by slowly heating from 700 to900 !C for 2 h, and then disaggregated and rehomogenizedwith a mortar and pestle. The powder was then melted at1200 !C for 30 min and rapidly quenched to a crystal-freeglass. This glass was added to experimental charges as smallchips of a desired mass. Because the glass can be assumed todissolve quickly and completely, this material proved usefulfor bringing the Na and Si concentration of the fluid closerto final values, which in turn limits mass loss from startingcrystals, making them easier to manipulate and weigh afteran experiment.
Experiments employed a double-capsule technique. Asingle albite or jadeite crystal, !1 mm in the longest dimen-sion and 2–5 mg in mass, was loaded into an inner Pt cap-sule of 1.5 mm outer diameter, which was then crimped atthe ends to hold the crystal, and punctured with a needleto permit fluid circulation. This method allowed determina-tion of the albite or jadeite weight loss by weighing the in-ner capsule before and after an experiment. The innercapsule was loaded into 1.8 cm long, 3.5 mm OD, 0.2 mmwall-thickness Pt capsule, along with a weighed quartz crys-tal, a quantity of NaSi3O6.5 glass, and 30–42 mg of ultra-pure H2O. The outer capsule was then crimped andsealed by arc welding. Welded seams of each capsule werecarefully inspected for holes using a binocular microscope,and held at 110 !C for at least 2 h to check for leakage.
All experiments were conducted with a 2.54 cm diameterend-loaded piston-cylinder apparatus, with sodium chloridepressure medium and graphite furnaces (Manning andBoettcher, 1994). A flattened and folded capsule was placedtransversely in a furnace, packed in NaCl, and covered witha 0.1 mm thick Pt foil to help prevent puncture by the ther-mocouple. At initiation of an experiment, pressure was in-creased to 0.8 GPa, followed by heating to 150 !C toprevent H2O freezing. Then pressure and temperature wereincreased together to desired run conditions. Temperaturewas maintained to within ±1 !C using Pt–Pt90Rh10 thermo-couples accurate to within ±3 !C. No corrections weremade for the effect of pressure on emf. Pressure was mea-sured with a Heise bourdon-tube gauge, considered accu-rate to ±300 bars. At termination, experiments werequenched to <50 !C in <1 min, then extracted from the fur-nace, weighed, pierced with a needle and dried for 20 min at110 !C to determine the H2O content by weight loss of thecapsule. Run products were removed from the capsules,cleaned and weighed.
The method for solubility determination differed fromthat of Manning et al. (2010), where fluid compositionwas established either by analysis of quench fluid or by aweight-loss mass-balance method, in which albite wasweighed before and after removal of the paragonite coating.The latter approach required a correction for quench sol-utes. At the high solubilities of the present study, theweight-loss approach would nominally be appropriate,but albite and jadeite proved to be highly friable, and newlygrown paragonite often sifted off of the starting-crystal sur-face prior to weighing. Thus, although an inner capsuleweight change corresponding to the extent of the reactionalbite or jadeite + H2O ! paragonite + solutes could be
Solubility of albite and jadeite at high P and T 2925

determined, the individual masses of albite, jadeite and par-agonite could not.
Solubilities were instead determined by a bracketingmethod. The mass of NS3 was varied in successive experi-ments at a given P and T to constrain paragonite satura-tion. The composition of the fluid coexisting with albite/jadeite + paragonite + quartz is bracketed between the par-agonite-bearing run with the least NS3, and the paragonite-free run with the most NS3. Weight changes of quartz andthe inner capsule in paragonite-free runs directly determineminimum Al solubility and maximum Na, Si, and bulk sol-ubility. In contrast, in paragonite-bearing experiments, theinner capsule and quartz weight changes combined with theNS3 glass weight constrain the maximum Al concentrationand the minimum bulk, Na and Si solubilities. All solubilitycalculations employed the H2O mass determined beforeeach experiment. Checks on the H2O after an experimentgave slightly lower weights, consistent with minor uptakeby paragonite. Moreover, H2O loss to paragonite tends tozero where the mineral saturates because its mass by defini-tion becomes infinitesimally small.
Weights of inner-capsules, glass and crystals were deter-mined on a Mettler UMX2 ultra-microbalance, with a pre-cision of 0.2 lg (1r). H2O was weighed on a Mettler M3microbalance (1r = 2 lg). Crystals were studied by opticaland scanning-electron microscopy. In addition, selectedparagonite grains were analyzed by electron microprobe.
3. RESULTS
Results are given in Table 1. All NS3 glass dissolvedcompletely. Quench material on residual crystals was negli-gible. In the presence of quartz, albite and jadeite dissolvedincongruently in H2O to paragonite + solutes (Fig. 1A andB), unless sufficient NS3 glass had been added to suppressthe mica. Paragonite, confirmed by electron microprobeanalysis, grew as 610 lm, euhedral hexagonal platelets onalbite and jadeite surfaces (Fig. 1C and D). Paragonitewas found only in the inner capsule, confirming that itwas not a quench product in the experiments in which itgrew, but rather a stable product of reaction consistent withits stability field (e.g., Chatterjee, 1972). In experiments inwhich sufficient NS3 glass was added to suppress parago-nite growth, the albite or jadeite crystal surfaces were cleanand exhibited textural features consistent with strong disso-lution, such as pits and grooves (Fig. 1E and F). Quartzcrystals became faceted during partial dissolution. No signof melting was observed, consistent with the results ofBoettcher and Wyllie (1969), who found hydrothermalmelting of albite + quartz and jadeite + quartz at !650–700 !C at the pressures of our study.
Experiment durations were 42–144 h at 500 !C, and 12–45 h at 600 !C. Results at 500 !C, 1 GPa, are consistentwith Manning et al. (2010) (see below). This and the ab-sence of any time-dependent inconsistency in the data set(Table 1) support the assumption of attainment ofequilibrium.
Errors were propagated from weighing uncertainties.Maximum values of 2r, as a percentage of an individualdetermination, are 0.50% (bulk solubility), 0.37% (Al),
0.14% (Na), and 0.19% (Si). These are in all cases smallerthan the symbol sizes in Fig. 2.
Paragonite saturation was bracketed at nine discrete P–T conditions (Fig. 2). At a given P and T, Bulk, Na and Sisolubilities were, with one exception lower when paragonitewas present than when it was absent, while Al was higher,consistent with the amount of NS3 glass added to locatethe paragonite saturation point. A minor solubility“cross-over” occurred at 500 !C, 1.75 GPa, in which themaximum Si and bulk solubilities in paragonite-free exper-iments are slightly lower than the minimum values impliedby the paragonite-present experiments. However, the mag-nitude of the crossover is small, and Na and Al do not showthe same effect. At 500 !C and 600 !C, bulk and individualelement solubilities in H2O in equilibrium withalbite + quartz + paragonite increase with increasing pres-sure. In contrast, bulk and individual element solubilitiesof jadeite + quartz + paragonite decrease as pressure rises.Extrapolation of the trends to their intersections gives theposition of the equilibrium (Fig. 2D)
NaAlSi3O8albite
¼ NaAlSi2O6jadeite
þ SiO2quartz
ð1Þ
The bulk solubility maximum at this point corresponds to!3.3 wt% oxides at 500 !C, and !10.3 wt% oxides at600 !C (Fig. 2D); individual element trends similarly exhibitmaxima at the position of Eq. (1) at each T.
Table 2 gives the midpoint of each isothermal, isobaricsolubility bracket. Listed uncertainties are 1r, assuming auniform distribution of solubility between the limitingexperiments. At each T, the mass of NS3 glass requiredto suppress paragonite increased with P (Table 1). The fluidphase is therefore peralkaline at all investigated conditions,and Na/Al (molar) increases with P (Fig. 3), attaining max-imum values of 3.2 at 500 !C and 2.4 at 600 !C. The Na/Alratio does not show a resolvable break in slope at Eq. (1).Fluids at all investigated conditions contain more Si thaneither Na or Al, and the molar Si/(Na + Al) ratio is !2.5.Thus, the fluids everywhere possess a stoichiometry more si-licic than that of albite, in which the ratio is 1.5.
4. DISCUSSION
4.1. Comparison to previous work
4.1.1. Incongruent dissolution of albite and jadeite at quartzsaturation
Previous studies have shown that albite dissolution inH2O is incongruent over a wide range of metamorphic Pand T (e.g., Morey and Hesselgesser, 1951; Morey andChen, 1955; Hemley et al., 1961; Currie, 1968; Andersonand Burnham, 1983; Stalder et al., 2000; Shmulovichet al., 2001). Ryabchikov and MacKenzie (1985) foundthat, at 650 !C, jadeite dissolved congruently in H2O at2.0 GPa, but incongruently to diaspore + solutes at3.0 GPa. Our results at 500 and 600 !C indicate that bothalbite and jadeite also dissolve incongruently in H2O inthe presence of excess quartz, yielding residual parago-nite + solutes. This agrees with the study of Woodlandand Walther (1987) and Manning et al. (2010).
2926 A. Wohlers et al. /Geochimica et Cosmochimica Acta 75 (2011) 2924–2939
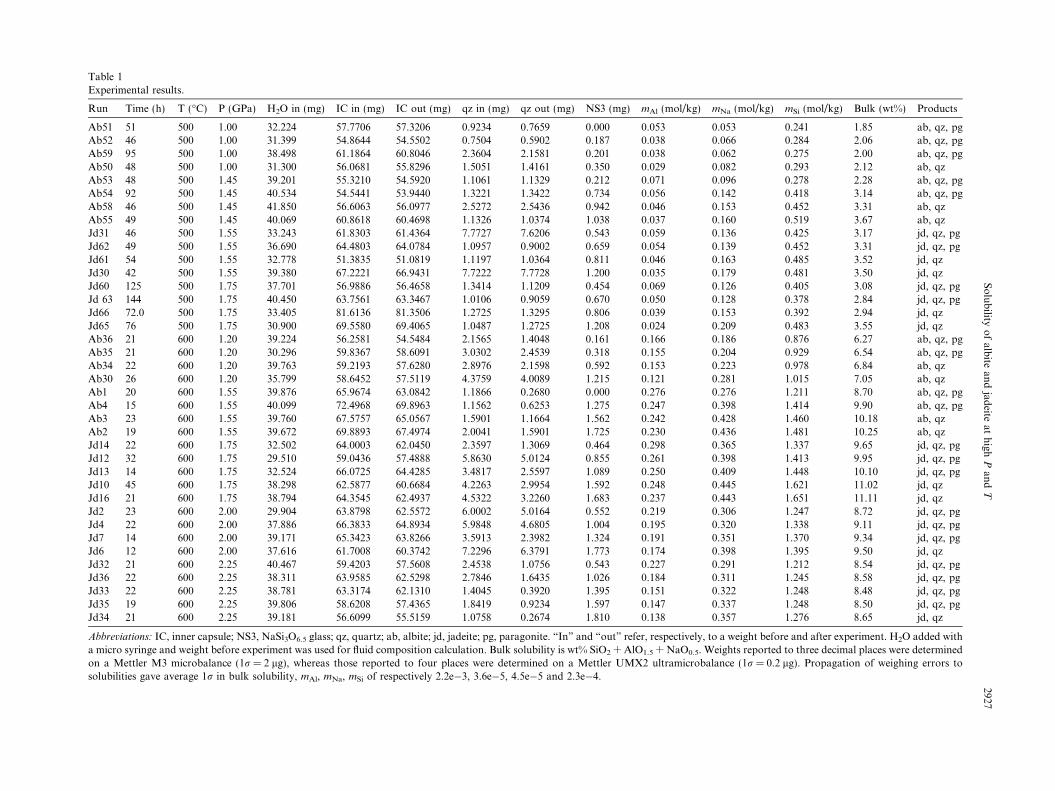
Table 1Experimental results.
Run Time (h) T (!C) P (GPa) H2O in (mg) IC in (mg) IC out (mg) qz in (mg) qz out (mg) NS3 (mg) mAl (mol/kg) mNa (mol/kg) mSi (mol/kg) Bulk (wt%) Products
Ab51 51 500 1.00 32.224 57.7706 57.3206 0.9234 0.7659 0.000 0.053 0.053 0.241 1.85 ab, qz, pgAb52 46 500 1.00 31.399 54.8644 54.5502 0.7504 0.5902 0.187 0.038 0.066 0.284 2.06 ab, qz, pgAb59 95 500 1.00 38.498 61.1864 60.8046 2.3604 2.1581 0.201 0.038 0.062 0.275 2.00 ab, qz, pgAb50 48 500 1.00 31.300 56.0681 55.8296 1.5051 1.4161 0.350 0.029 0.082 0.293 2.12 ab, qzAb53 48 500 1.45 39.201 55.3210 54.5920 1.1061 1.1329 0.212 0.071 0.096 0.278 2.28 ab, qz, pgAb54 92 500 1.45 40.534 54.5441 53.9440 1.3221 1.3422 0.734 0.056 0.142 0.418 3.14 ab, qz, pgAb58 46 500 1.45 41.850 56.6063 56.0977 2.5272 2.5436 0.942 0.046 0.153 0.452 3.31 ab, qzAb55 49 500 1.45 40.069 60.8618 60.4698 1.1326 1.0374 1.038 0.037 0.160 0.519 3.67 ab, qzJd31 46 500 1.55 33.243 61.8303 61.4364 7.7727 7.6206 0.543 0.059 0.136 0.425 3.17 jd, qz, pgJd62 49 500 1.55 36.690 64.4803 64.0784 1.0957 0.9002 0.659 0.054 0.139 0.452 3.31 jd, qz, pgJd61 54 500 1.55 32.778 51.3835 51.0819 1.1197 1.0364 0.811 0.046 0.163 0.485 3.52 jd, qzJd30 42 500 1.55 39.380 67.2221 66.9431 7.7222 7.7728 1.200 0.035 0.179 0.481 3.50 jd, qzJd60 125 500 1.75 37.701 56.9886 56.4658 1.3414 1.1209 0.454 0.069 0.126 0.405 3.08 jd, qz, pgJd 63 144 500 1.75 40.450 63.7561 63.3467 1.0106 0.9059 0.670 0.050 0.128 0.378 2.84 jd, qz, pgJd66 72.0 500 1.75 33.405 81.6136 81.3506 1.2725 1.3295 0.806 0.039 0.153 0.392 2.94 jd, qzJd65 76 500 1.75 30.900 69.5580 69.4065 1.0487 1.2725 1.208 0.024 0.209 0.483 3.55 jd, qzAb36 21 600 1.20 39.224 56.2581 54.5484 2.1565 1.4048 0.161 0.166 0.186 0.876 6.27 ab, qz, pgAb35 21 600 1.20 30.296 59.8367 58.6091 3.0302 2.4539 0.318 0.155 0.204 0.929 6.54 ab, qz, pgAb34 22 600 1.20 39.763 59.2193 57.6280 2.8976 2.1598 0.592 0.153 0.223 0.978 6.84 ab, qzAb30 26 600 1.20 35.799 58.6452 57.5119 4.3759 4.0089 1.215 0.121 0.281 1.015 7.05 ab, qzAb1 20 600 1.55 39.876 65.9674 63.0842 1.1866 0.2680 0.000 0.276 0.276 1.211 8.70 ab, qz, pgAb4 15 600 1.55 40.099 72.4968 69.8963 1.1562 0.6253 1.275 0.247 0.398 1.414 9.90 ab, qz, pgAb3 23 600 1.55 39.760 67.5757 65.0567 1.5901 1.1664 1.562 0.242 0.428 1.460 10.18 ab, qzAb2 19 600 1.55 39.672 69.8893 67.4974 2.0041 1.5901 1.725 0.230 0.436 1.481 10.25 ab, qzJd14 22 600 1.75 32.502 64.0003 62.0450 2.3597 1.3069 0.464 0.298 0.365 1.337 9.65 jd, qz, pgJd12 32 600 1.75 29.510 59.0436 57.4888 5.8630 5.0124 0.855 0.261 0.398 1.413 9.95 jd, qz, pgJd13 14 600 1.75 32.524 66.0725 64.4285 3.4817 2.5597 1.089 0.250 0.409 1.448 10.10 jd, qz, pgJd10 45 600 1.75 38.298 62.5877 60.6684 4.2263 2.9954 1.592 0.248 0.445 1.621 11.02 jd, qzJd16 21 600 1.75 38.794 64.3545 62.4937 4.5322 3.2260 1.683 0.237 0.443 1.651 11.11 jd, qzJd2 23 600 2.00 29.904 63.8798 62.5572 6.0002 5.0164 0.552 0.219 0.306 1.247 8.72 jd, qz, pgJd4 22 600 2.00 37.886 66.3833 64.8934 5.9848 4.6805 1.004 0.195 0.320 1.338 9.11 jd, qz, pgJd7 14 600 2.00 39.171 65.3423 63.8266 3.5913 2.3982 1.324 0.191 0.351 1.370 9.34 jd, qz, pgJd6 12 600 2.00 37.616 61.7008 60.3742 7.2296 6.3791 1.773 0.174 0.398 1.395 9.50 jd, qzJd32 21 600 2.25 40.467 59.4203 57.5608 2.4538 1.0756 0.543 0.227 0.291 1.212 8.54 jd, qz, pgJd36 22 600 2.25 38.311 63.9585 62.5298 2.7846 1.6435 1.026 0.184 0.311 1.245 8.58 jd, qz, pgJd33 22 600 2.25 38.781 63.3174 62.1310 1.4045 0.3920 1.395 0.151 0.322 1.248 8.48 jd, qz, pgJd35 19 600 2.25 39.806 58.6208 57.4365 1.8419 0.9234 1.597 0.147 0.337 1.248 8.50 jd, qz, pgJd34 21 600 2.25 39.181 56.6099 55.5159 1.0758 0.2674 1.810 0.138 0.357 1.276 8.65 jd, qz
Abbreviations: IC, inner capsule; NS3, NaSi3O6.5 glass; qz, quartz; ab, albite; jd, jadeite; pg, paragonite. “In” and “out” refer, respectively, to a weight before and after experiment. H2O added witha micro syringe and weight before experiment was used for fluid composition calculation. Bulk solubility is wt% SiO2 + AlO1.5 + NaO0.5. Weights reported to three decimal places were determinedon a Mettler M3 microbalance (1r = 2 lg), whereas those reported to four places were determined on a Mettler UMX2 ultramicrobalance (1r = 0.2 lg). Propagation of weighing errors tosolubilities gave average 1r in bulk solubility, mAl, mNa, mSi of respectively 2.2e&3, 3.6e&5, 4.5e&5 and 2.3e&4.
Solubility
ofalb
itean
djad
eiteat
high
Pan
dT
2927

The variation in incongruent dissolution of albite andjadeite (±quartz) can be assessed using molar Na/Al ratiosof solutes (Fig. 3A). Previous studies of albite dissolution inH2O, without quartz and below 0.8 GPa, suggest a weakdependence of Na/Al on P at 500 and 600 !C (Morey andHesselgesser, 1951; Currie, 1968; Anderson and Burnham,1983). The Na/Al ratios from Manning et al. (2010) at1 GPa are higher than those at lower P, in agreement withpredictions of Antignano and Manning (2008). Our dataindicate further isothermal increases in Na/Al with P thatare broadly consistent with previous work.
Taken together, data on the solubility of albite or albite/jadeite–paragonite–quartz show that dissolution becomesprogressively more incongruent as P increases. At a givenP, peralkalinity decreases with increasing T, indicating alarger increase in Al relative to Na solubility as T rises.Thus, at T higher than our study, our data predict an ap-proach to congruent dissolution behavior. This would likelyexplain why, at 650 !C, Ryabchikov and MacKenzie (1985)
found that jadeite dissolves congruently in H2O at 2.0 GPa,but incongruently at 3.0 GPa.
4.1.2. SolubilityManning et al. (2010) determined albite–paragonite–
quartz solubility at 1.0 GPa, 350–620 !C, by direct analysisof quenched fluid and weight-loss methods. Fig. 3B showsthat, despite the different methods employed, our bulk-sol-ubility data at 500 !C agree closely with their results. Simi-lar agreement is seen for individual elements.
Previous work on Si concentrations in H2O in equilib-rium with either quartz or albite alone indicates rising sol-ubility with P at both temperatures (Fig. 4). Fig. 4A showsthat the solubility of quartz in H2O (in the absence of albiteor jadeite) increases with P at both temperatures (Manning,1994). Similarly, albite dissolution in H2O (in the absence ofquartz) yields increasing Si concentration with P (Fig. 4B;Morey and Hesselgesser, 1951; Currie, 1968; Andersonand Burnham, 1983). Extrapolation of the albite solubility
Fig. 1. Back-scattered electron images of experimental run products. (A) Albite crystal partially covered with paragonite at 600 !C and1.55 GPa. (B) Jadeite almost completely covered in paragonite for an experiment at 600 !C and 2 GPa. Panel (D) shows and enlarged area of(B). Panels (C) and (D) show platy paragonite flakes. Panels (E) and (F) illustrate the results of adding sufficient NaSi3O6.5 glass to suppressthe growth of paragonite on albite (E) and jadeite (F).
2928 A. Wohlers et al. /Geochimica et Cosmochimica Acta 75 (2011) 2924–2939

0.0
0.1
0.2
0.3
Al m
olal
ity
Ab or Jd + Qz + Pg
Ab or Jd + Qz
A
0.0
0.1
0.2
0.3
0.4
0.5
Na m
olal
ity
B
0.0
0.5
1.0
1.5
2.0
1.0 1.2 1.4 1.6 1.8 2.0 2.2
Si m
olal
ity
Pressure (GPa)
C
0
2
4
6
8
10
12
1.0 1.2 1.4 1.6 1.8 2.0 2.2
Bulk
sol
ubili
ty (w
t%)
Pressure (GPa)
D
albite jadeite
albite jadeite
Fig. 2. Experimentally constrained concentrations of aluminum (A), sodium (B), silica (C) (mol/kg H2O) and bulk solubility (D) (wt%) at500 !C (circles) and 600 !C (diamonds). Open symbols indicate experiments without paragonite; filled symbols denote paragonite-bearingruns. At a given P and T, the fluid composition in equilibrium with albite/jadeite + paragonite + quartz must lie between the two types ofexperiment (see text), as illustrated by the solid lines. Individual element concentrations and bulk solubility increase from 1 GPa to the albite–jadeite–quartz equilibrium (vertical dashed lines in panel (D)); concentrations decline at higher P. Propagated 2r errors in solubility (Table 1)are smaller than symbol size.
Table 2Fluid compositions coexisting with quartz + paragonite + albite or jadeite.
P (GPa) T (!C) Mineralassemblage
Bulk solubility(wt%)
Si (mol/kgH2O)
Al (mol/kgH2O)
Na (mol/kgH2O)
Na/Al (M)
1.00 500 APQ 2.058(35) 0.284(05) 0.033(03) 0.072(06) 2.16(23)1.45 500 APQ 3.226(50) 0.435(10) 0.051(03) 0.148(03) 2.87(17)1.55 500 JPQ 3.415(61) 0.468(09) 0.050(03) 0.151(07) 3.03(20)1.75 500 JPQ 2.891(28) 0.385(04) 0.045(03) 0.141(07) 3.16(28)1.20 600 APQ 6.694(86) 0.954(14) 0.154(01) 0.214(05) 1.39(04)1.55 600 APQ 10.039(79) 1.437(13) 0.244(02) 0.413(09) 1.69(04)1.75 600 JPQ 10.561(264) 1.534(50) 0.249(01) 0.427(10) 1.71(04)2.00 600 JPQ 9.419(49) 1.382(07) 0.183(05) 0.375(13) 2.05(09)2.25 600 JPQ 8.579(44) 1.262(08) 0.143(03) 0.347(06) 2.43(06)
Fluid compositions are midpoints between bracketing solubilities. Parenthetical numbers reflect 1r in the final digits, calculated assumingequal probability of solubility between limiting values. Abbreviations: A, albite; J, jadeite; P, paragonite; Q, quartz.
Solubility of albite and jadeite at high P and T 2929

results to higher P suggests that Si content of albite-satu-rated H2O would exceed that of quartz-saturated H2O athigher P than those investigated. Our results demonstratethat when albite or jadeite and quartz are present together,along with the incongruent product paragonite, the total Siin solution is significantly higher than in the presence of al-bite or quartz alone. The elevation of Si solubility wellabove that in H2O saturated with a single mineral (quartzor albite) strongly suggests that Si complexes with other ele-ments in solution (see below).
Our data indicate that bulk and individual-element sol-ubilities in the jadeite stability field decrease with P at 500and 600 !C. Ryabchikov and MacKenzie (1985) obtaineda similar result for bulk jadeite solubility in H2O at650 !C, 2.0 and 3.0 GPa.
4.1.3. Albite–jadeite–quartz equilibriumThe different signs of the P dependence of solubility in
the albite and jadeite stability fields indicate that the solu-bility data offer a novel means of bracketing the positionof Eq. (1). Linear extrapolations of our results within eachstability field must intersect at the P of Eq. (1) at a given T.The data at 600 !C suggest an equilibrium P of 1.64 GPa,identical to the results of Hays and Bell (1973) and Holland
Na/A
l (m
olar
)
0.5
1.0
1.5
2.0
2.5
3.0
3.5
albite and jadeite
Pressure (GPa)1.0 1.5 2.00.50
500 ºC600 ºC
Ab or Jd + Qz + Pg
Ab
500 ºC 600 ºC(Manning et al., 2010)
500 ºC 600 ºC(Anderson and Burnham,1983) 500 ºC 600 ºC(Currie, 1968) 500 ºC (Morey and Hesselgesser,1951)
350 400 450 500 550 600 6503000
2
4
6
8
10
12
bulk
(wt%
)
T (ºC)
Ab + Qz + PgBracketing experiment (this study)Fluid-extraction experiments (Manning et al., 2010)Weight-loss experiments (Manning et al., 2010)
wet m
elting
1 GPa
A
B
Fig. 3. (A) Comparison of the variation in the molar Na/Al ratiowith pressure at 500 !C (gray) and 600 !C (black) (Morey andHesselgesser, 1951; Currie, 1968; Anderson and Burnham, 1983;Manning et al., 2010; this study). At both temperatures, fluidsbecome progressively enriched in Na relative to Al with increasingP. At a given P, molar Na/Al ratios decrease toward unity (i.e.,congruent albite or jadeite dissolution) with increasing T. (B)Comparison of bulk solubility of albite + paragonite + quartz inH2O at 1 GPa (Manning et al., 2010; this study). Despite differentexperimental methods, the two studies show excellent agreement.
0.0
0.5
1.0
1.5
2.0
Si m
olal
ity
Pressure (GPa)1.5 210.50
albite+quartz +paragonite
jadeite+quartz +paragonite
albite only
jadeite+quartz +paragonite
albite+quartz +paragonite
500 ºC600 ºC Ab + Qz + Pg
Jd + Qz + Pg
500 ºC600 ºC
Ab only 500 ºC 600 ºC(Manning et al., 2010)
500 ºC 600 ºC(Anderson and Burnham,1983) 500 ºC 600 ºC (Currie, 1968)
Si m
olal
ity
0.0
0.5
1.0
1.5
jadeite+quartz +paragonite
albite+quartz +paragonite
jadeite+quartz +paragonite
albite+quartz +paragonite
500 ºC600 ºC Ab + Qz + Pg
Jd + Qz + Pg
500 ºC600 ºC
Qz only
500 ºC 600 ºC(Manning et al., 2010)
500 ºC 600 ºC(Manning, 1994)
quartz only
quartz only
A
B
albite only
500 ºC (Morey and Hesselgesser,1951)
Fig. 4. Comparison of Si concentrations in the presence of albite/jadeite + quartz + paragonite (Manning et al., 2010; this work) to(A) previous results on quartz solubility in H2O without albite(Manning, 1994) and (B) albite solubility in H2O without quartz(Morey and Hesselgesser, 1951; Currie, 1968; Anderson andBurnham, 1983). The silica concentrations in the presence ab orjd + pg + qtz are higher then that predicted by extrapolations ofthe albite-only results of Anderson and Burnham (1983).
2930 A. Wohlers et al. /Geochimica et Cosmochimica Acta 75 (2011) 2924–2939

(1980) despite their use of synthetic high albite. Our resultof 1.51 GPa at 500 !C is the first experimental constraintat this T. The intersections at both T differ slightly frompredictions based on the Holland and Powell (1998) dataset (2002 update), which gives equilibrium P of 1.43 and1.67 GPa at 500 and 600 !C, respectively. The small differ-ences in the implied position of Eq. (1) may simply be dueto our use of natural low-albite and jadeite.
4.2. Comparison to predicted fluid composition
The experimental results document an isothermal riseand then decline of measured element concentrations nearthe albite–jadeite–quartz transition. The origins of thesepressure-dependent changes in solubility can be exploredvia comparison of measured fluid compositions with thosecalculated from thermodynamic data.
4.2.1. Prediction of fluid composition and speciationSpecies abundance and fluid composition were calcu-
lated at experimental conditions following the approachof Manning et al. (2010). The assemblages albite + parago-nite + quartz and jadeite + paragonite + quartz in pureH2O buffer pH at values greater than acid–base neutrality.
Therefore, the acidic species Al+3, AlOH+2 and AlO+ maybe assumed negligible, giving a set of 11 species: the neutralspecies HAlO2,aq, NaOHaq, NaAlO2,aq, NaHSiO3,aq,SiO2,aq, and Si2O4,aq, and the ionic species H+, OH&,Na+, AlO2
& and HSiO3&. Silica species notation follows
Newton and Manning (2002, 2003, 2008); others are afterShock et al. (1997) and Sverjensky et al. (1997). The equa-tions used to calculate fluid composition and speciation aregiven in Appendix.
Table 3 gives the computational results at the experi-mentally investigated P and T. For each P and T, fluidcomposition was computed by initially setting I = 0, calcu-lating activity coefficients and species abundances, thenupdating I and repeating. Solutions converged in less thanten iterations. Calculated pH is alkaline in every case, sup-porting our assumption of negligible Al+3, AlOH+2, andAlO+. Ion activity coefficients ranged from 0.6 to 0.7, andpredicted ionic strength was everywhere <0.1.
4.2.2. Measured vs. predicted fluid compositionsFig. 5 and Table 4 compare predicted and observed bulk
solubility and individual element concentrations. At eachP–T studied, measured solubility is greater than that calcu-lated from thermodynamic data.Manning et al. (2010) found
Table 3Log K values and calculation results.
T (!C): 500 500 500 500 600 600 600 600 600 600P (GPa): 1 1.45 1.55 1.75 1 1.2 1.55 1.75 2 2.25
log K values(1) 3Ab + 2H+ = Pg + 6Qz + 2Na+ 9.548 9.833 – – 9.149 9.277 9.455 – – –(2) Ab + 2AlO2
& + 2H+ = Pg 17.034 16.424 – – 16.110 15.751 15.255 – – –(3) 3Jd + 2H+ = Pg + 3Qz + 2Na+ – – 9.484 8.928 – – – 9.298 8.673 8.046(4) Jd + Qz + 2AlO2
& + 2H+ = Pg – – 16.185 15.767 – – – 14.938 14.445 13.982(5) H2O = H+ + OH& &8.407 &7.939 &7.858 &7.703 &8.408 &8.160 &7.816 &7.652 &7.476 &7.319(6) Qz + H2O = HSiO3
& + H+ &8.656 &8.112 &8.018 &7.838 &8.991 &8.718 &8.339 &8.159 &7.965 &7.792(7) HAlO2,aq = H+ + AlO2
& &4.403 &4.161 &4.119 &4.039 &4.605 &4.465 &4.271 &4.179 &4.080 &3.991(8) NaOHaq = Na+ + OH& 0.196 0.641 0.719 0.866 0.031 0.309 0.695 0.878 1.075 1.252(9) NaAlO2,aq = Na+ + AlO2
& &0.478 &0.115 &0.051 0.069 &0.664 &0.448 &0.148 &0.006 0.148 0.285(10) Qz + NaOHaq = NaHSiO3,aq &0.258 &0.044 &0.007 0.063 &0.888 &0.771 &0.609 &0.532 &0.449 &0.375(11) Qz = SiO2,aq &0.868 &0.764 &0.745 &0.709 &0.674 &0.612 &0.519 &0.471 &0.417 &0.367(12) SiO2,aq = Si2O4,aq 0.108 &0.130 &0.183 &0.289 0.305 0.199 0.014 &0.092 &0.225 &0.357
Calculation resultsI 0.033 0.072 0.067 0.058 0.032 0.047 0.080 0.090 0.079 0.067c1 0.701 0.615 0.623 0.639 0.704 0.664 0.602 0.587 0.604 0.622pH 6.406 6.237 6.121 5.894 6.218 6.147 6.045 5.924 5.659 5.401log[H+] &6.252 &6.025 &5.916 &5.700 &6.066 &5.969 &5.824 &5.693 &5.440 &5.195log[OH&] &1.847 &1.491 &1.531 &1.615 &2.038 &1.836 &1.551 &1.497 &1.598 &1.712log[AlO2
&] &1.957 &1.752 &1.766 &1.795 &1.684 &1.551 &1.362 &1.314 &1.344 &1.384log[Na+] &1.477 &1.145 &1.174 &1.236 &1.492 &1.330 &1.097 &1.044 &1.104 &1.172log[HAlO2,aq] &4.114 &4.039 &3.974 &3.845 &3.450 &3.411 &3.356 &3.290 &3.143 &3.000log[NaOHaq] &3.829 &3.699 &3.834 &4.105 &3.865 &3.831 &3.784 &3.882 &4.215 &4.548log[NaAlO2,aq] &3.264 &3.205 &3.299 &3.488 &2.816 &2.789 &2.752 &2.814 &3.034 &3.252log[SiO2,aq] &0.868 &0.764 &0.745 &0.709 &0.674 &0.612 &0.519 &0.471 &0.417 &0.367log[Si2O4,aq] &1.628 &1.659 &1.673 &1.707 &1.043 &1.025 &1.024 &1.034 &1.058 &1.091log[HSiO3
&] &2.096 &1.664 &1.691 &1.750 &2.620 &2.393 &2.074 &2.004 &2.087 &2.185log[NaHSiO3,aq] &4.087 &3.744 &3.841 &4.041 &4.753 &4.602 &4.393 &4.414 &4.665 &4.922log[Natotal] &1.467 &1.139 &1.169 &1.232 &1.469 &1.314 &1.086 &1.036 &1.098 &1.168log[Altotal] &1.933 &1.735 &1.750 &1.783 &1.647 &1.521 &1.341 &1.296 &1.329 &1.368log[Sitotal] &0.719 &0.624 &0.615 &0.598 &0.403 &0.360 &0.300 &0.273 &0.247 &0.223Bulk solubility (oxide wt%) 1.295 1.718 1.729 1.752 2.529 2.845 3.378 3.611 3.744 3.871
Abbreviations: Ab (albite), Jd (jadeite), Pg (paragonite), Qz (quartz). Square brackets denote concentration in molal.
Solubility of albite and jadeite at high P and T 2931

that, at 1 GPa, predicted and measured solubilities ofalbite + paragonite + quartz in H2O agreed at 6450 !C;however, with increasing T, observed solubility became pro-gressively greater than that calculated, up to the point ofhydrothermalmelting. Our result at 500 !C, 1 GPa, is consis-tent with this analysis, and they suggest that similar isobarictrends occur at all investigated P. In the albite stability field,increasing P at constant T yields widening excesses in mea-sured bulk and individual element solubilities, with greaterexcess solubility at 600 !C than at 500 !C. The trend contin-ues until jadeite becomes stable. In the jadeite stability field,measured bulk and individual element solubilities declinewith a further riseP at constantT. Themaximumexcess bulk,Si, Al, and Na solubilities occur at the albite–jadeite–quartzequilibrium boundary at eachT. If the trends are linear, thenagreement between measured and predicted solubility is im-plied at <1.0 GPa and >2.25 GPa.
Element ratios in the experimental fluids also differ fromthose calculated (Fig. 6A, B and Table 4). The experimen-tally constrained bulk solutes possess lower Si/(Na + Al)than thermodynamic data would indicate. The calculationssuggest that, at a given P, the fluid composition should be-come more Si rich with rising T. However, the experimentsreveal that element ratios in the fluids are not strongly sen-sitive to T in the range 500–600 !C: Al is !10 ± 2 mol%,and Na + Al is !30 ± 5 mol% over the investigated rangeof conditions.
4.3. Origin of excess solubility
The experimental fluids possess concentrations of Na, Aland Si that are significantly greater than those predicted(Table 4 and Fig. 5). The solubility excesses could arisefrom experimental methodology or inaccurate thermody-
Al m
olal
ity
0.0
0.1
0.2
0.3
500 ºC600 ºC Ab + Qz + Pg
Jd + Qz + Pg
500 ºC600 ºC
500 ºC600 ºC
(Manning et al., 2010)
Na m
olal
ity
0.0
0.1
0.2
0.3
0.4
0.5
0.0
0.1
0.0
0.1
0.2
A = JQ
A = JQ
1.67 GPa
1.43 GPa
bulk
sol
ubili
ty (w
t%)
Si m
olal
ity
0.0
0.5
1.0
1.5
2.0
0
2
4
6
8
10
12
Pressure (GPa)1 1.2 1.4 1.6 1.8 2 2.2
0.0
0.5
0
2
4
1 1.2 1.4 1.6 1.8 2 2.2Pressure (GPa)
1.67 GPa
A = JQ
1.43 GPa
A = JQ
A B
C D
600°C
500°C
600°C
500°C
600°C
500°C
600°C
500°C
Fig. 5. Measured vs. predicted concentrations of Al (A), Na (B), Si (C) and bulk solutes (D) in H2O in the presence of albite orjadeite + quartz + paragonite. Symbols as in Fig. 4. Predicted element concentrations (dashed lines) are lower than measured values (solidlines) at all investigated temperatures and pressures. Predicted and measured aluminum and sodium concentrations in the fluids increase to amaximum at the albite = jadeite + quartz transition, and then decrease with further increase in P in the jadeite stability field. Predicted silicaconcentrations and bulk solubility increases over the whole pressure range, whereas measured values increase to the transition, followed bysolubility decrease.
2932 A. Wohlers et al. /Geochimica et Cosmochimica Acta 75 (2011) 2924–2939

namic data (Manning et al., 2010). Though we used a differ-ent method to bracket the fluid composition at albite–par-agonite–quartz or jadeite–paragonite–quartz, we obtainresults comparable to Manning et al. (2010) at the sameP–T conditions, and the trends in Na/Al in our study agreewith those established by previous work (Morey and Hes-selgesser, 1951; Currie, 1968; Anderson and Burnham,1983; Manning et al., 2010). Thus, differences in methodol-ogy are not a likely source of the discrepancy.
Inaccuracy in the extrapolated thermodynamic proper-ties is another potential source of the differences betweencalculated fluid composition and our experimental results.Thermodynamic databases, especially for ions, have manysources of error (e.g., Oelkers et al., 2009). However, severalconsiderations suggest that this is not responsible for thevariance. First, the equations for the solubility of quartz(Manning, 1994) and aqueous silica speciation (Newtonand Manning, 2002, 2003) are included in the calculations.These are based on experimental determinations at thesame conditions of this study. Leaving aside the other com-ponents of the solution, the silica concentrations aloneshould agree well; but they in fact diverge to the greatest de-gree on an absolute basis. In addition, the extrapolationscheme used to compute equilibrium constants successfully
reproduces experimentally derived mineral solubility inH2O in systems that are compositionally simpler, includingcorundum solubility in H2O (e.g., Manning, 2007; Tropperand Manning, 2007) and corundum solubility in KOH–H2O (Wohlers and Manning, 2009). Finally, Manninget al. (2010) showed that even in this compositionally com-plex system, the extrapolation scheme reproduces experi-mentally constrained solubilities at low temperatures of<500 !C at 1 GPa. Thus, errors in thermodynamic data,while they certainly exist, can not alone cause the differencebetween the calculations and the experiments.
The origin of the solubility excess in experimental fluidsis better explained by the presence of solutes that are not ta-ken into account in predicting the fluid compositions. Thesemissing species must be the predominant reservoirs for allthree elements over the entire P–T range of this investiga-tion. At 500 !C, Na, Al and Si exceed predicted values by54%, 64%, and 40% (molar) on average. Similarly, at600 !C, the mean molar excesses are even greater: Na,79%; Al, 77%; Si, 58%.
Because the calculation scheme for predicting solubilityincluded all significant monomers, ions, and simple species,the dissolved structures needed to explain the excess solubil-ity must be more polymerized solutes (Manning et al.,
Table 4Composition of solute fractions (oxide wt%).
APQ APQ JPQ JPQ APQ APQ APQ JPQ JPQ JPQ500 !C 500 !C 500 !C 500 !C 600 !C 600 !C 600 !C 600 !C 600 !C 600 !C1.00 GPa 1.45 GPa 1.55 GPa 1.75 GPa 1.00 GPa 1.20 GPa 1.55 GPa 1.75 GPa 2.00 GPa 2.25 GPa
ObservedNaO0.5 0.219 0.442 0.452 0.424 0.443 0.618 1.151 1.183 1.051 0.983AlO1.5 0.167 0.254 0.245 0.220 0.448 0.731 1.121 1.135 0.845 0.665SiO2 1.672 2.531 2.718 2.247 4.729 5.346 7.767 8.246 7.523 6.931Bulk 2.058 3.227 3.415 2.891 5.620 6.695 10.039 10.564 9.419 8.579
PredictedNaO0.5 0.104 0.221 0.207 0.178 0.102 0.146 0.245 0.275 0.238 0.202AlO1.5 0.059 0.092 0.089 0.083 0.112 0.149 0.225 0.249 0.230 0.210SiO2 1.132 1.404 1.434 1.491 2.314 2.550 2.907 3.088 3.275 3.458Bulk 1.295 1.718 1.729 1.752 2.529 2.845 3.378 3.611 3.744 3.871
ExcessNaO0.5 0.115 0.221 0.245 0.245 0.340 0.472 0.905 0.908 0.814 0.781AlO1.5 0.108 0.161 0.156 0.138 0.336 0.581 0.896 0.887 0.615 0.455SiO2 0.540 1.126 1.285 0.756 2.415 2.796 4.860 5.158 4.248 3.473Bulk 0.763 1.508 1.686 1.139 3.091 3.849 6.661 6.953 5.677 4.709
PolymerizedNaO0.5 0.115 0.221 0.245 0.245 0.340 0.472 0.905 0.908 0.814 0.781AlO1.5 0.108 0.161 0.156 0.138 0.336 0.581 0.896 0.887 0.615 0.455SiO2 0.820 1.386 1.535 0.988 3.475 3.897 5.959 6.229 5.260 4.411Bulk 1.043 1.768 1.937 1.371 4.151 4.950 7.760 8.024 6.689 5.647
UnpolymerizedNaO0.5 0.104 0.221 0.207 0.178 0.102 0.146 0.245 0.275 0.238 0.202AlO1.5 0.059 0.092 0.089 0.083 0.112 0.149 0.225 0.249 0.230 0.210SiO2 0.852 1.145 1.183 1.259 1.254 1.449 1.808 2.017 2.264 2.521Bulk 1.015 1.458 1.479 1.520 1.469 1.744 2.278 2.541 2.732 2.933
Explanation: “Excess” is the difference between observed and predicted values; polymerized and unpolymerized entries are excess andpredicted values, except for silica, for which calculated Si2O4,aq is included in polymerized SiO2. Observed values at 600 !C, 1 GPa fromManning et al. (2010); predicted values at this P and T differ slightly due to our use of Holland and Powell (1998) mineral data. Abbreviations:A, albite; J, jadeite; P, paragonite; Q, quartz.
Solubility of albite and jadeite at high P and T 2933

2010). This inference is supported by growing spectroscopicand phase equilibrium evidence for the presence of poly-meric solute structures at high P and T (e.g., Mysen,1998; Salvi et al., 1998; Zhang and Frantz, 2000; Zotovand Keppler, 2000, 2002; Newton and Manning, 2002,2003, 2008; Manning, 2004, 2007; Mibe et al., 2008). Thecalculations included NaAlO2,aq, NaHSiO3,aq, and the silicadimer Si2O4,aq, so the additional solutes must involve evenmore complex stoichiometry and composition, and all ele-ments must participate. In light of the previous studies,the proposed polymeric solutes likely involve a mixture oflinear and ring structures, with an abundance that varies
with P and T in a manner that accommodates the changingbulk solute concentration and element fractions.
The concentration of the inferred polymerized solutesrises with P in the albite stability field, attains a maximumat the position of Eq. (1), and declines with furtherP increasein the jadeite stability field (Table 4 and Fig. 6C, D). At thejadeite–albite–quartz equilibrium, the bulk polymerizedfraction constitutes nearly 2 wt% (of !3.3 wt% total dis-solved solutes) at 500 !C, and !7.9 wt% (of !10.3 wt%) at600 !C. Polymerized species are dominated by SiO2 at allconditions investigated, with NaO0.5 and AlO1.5 present inbroadly subequal concentrations (Fig. 6C and D).
Fig. 6. Elemental solute fractions (A and B) and predicted polymer concentrations (C and D). Experimentally determined element fractions(solid lines, in mol%) at 500 !C (A) and 600 !C (B) differ from predicted values (dashed lines) at all conditions investigated. Measured fluidcompositions have higher Al fraction, and lower Si fraction than predicted. The concentrations of the polymerized fraction of each element (inwt% oxide) at 500 !C (C) and 600 !C (D) displays the same pattern as the total solubility (Fig. 6) because these species predominate in thesolutions at all conditions studied. Small open circles denote the experimentally constrained or calculated (Holland and Powell, 1998) positionof Eq. (1).
2934 A. Wohlers et al. /Geochimica et Cosmochimica Acta 75 (2011) 2924–2939

4.4. Origin of solubility patterns
The main solubility patterns revealed by our experi-ments are an isobaric increase in solubility with T, and anisothermal maximum in solubility at the position of Eq.(1). Fig. 7 illustrates that these patterns result in bulk-solu-bility isopleths with negative dP/dT in the albite stabilityfield, but positive dP/dT in the jadeite stability field. Thisdiffers from a predicted pattern of negative dP/dT at all Pand T (Fig. 5D). Because the inferred polymeric compo-nents are predominant among the solutes, their behaviormust govern the solubility patterns (Figs. 5–7). We suggesttwo primary controls on this behavior.
Based on isobaric experiments at 1 GPa, Manning et al.(2010) proposed that increasing Na–Al–Si polymer solubil-ity is linked to the approach to the hydrothermal meltingpoint, reflecting increasing stability in the fluid of the struc-tural elements that will comprise the melt phase when it be-comes stable. Our results are consistent with thishypothesis. As shown in Fig. 7, isobaric sections at P higherthan 1 GPa intersect the melting curve in the albite stabilityfield at progressively lower T, owing to the negative Clapey-ron slope of the hydrothermal melting curve of albite + -
quartz. If the hypothesis of premelting stabilization ofpolymeric solutes is correct, then isobaric approach to melt-ing at progressively higher P should yield greater excess sol-ubility (higher polymer concentration) in the albite field.Our data show that this is the observed solubility pattern.Moreover, in the jadeite stability field, the Clapeyron slopeof hydrothermal melting of jadeite + quartz is positive, soisobaric experiment-pairs at 500 and 600 !C grow more dis-tant from the melting point as P increases. If the premeltinghypothesis is correct, increasing the P of isobaric sectionsshould yield decreasing solubility excesses (progressivelylower polymer concentration). Again, this is the result re-turned by our data. In short, the experimental results lendsupport to the hypothesis that there is a strong increase inpolymerization of Na–Al–Si solutes within !100–150 !Cof hydrothermal melting point in this system.
The slopes of the solubility isopleths and the hydrother-mal melting curves exhibit a change in sign when thealbite = jadeite + quartz equilibrium is encountered. Thesechanges in sign arise from the large difference between themolar volumes of albite and jadeite. Neither melt nor aque-ous solutes will exhibit a first-order-like volume change;rather, their changes on isothermal compression will becontinuous and small. Thus, the volume change of the sol-ids dictates the topology of the isopleths, as it does thehydrothermal melting curve.
4.5. Implications for metamorphic fluids
Several insights into high-P metasomatic fluids arisefrom this work. First, the crossing of reaction boundariesduring burial and exhumation may trigger abrupt changesin solubility patterns, with potentially important implica-tions for mass transfer. As shown in Figs. 6 and 7, the max-imum solubility at a given T is encountered at thealbite = jadeite + quartz boundary. A fluid rising nearlyisothermally from the jadeite stability field will dissolverock constituents along its path until encountering Eq.(1). With further decompression, solubilities instead de-cline, forcing mineral precipitation to maintain equilibrium.Thus, the reaction boundary represents a transition frommineral dissolution to mineral precipitation. With the ca-veat that this is a very simple chemical system, the changeshighlight how flow of metamorphic fluid can participate inlarge-scale chemical transfers and crustal evolution.
Our study supports the hypothesis that metamorphicsystems may experience enhanced metasomatism as theyapproach melting conditions (Manning et al., 2010). Fluidmovement through, or loss from, a given volume of meta-morphic rock near its melting point can lead to significantbulk compositional change because of the very high solubil-ities in this P–T region. This could complicate interpreta-tion of leucosome–melanosome compositional relations ifthe rocks eventually melt and form migmatites.
The new experiments have particular relevance to meta-somatic mass transfer in subduction zones. Some model P–T paths of slab tops display a strong T increase from <400to >600 !C at 2.0 ± 0.5 GPa, corresponding to the onset ofcoupling between the slab and mantle wedge (e.g., Syracuseet al., 2010). Extrapolating from our model chemical sys-
Fig. 7. P–T diagram showing conditions of experiments (filledcircles, this study; triangle, Manning et al., 2010) and bulksolubility isopleths (short dashed lines) in wt% oxides. Paragonitepresent below solidus but supersolidus phase relations uncertain.Solid lines show position of Eq. (1) (Holland and Powell, 1998) andhydrothermal melting of albite + quartz and jadeite + quartz.Queried long-dashed line shows position of Eq. (1) consistent with500 !C experiments in the present study. Hydrothermal meltingcurves after Luth et al. (1964; adjusted by Luth, 1968), Boettcherand Wyllie (1969) and Manning et al. (2010). It was assumed forsimplicity that there are no critical end points on the meltingcurves; this is broadly consistent with the experimental studies, butnone report sufficiently tight reversals near Eq. (1) to assesspotential critical behavior in the system. There are insufficient datato accurately portray the topologies of the critical mixing curves forliquid + vapor in either the albite + quartz or jadeite + quartzfields.
Solubility of albite and jadeite at high P and T 2935

tem, it can be concluded that fluids which equilibrate withthe uppermost metabasalts and sediments at these condi-tions prior to exit into the mantle wedge will carry a largesolute load, chiefly in the form of polymeric complexes.These solution components have the capacity to metasoma-tize the mantle wedge, both in consequence of their essentialstructural elements (alkalis, Al, and Si), as well as by pro-viding structural environments that readily incorporatetrace refractory constituents (e.g., Manning, 2004; Manninget al., 2008).
5. CONCLUSIONS
(1) Albite + quartz and jadeite + quartz dissolve incon-gruently in H2O over the investigated P–T range,leaving the aluminum-rich residual phase paragonite.
(2) In the albite stability field, the solubilities of all ele-ments (and accordingly, bulk solubility), rise withisothermal P increase, to a maximum at thealbite = jadeite + quartz equilibrium. In the jadeitestability field, all element solubilities decline with fur-ther isothermal P increase. At a given P, all elementsolubilities are higher at 600 !C than at 500 !C. Thesolubility of Si is greater than Na or Al. Silica solubil-ities exceed those measured in H2O equilibrated withalbite or quartz alone. All measured fluid composi-tions are peralkaline (Na/Al > 1). Molar Na/Al riseswith P at constant T, but decreases with T at con-stant P.
(3) Element and bulk solubilities in measured fluids arehigher than predicted at all P and T investigated.Because the model fluids only account for simplemonomeric species and ions, and the silica dimer,the excess solubility signals the presence of polymer-ized species in the solutions. These species mustaccommodate all three elements, and are likely amix of a variety of structures in varying ratios andstoichiometries. They are the predominant solutesin solution.
(4) The solubility patterns are best explained by a modelin which polymerization of solutes proceed as themelting point is approached. The solubility maxi-mum at the albite = jadeite + quartz equilibriumtranslates to a change in the sign of dP/dT of solubil-ity isopleths. Like the change in sign of the Clapeyronslope of the hydrothermal melting curves, this behav-ior owes its origin to the large volume differencebetween albite and jadeite.
(5) The new solubility data have important consequencesfor metamorphic fluids. They show that reactionboundaries with large DV can drive mineral precipi-tation from buoyantly rising fluids. Moreover, meta-morphic systems may experience dramatic bulkcompositional change prior to melting, owing to theenhanced metasomatic power of near-solidus fluids.This could complicate interpretation of composi-tional relations in rocks that eventually melted, suchas migmatites. Finally, fluids leaving subducting slabswill carry very high solute loads, mainly in the form
of polymerized species. These species could effectuateimportant mass transfer of otherwise insolublematerials.
ACKNOWLEDGMENTS
This work was supported by the ETH Zurich and the NationalScience Foundation Grant EAR-0711521 to C.E.M. We thank R.Newton for discussions and assistance. Reviews and commentsby E. Oelkers, A. Liebscher, G. Anderson and an anonymous re-viewer improved the manuscript.
APPENDIX
At a given P and T in the albite stability field, heteroge-neous equilibrium can be described by:
3NaAlSi3O8albite
þ2Hþ ¼ NaAl3Si3O10ðOHÞ2paragonite
þ 6SiO2quartz
þ2Naþ
ðA1Þ
and
NaAlSi3O8albite
þ2AlO2& þ 2Hþ ¼ NaAl3Si3O10ðOHÞ2
paragonite
ðA2Þ
In the jadeite stability field, the corresponding equilibria are
3NaAlSi2O6jadeite
þ2Hþ ¼ NaAl3Si3O10ðOHÞ2paragonite
þ 3SiO2quartz
þ2Naþ
ðA3Þ
and
NaAlSi2O6jadeite
þ SiO2quartz
þ2AlO2& þ 2Hþ
¼ NaAl3Si3O10ðOHÞ2paragonite
ðA4Þ
An additional eight equilibria are independent of albite orjadeite stability:
H2O ¼ Hþ þOH& ðA5ÞSiO2quartz
þH2O ¼ HSiO3& þHþ ðA6Þ
HAlO2;aq ¼ Hþ þAlO2& ðA7Þ
NaOHaq ¼ Naþ þOH& ðA8ÞNaAlO2;aq ¼ Naþ þAlO2
& ðA9ÞSiO2quartz
þNaOHaq ¼ NaHSiO3;aq ðA10Þ
SiO2quartz
¼ SiO2;aq ðA11Þ
2SiO2;aq ¼ Si2O4;aq ðA12Þ
The activities of the charged aqueous species can be derivedfrom equations for the equilibrium constants (K) for Eqs.(A1)–(A6). By adopting standard states for pure mineralsand H2O of unit activity of the pure phase at any P andT, four constraints are provided by the mass-action expres-sions for Eqs. (A1)–(A6):
K5 ¼ aHþaOH& ðA13ÞK6 ¼ aHSiO3
&aHþ ðA14Þ
2936 A. Wohlers et al. /Geochimica et Cosmochimica Acta 75 (2011) 2924–2939

and, in the albite stability field,
K1 ¼aNaþ
aHþ
! "2
ðA15Þ
K2 ¼ ðaAlO2&aHþÞ&2 ðA16Þ
or, in the jadeite stability field,
K3 ¼aNaþ
aHþ
! "2
ðA17Þ
K4 ¼ ðaAlO -2aHþÞ&2 ðA18Þ
where a is the activity of the subscripted species or phase.The final constraint is provided by the charge balancerequirement:
mHþ þ mNaþ & mOH& & mAlO&2& mHSiO3
& ¼ 0 ðA19Þ
Species concentrations may be substituted for activitiesin Eqs. (A13)–(A18) using ai = cimi, where ci is activitycoefficient of the subscripted species, by using a standardstate for aqueous species of unit activity of the hypothetical1 m solution. Ion activity coefficients were calculated fromthe Guntelberg equation:
Logci ¼ & Az2iffiffiI
p
1þffiffiI
p ðA20Þ
where z is ion charge, I is ionic strength, and A is the solventparameter, here assumed to be unity following argumentsof Manning (1998, 2007). The Guntelberg equation wasused because of its simplicity and has been proven accuratein independent studies at these conditions (Manning, 2007;Wohlers and Manning, 2009). Because our analysis in-volves only monovalent ions, ci ¼ c1, and Eq. (A20) simpli-fies to log c1 ¼ &
ffiffiI
p=ð1þ
ffiffiI
pÞ. This leads to the following
expressions for charged species concentrations in the albitestability field:
mHþ ¼ 1
c1
K5 þ K&1=22 þ K6
K1=21 þ 1
!
ðA21Þ
mOH& ¼ K5
c21mHþðA22Þ
mAlO&2¼ 1
c21mHþK1=22
ðA23Þ
mNaþ ¼ K1=21 mHþ ðA24Þ
mHSiO3& ¼ K6
c21mHþðA25Þ
Charged species concentrations in the jadeite stability fieldare derived by substituting K3 for K1 and K4 for K2 in theabove equations. The concentrations of neutral species fol-low from these equations and the assumption of unit activ-ity coefficients (Walther and Helgeson, 1977; Manning,1998, 2007; Newton and Manning, 2003, 2008; Wohlersand Manning, 2009):
mHAlO2;aq¼
c21mHþmAlO&2
K7ðA26Þ
mNaOHaq ¼c21mNaþmOH&
K8ðA27Þ
mNaAlO2;aq¼
c21mNaþmAlO&2
K9ðA28Þ
mNaHSiO3;aq¼ mNaOHaqK10 ðA29Þ
mSiO2;aq¼ K11 ðA30Þ
mSi2O4;aq¼ mSiO2;aq
K12 ðA31Þ
Derivation of equilibrium constants for Eqs. (A1)–(A10)follows methods described by Manning (1998, 2007), Woh-lers and Manning (2009), and Manning et al. (2010). Equi-librium constants were calculated in increments of 50 MPafrom 0.3 to 0.5 GPa using thermodynamic data of Hollandand Powell (1998; 2002 update) for minerals and Pokrovskiiand Helgeson (1997) for aqueous species. We used the Haaret al. (1984) equation of state of H2O to ensure consistencywith the thermodynamic properties of aqueous species de-rived within this framework. As illustrated in Fig. A1, alllog Ks vary linearly with the logarithm of H2O density.Accordingly, log K values at experimental conditions wereobtained by linear extrapolation from 0.3 to 0.5 GPa (Ta-ble 3 and Fig. A1). Values for log K5 and log K6 derived thisway imply incorrect P of Eq. (1). We found that, in detail,the trends in these log K values with log qH2O
were slightlynonlinear. We therefore adopted an alternative approachin which internal consistency was insured by obtaininglog K3 and log K4 from extrapolated log K1 and log K2 via
LogK3 ¼ log K1 & 3 log Kajq ðA32ÞLogK4 ¼ log Kajq & log K2 ðA33Þ
where Kajq is the equilibrium constants for Eq. (1), text.Equilibrium constants for Eqs. (A11) and (A12) werederived from the standard Gibbs free energy of quartz
-15
-10
-5
0
5
10
15
-0.1 -0.05 0 0.05 0.1log H2O
log K
1.43GPa
3Qz + 2Na+
H2O = H+ + OH-
HAlO2 = H+ + AlO2-
NaAlO2 = Na+ + AlO -
3Ab + 2H+ = Pg + 6Qz + 2Na+
NaOH = Na + OH-aq +
500°C
3Jd + 2H = Pg ++
ρ
Fig. A1. Variation in log K with log qH2Oat 500 !C for represen-
tative equilibria (see text). Symbols represent calculated log K from0.3 to 0.5 GPa, at 0.05 GPa increments. The log K values varylinearly with log qH2O (cf. Manning, 1998, 2007). Dashed linesshow linear extrapolations to 2.25 GPa; the dash-dot line repre-sents log K1 & 3log Kajq (see text).
Solubility of albite and jadeite at high P and T 2937

(Holland and Powell, 1998; 2002 update), quartz solubilityfrom Manning (1994), and the silica speciation model ofNewton and Manning (2002, 2003). It was assumed thatthe pressure dependence of the monomer-dimer reaction(Eq. (A12)), determined at 700 !C by Newton and Manning(2002), is independent of temperature.
REFERENCES
Anderson G. M. and Burnham C. W. (1965) The solubility ofquartz in supercritical water. Am. J. Sci. 263, 494–511.
Anderson G. M. and Burnham C. W. (1983) Feldspar solubilityand the transport of aluminum under metamorphic conditions.Am. J. Sci. 283, 283–297.
Ague J. J. (1994a) Mass-transfer during Barrovian metamorphismof pelites, south-central Connecticut: 1. Evidence for changes incomposition and volume. Am. J. Sci. 294, 989–1057.
Ague J. J. (1994b) Mass-transfer during Barrovian metamorphismof pelites, south-central Connecticut: 2. Channelized fluid-flowand the growth of staurolite and kyanite. Am. J. Sci. 294, 1061–1134.
Ague J. J. (1995) Deep-crustal growth of quartz, kyanite and garnetinto large-aperture, fluid-filled fractures, north-eastern Con-necticut, USA. J. Metamorph. Geol. 13, 299–314.
Ague J. J. (1997) Crustal mass transfer and index mineral growth inBarrow’s garnet zone, northeast Scotland. Geology 25, 73–76.
Ague J. J. (2003) Fluid infiltration and transport of major, minor,and trace elements during regional metamorphism of carbonaterocks, Wepawaug Schist, Connecticut, USA. Am. J. Sci. 303,753–816.
Antignano A. and Manning C. E. (2008) Rutile solubility in H2O,H2O–SiO2 and H2O–NaAlSi3O8 at 0.7–2.0 GPa and 700–1000 !C: implications for mobility of nominally insolubleelements in geologic fluids. Chem. Geol. 255, 283–293.
Ayers J. C. and Watson E. B. (1991) Solubility of apatite,monazite, zircon, and rutile in supercritical aqueous fluids withimplications for subduction zone geochemistry. Philos. Trans.R. Soc. Lond. A 335, 365–375.
Boettcher A. L. and Wyllie P. J. (1969) Phase relationships in thesystem NaAlSiO4–SiO2–H2O to 35 kilobars pressure. Am. J.Sci. 267, 875–909.
Chatterjee N. D. (1972) The upper stability limit of the assemblageparagonite + quartz and its natural occurrences. Contrib. Min-eral. Petrol. 34, 288–303.
Coleman R. G. (1961) Jadeite deposits of the Clear Creek area,New Idria District, San Benito County, California. J. Petrol. 2,209–247.
Currie K. L. (1968) On the solubility of albite in supercritical waterin the range 400 to 600 !C and 750 to 3500 bars. Am. J. Sci. 266,321–341.
Fockenberg T., Burchard M. and Maresch W. V. (2006) Experi-mental determination of the solubility of natural wollastonite inpure water up to pressures of 5 GPa and at temperatures of400–800 !C. Geochim. Cosmochim. Acta 70, 1796–1806.
Fockenberg T., Burchard M. and Maresch W. V. (2008) Thesolubility of natural grossular-rich garnet in pure water at highpressures and temperatures. Eur. J. Mineral. 20, 845–855.
Haar L., Gallagher J. S. and Kell G. S. (1984) NBSINRC steamTables. Hemisphere, New York, P., 320.
Hays J. F. and Bell P. M. (1973) Albite–jadeite–quartz equilibrium:a hydrostatic determination. Carnegie Inst. Wash. Yearbook 72,706–708.
Hemley J. J., Meyer C. and Richter D. H. (1961) Some alterationreactions in the system Na2O–Al2O3–SiO2–H2O. U.S. Geol.Survey Professional Paper 434D, pp. 338–340.
Holland T. J. B. (1980) The reaction albite = jadeite + quartzdetermined experimentally in the range 600–1200 !C. Am.Mineral. 65, 129–134.
Holland T. J. B. and Powell R. (1998) An internally consistentthermodynamic data set for phases of petrological interest. J.Metamorph. Geol. 16, 309–343.
Luth W. C. (1968) The influence of pressure on the composition ofeutectic liquids in the binary systems sanidine silica and albite–silica. Carnegie Inst. Wash. Yearbook 66, 480–484.
Luth W. C., Jahns R. H. and Tuttle O. F. (1964) The granite systemat pressures of 4 to 10 kilobars. J. Geophys. Res. 69, 759–773.
Manning C. E. (1994) The solubility of quartz in H2O in the lowercrust and upper mantle. Geochim. Cosmochim. Acta 58, 4831–4839.
Manning C. E. (1998) Fluid composition at the blueschist–eclogitetransition in the model system Na2O–Al2O3–SiO2–H2O–HCl.Schweiz. Mineral. Petrogr. Mitt. 78, 225–242.
Manning C. E. (2004) The chemistry of subduction-zone fluids.Earth Planet. Sci. Lett. 223, 1–16.
Manning C. E. (2007) Solubility of corundum + kyanite in H2O at700 !C and 10 kbar: evidence for Al–Si complexing at highpressure and temperature. Geofluids 7, 258–269.
Manning C. E. and Boettcher S. L. (1994) Rapid-quench hydro-thermal experiments at mantle pressures and temperatures. Am.Mineral. 79, 1153–1158.
Manning C. E., Wilke M., Schmidt C. and Cauzid J. (2008) Rutilesolubility in albite-H2O and Na2Si3O7-H2O at high tempera-tures and pressures by in-situ synchrotron radiation micro-XRF. Earth Planet. Sci. Lett. 272, 730–737.
Manning C. E., Antignano A. and Lin H. A. (2010) Premeltingpolymerization of crustal and mantel fluids, as indicated by thesolubility of albite + paragonite + quartz in H2O at 1 GPa and350–620 !C. Earth Planet. Sci. Lett. 292, 325–336.
Mibe K., Chou I. M. and Bassett W. A. (2008) In situ Ramanspectroscopic investigation of the structure of subduction-zonefluids. J. Geophys. Res. 113, 1–8.
Morey G. W. and Hesselgesser J. M. (1951) The solubility of someminerals in superheated steam at high pressures. Econ. Geol. 46,821–835.
Morey G. W. and Chen W. T. (1955) The action of hot water onsome feldspars. Am. Mineral. 40, 996–1000.
Mysen B. O. (1998) Interaction between aqueous fluid andsilicate melt in the pressure and temperature regime of theEarth’s crust and upper mantle. Neues Jahrb. Mineral. Abh.172, 227–244.
Newton R. C. and Manning C. E. (2002) Solubility of ensta-tite + forsterite in H2O at deep crust/upper mantle conditions: 4to 15 kbar and 700 to 900 !C. Geochim. Cosmochim. Acta 66,4165–4176.
Newton R. C. and Manning C. E. (2003) Activity coefficient andpolymerization of aqueous silica at 800 !C, 12 kbar, fromsolubility measurements on SiO2-buffering mineral assemblages.Contrib. Mineral. Petrol. 146, 135–143.
Newton R. C. and Manning C. E. (2006) Solubilities of corundum,wollastonite and quartz in H2O–NaCl solutions at 800 !C and10 kbar: interaction of simple minerals with brines at highpressure and temperature. Geochim. Cosmochim. Acta 70, 5571–5582.
Newton R. C. and Manning C. E. (2007) Solubility of grossular,Ca3Al2Si3O12, in H2O–NaCl solutions at 800 !C and 10 kbar,and the stability of garnet in the system CaSiO3–Al2O3–H2O–NaCl. Geochim. Cosmochim. Acta 71, 5191–5202.
Newton R. C. and Manning C. E. (2008) Thermodynamics ofSiO2–H2O fluid near the upper critical end point from quartzsolubility measurements at 10 kbar. Earth Planet. Sci. Lett. 274,241–249.
2938 A. Wohlers et al. /Geochimica et Cosmochimica Acta 75 (2011) 2924–2939

Newton R. C., Manning C. E., Hanchar J. M. and Finch R. J.(2005) Free energy of formation of zircon from aqueoussolubility measurements at high temperature and pressure. J.Am. Ceram. Soc. 88, 1854–1858.
Newton R. C., Manning C. E., Hanchar J. M. and Colasanti C. V.(2010) Free energy of formation of zircon based on solubilitymeasurements at high temperature and pressure. Am. Mineral.95, 52–58.
Oelkers R. H., Benezeth P. and Pokrovski G. S. (2009) Thermo-dynamic databases for water–rock interaction. Rev. Mineral.Geochem. 70, 1–46.
Pokrovskii V. A. and Helgeson H. C. (1997) Thermodynamicproperties of aqueous species and solubilities of minerals athigh pressure and temperatures: the system Al2O3–H2O–KOH.Chem. Geol. 137, 221–242.
Ryabchikov I. D. and MacKenzie W. S. (1985) Interaction ofjadeite with water at 20–30 kbar and 650 !C. Mineral. Mag. 49,601–603.
Ryabchikov I. D. and Boettcher A. L. (1980) Experimentalevidence at high pressure for potassic metasomatism in themantle of the Earth. Am. Mineral. 65, 915–919.
Ryabchikov I. D., Schreyer W. and Abraham K. (1982) Compo-sitions of aqueous fluids in equilibrium with pyroxenes andolivines at mantle pressures and temperatures. Contrib. Mineral.Petrol. 79, 80–84.
Salvi S., Pokrovski G. S. and Schott J. S. (1998) Experimentalinvestigation of aluminum–silica aqueous complexing at300 !C. Chem. Geol. 151, 51–67.
Schneider M. E. and Eggler D. H. (1986) Fluids in equilibrium withperidotite minerals: implications for mantle metasomatism.Geochim. Cosmochim. Acta 50, 711–724.
Shock E. L., Sassani D. C., Willis M. and Sverjensky D. A. (1997)Inorganic species in geologic fluids: correlations among stan-dard molal thermodynamic properties of aqueous ions andhydroxide complexes. Geochim. Cosmochim. Acta 61, 907–950.
Shmulovich K., Graham C. and Yardley B. (2001) Quartz, albiteand diopside solubilities in H2O–NaCl and H2O–CO2 fluids at0.5–0.9 GPa. Contrib. Mineral. Petrol. 141, 95–108.
Stalder R., Ulmer P., Thompson A. B. and Guenther D. (2000)Experimental approach to constrain second critical end points
in fluid/silicate systems: near-solidus fluids and melts in thesystem albite–H2O. Am. Mineral. 85, 68–77.
Sverjensky D. A., Shock E. L. and Helgeson H. C. (1997)Prediction of the thermodynamic properties of aqueous metalcomplexes to 1000 !C and 5 kb. Geochim. Cosmochim. Acta 61,1359–1412.
Syracuse E. M., van Keken P. E. and Abers G. A. (2010) Theglobal range of subduction zone thermal models. Phys. EarthPlanet. Int. 183, 73–90.
Tropper P. and Manning C. E. (2007) The solubility of corundumin H2O at high pressure and temperature and its implicationsfor Al mobility in the deep crust and upper mantle. Chem. Geol.240, 54–60.
Walther J. V. and Helgeson H. C. (1977) Calculation of thethermodynamic properties of aqueous silica and the solubilityof quartz and its polymorphs at high pressures and tempera-tures. Am. J. Sci. 277, 1315–1351.
Wang H. M., Henderson G. S. and Brenan J. M. (2004) Measuringquartz solubility by in situ weight-loss determination using ahydrothermal diamond anvil cell. Geochim. Cosmochim. Acta68, 5197–5204.
Wohlers A. and Manning C. E. (2009) Solubility of corundum inaqueous KOH solutions at 700 !C and 1 GPa. Chem. Geol. 262,326–333.
Woodland A. B. and Walther J. V. (1987) Experimental determi-nation of the solubility of the assemblage paragonite, albite,and quartz in supercritical H2O. Geochim. Cosmochim. Acta 51,365–372.
Zhang Y. G. and Frantz J. D. (2000) Enstatite–forsterite–waterequilibria at elevated temperatures and pressures. Am. Mineral.85, 918–925.
Zotov N. and Keppler H. (2000) In-situ Raman spectra ofdissolved silica species in aqueous fluids to 900 !C and 14 kbar.Am. Mineral. 85, 600–604.
Zotov N. and Keppler H. (2002) Silica speciation in aqueous fluidsat high pressures and temperatures. Chem. Geol. 184, 71–82.
Associate editor: Eric H. Oelkers
Solubility of albite and jadeite at high P and T 2939