Experimental Investigation of the Natural Bonding Strength ...
16
applied sciences Article Experimental Investigation of the Natural Bonding Strength between Stay-In-Place Form and Concrete in FRP-Concrete Decks/Beams Jianwu Gong 1 , Xingxing Zou 2, * and Ping Xia 1 1 School of Urban Construction, Wuhan University of Science and Technology, Hubei 430065, China; [email protected] (J.G.); [email protected] (P.X.) 2 Department of Civil, Architectural & Environmental Engineering, Missouri University of Science and Technology, Rolla, MO 65409, USA * Correspondence: [email protected] Received: 29 January 2019; Accepted: 23 February 2019; Published: 4 March 2019 Featured Application: This paper presents an experimental investigation of the natural bonding strength between FRP profiles and in situ cast concrete in FRP-concrete hybrid decks and beams. Abstract: The Fiber Reinforced Polymer (FRP)-concrete hybrid deck/beam is a structural system that combines the durable thin-walled FRP composite profiles and the cost-effective concrete by interfacial shear connections. The interfacial slip can reduce the composite action, thereby causing a degradation of flexural rigidity and capacity. Therefore, using stay-in-place (SIP) forms is a simple way to fully utilize the natural bonding between FRP and concrete, which plays a pivotal role in the structural design of FRP-concrete hybrid decks/beams. This paper presents an experimental study on the natural bonding provided by the SIP forms and the in situ cast concrete. First, four comparative push-out test specimens revealed that the use of SIP forms could improve the ultimate shear capacity of steel bolts by 11.1%. Moreover, it could provide an initial stage with nearly zero slip. The average natural bonding strength of FRP-concrete was evaluated as 0.27 MPa, which agreed well with previous tests in the literature. Second, the beam specimen also confirmed that there was a load response stage with nearly zero slip along the FRP-concrete interface when SIP forms were used as the permanent form. Third, the strain measurements on the steel bolts, FRP profile, and concrete revealed that the failure of the natural bonding was a brittle process. Finally, the flexural response of the FRP-concrete hybrid beam was analytically modeled as three distinct stages, namely the full composite action stage, the slipping stage caused by a natural bonding decrease, and the partial composite action stage. Keywords: FRP-concrete hybrid decks/beams; natural bonding; composite action; stay-in-place (SIP) forms 1. Introduction The advantageous properties of light-weight, high tensile strength along the fiber direction, and durability under harsh environments have made fiber reinforced polymer (FRP) composites an advanced and competitive solution to repair and retrofit civil engineering structures [1–3]. There has been an increasing number of field applications using FRP bars and sheets to replace steel bars [1–10] and to strengthen existing structures [11,12]. FRP thin-walled profiles have also been put into field applications of newly built pedestrians, or to replace the old decks of small and medium span bridge superstructures [13–15]. Despite the excellent properties of FRP composites, they show specific disadvantages when compared with traditional construction materials (e.g., concrete and Appl. Sci. 2019, 9, 913; doi:10.3390/app9050913 www.mdpi.com/journal/applsci
Transcript of Experimental Investigation of the Natural Bonding Strength ...
applied sciences
Article
Experimental Investigation of the Natural BondingStrength between Stay-In-Place Form and Concretein FRP-Concrete Decks/Beams
Jianwu Gong 1, Xingxing Zou 2,* and Ping Xia 1
1 School of Urban Construction, Wuhan University of Science and Technology, Hubei 430065, China;[email protected] (J.G.); [email protected] (P.X.)
2 Department of Civil, Architectural & Environmental Engineering, Missouri University of Science andTechnology, Rolla, MO 65409, USA
* Correspondence: [email protected]
Received: 29 January 2019; Accepted: 23 February 2019; Published: 4 March 2019
Featured Application: This paper presents an experimental investigation of the natural bondingstrength between FRP profiles and in situ cast concrete in FRP-concrete hybrid decks and beams.
Abstract: The Fiber Reinforced Polymer (FRP)-concrete hybrid deck/beam is a structural systemthat combines the durable thin-walled FRP composite profiles and the cost-effective concrete byinterfacial shear connections. The interfacial slip can reduce the composite action, thereby causing adegradation of flexural rigidity and capacity. Therefore, using stay-in-place (SIP) forms is a simpleway to fully utilize the natural bonding between FRP and concrete, which plays a pivotal role inthe structural design of FRP-concrete hybrid decks/beams. This paper presents an experimentalstudy on the natural bonding provided by the SIP forms and the in situ cast concrete. First, fourcomparative push-out test specimens revealed that the use of SIP forms could improve the ultimateshear capacity of steel bolts by 11.1%. Moreover, it could provide an initial stage with nearly zeroslip. The average natural bonding strength of FRP-concrete was evaluated as 0.27 MPa, which agreedwell with previous tests in the literature. Second, the beam specimen also confirmed that there was aload response stage with nearly zero slip along the FRP-concrete interface when SIP forms were usedas the permanent form. Third, the strain measurements on the steel bolts, FRP profile, and concreterevealed that the failure of the natural bonding was a brittle process. Finally, the flexural responseof the FRP-concrete hybrid beam was analytically modeled as three distinct stages, namely the fullcomposite action stage, the slipping stage caused by a natural bonding decrease, and the partialcomposite action stage.
Keywords: FRP-concrete hybrid decks/beams; natural bonding; composite action; stay-in-place(SIP) forms
1. Introduction
The advantageous properties of light-weight, high tensile strength along the fiber direction,and durability under harsh environments have made fiber reinforced polymer (FRP) composites anadvanced and competitive solution to repair and retrofit civil engineering structures [1–3]. Therehas been an increasing number of field applications using FRP bars and sheets to replace steelbars [1–10] and to strengthen existing structures [11,12]. FRP thin-walled profiles have also beenput into field applications of newly built pedestrians, or to replace the old decks of small and mediumspan bridge superstructures [13–15]. Despite the excellent properties of FRP composites, they showspecific disadvantages when compared with traditional construction materials (e.g., concrete and
Appl. Sci. 2019, 9, 913; doi:10.3390/app9050913 www.mdpi.com/journal/applsci

Appl. Sci. 2019, 9, 913 2 of 16
steel) [16]. FRP composites have a higher strength but lower modulus when compared with steel,which makes the structural design of FRP structures usually governed by rigidity and deformation [1].Therefore, properly combining FRP with traditional materials to make economic and reliable structuralcomponents has been a more pressing research topic of late [17,18]. Among the various combinationsof FRP and concrete, the FRP-concrete hybrid deck/beam system is one of the structures that hasbeen developed both in laboratory research and field applications [19–22]. Herein, the definition ofa FRP-concrete hybrid deck/beam is a deck or a beam consisting of thin-walled FRP profiles at thebottom that are connected to a solid concrete slab on the upper part. In the market of bridge decks andgirders, the FRP-concrete hybrid deck/beam can result in an advanced and cost-effective solution bycombining the reasonable stiffness and low cost of concrete with the light-weight, fast fabrication, highstrength, and high durability of FRP composites [23,24]. More importantly, after taking into accountthe lower cost of transportation, easier installation, and low or even no maintenance cost, the highinitial cost of FRP can be compensated, which makes the hybrid system more competitive in the marketfor decks of different spans and girders for short span bridges [25–28].
Similar to steel-concrete composite decks and beams, a FRP-concrete hybrid deck/beam needsstrong composite action to obtain a high structural performance. Additionally, it has been revealed thatstrong composite action between FRP and concrete can maximize the use of the tensile strength of FRPand compressive strength of concrete [29–31]. Therefore, the shear connection along the FRP-concreteinterface has been a research topic that has attracted more attention since 1994 [32–35]. A simpleway to improve the connection capacity and reduce the slip is to use strong and stiff connectionssuch as polymeric adhesives [20], coated sands on FRP profiles [20], perforated FRP ribs [25,32],and FRP shear keys [29,34]. However, since FRP cannot be welded easily like steel, FRP-concreteinterfacial connections usually have a lower shear capacity and slip modulus when compared with theconnections in steel-concrete hybrid components [25,29–31,35–38]. The connection types, for example,steel studs, perfobond ribs, and channel plates, in steel-composite decks and beams cannot be directlyused for FRP-concrete hybrid decks/beams as the interfacial slip can cause notable flexural rigiditydegradation and normal stresses increase at the FRP and concrete parts. Furthermore, the interfacialslip and separation can weaken the performances of FRP-concrete hybrid beams under fatigue [39],aggressive exposure [39], dynamic [40], and creep [40,41] scenarios. Therefore, how to improve thecomposite action between FRP and concrete plays a pivotal role in the improvement of the structuraldesign of a FRP-concrete hybrid beam. However, all of the aforementioned connections can entailextra costs due to the use of more materials and complicated installations. The paper returns to thebasic bond mechanism: the natural bonding between the FRP profiles and the in situ cast concrete.As has been experimentally revealed by Yuan and Hadi, the initial bonding between the I-shape FRPand concrete ranges from 0.30 to 0.51 MPa [42]. However, their test used the I-shape FRP profilesencased by concrete, which is not the design of the FRP-concrete deck or beam. As steel bolts are themost commonly used connection, this paper will research the natural bonding when steel bolts areused. Moreover, stay-in-place (SIP) forms were used as a solution to improve the shear capacity ofthe natural bonding and to eliminate the need for temporary forms [26,43]. Comparative push-outtests and flexural tests were conducted to prove that this natural bonding could bring a nearly fullcomposite action when the load was under a certain level. The result can be used for designing theflexural stiffness under a serviceability state.
2. Experimental Determination of FRP-Concrete Natural Bonding by the Push-Out Test
2.1. Material Properties and Setup of the Push-Out Test
To estimate the bond strength between the FRP profile and concrete, a push-out test of fourFRP-concrete connection specimens (see Figure 1 and Table 1) was conducted. As a comparison,specimens S-1,2 were equipped with steel bolts as the interfacial connection and specimens S-3,4were equipped with the SIP form and steel bolts together. The geometric dimensions of the concrete

Appl. Sci. 2019, 9, 913 3 of 16
blocks were 150 mm thick, 300 mm width, and 500 mm high (Figure 1e). The thickness of the flangesand webs of the FRP profiles was 10 mm. At the corner of the flange-web junctions, the radius was10 mm. The SIP form was a plate with a thickness of 10 mm, a width of 300 mm, and 500 mm height(Figure 1b,d,e). All of the parameters can be seen in Table 1 and Figure 1.
The FRP I-profiles and SIP forms were produced by pultrusion manufacturing. UnidirectionalE-glass fibers were used as the main reinforcement while fiber mats were used in the outer layersto create smooth surfaces. Unidirectional fibers were oriented at zero degree to the longitudinaldirection and the glass fiber continuous strand mat was randomly oriented. Unsaturated polyesterresin was used as the matrix, and additives made of CaCO3 powders, weighted about 20% of thematrix, were added to lower the cost according to the manufacturer’s design. The fiber content was55% in volume according to the data provided by the manufacturer. The fiber layups and fractions ofthe additives in the matrix varied across the FRP I-profiles and SIP forms, so the material propertieswere not the same. The material properties of the FRP are reported in Table 2, according to thedata provided by the manufacturer. The compressive strength of concrete was tested using twelve150 × 150 × 150 mm3 cubic coupons cured at the same conditions as the push-out test specimens.Tests showed that the concrete had an average compressive strength of 35.38 MPa, with a coefficientof variation (CoV, also known as the relative standard deviation) of 0.207. The embedded length ofbolts, (from the top of the steel bolt to the surface of the FRP) in the concrete block was 100 mm for allspecimens. One day before casting the concrete, the surface of the SIP and FRP were cleaned usingalcohol. The diameter of the bolt shank and the predrilled holes was 10 mm and 10.5 mm, respectively.The steel bolts were fixed into the holes by two washers and two nuts, with a predefined torque of50 kN·m. The torque was applied and controlled by a torque trench. Steel washers, with an outerdiameter of 32 mm, an inner diameter of 12.5 mm, and a thickness of 1 mm were used to disperse thestress caused by prestressing the steel bolts. There was a thin layer of bond adhesives between the SIPform and FRP girders. The bond adhesive used was a commercially available product in China thatconsists of a 1:1 ratio of epoxy resin to curing agent in mass. According to the manufacturer’s data,the tensile strength of the adhesive is larger than 14 MPa. Reinforcing bars were made of ribbed steelwith a yield strength of 235 MPa. The vertical bars had a diameter of 10 mm and the transversal barshad a diameter of 6 mm. Six LVDTs were positioned at opposite sides of the concrete block and FRPwebs, capturing the average slip between the FRP girder segment and concrete. The load was appliedto the push-out specimens via a calibrated 5000 kN capacity universal testing machine.
Table 1. Parameters and test results (ultimate load and slip) of the push-out test specimens.
SpecimenCode
Type ofConnection
Spacing ofBolts (mm)
BoltNumber Pu (kN) su (mm) Pub (kN)
S-1 Steel bolts 150 8 205 5.54 25.63S-2 Steel bolts 100 12 300 4.58 25.00S-3 Steel bolts & SIP 150 8 220 4.61 27.50S-4 Steel bolts & SIP 100 12 345 6.45 28.75

Appl. Sci. 2019, 9, 913 4 of 16Appl. Sci. 2019, 9, x FOR PEER REVIEW 4 of 16
Appl. Sci. 2019, 9, x; doi: FOR PEER REVIEW www.mdpi.com/journal/applsci
Figure 1. Illustration of a push-out test specimen (unit in mm): (a) Half cross section of specimens S-1,2; (b) Half cross section of specimens S-3,4; (c) Half illustration of vertical cross section of S-2; (d) Half illustration of vertical cross section of S-4 (note that ‘Sym’ denotes the ‘symmetric line’); (e) Schematic graph of push-out test of specimen S-2; and (f) Cross section of the FRP segment.
Table 2. Material properties of the FRP profiles.
Longitudinal
tensile strength
Longitudinal tensile
modulus
Longitudinal compressive
strength
Longitudinal compressive
modulus
Shear strength
FRP girder 420 MPa 25 GPa 350 MPa 13 GPa 11.8 MPa SIP forms 390 MPa 22 GPa 350 MPa 12 GPa 13.5 MPa
2.2. Experimental Observations of the Push-out Test
There was one common failure mode for all four specimens, namely the shear fracture of the steel bolts (Figure 2). This failure mode has also been found in other push-out tests [43,44] when the strength of the steel bolts is not high. The ultimate load (𝑃 ) and ultimate slip (𝑠 ) of each specimen can be seen in Table 1. Since it is difficult to evaluate the performance by 𝑃 because the bolt number (𝑛) of each specimen varies, the load per bolt (𝑃 , computed as 𝑃 /𝑛) was calculated and listed in Table 1. The average 𝑃 of specimens S-1,2 was 25.32 kN while the average 𝑃 of specimens S-3,4 was 28.13 kN, which was 11.1% higher than that of S-1,2. Therefore, it can be concluded that using SIP forms can slightly improve the ultimate shear capacity.
Figure 3 shows the load-slip curves for all of the specimens. There were three distinct stages in specimens S-3,4: the non-slip stage, the debonding stage, and the bearing stage. Apparently, there were two different load-slip phases in specimens S-3,4 when compared with specimens S-1,2. In the non-slip stage, the load increased while the slip remained close to zero, which was caused by the initial natural bonding between the FRP and concrete. In the debonding stage, the load decreased dramatically while the slip increased suddenly, which was caused by the release of the natural bonding strength. After the debonding phase, both the load and slip increased gradually until the
Figure 1. Illustration of a push-out test specimen (unit in mm): (a) Half cross section of specimens S-1,2;(b) Half cross section of specimens S-3,4; (c) Half illustration of vertical cross section of S-2; (d) Halfillustration of vertical cross section of S-4 (note that ‘Sym’ denotes the ‘symmetric line’); (e) Schematicgraph of push-out test of specimen S-2; and (f) Cross section of the FRP segment.
Table 2. Material properties of the FRP profiles.
LongitudinalTensile
Strength
LongitudinalTensile
Modulus
LongitudinalCompressive
Strength
LongitudinalCompressive
ModulusShear Strength
FRP girder 420 MPa 25 GPa 350 MPa 13 GPa 11.8 MPaSIP forms 390 MPa 22 GPa 350 MPa 12 GPa 13.5 MPa
2.2. Experimental Observations of the Push-Out Test
There was one common failure mode for all four specimens, namely the shear fracture of thesteel bolts (Figure 2). This failure mode has also been found in other push-out tests [43,44] when thestrength of the steel bolts is not high. The ultimate load (Pu) and ultimate slip (su) of each specimencan be seen in Table 1. Since it is difficult to evaluate the performance by Pu because the bolt number(n) of each specimen varies, the load per bolt (Pub, computed as Pu/n) was calculated and listed inTable 1. The average Pub of specimens S-1,2 was 25.32 kN while the average Pub of specimens S-3,4was 28.13 kN, which was 11.1% higher than that of S-1,2. Therefore, it can be concluded that using SIPforms can slightly improve the ultimate shear capacity.
Figure 3 shows the load-slip curves for all of the specimens. There were three distinct stages inspecimens S-3,4: the non-slip stage, the debonding stage, and the bearing stage. Apparently, there weretwo different load-slip phases in specimens S-3,4 when compared with specimens S-1,2. In the non-slipstage, the load increased while the slip remained close to zero, which was caused by the initial naturalbonding between the FRP and concrete. In the debonding stage, the load decreased dramatically whilethe slip increased suddenly, which was caused by the release of the natural bonding strength. Afterthe debonding phase, both the load and slip increased gradually until the bolt shank fracture of the

Appl. Sci. 2019, 9, 913 5 of 16
bolts, which was called the bearing stage and the load was only carried by the steel bolts. The load-slipcurves of specimens of S-3,4 are depicted in Figure 3. The characteristic loads and slips of the abovethree stages can be found in Table 3.
Appl. Sci. 2019, 9, x FOR PEER REVIEW 5 of 16
Appl. Sci. 2019, 9, x; doi: FOR PEER REVIEW www.mdpi.com/journal/applsci
bolt shank fracture of the bolts, which was called the bearing stage and the load was only carried by the steel bolts. The load-slip curves of specimens of S-3,4 are depicted in Figure 3. The characteristic loads and slips of the above three stages can be found in Table 3.
Figure 2. Typical failure mode for the push-out test specimens.
Figure 3. The load-slip curves for all of the specimens.
In Table 3, it can be seen that the non-slip stage shear capacity of the SIP-concrete block for specimens S-3 and S-4 was 184 kN and 200 kN, respectively. The load drop from the end of the non-slip stage to the end of the debonding stage for specimens S-3 and S-4 was 83 kN (from 184 to 101) and 86 kN (from 200 to 114), respectively. Therefore, the average value of the shear force carried by the natural bonding was 84.5 kN with a small variation. Assuming that the load drop was only caused by the release of the natural bonding and the shear stress distributed uniformly along the SIP surface, the interfacial shear strength, 𝜏 , can be obtained by dividing the load drop by the surface area of the SIP form (2 × 300 mm × 500 mm), which gave an average value of 0.27 MPa. It should be noted that in the test in [42], the shear stress was not distributed uniformly, to be specific, it was higher in the middle and lower at both ends, so the 𝜏 underestimated the bond shear strength.
Figure 2. Typical failure mode for the push-out test specimens.
Appl. Sci. 2019, 9, x FOR PEER REVIEW 5 of 16
Appl. Sci. 2019, 9, x; doi: FOR PEER REVIEW www.mdpi.com/journal/applsci
bolt shank fracture of the bolts, which was called the bearing stage and the load was only carried by the steel bolts. The load-slip curves of specimens of S-3,4 are depicted in Figure 3. The characteristic loads and slips of the above three stages can be found in Table 3.
Figure 2. Typical failure mode for the push-out test specimens.
Figure 3. The load-slip curves for all of the specimens.
In Table 3, it can be seen that the non-slip stage shear capacity of the SIP-concrete block for specimens S-3 and S-4 was 184 kN and 200 kN, respectively. The load drop from the end of the non-slip stage to the end of the debonding stage for specimens S-3 and S-4 was 83 kN (from 184 to 101) and 86 kN (from 200 to 114), respectively. Therefore, the average value of the shear force carried by the natural bonding was 84.5 kN with a small variation. Assuming that the load drop was only caused by the release of the natural bonding and the shear stress distributed uniformly along the SIP surface, the interfacial shear strength, 𝜏 , can be obtained by dividing the load drop by the surface area of the SIP form (2 × 300 mm × 500 mm), which gave an average value of 0.27 MPa. It should be noted that in the test in [42], the shear stress was not distributed uniformly, to be specific, it was higher in the middle and lower at both ends, so the 𝜏 underestimated the bond shear strength.
Figure 3. The load-slip curves for all of the specimens.
In Table 3, it can be seen that the non-slip stage shear capacity of the SIP-concrete block forspecimens S-3 and S-4 was 184 kN and 200 kN, respectively. The load drop from the end of the non-slipstage to the end of the debonding stage for specimens S-3 and S-4 was 83 kN (from 184 to 101) and86 kN (from 200 to 114), respectively. Therefore, the average value of the shear force carried by thenatural bonding was 84.5 kN with a small variation. Assuming that the load drop was only caused bythe release of the natural bonding and the shear stress distributed uniformly along the SIP surface,the interfacial shear strength, τbond, can be obtained by dividing the load drop by the surface area ofthe SIP form (2 × 300 mm × 500 mm), which gave an average value of 0.27 MPa. It should be notedthat in the test in [42], the shear stress was not distributed uniformly, to be specific, it was higher in themiddle and lower at both ends, so the τbond underestimated the bond shear strength.
Appl. Sci. 2019, 9, 913 6 of 16
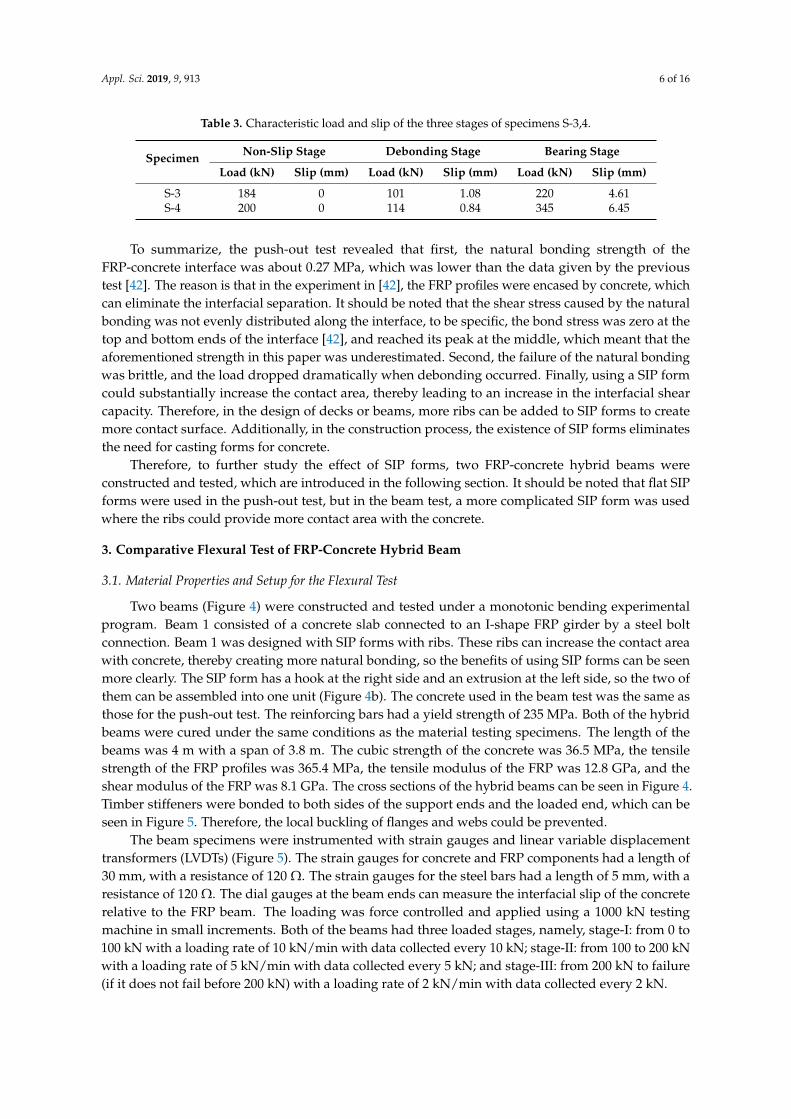
Table 3. Characteristic load and slip of the three stages of specimens S-3,4.
Specimen Non-Slip Stage Debonding Stage Bearing Stage
Load (kN) Slip (mm) Load (kN) Slip (mm) Load (kN) Slip (mm)
S-3 184 0 101 1.08 220 4.61S-4 200 0 114 0.84 345 6.45
To summarize, the push-out test revealed that first, the natural bonding strength of theFRP-concrete interface was about 0.27 MPa, which was lower than the data given by the previoustest [42]. The reason is that in the experiment in [42], the FRP profiles were encased by concrete, whichcan eliminate the interfacial separation. It should be noted that the shear stress caused by the naturalbonding was not evenly distributed along the interface, to be specific, the bond stress was zero at thetop and bottom ends of the interface [42], and reached its peak at the middle, which meant that theaforementioned strength in this paper was underestimated. Second, the failure of the natural bondingwas brittle, and the load dropped dramatically when debonding occurred. Finally, using a SIP formcould substantially increase the contact area, thereby leading to an increase in the interfacial shearcapacity. Therefore, in the design of decks or beams, more ribs can be added to SIP forms to createmore contact surface. Additionally, in the construction process, the existence of SIP forms eliminatesthe need for casting forms for concrete.
Therefore, to further study the effect of SIP forms, two FRP-concrete hybrid beams wereconstructed and tested, which are introduced in the following section. It should be noted that flat SIPforms were used in the push-out test, but in the beam test, a more complicated SIP form was usedwhere the ribs could provide more contact area with the concrete.
3. Comparative Flexural Test of FRP-Concrete Hybrid Beam
3.1. Material Properties and Setup for the Flexural Test
Two beams (Figure 4) were constructed and tested under a monotonic bending experimentalprogram. Beam 1 consisted of a concrete slab connected to an I-shape FRP girder by a steel boltconnection. Beam 1 was designed with SIP forms with ribs. These ribs can increase the contact areawith concrete, thereby creating more natural bonding, so the benefits of using SIP forms can be seenmore clearly. The SIP form has a hook at the right side and an extrusion at the left side, so the two ofthem can be assembled into one unit (Figure 4b). The concrete used in the beam test was the same asthose for the push-out test. The reinforcing bars had a yield strength of 235 MPa. Both of the hybridbeams were cured under the same conditions as the material testing specimens. The length of thebeams was 4 m with a span of 3.8 m. The cubic strength of the concrete was 36.5 MPa, the tensilestrength of the FRP profiles was 365.4 MPa, the tensile modulus of the FRP was 12.8 GPa, and theshear modulus of the FRP was 8.1 GPa. The cross sections of the hybrid beams can be seen in Figure 4.Timber stiffeners were bonded to both sides of the support ends and the loaded end, which can beseen in Figure 5. Therefore, the local buckling of flanges and webs could be prevented.
The beam specimens were instrumented with strain gauges and linear variable displacementtransformers (LVDTs) (Figure 5). The strain gauges for concrete and FRP components had a length of30 mm, with a resistance of 120 Ω. The strain gauges for the steel bars had a length of 5 mm, with aresistance of 120 Ω. The dial gauges at the beam ends can measure the interfacial slip of the concreterelative to the FRP beam. The loading was force controlled and applied using a 1000 kN testingmachine in small increments. Both of the beams had three loaded stages, namely, stage-I: from 0 to100 kN with a loading rate of 10 kN/min with data collected every 10 kN; stage-II: from 100 to 200 kNwith a loading rate of 5 kN/min with data collected every 5 kN; and stage-III: from 200 kN to failure(if it does not fail before 200 kN) with a loading rate of 2 kN/min with data collected every 2 kN.

Appl. Sci. 2019, 9, 913 7 of 16Appl. Sci. 2019, 9, x FOR PEER REVIEW 7 of 16
Appl. Sci. 2019, 9, x; doi: FOR PEER REVIEW www.mdpi.com/journal/applsci
(a)
(b)
Figure 4. Cross section of (a) Beam 1, and (b) Beam 2 (units in mm, not to scale).
3.2. Test Observations of the Two Beams
For Beam 1, the interfacial connection was designed to be mainly provided by two rows of steel bolts, and the width of the contact surface between FRP and in situ cast concrete was the same as the FRP upper flange. The steel bolts in Beam 1 and Beam 2 had a yield strength of 480 MPa (Grade M6.8) and 880 MPa (Grade M10.8), respectively. With an increase to the load at about 55 kN, the interfacial slip recorded by the dial gauges at the beam ends occurred suddenly, at the same time a loud noise was heard. At about 70 kN, two cracks sprouted at the bottom of the concrete slab at the locations beneath the two load points, respectively, and then propagated upward. At 238 kN, a snapping noise at the interface was heard. Steel bolts in the shear span were broken due to the shear force, and this failure mode was the same as the push-out specimens in Figure 2.
Figure 4. Cross section of (a) Beam 1, and (b) Beam 2 (units in mm, not to scale).
3.2. Test Observations of the Two Beams
For Beam 1, the interfacial connection was designed to be mainly provided by two rows of steelbolts, and the width of the contact surface between FRP and in situ cast concrete was the same as theFRP upper flange. The steel bolts in Beam 1 and Beam 2 had a yield strength of 480 MPa (Grade M6.8)and 880 MPa (Grade M10.8), respectively. With an increase to the load at about 55 kN, the interfacialslip recorded by the dial gauges at the beam ends occurred suddenly, at the same time a loud noisewas heard. At about 70 kN, two cracks sprouted at the bottom of the concrete slab at the locationsbeneath the two load points, respectively, and then propagated upward. At 238 kN, a snapping noiseat the interface was heard. Steel bolts in the shear span were broken due to the shear force, and thisfailure mode was the same as the push-out specimens in Figure 2.
Appl. Sci. 2019, 9, 913 8 of 16
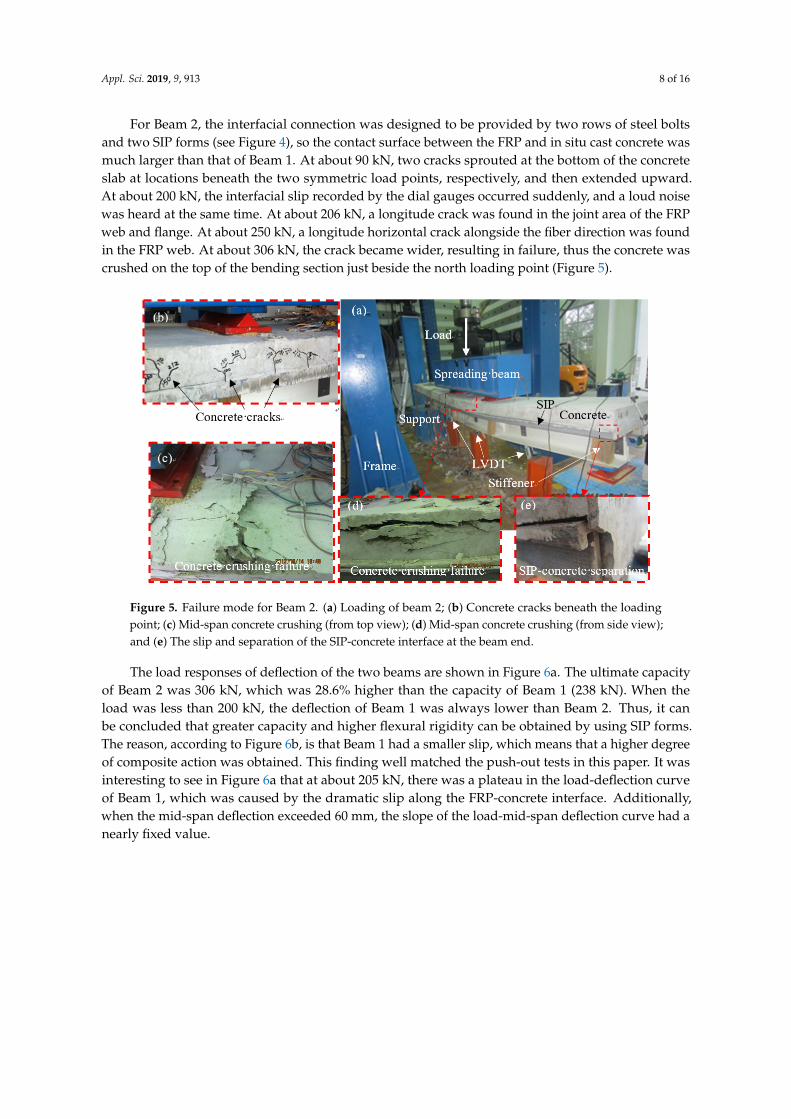
For Beam 2, the interfacial connection was designed to be provided by two rows of steel boltsand two SIP forms (see Figure 4), so the contact surface between the FRP and in situ cast concrete wasmuch larger than that of Beam 1. At about 90 kN, two cracks sprouted at the bottom of the concreteslab at locations beneath the two symmetric load points, respectively, and then extended upward.At about 200 kN, the interfacial slip recorded by the dial gauges occurred suddenly, and a loud noisewas heard at the same time. At about 206 kN, a longitude crack was found in the joint area of the FRPweb and flange. At about 250 kN, a longitude horizontal crack alongside the fiber direction was foundin the FRP web. At about 306 kN, the crack became wider, resulting in failure, thus the concrete wascrushed on the top of the bending section just beside the north loading point (Figure 5).
Appl. Sci. 2019, 9, x FOR PEER REVIEW 8 of 16
Appl. Sci. 2019, 9, x; doi: FOR PEER REVIEW www.mdpi.com/journal/applsci
For Beam 2, the interfacial connection was designed to be provided by two rows of steel bolts and two SIP forms (see Figure 4), so the contact surface between the FRP and in situ cast concrete was much larger than that of Beam 1. At about 90 kN, two cracks sprouted at the bottom of the concrete slab at locations beneath the two symmetric load points, respectively, and then extended upward. At about 200 kN, the interfacial slip recorded by the dial gauges occurred suddenly, and a loud noise was heard at the same time. At about 206 kN, a longitude crack was found in the joint area of the FRP web and flange. At about 250 kN, a longitude horizontal crack alongside the fiber direction was found in the FRP web. At about 306 kN, the crack became wider, resulting in failure, thus the concrete was crushed on the top of the bending section just beside the north loading point (Figure 5).
Figure 5. Failure mode for Beam 2. (a) Loading of beam 2; (b) Concrete cracks beneath the loading point; (c) Mid-span concrete crushing (from top view); (d) Mid-span concrete crushing (from side view); and (e) The slip and separation of the SIP-concrete interface at the beam end.
The load responses of deflection of the two beams are shown in Figure 6a. The ultimate capacity of Beam 2 was 306 kN, which was 28.6% higher than the capacity of Beam 1 (238 kN). When the load was less than 200 kN, the deflection of Beam 1 was always lower than Beam 2. Thus, it can be concluded that greater capacity and higher flexural rigidity can be obtained by using SIP forms. The reason, according to Figure 6b, is that Beam 1 had a smaller slip, which means that a higher degree of composite action was obtained. This finding well matched the push-out tests in this paper. It was interesting to see in Figure 6a that at about 205 kN, there was a plateau in the load-deflection curve of Beam 1, which was caused by the dramatic slip along the FRP-concrete interface. Additionally, when the mid-span deflection exceeded 60 mm, the slope of the load-mid-span deflection curve had a nearly fixed value.
Figure 5. Failure mode for Beam 2. (a) Loading of beam 2; (b) Concrete cracks beneath the loadingpoint; (c) Mid-span concrete crushing (from top view); (d) Mid-span concrete crushing (from side view);and (e) The slip and separation of the SIP-concrete interface at the beam end.
The load responses of deflection of the two beams are shown in Figure 6a. The ultimate capacityof Beam 2 was 306 kN, which was 28.6% higher than the capacity of Beam 1 (238 kN). When theload was less than 200 kN, the deflection of Beam 1 was always lower than Beam 2. Thus, it canbe concluded that greater capacity and higher flexural rigidity can be obtained by using SIP forms.The reason, according to Figure 6b, is that Beam 1 had a smaller slip, which means that a higher degreeof composite action was obtained. This finding well matched the push-out tests in this paper. It wasinteresting to see in Figure 6a that at about 205 kN, there was a plateau in the load-deflection curveof Beam 1, which was caused by the dramatic slip along the FRP-concrete interface. Additionally,when the mid-span deflection exceeded 60 mm, the slope of the load-mid-span deflection curve had anearly fixed value.

Appl. Sci. 2019, 9, 913 9 of 16
Appl. Sci. 2019, 9, x FOR PEER REVIEW 9 of 16
Appl. Sci. 2019, 9, x; doi: FOR PEER REVIEW www.mdpi.com/journal/applsci
(a)
(b)
Figure 6. Comparison of Beams 1~2: (a) Mid-span deflection; and (b) Beam end slip on the left side.
3.3. The Influence of the Brittle Failure of Natural Bonding
Figure 7a shows the load versus slip relationships in different locations in Beam 2. The slip was small (close to zero) for load under 200 kN, which means that full composite action could be obtained by the natural bonding and steel bolts together. This was also supported by Figure 7b, where under 200 kN, the load versus the mid-span deflection curves were almost linear.
Figure 6. Comparison of Beams 1~2: (a) Mid-span deflection; and (b) Beam end slip on the left side.
3.3. The Influence of the Brittle Failure of Natural Bonding
Figure 7a shows the load versus slip relationships in different locations in Beam 2. The slip wassmall (close to zero) for load under 200 kN, which means that full composite action could be obtainedby the natural bonding and steel bolts together. This was also supported by Figure 7b, where under200 kN, the load versus the mid-span deflection curves were almost linear.
Appl. Sci. 2019, 9, 913 10 of 16Appl. Sci. 2019, 9, x FOR PEER REVIEW 10 of 16
Appl. Sci. 2019, 9, x; doi: FOR PEER REVIEW www.mdpi.com/journal/applsci
(a) (b)
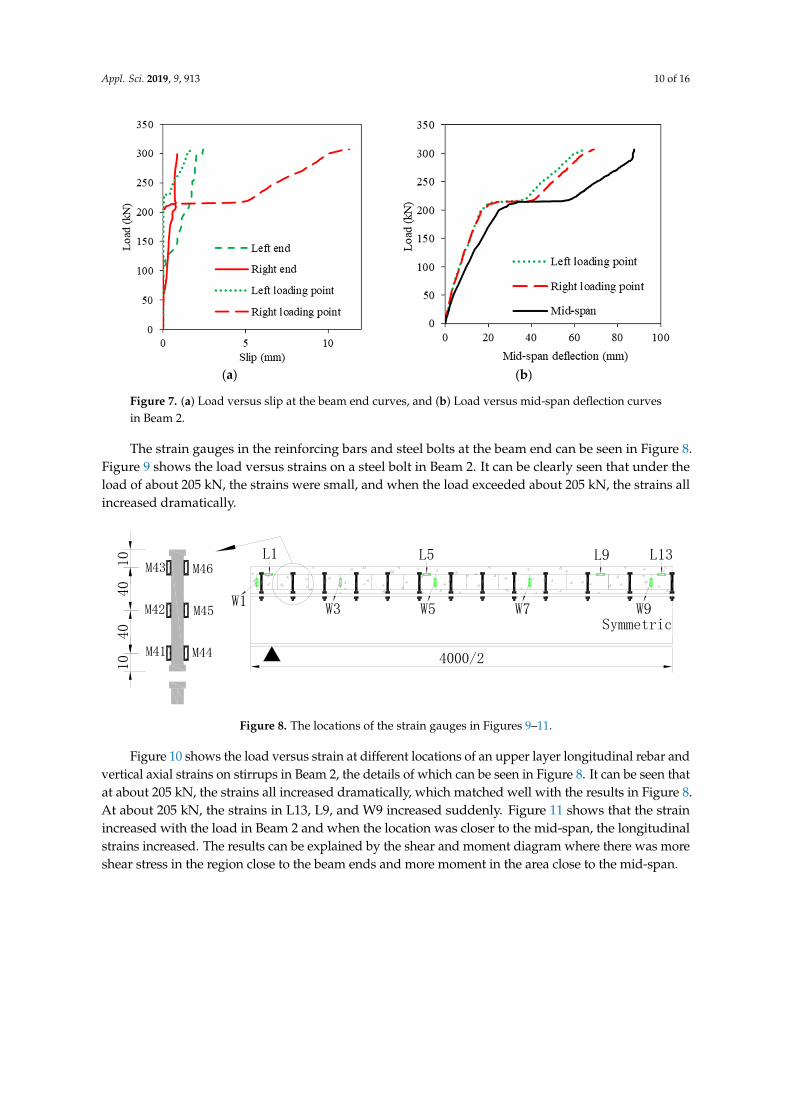
Figure 7. (a) Load versus slip at the beam end curves, and (b) Load versus mid-span deflection curves in Beam 2.
The strain gauges in the reinforcing bars and steel bolts at the beam end can be seen in Figure 8. Figure 9 shows the load versus strains on a steel bolt in Beam 2. It can be clearly seen that under the load of about 205 kN, the strains were small, and when the load exceeded about 205 kN, the strains all increased dramatically.
Figure 8. The locations of the strain gauges in Figures 9–11.
4000/2
M46
M45
M44
1040
10
40
M43
M42
M41
L1 L13L9L5
W1W9W7W5W3
Symmetric
Figure 7. (a) Load versus slip at the beam end curves, and (b) Load versus mid-span deflection curvesin Beam 2.
The strain gauges in the reinforcing bars and steel bolts at the beam end can be seen in Figure 8.Figure 9 shows the load versus strains on a steel bolt in Beam 2. It can be clearly seen that under theload of about 205 kN, the strains were small, and when the load exceeded about 205 kN, the strains allincreased dramatically.
Appl. Sci. 2019, 9, x FOR PEER REVIEW 10 of 16
Appl. Sci. 2019, 9, x; doi: FOR PEER REVIEW www.mdpi.com/journal/applsci
(a) (b)
Figure 7. (a) Load versus slip at the beam end curves, and (b) Load versus mid-span deflection curves in Beam 2.
The strain gauges in the reinforcing bars and steel bolts at the beam end can be seen in Figure 8. Figure 9 shows the load versus strains on a steel bolt in Beam 2. It can be clearly seen that under the load of about 205 kN, the strains were small, and when the load exceeded about 205 kN, the strains all increased dramatically.
Figure 8. The locations of the strain gauges in Figures 9–11.
4000/2
M46
M45
M44
1040
10
40
M43
M42
M41
L1 L13L9L5
W1W9W7W5W3
Symmetric
Figure 8. The locations of the strain gauges in Figures 9–11.
Figure 10 shows the load versus strain at different locations of an upper layer longitudinal rebar andvertical axial strains on stirrups in Beam 2, the details of which can be seen in Figure 8. It can be seen thatat about 205 kN, the strains all increased dramatically, which matched well with the results in Figure 8.At about 205 kN, the strains in L13, L9, and W9 increased suddenly. Figure 11 shows that the strainincreased with the load in Beam 2 and when the location was closer to the mid-span, the longitudinalstrains increased. The results can be explained by the shear and moment diagram where there was moreshear stress in the region close to the beam ends and more moment in the area close to the mid-span.

Appl. Sci. 2019, 9, 913 11 of 16
Appl. Sci. 2019, 9, x FOR PEER REVIEW 11 of 16
Appl. Sci. 2019, 9, x; doi: FOR PEER REVIEW www.mdpi.com/journal/applsci
Figure 9. Load versus strain at the steel bolts.
Figure 10 shows the load versus strain at different locations of an upper layer longitudinal rebar and vertical axial strains on stirrups in Beam 2, the details of which can be seen in Figure. 8. It can be seen that at about 205 kN, the strains all increased dramatically, which matched well with the results in Figure 8. At about 205 kN, the strains in L13, L9, and W9 increased suddenly. Figure 11 shows that the strain increased with the load in Beam 2 and when the location was closer to the mid-span, the longitudinal strains increased. The results can be explained by the shear and moment diagram where there was more shear stress in the region close to the beam ends and more moment in the area close to the mid-span.
(a) (b)
Figure 10. Load versus the strain of (a) the longitudinal bars, and (b) the stirrups.
Figure 9. Load versus strain at the steel bolts.
Appl. Sci. 2019, 9, x FOR PEER REVIEW 11 of 16
Appl. Sci. 2019, 9, x; doi: FOR PEER REVIEW www.mdpi.com/journal/applsci
Figure 9. Load versus strain at the steel bolts.
Figure 10 shows the load versus strain at different locations of an upper layer longitudinal rebar and vertical axial strains on stirrups in Beam 2, the details of which can be seen in Figure. 8. It can be seen that at about 205 kN, the strains all increased dramatically, which matched well with the results in Figure 8. At about 205 kN, the strains in L13, L9, and W9 increased suddenly. Figure 11 shows that the strain increased with the load in Beam 2 and when the location was closer to the mid-span, the longitudinal strains increased. The results can be explained by the shear and moment diagram where there was more shear stress in the region close to the beam ends and more moment in the area close to the mid-span.
(a) (b)
Figure 10. Load versus the strain of (a) the longitudinal bars, and (b) the stirrups. Figure 10. Load versus the strain of (a) the longitudinal bars, and (b) the stirrups.Appl. Sci. 2019, 9, x FOR PEER REVIEW 12 of 16
Appl. Sci. 2019, 9, x; doi: FOR PEER REVIEW www.mdpi.com/journal/applsci
(a) (b)
Figure 11. Strain distribution along the right half span of (a) the longitudinal bars, and (b) the stirrups.
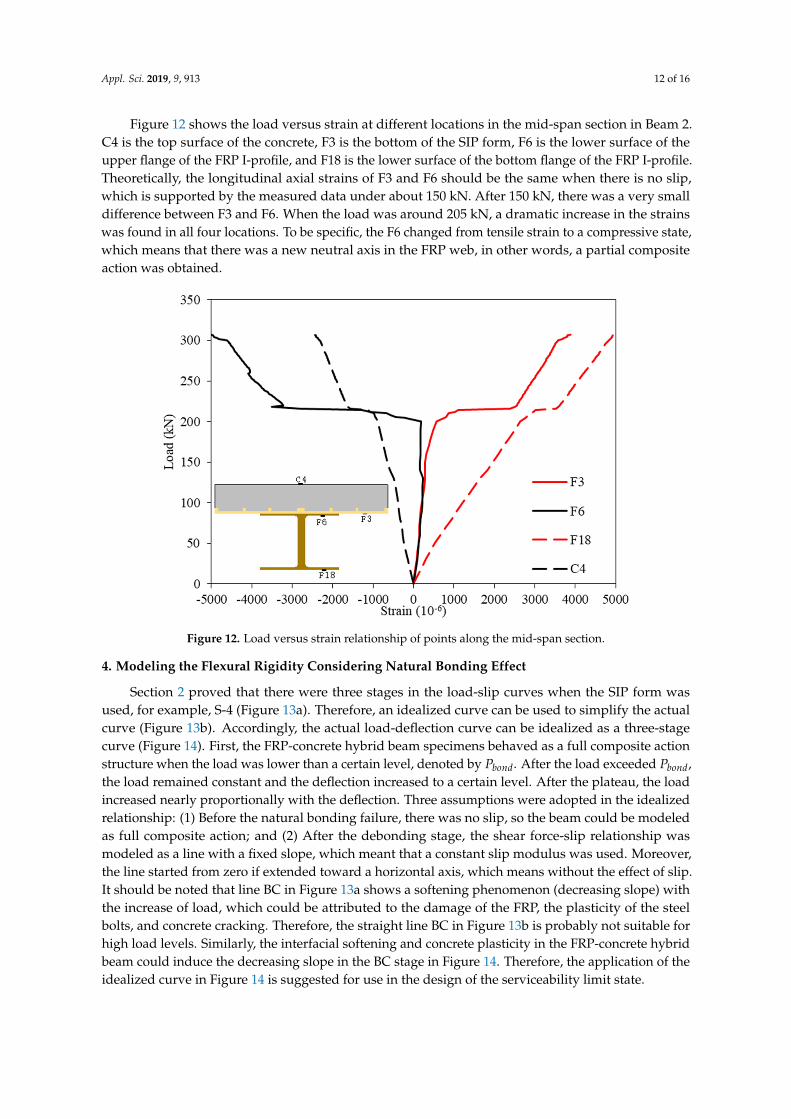
Figure 12 shows the load versus strain at different locations in the mid-span section in Beam 2. C4 is the top surface of the concrete, F3 is the bottom of the SIP form, F6 is the lower surface of the upper flange of the FRP I-profile, and F18 is the lower surface of the bottom flange of the FRP I-profile. Theoretically, the longitudinal axial strains of F3 and F6 should be the same when there is no slip, which is supported by the measured data under about 150 kN. After 150 kN, there was a very small difference between F3 and F6. When the load was around 205 kN, a dramatic increase in the strains was found in all four locations. To be specific, the F6 changed from tensile strain to a compressive state, which means that there was a new neutral axis in the FRP web, in other words, a partial composite action was obtained.
Figure 12. Load versus strain relationship of points along the mid-span section.
Figure 11. Strain distribution along the right half span of (a) the longitudinal bars, and (b) the stirrups.
Appl. Sci. 2019, 9, 913 12 of 16
Figure 12 shows the load versus strain at different locations in the mid-span section in Beam 2.C4 is the top surface of the concrete, F3 is the bottom of the SIP form, F6 is the lower surface of theupper flange of the FRP I-profile, and F18 is the lower surface of the bottom flange of the FRP I-profile.Theoretically, the longitudinal axial strains of F3 and F6 should be the same when there is no slip,which is supported by the measured data under about 150 kN. After 150 kN, there was a very smalldifference between F3 and F6. When the load was around 205 kN, a dramatic increase in the strainswas found in all four locations. To be specific, the F6 changed from tensile strain to a compressive state,which means that there was a new neutral axis in the FRP web, in other words, a partial compositeaction was obtained.
Appl. Sci. 2019, 9, x FOR PEER REVIEW 12 of 16
Appl. Sci. 2019, 9, x; doi: FOR PEER REVIEW www.mdpi.com/journal/applsci
(a) (b)
Figure 11. Strain distribution along the right half span of (a) the longitudinal bars, and (b) the stirrups.
Figure 12 shows the load versus strain at different locations in the mid-span section in Beam 2. C4 is the top surface of the concrete, F3 is the bottom of the SIP form, F6 is the lower surface of the upper flange of the FRP I-profile, and F18 is the lower surface of the bottom flange of the FRP I-profile. Theoretically, the longitudinal axial strains of F3 and F6 should be the same when there is no slip, which is supported by the measured data under about 150 kN. After 150 kN, there was a very small difference between F3 and F6. When the load was around 205 kN, a dramatic increase in the strains was found in all four locations. To be specific, the F6 changed from tensile strain to a compressive state, which means that there was a new neutral axis in the FRP web, in other words, a partial composite action was obtained.
Figure 12. Load versus strain relationship of points along the mid-span section.
Figure 12. Load versus strain relationship of points along the mid-span section.
4. Modeling the Flexural Rigidity Considering Natural Bonding Effect
Section 2 proved that there were three stages in the load-slip curves when the SIP form wasused, for example, S-4 (Figure 13a). Therefore, an idealized curve can be used to simplify the actualcurve (Figure 13b). Accordingly, the actual load-deflection curve can be idealized as a three-stagecurve (Figure 14). First, the FRP-concrete hybrid beam specimens behaved as a full composite actionstructure when the load was lower than a certain level, denoted by Pbond. After the load exceeded Pbond,the load remained constant and the deflection increased to a certain level. After the plateau, the loadincreased nearly proportionally with the deflection. Three assumptions were adopted in the idealizedrelationship: (1) Before the natural bonding failure, there was no slip, so the beam could be modeledas full composite action; and (2) After the debonding stage, the shear force-slip relationship wasmodeled as a line with a fixed slope, which meant that a constant slip modulus was used. Moreover,the line started from zero if extended toward a horizontal axis, which means without the effect of slip.It should be noted that line BC in Figure 13a shows a softening phenomenon (decreasing slope) withthe increase of load, which could be attributed to the damage of the FRP, the plasticity of the steelbolts, and concrete cracking. Therefore, the straight line BC in Figure 13b is probably not suitable forhigh load levels. Similarly, the interfacial softening and concrete plasticity in the FRP-concrete hybridbeam could induce the decreasing slope in the BC stage in Figure 14. Therefore, the application of theidealized curve in Figure 14 is suggested for use in the design of the serviceability limit state.

Appl. Sci. 2019, 9, 913 13 of 16
In this paper, only four push-out test specimens and two beams were tested, so the determinationof τbond should be validated using more test data for future research. Moreover, the influence ofconcrete strength, the depth of ribs in the SIP forms, and the sizes of bolts will be researched infuture work.
Appl. Sci. 2019, 9, x FOR PEER REVIEW 13 of 16
Appl. Sci. 2019, 9, x; doi: FOR PEER REVIEW www.mdpi.com/journal/applsci
4. Modeling the Flexural Rigidity Considering Natural Bonding Effect
Section 2 proved that there were three stages in the load-slip curves when the SIP form was used, for example, S-4 (Figure 13a). Therefore, an idealized curve can be used to simplify the actual curve (Figure 13b). Accordingly, the actual load-deflection curve can be idealized as a three-stage curve (Figure 14). First, the FRP-concrete hybrid beam specimens behaved as a full composite action structure when the load was lower than a certain level, denoted by 𝑃 . After the load exceeded 𝑃 , the load remained constant and the deflection increased to a certain level. After the plateau, the load increased nearly proportionally with the deflection. Three assumptions were adopted in the idealized relationship: (1) Before the natural bonding failure, there was no slip, so the beam could be modeled as full composite action; and (2) After the debonding stage, the shear force-slip relationship was modeled as a line with a fixed slope, which meant that a constant slip modulus was used. Moreover, the line started from zero if extended toward a horizontal axis, which means without the effect of slip. It should be noted that line BC in Figure 13a shows a softening phenomenon (decreasing slope) with the increase of load, which could be attributed to the damage of the FRP, the plasticity of the steel bolts, and concrete cracking. Therefore, the straight line BC in Figure 13b is probably not suitable for high load levels. Similarly, the interfacial softening and concrete plasticity in the FRP-concrete hybrid beam could induce the decreasing slope in the BC stage in Figure 14. Therefore, the application of the idealized curve in Figure 14 is suggested for use in the design of the serviceability limit state.
In this paper, only four push-out test specimens and two beams were tested, so the determination of 𝜏 should be validated using more test data for future research. Moreover, the influence of concrete strength, the depth of ribs in the SIP forms, and the sizes of bolts will be researched in future work.
(a) (b)
Figure 13. Simplification of the shear force-slip relationship for the steel bolts-SIP forms connection: (a) Measured curve for specimen S-4; and (b) Idealized curve. Figure 13. Simplification of the shear force-slip relationship for the steel bolts-SIP forms connection:(a) Measured curve for specimen S-4; and (b) Idealized curve.Appl. Sci. 2019, 9, x FOR PEER REVIEW 14 of 16
Appl. Sci. 2019, 9, x; doi: FOR PEER REVIEW www.mdpi.com/journal/applsci
Figure 14. Idealized load response considering the three-stage shear force-slip relationship.
5. Conclusions
The interfacial load-slip model is an important parameter for FRP-concrete hybrid beam systems. In this paper, four push-out test specimens and two flexural test specimens proved that (i) the natural bonding between FRP and concrete contributes a large amount to the interfacial shear connection at the beginning of loading, and (ii) the use of SIP forms can improve the contact area for natural bonding and therefore increase the interfacial shear connection. The following main conclusions can be drawn:
(i) The use of SIP forms can improve the ultimate shear capacity of steel bolts by 11.1%, and moreover, it can provide full composite action at an initial stage.
(ii) The average natural bonding strength of FRP-concrete was evaluated as 0.27 MPa through the push-out test. When the natural bonding failed, there was a dramatic load decease, which transferred the shear force carried by natural bonding to the steel bolts.
(iii) A beam specimen with SIP forms revealed that there was a load response stage (about 205 kN) with nearly zero slip along the FRP-concrete interface.
(iv) The strain measurements on the steel bolts, FRP profiles, and concrete had very small strains and increased dramatically after the initial natural bonding failed, which indicates that the failure of the natural bonding is a brittle process.
(v) The flexural response of the FRP-concrete hybrid beam can be organized into three distinct stages, namely the full composite action stage where natural bonding provides the interconnection, the plateau of releasing the natural bonding effect, and the partial composite action stage where steel bolts provide the interconnection.
To conclude, this paper presents the concept that the natural bonding between FRP and the in situ cast concrete is a mechanism that can be fully made use of, and that the use of SIP is an effective way to do this.
Author Contributions: Conceptualization, J.G. and X.Z.; methodology, X.Z.; software, X.Z.; validation, J.G., X.Z. and P.X.; formal analysis, P.X.; investigation, J.G. and X.Z.; resources, X.Z.; data curation, J.G.; writing—original draft preparation, J.G. and X.Z.; writing—review and editing, P.X.; visualization, J.G. and X.Z.; supervision, J.G.; project administration, J.G. and X.Z.; funding acquisition, J.G.”.
Funding: This research was funded by National Natural Science Foundation of China, grant number 51778508.
Figure 14. Idealized load response considering the three-stage shear force-slip relationship.
5. Conclusions
The interfacial load-slip model is an important parameter for FRP-concrete hybrid beam systems.In this paper, four push-out test specimens and two flexural test specimens proved that (i) the naturalbonding between FRP and concrete contributes a large amount to the interfacial shear connection atthe beginning of loading, and (ii) the use of SIP forms can improve the contact area for natural bondingand therefore increase the interfacial shear connection. The following main conclusions can be drawn:
(i) The use of SIP forms can improve the ultimate shear capacity of steel bolts by 11.1%,and moreover, it can provide full composite action at an initial stage.

Appl. Sci. 2019, 9, 913 14 of 16
(ii) The average natural bonding strength of FRP-concrete was evaluated as 0.27 MPa through thepush-out test. When the natural bonding failed, there was a dramatic load decease, which transferredthe shear force carried by natural bonding to the steel bolts.
(iii) A beam specimen with SIP forms revealed that there was a load response stage (about 205 kN)with nearly zero slip along the FRP-concrete interface.
(iv) The strain measurements on the steel bolts, FRP profiles, and concrete had very small strainsand increased dramatically after the initial natural bonding failed, which indicates that the failure ofthe natural bonding is a brittle process.
(v) The flexural response of the FRP-concrete hybrid beam can be organized into three distinctstages, namely the full composite action stage where natural bonding provides the interconnection,the plateau of releasing the natural bonding effect, and the partial composite action stage where steelbolts provide the interconnection.
To conclude, this paper presents the concept that the natural bonding between FRP and the insitu cast concrete is a mechanism that can be fully made use of, and that the use of SIP is an effectiveway to do this.
Author Contributions: Conceptualization, J.G. and X.Z.; methodology, X.Z.; software, X.Z.; validation, J.G., X.Z.and P.X.; formal analysis, P.X.; investigation, J.G. and X.Z.; resources, X.Z.; data curation, J.G.; writing—originaldraft preparation, J.G. and X.Z.; writing—review and editing, P.X.; visualization, J.G. and X.Z.; supervision, J.G.;project administration, J.G. and X.Z.; funding acquisition, J.G.
Funding: This research was funded by National Natural Science Foundation of China, grant number 51778508.
Acknowledgments: The first author was formerly a student at the School of Urban Construction, Wuhan Univ.of Science and Technology. The authors would like to thank Dr. Cheng Jiang at the Department of Civil andEnvironmental Engineering at Hong Kong Polytechnic University for his help in the discussion of the analyticalmodel section.
Conflicts of Interest: The authors declare no conflict of interest.
References
1. Bakis, C.E.; Bank, L.C.; Brown, V.; Cosenza, E.; Davalos, J.F.; Lesko, J.J.; Machida, A.; Rizkalla, S.H.;Triantafillou, T.C. Fiber-reinforced polymer composites for construction—State-of-the-art review.J. Compos. Constr. 2002, 6, 73–87. [CrossRef]
2. Jiang, C.; Wu, Y.F.; Wu, G. Plastic hinge length of FRP-confined square RC columns. J. Compos. Constr. 2014,18, 04014003. [CrossRef]
3. Wu, Y.F.; Jiang, C. Quantification of bond-slip relationship for externally bonded FRP-to-concrete joints.J. Compos. Constr. 2013, 17, 673–686. [CrossRef]
4. Antonopoulos, C.P.; Triantafillou, T.C. Analysis of FRP-strengthened RC beam-column joints. J. Compos. Constr.2002, 6, 41–51. [CrossRef]
5. Cascardi, A.; Micelli, F.; Aiello, M.A. Unified model for hollow columns externally confined by FRP.Eng. Struct. 2016, 111, 119–130. [CrossRef]
6. Banthia, N.; Abdolrahimzadeh, A.; Demers, M.; Mufti, A.; Sheikh, S. Durability of FRP-concrete bond inFRP-strengthened bridges. Concr. Int. 2010, 32, 45–51.
7. Valluzzi, M.R.; Modena, C.; de Felice, G. Current practice and open issues in strengthening historicalbuildings with composites. Mater. Struct. 2014, 47, 1971–1985. [CrossRef]
8. Liu, F.; Wu, B.; Wei, D. Failure modes of reinforced concrete beams strengthened with carbon fiber sheet infire. Fire Saf. J. 2009, 44, 941–950. [CrossRef]
9. Zheng, Y.; Yu, G.; Pan, Y. Investigation of ultimate strengths of concrete bridge deck slabs reinforced withGFRP bars. Constr. Build. Mater. 2012, 28, 482–492. [CrossRef]
10. Zheng, Y.; Li, C.; Yu, G. Investigation of structural behaviours of laterally restrained GFRP reinforced concreteslabs. Compos. Part B Eng. 2012, 43, 1586–1597. [CrossRef]
11. Li, W.; Ho, S.C.M.; Patil, D.; Song, G. Acoustic emission monitoring and finite element analysis of debondingin fiber-reinforced polymer rebar reinforced concrete. Struct. Health Monit. 2017, 16, 674–681. [CrossRef]

Appl. Sci. 2019, 9, 913 15 of 16
12. Zhu, C.; Chen, Y.; Zhuang, Y.; Du, Y.; Gerald, R.E.; Tang, Y.; Huang, J. An optical interferometric triaxialdisplacement sensor for structural health monitoring: Characterization of sliding and debonding for adelamination process. Sensors 2017, 17, 2696. [CrossRef] [PubMed]
13. Kumar, P.; Chandrashekhara, K.; Nanni, A. Structural performance of a FRP bridge deck. Constr. Build. Mater.2004, 18, 35–47. [CrossRef]
14. Alagusundaramoorthy, P.; Harik, I.E.; Choo, C.C. Structural behavior of FRP composite bridge deck panels.J. Bridge Eng. 2006, 11, 384–393. [CrossRef]
15. Keller, T.; Bai, Y.; Vallée, T. Long-term performance of a glass fiber-reinforced polymer truss bridge.J. Compos. Constr. 2007, 11, 99–108. [CrossRef]
16. Li, Y.F.; Hsu, T.H.; Hsieh, F.C. A Study on Improving the Mechanical Behaviors of the Pultruded GFRPComposite Material Members. Sustainability 2019, 11, 577. [CrossRef]
17. Keller, T. Recent all-composite and hybrid fibre-reinforced polymer bridges and buildings. Prog. Struct.Eng. Mater. 2001, 3, 132–140. [CrossRef]
18. Ulloa, F.; Medlock, R.; Ziehl, P.; Fowler, T. A hybrid FRP bridge for Texas. Concr. Int. 2004, 26, 38–43.19. Alachek, I.; Reboul, N.; Jurkiewiez, B. Experimental and finite element analysis of the long-term behaviour
of GFRP-concrete hybrid beams fabricated using adhesive bonding. Compos. Struct. 2019, 207, 148–165.[CrossRef]
20. Gonilha, J.A.; Correia, J.R.; Branco, F.A.; Sena-Cruz, J. Durability of GFRP-concrete adhesively bondedconnections: Experimental and numerical studies. Eng. Struct. 2018, 168, 784–798. [CrossRef]
21. Siwowski, T.; Kulpa, M.; Rajchel, M.; Poneta, P. Design, manufacturing and structural testing of all-compositeFRP bridge girder. Compos. Struct. 2018, 206, 814–827. [CrossRef]
22. Siwowski, T.; Kaleta, D.; Rajchel, M. Structural behaviour of an all-composite road bridge. Compos. Struct.2018, 192, 555–567. [CrossRef]
23. Zhang, S.; Xue, W.C.; Liao, X. Theoretical analysis on long-term deflection of GFRP-concrete hybrid structurewith partial interaction. Compos. Struct. 2019. [CrossRef]
24. Mieres, J.M.; Calvo, I.; Miravete, A.; Gutiérrez, E.; Shahidi, E.; López, C.; Cuartero, J.; Comino, P.; de Villoria, R.G.Description of a traffic bridge of the Cantabrian SpeedWay made of composite materials. Mater. Construcción2006, 56, 81–86.
25. Nystrom, H.E.; Watkins, S.E.; Nanni, A.; Murray, S. Financial viability of fiber-reinforced polymer (FRP)bridges. J. Manag. Eng. 2003, 19, 2–8. [CrossRef]
26. Berg, A.C.; Bank, L.C.; Oliva, M.G.; Russell, J.S. Construction and cost analysis of an FRP reinforced concretebridge deck. Constr. Build. Mater. 2006, 20, 515–526. [CrossRef]
27. Hastak, M.; Halpin, D.W. Assessment of life-cycle benefit-cost of composites in construction. J. Compos. Constr.2000, 4, 103–111. [CrossRef]
28. Zou, X.; Feng, P.; Wang, J. Perforated FRP ribs for shear connecting of FRP-concrete hybrid beams/decks.Compos. Struct. 2016, 152, 267–276. [CrossRef]
29. Zou, X.; Feng, P.; Wang, J.; Wu, Y.; Feng, Y. FRP stay-in-place form and shear key connection for FRP-concretehybrid beams/decks. Compos. Struct. 2018, 192, 489–499. [CrossRef]
30. Zou, X.; Feng, P.; Wang, J. Bolted Shear Connection of FRP-Concrete Hybrid Beams. J. Compos. Constr. 2018,22, 04018012. [CrossRef]
31. Nguyen, H.; Mutsuyoshi, H.; Zatar, W. Push-out tests for shear connections between UHPFRC slabs andFRP girder. Compos. Struct. 2014, 118, 528–547. [CrossRef]
32. Saiidi, M.; Gordaninejad, F.; Wehbe, N. Behavior of graphite/epoxy concrete composite beams. J. Struct. Eng.1994, 120, 2958–2976. [CrossRef]
33. Cho, K.; Park, S.Y.; Kim, S.T.; Cho, J.R.; Kim, B.S. Shear connection system and performance evaluation ofFRP-concrete composite deck. KSCE J. Civ. Eng. 2010, 14, 855–865. [CrossRef]
34. Zhang, P.; Wu, G.; Zhu, H.; Meng, S.P.; Wu, Z.S. Mechanical performance of the wet-bond interface betweenFRP plates and cast-in-place concrete. J. Compos. Constr. 2014, 18, 04014016. [CrossRef]
35. Deskovic, N.; Triantafillou, T.C.; Meier, U. Innovative design of FRP combined with concrete: Short-termbehavior. J. Struct. Eng. 1995, 121, 1069–1078. [CrossRef]
36. Mendes, P.J.; Barros, J.A.; Sena-Cruz, J.M.; Taheri, M. Development of a pedestrian bridge with GFRP profilesand fiber reinforced self-compacting concrete deck. Compos. Struct. 2011, 93, 2969–2982. [CrossRef]

Appl. Sci. 2019, 9, 913 16 of 16
37. Zheng, Y.; Taylor, S.; Robinson, D.; Cleland, D. Investigation of ultimate strength of deck slabs in steel-concretebridges. Aci Struct. J. 2010, 107, 82–91.
38. Gong, J.; Zou, X.; Shi, H.; Jiang, C.; Li, Z. Numerical Investigation of the Nonlinear Composite Action ofFRP-Concrete Hybrid Beams/Decks. Appl. Sci. 2018, 8, 2031. [CrossRef]
39. Mendes, P.J.; Barros, J.A.; Sena-Cruz, J.; Teheri, M. Influence of fatigue and aggressive exposure on GFRPgirder to SFRSCC deck all-adhesive connection. Compos. Struct. 2014, 110, 152–162. [CrossRef]
40. Gonilha, J.A.; Barros, J.; Correia, J.R.; Sena-Cruz, J.; Branco, F.A.; Ramos, L.F.; Santos, T. Static, dynamicand creep behaviour of a full-scale GFRP-SFRSCC hybrid footbridge. Compos. Struct. 2014, 118, 496–509.[CrossRef]
41. Alachek, I.; Reboul, N.; Jurkiewiez, B. Long-time behaviour of GFRP/concrete hybrid structures.In Proceedings of the 9th International Conference on Fibre-Reinforced Polymer (FRP) Composites inCivil Engineering (CICE 2018), Paris, France, 17–19 July 2018.
42. Yuan, J.S.; Hadi, M.N. Bond-slip behaviour between GFRP I-section and concrete. Compos. Part B Eng. 2017,130, 76–89. [CrossRef]
43. Noël, M.; Fam, A. Design equations for concrete bridge decks with FRP stay-in-place structural forms.J. Compos. Constr. 2016, 20, 04016024. [CrossRef]
44. Correia, J.R.; Branco, F.A.; João, G.F. Flexural behaviour of multi-span GFRP-concrete hybrid beams.Eng. Struct. 2009, 31, 1369–1381. [CrossRef]
© 2019 by the authors. Licensee MDPI, Basel, Switzerland. This article is an open accessarticle distributed under the terms and conditions of the Creative Commons Attribution(CC BY) license (http://creativecommons.org/licenses/by/4.0/).