Experimental Investigation of the Hydro-Elastic … · Experimental Investigation of the...
19
31st Symposium on Naval Hydrodynamics Monterey, California, 11-16 September 2016 Experimental Investigation of the Hydro-Elastic Response of a Surface-Piercing Hydrofoil in Multi-Phase Flow C. Harwood 1 , J. Ward 1 , Y.L. Young 1 , S. Ceccio 1,2 ( 1 Dept. of Naval Architecture and Marine Engineering, University of Michigan, USA, 2 Dept. of Mechanical Engineering, University of Michigan, USA) ABSTRACT Ventilation of lifting surfaces can cause dramatic changes in hydrodynamic loads and flow topology, which may have significant ramifications on the fluid- structure interactions of marine systems constructed with compliant materials. In this work, towing-tank experiments on flexible surface-piercing hydrofoils were performed to explore the hydroelastic response of wetted and ventilated lifting-surfaces. A robust, non-optical method for 3D shape-sensing was developed to monitor deformations of the flexible hydrofoils. Hydrodynamic loads are larger in wetted flow than in ventilated flow, and static deflections are commensurate with the loads in both flow regimes. A small increase in hydrodynamic loading was induced by hydroelastic coupling in the case of the flexible hydrofoil. In general, modal frequencies were found to decrease with foil immersion and forward speed, and to increase with ventilation, due to changing fluid added mass. The changes in modal frequencies and damping coefficients varied non-monotonically with increasing mode numbers. INTRODUCTION Ventilation (specifically atmospheric ventilation) is a multi-phase flow that occurs on hydrodynamic systems operating in proximity to the free surface – most frequently lift- or thrust-producing systems such as hydrofoils, propellers, and control surfaces. When lifting-surfaces operate at or near the fluid free surface, low-pressure regions of the flow by which lift is generated can entrain air from above the free surface to form partial cavities and supercavities. When this occurs, the total realizable lift may be reduced dramatically (Breslin & Skalak, 1959; Swales, et al, 1974) or reversed (Rothblum, et al, 1969), and the ventilated flow may persist to angles of attack and speeds much lower than those at which the cavity incepted (Kiceniuk, 1954; Wetzel, 1957). Harwood, et al (2014) and Harwood, et al (2016b) defined three characteristic flow regimes of a surface-piercing hydrofoil: fully wetted (FW) flow, fully ventilated (FV) flow, and partially ventilation (PV) flow. Thorough reviews of relevant literature may be found in Harwood, et al., (2016b) and Young, et al (2016a). Hydrofoils, propellers, control surfaces, etc, fabricated from non-metallic materials offer a number of potential advantages including lighter weight, reduced acoustic signature, corrosion resistance, and tailored elastic response to loading. Such hydroelastic tailoring has been demonstrated to improve efficiency, widen operating envelopes, and delay the onset of vaporous cavitation in marine propellers (Motley, et al, 2009; Motley & Young, 2011; Young, et al, 2016b). However, lifting surfaces that are prone to ventilation can experience rapidly- and widely- fluctuating loads, resulting in structural deflections; this issue may be more pronounced for lighter-weight, compliant lifting surfaces. The field of aeroelasticity is well-established, addressing the coupled aerodynamic and structural responses of aerospace structures (Bisplinghoff, et al, 1996; Fung, 1955). Hydroelasticity, though it shares many of the same features as aeroelasticity, presents a number of unique challenges. Water has a density three order of magnitude larger and dynamic viscosity two orders of magnitude larger than those of air. As a result, hydrodynamic systems experience larger loads and larger viscous effects. The dimensionless mass ratio () describes the ratio of the mass of a lifting- section per unit span () to the fluid mass contained within its circumscribed circle ( 2 ), where is the radius of the circle, equal to the foil’s semichord, = √ 2 . (1) Mass ratios of >4 are typical of aerospace systems, while marine systems typically fall into the range of <2. Coincidentally, this low range of mass ratios is also the range in which the classical tenets of aeroelastic analysis are least valid (e.g. linear frequency-domain analysis). Numerical work (Akcabay, et al, 2014; Akcabay & Young, 2014, 2015; Chae, et al, 2013,
Transcript of Experimental Investigation of the Hydro-Elastic … · Experimental Investigation of the...
31st Symposium on Naval Hydrodynamics
Monterey, California, 11-16 September 2016
Experimental Investigation of the Hydro-Elastic Response of a
Surface-Piercing Hydrofoil in Multi-Phase Flow
C. Harwood1, J. Ward1, Y.L. Young1, S. Ceccio1,2
(1Dept. of Naval Architecture and Marine Engineering, University of Michigan,
USA, 2Dept. of Mechanical Engineering, University of Michigan, USA)
ABSTRACT
Ventilation of lifting surfaces can cause dramatic
changes in hydrodynamic loads and flow topology,
which may have significant ramifications on the fluid-
structure interactions of marine systems constructed
with compliant materials. In this work, towing-tank
experiments on flexible surface-piercing hydrofoils
were performed to explore the hydroelastic response
of wetted and ventilated lifting-surfaces. A robust,
non-optical method for 3D shape-sensing was
developed to monitor deformations of the flexible
hydrofoils. Hydrodynamic loads are larger in wetted
flow than in ventilated flow, and static deflections are
commensurate with the loads in both flow regimes. A
small increase in hydrodynamic loading was induced
by hydroelastic coupling in the case of the flexible
hydrofoil. In general, modal frequencies were found to
decrease with foil immersion and forward speed, and
to increase with ventilation, due to changing fluid
added mass. The changes in modal frequencies and
damping coefficients varied non-monotonically with
increasing mode numbers.
INTRODUCTION
Ventilation (specifically atmospheric ventilation) is a
multi-phase flow that occurs on hydrodynamic
systems operating in proximity to the free surface –
most frequently lift- or thrust-producing systems such
as hydrofoils, propellers, and control surfaces. When
lifting-surfaces operate at or near the fluid free surface,
low-pressure regions of the flow by which lift is
generated can entrain air from above the free surface
to form partial cavities and supercavities. When this
occurs, the total realizable lift may be reduced
dramatically (Breslin & Skalak, 1959; Swales, et al,
1974) or reversed (Rothblum, et al, 1969), and the
ventilated flow may persist to angles of attack and
speeds much lower than those at which the cavity
incepted (Kiceniuk, 1954; Wetzel, 1957). Harwood, et
al (2014) and Harwood, et al (2016b) defined three
characteristic flow regimes of a surface-piercing
hydrofoil: fully wetted (FW) flow, fully ventilated
(FV) flow, and partially ventilation (PV) flow.
Thorough reviews of relevant literature may be found
in Harwood, et al., (2016b) and Young, et al (2016a).
Hydrofoils, propellers, control surfaces, etc,
fabricated from non-metallic materials offer a number
of potential advantages including lighter weight,
reduced acoustic signature, corrosion resistance, and
tailored elastic response to loading. Such hydroelastic
tailoring has been demonstrated to improve efficiency,
widen operating envelopes, and delay the onset of
vaporous cavitation in marine propellers (Motley, et
al, 2009; Motley & Young, 2011; Young, et al,
2016b). However, lifting surfaces that are prone to
ventilation can experience rapidly- and widely-
fluctuating loads, resulting in structural deflections;
this issue may be more pronounced for lighter-weight,
compliant lifting surfaces.
The field of aeroelasticity is well-established,
addressing the coupled aerodynamic and structural
responses of aerospace structures (Bisplinghoff, et al,
1996; Fung, 1955). Hydroelasticity, though it shares
many of the same features as aeroelasticity, presents a
number of unique challenges. Water has a density
three order of magnitude larger and dynamic viscosity
two orders of magnitude larger than those of air. As a
result, hydrodynamic systems experience larger loads
and larger viscous effects. The dimensionless mass
ratio (𝜇) describes the ratio of the mass of a lifting-
section per unit span (𝑚) to the fluid mass contained
within its circumscribed circle (𝜋𝜌𝑓𝑏2), where 𝑏 is the
radius of the circle, equal to the foil’s semichord,
𝜇 = √𝑚
𝜋𝜌𝑓𝑏2. (1)
Mass ratios of 𝜇 > 4 are typical of aerospace systems,
while marine systems typically fall into the range of
𝜇 < 2. Coincidentally, this low range of mass ratios is
also the range in which the classical tenets of
aeroelastic analysis are least valid (e.g. linear
frequency-domain analysis).
Numerical work (Akcabay, et al, 2014;
Akcabay & Young, 2014, 2015; Chae, et al, 2013,
2016a; Fu & Price, 1987; Harwood, et al, 2016a) and
experimental work (Besch & Liu, 1971, 1973, 1974;
Blake & Maga, 1975; Fu & Price, 1987; Harwood, et
al., 2016a) have demonstrated that fluid inertia,
damping, and disturbing forces can dominate the
governing equations of motion for lightweight lifting
bodies in water. These large fluid forces, combined
with the presence of a free surface, wave generation,
and multi-phase flow, contribute to significant
nonlinearity in the fluid-structure interactions. Recent
reviews are provided by Young, et al. (2016a) and
Young, et al. (2016b).
In this work, we will present the results of
experiments, conducted with a flexible surface-
piercing strut in a towing tank. The purpose of this
research is to advance scientific understanding of
fluid-structure interactions in the presence of multiple
phases. Additionally, we seek to demonstrate the
efficacy of new experimental techniques for
investigating such problems. The specific objectives
of this paper are as follows: (1) develop and validate a
non-optical method of measuring the static and
dynamic deformations of a flexible surface-piercing
hydrofoil in wetted and ventilated flows; (2) quantify
the effects of wetted and ventilated flow regimes on
the steady and unsteady hydro-elastic response of the
flexible hydrofoil; and (3) quantify the effects of
spanwise bending and twisting deformations on
steady-state hydrodynamic loads and flow regime
stability boundaries.
EXPERIMENTAL SETUP
Ventilation on a vertically-cantilevered, flexible
hydrofoil was studied experimentally. Hydrodynamic
testing was conducted in the towing tank of the
University of Michigan’s Marine Hydrodynamics
Laboratory. The tank has dimensions of 110 m length
by 3.2 m depth by 6.7 m width (360 ft × 10.5 ft × 22
ft), and the carriage is capable of speeds up to 6.1 m/s
(20 ft/s).
The test specimen was a vertical strut with a
semi-ogival section, a chord length of 27.9 cm (11 in)
and a geometric span of 91.4 cm (36 in). The strut is
geometrically identical to that described by Harwood
et al., (2014) and Harwood, et al., (2016a,b). The strut
was vertically cantilevered, hanging below a steel
frame and piercing the water surface to a prescribed
depth of ℎ. The angle of attack was set by rotating the
strut inside of the frame and clamping it in place.
Forces and moments on the strut were measured using
a 6-DOF load transducer and instantaneous speed was
measured via an optical encoder on the towing
carriage wheels. All data were digitized and recorded
via hardware-synchronized and phase-locked A/D
converters at rates of 1-2 kHz and at 16-bit resolution.
The model described herein differs from the
rigid aluminum foil tested in previous work (Harwood
et al., 2014; Harwood, et al., 2016b) in the construction
and instrumentation of the strut itself. In the present
work, two variations of a flexible hydrofoil strut were
considered. The first was briefly described by
Harwood, et al (2016a), and is constructed of PVC,
with two instrumentation-channels located along the
chord-line. Shape-sensing spars, of the authors’ design
were inserted into these channels, with spar “A”
located near the trailing edge and spar “B” located just
forward of mid-chord. The shape-sensing spars,
described later, use strain-gauges to infer the 3D
deflections of the strut. Affixed to the end of each spar
was a single-axis accelerometer, used to measure tip-
accelerations.
The second variation on the flexible strut
used the same model, with an aluminum strip 0.6 cm
thick × 2.79 cm wide (0.25 in × 1.1 in) affixed to the
trailing edge. The strip provided additional rigidity in
bending and moved the elastic axis of the strut aft. The
elastic axis is defined as the locus of sectional shear
centers, such that loads applied along the elastic axis
do not induce any twisting motion of the strut. Figure
1a depicts the sections of both flexible struts (with and
without the aluminum strip). Figure 1b shows the
experimental setup, with the locations of the sensors
indicated by callouts. In the following text, the PVC
strut without the reinforcement will be referred to as
model 1, and the reinforced PVC strut will be referred
to as model 2. The beam-section properties of the two
models are given in Table 1.
A shaker motor (Modal Shop model 2007E)
was hung from the mounting-structure and attached to
the hydrofoil via a nylon stinger, as shown in Figure
1b. The motor has a frequency response of 0-10kHz
and a maximum force amplitude of 31 N (7 lbf). An
impedance-head, mounted between the stinger and the
hydrofoil, was used to measure forces and
accelerations at the drive-point.
Table 1. Beam section properties of hydrofoil models
Model 1 Model 2
Chord, m 0.2794 0.2858
Geometric span, m 0.9144 0.9144
Area, m^2 0.00588 0.00606
Mass/unit length, kg/m 8.74 9.22
𝑿𝑺𝑪/𝒄 (fwd of mid-chord) -0.106 -0.259
𝑿𝑪𝑮/𝒄 (fwd of mid-chord) -0.045 -0.07
GJ (N-m2 / rad) 1795 2446
EI (N-m2) 1217 1947

(a)
(b)
Figure 1. (a) 2D section of flexible hydrofoil with the
locations of the shape-sensing spars. For steady
hydroelastic testing, the unmodified PVC hydrofoil
was used (model 1, pictured on top). For modal
testing, an aluminum plate was attached to the trailing
edge of the hydrofoil (model 2, pictured on bottom).
Locations of the center of gravity and shear center are
shown for each version of the foil section. (b)
Rendering of PVC hydrofoil and instrumentation.
Shape-sensing spars are installed into interior channels
of the strut, and a linear shaker-motor provides
excitation to the structure. The coordinate system, as
pictured, has an origin located at the intersection of the
mid-thickness, mid-chord, and root planes.
As in previous studies, the test matrix
canvassed a three-dimensional parametric space
described by the yaw-angle (identically referred to as
the geometric angle of attack, 𝛼), the depth-based
Froude number,
𝐹𝑛ℎ =𝑈
√𝑔ℎ, (2)
and the immersed aspect ratio,
𝐴𝑅ℎ =ℎ
𝑐,
(3)
where ℎ denotes the immersed depth of the foil’s free
tip, 𝑐 is the chord-length of the foil, 𝑈 is the forward
speed of the foil, and 𝑔 is gravitational acceleration.
These quantities are shown in Figure 2.
A general method of inferring the static and
dynamic motions of the 3D hydrofoil was sought,
which was not reliant upon optical measurement of the
foil’s displacement. To this end, a type of shape-
sensing spar was developed. The method entails
instrumenting one or more slender aluminum beams,
or “spars” with strain gauges, which are then placed
inside of a parent structure. The deflections of the
spars are inferred from the measurements of strain,
which in turn permits the motions of the parent
structure to be inferred. A preliminary description of
the device and analysis method was presented by
Harwood, et al (2016), and is summarized below.
Figure 2. Sketch of the experiment installed on the
carriage of the University of Michigan towing tank.
The variables of interest are indicated in the sketch.
The shape-sensing methodology is based
upon the beam-bending equation,
𝜖𝑧 = −𝑡
2
𝜕2𝑌
𝜕𝑍2, (4)
where 𝜖𝑧 is the bending strain measured on the surface
of a beam of thickness 𝑡. A slim aluminum beam is
instrumented with single-axis strain-gauges in half-
cosine spacing along the Z-axis. In the present study,
eight gauges were used on each beam, arranged in four
half-bridges, but in general, 𝑁 locations may be
instrumented. Measuring the strain directly at 𝑁
locations and assuming a strain-free boundary
condition at the free tip (𝜖|𝑍=𝐿 = 0), an 𝑁𝑡ℎ order
polynomial is fitted to the measured strains, yielding,
𝜖�̂�(𝑍) = ∑ 𝑎𝑖𝑍𝑖
𝑁
𝑖=0
. (5)
The deflection of the beam in the 𝑌 direction is, from
equation 4, the second-integral of the strain-
distribution. The deflection may therefore be
estimated by the polynomial,
�̂�𝑍(𝑍) = ∑ 𝐴𝑖𝑍𝑖
𝑁+2
𝑖=0
, (6)
where
𝐴𝑖 = {𝑎𝑖−2(𝑖 − 2)!
𝑖!, 𝑖 = 2,3, … . 𝑁 + 2. (7)
Coefficients 𝐴0 and 𝐴1 are determined from the
boundary conditions at the root of the spar. If the spar
is perfectly clamped at the root, then 𝐴0 = 𝐴1 = 0.
However, early testing demonstrated that the root
boundary condition of the spars in-situ was better-
described by a torsional spring, which permits a
nonzero slope at the root, i.e. �̂�′(𝑍)|𝑍=0
≠ 0, while no
displacement occurs at the root. 𝐴0 = 0 satisfies the
zero-displacement conditions, and 𝐴1 is defined as,
𝐴1 = −𝜅𝜖�̂�|𝑍=0. (8)
Here, 𝜅 is a dimensionless compliance factor, which
permits the root of the spar to take on a nonzero slope,
proportional to the applied moment at the root.
Once 𝜅 is determined, as described in the
following text, then the deflection along the Y-axis
along the beam is given by EQ 6. The process is
illustrated in Figure 3. With two beams installed into
the strut at different chord-wise locations, the two
deflections can be re-cast as bending and twisting
deformations at each section. The two spars are
respectively denoted by A and B, and the twisting
deformations of the strut about the elastic axis (the
locus of sectional shear centers) are expressed,
𝜃(𝑍) = arcsin (�̂�𝐴(𝑍) − �̂�𝐵(𝑍)
𝑋𝐴 − 𝑋𝐵
), (9)
Where 𝑋𝐴 and 𝑋𝐵 are, respectively, the chordwise
locations of spars A and B, measured forward from
mid-chord. The bending deformations at the mid-
chord position and the elastic axis may then be
expressed
𝛿𝑀𝐶(𝑍) = �̂�𝐴(𝑍) − 𝑋𝐴 sin(𝜃(𝑍)); (10)
𝛿𝐸𝐴(𝑍) = �̂�𝐴(𝑍) − ⋯
(𝑋𝐸𝐴 − 𝑋𝐴) sin(𝜃(𝑍)). (11)
The root compliance factors 𝜅𝐴 and 𝜅𝐵 were
determined using an in-situ calibration. The strut was
clamped at the root and concentrated tension loads
were applied at a number of known chord-wise and
span-wise positions. The lateral deflections at the foil
leading and trailing edges were measured at another
known span-wise position, straight linear rules, as
shown in Figure 4. A variety of loading conditions
were applied, including pure bending (load applied
along the elastic axis), pure torsion (a couple applied
such that the lateral motion at the elastic axis was
zero), and eccentric loading (loading at chord-
positions not coincident with the elastic axis). The
measurements of the leading and trailing edge as
bending and twisting deformations at the elastic axis.
A nonlinear minimization algorithm was used to find
the vector {𝜅𝐴, 𝜅𝐵} that minimized the 𝐿2 norm of the
error in the bending and twisting deformations
predicted at the same location by the shape-sensing
spars across all tests. This process yielded a final root
compliance vector of {𝜅𝐴, 𝜅𝐵} = {7.56, 4.77}.
The results are shown in Figure 5 for the
point-load testing of the hydrofoil, with the optimized
root-compliance vector. The measured and inferred
deflections of the hydrofoil in bending and twisting,
when subjected to bending, twisting, and combined
loads, are shown. The percentage error was calculated
as the ratio of the root-mean-square error to the root-
mean-square of the deflections. In bending, for
example,
% 𝐸𝑟𝑟𝑜𝑟 ≡𝑅𝑀𝑆(𝛿 − �̂�)
𝑅𝑀𝑆(𝛿). (12)
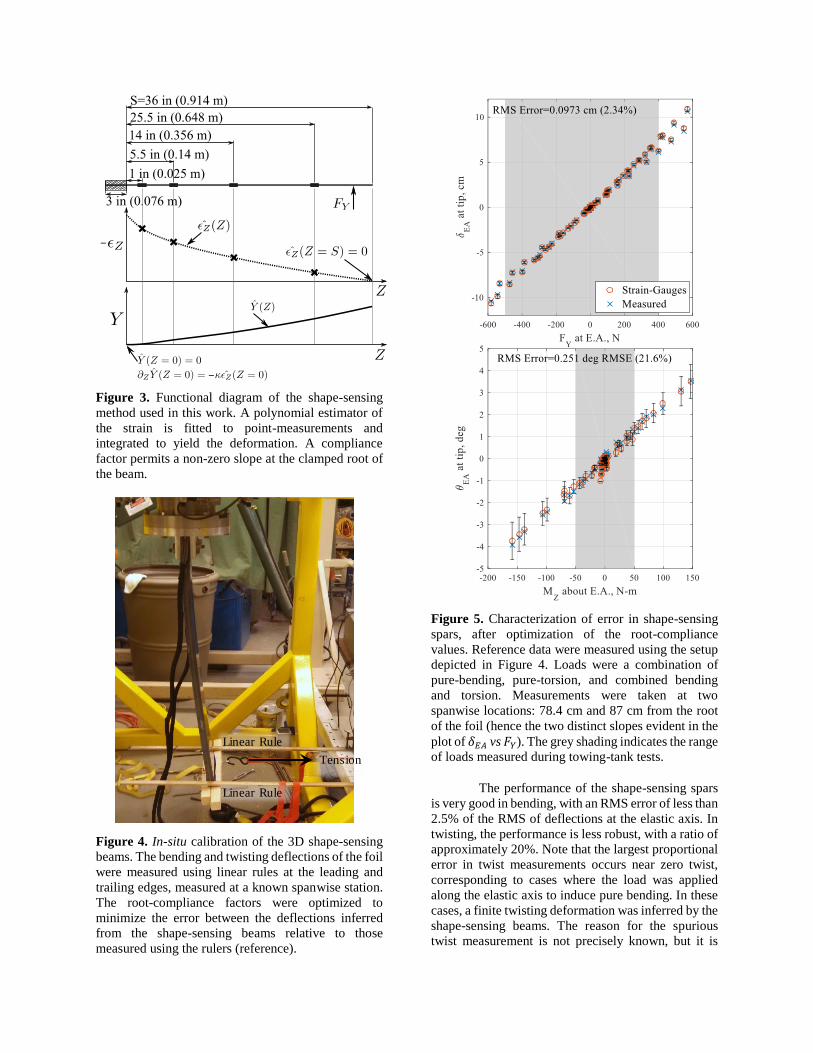
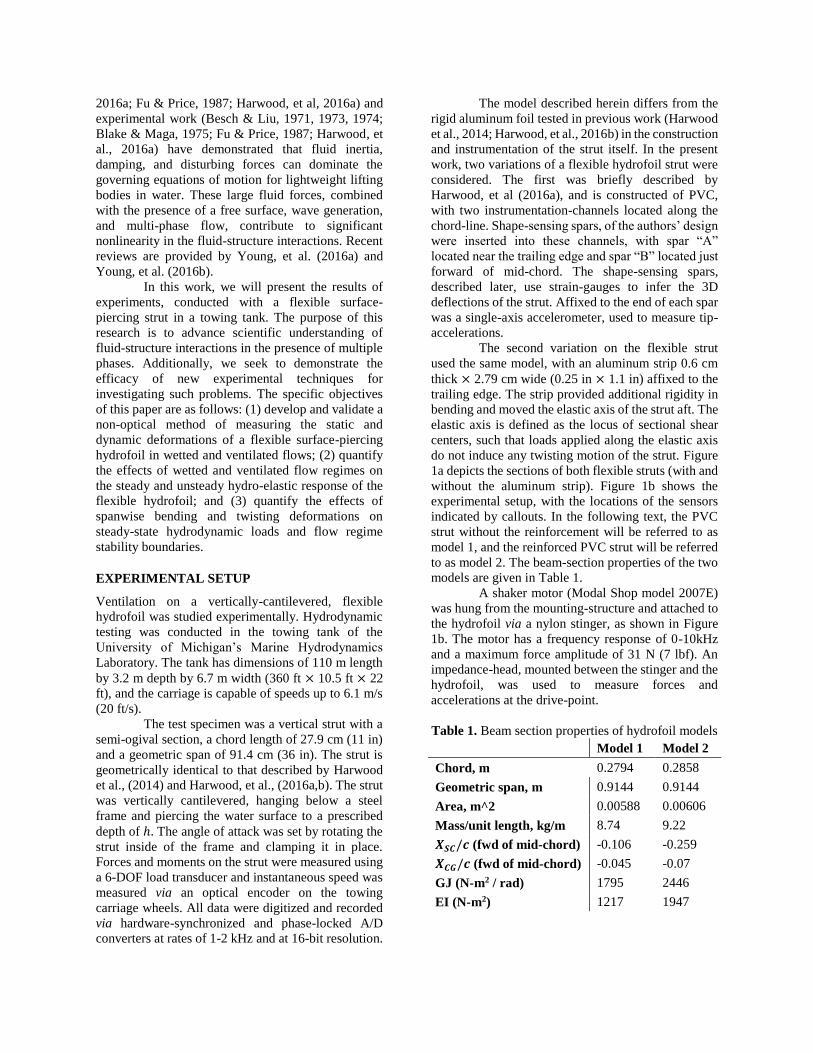
Figure 3. Functional diagram of the shape-sensing
method used in this work. A polynomial estimator of
the strain is fitted to point-measurements and
integrated to yield the deformation. A compliance
factor permits a non-zero slope at the clamped root of
the beam.
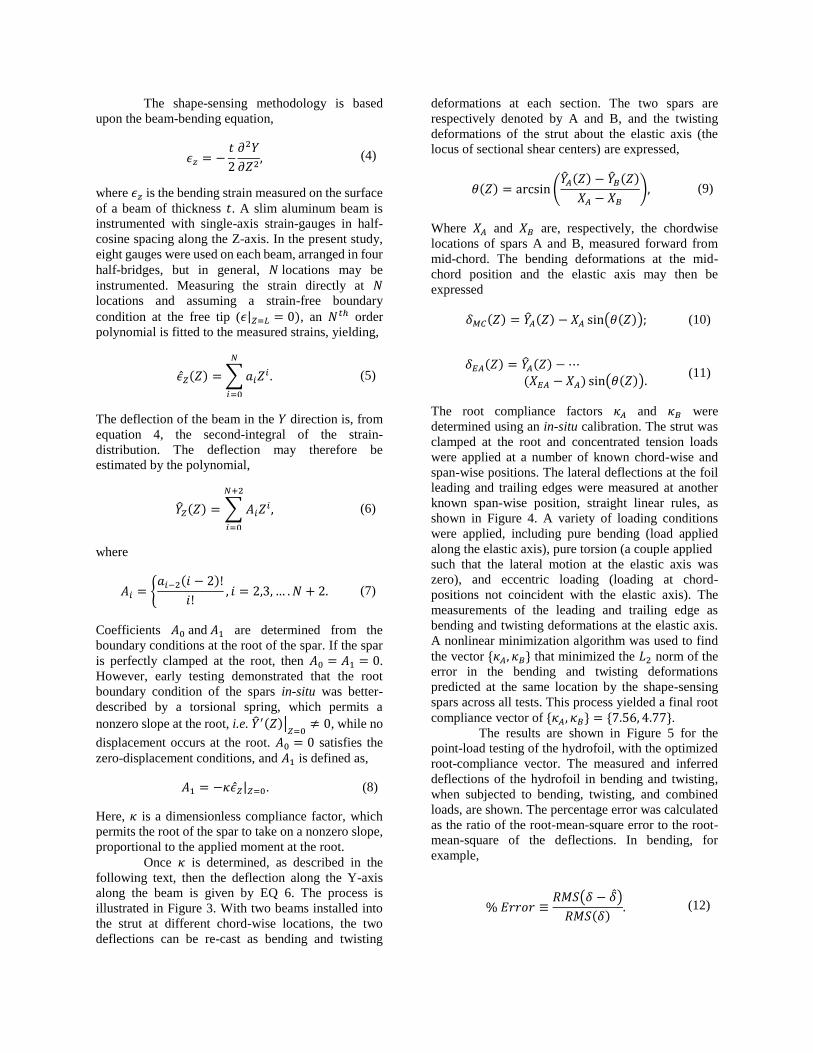
Figure 4. In-situ calibration of the 3D shape-sensing
beams. The bending and twisting deflections of the foil
were measured using linear rules at the leading and
trailing edges, measured at a known spanwise station.
The root-compliance factors were optimized to
minimize the error between the deflections inferred
from the shape-sensing beams relative to those
measured using the rulers (reference).
Figure 5. Characterization of error in shape-sensing
spars, after optimization of the root-compliance
values. Reference data were measured using the setup
depicted in Figure 4. Loads were a combination of
pure-bending, pure-torsion, and combined bending
and torsion. Measurements were taken at two
spanwise locations: 78.4 cm and 87 cm from the root
of the foil (hence the two distinct slopes evident in the
plot of 𝛿𝐸𝐴 vs 𝐹𝑌). The grey shading indicates the range
of loads measured during towing-tank tests.
The performance of the shape-sensing spars
is very good in bending, with an RMS error of less than
2.5% of the RMS of deflections at the elastic axis. In
twisting, the performance is less robust, with a ratio of
approximately 20%. Note that the largest proportional
error in twist measurements occurs near zero twist,
corresponding to cases where the load was applied
along the elastic axis to induce pure bending. In these
cases, a finite twisting deformation was inferred by the
shape-sensing beams. The reason for the spurious
twist measurement is not precisely known, but it is
Tension
Linear Rule
Linear Rule
believed to follow from the imperfectly-clamped
boundary condition at the foil’s root and, possibly,
from imperfect mounting of the strain gauges. It is
unsurprising that the performance of the shape-sensing
spars in torsion is less reliable than in bending because
the twist angle is computed from the small difference
between two relatively large deformations along the
chord. Thus, even negligible errors in the lateral
deflection along either spar are amplified in the twist-
measurement error.
The performance of the shape-sensing spars
is actually quite promising. They permit deflections to
be reliably inferred without a line-of-sight to the
hydrofoil and without interfering with the flow.
MODAL ANALYSIS OF FLEXIBLE FOIL
To identify the resonant frequencies, mode shapes, and
modal damping factors of the reinforced PVC
hydrofoil (model 2), modal analysis was conducted.
The shaker motor was used produce harmonic
excitation of the hydrofoil over a range of frequencies
of interest. The ratio of output to input signals may be
represented in the frequency domain by a complex-
valued frequency response function (FRF). When the
output has units of acceleration, the FRF is known as
an inertance function. When the output is a structural
deflection, the FRF is a compliance function. The
excitation force was measured as the system input.
Output measurements consisted of tip-accelerations
and the inferred deflections from the shape-sensing
spars. The two types of outputs were used to construct
estimates of the inertance and compliance FRF of the
hydrofoil, respectively. Tests were conducted with the
hydrofoil in air and at an immersed aspect ratio of
𝐴𝑅ℎ = 1, in still water and with forward speed in
wetted and ventilated flow.
The excitation signal was a linearly-swept
sine wave. The data-acquisition PC was used to
generate a pulse train at the desired frequency, to
which a pair of lock-in amplifiers (Stanford Research
Systems SR830) were phase-locked and used to
generate a sinusoid at the commanded frequency. The
sine wave was amplified through a conventional
analogue power-amplifier to drive the shaker motor.
The accelerometers at the tip of each shape-sensing
spar were connected to inputs of the lock-in amplifiers,
permitting the magnitude and phase of the structural
accelerations to be monitored on-line.
The excitation force at the drive-point of the
shaker motor was recorded as the system input. The
foil-tip accelerations were recorded as system
acceleration outputs. The inferred deflections, from
the shape sensing spars, were interpolated at 20 points
and recorded as the deflection outputs. The over-
interpolation of the deflections provided robustness
against numerical issues in the following analyses.
Simultaneous measurements of the
respective outputs at different points on the structure
are combined to form FRF matrices. With the shaker-
motor’s location fixed, the inferred motions of the strut
and the tip accelerations were used to estimate
columns of the compliance and inertance FRF
matrices. Estimation of each FRF was accomplished
using smoothed auto- and cross-spectral densities of
the input and respective output. The resulting FRF
estimates are denoted 𝐇𝟏𝐢𝐧𝐞𝐫𝐭 and 𝐇𝟏
𝐜𝐨𝐦𝐩 for the
inertance and compliance FRF’s, respectively. The
EASYMOD library for MATLAB was used to
generate the FRF estimates (Kouroussis, et al., 2012).
Mode shapes are estimated from the
operating deflection shapes (ODS) of the hydrofoil.
Resonances may be identified as peaks on a plot of the
FRF matrix. At a given frequency, the imaginary
component of the FRF matrix yields a vector of the
structure’s deflections or accelerations at that
respective frequency. Thus, an ODS taken at a
frequency near one of the resonant modes of the
structure will be dominated by the underlying linear
normal mode shape of the structure.
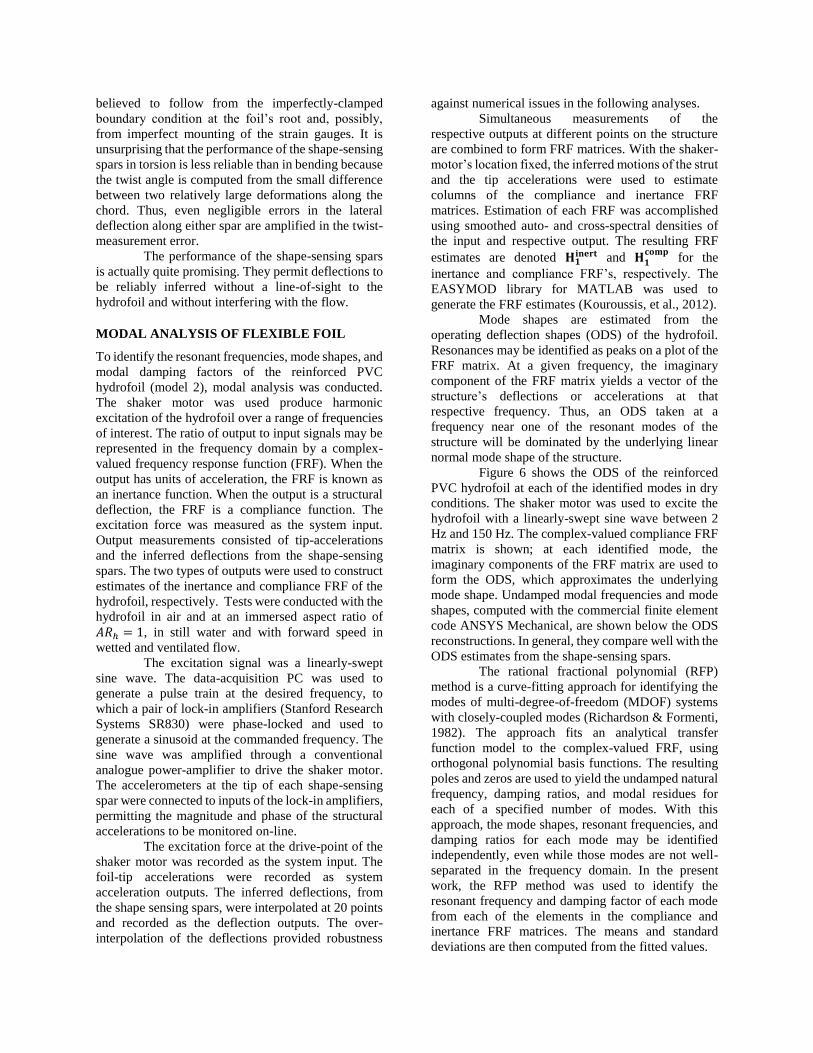
Figure 6 shows the ODS of the reinforced
PVC hydrofoil at each of the identified modes in dry
conditions. The shaker motor was used to excite the
hydrofoil with a linearly-swept sine wave between 2
Hz and 150 Hz. The complex-valued compliance FRF
matrix is shown; at each identified mode, the
imaginary components of the FRF matrix are used to
form the ODS, which approximates the underlying
mode shape. Undamped modal frequencies and mode
shapes, computed with the commercial finite element
code ANSYS Mechanical, are shown below the ODS
reconstructions. In general, they compare well with the
ODS estimates from the shape-sensing spars.
The rational fractional polynomial (RFP)
method is a curve-fitting approach for identifying the
modes of multi-degree-of-freedom (MDOF) systems
with closely-coupled modes (Richardson & Formenti,
1982). The approach fits an analytical transfer
function model to the complex-valued FRF, using
orthogonal polynomial basis functions. The resulting
poles and zeros are used to yield the undamped natural
frequency, damping ratios, and modal residues for
each of a specified number of modes. With this
approach, the mode shapes, resonant frequencies, and
damping ratios for each mode may be identified
independently, even while those modes are not well-
separated in the frequency domain. In the present
work, the RFP method was used to identify the
resonant frequency and damping factor of each mode
from each of the elements in the compliance and
inertance FRF matrices. The means and standard
deviations are then computed from the fitted values.
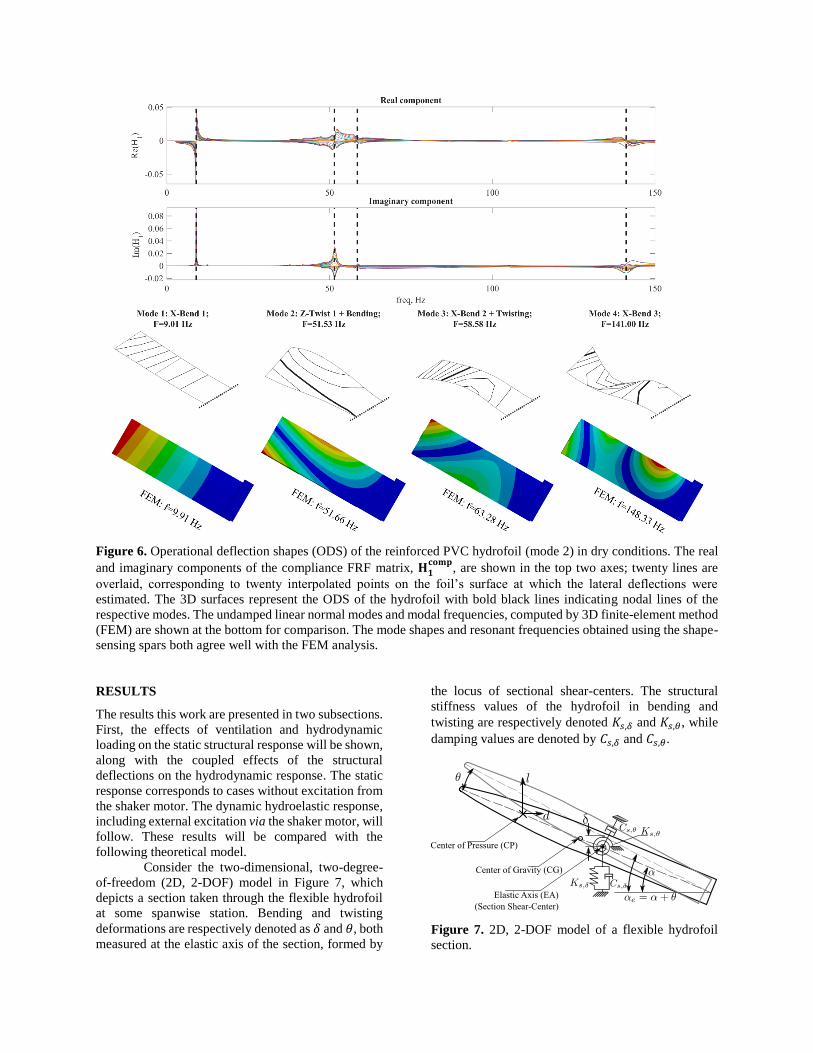
Figure 6. Operational deflection shapes (ODS) of the reinforced PVC hydrofoil (mode 2) in dry conditions. The real
and imaginary components of the compliance FRF matrix, 𝐇𝟏𝐜𝐨𝐦𝐩
, are shown in the top two axes; twenty lines are
overlaid, corresponding to twenty interpolated points on the foil’s surface at which the lateral deflections were
estimated. The 3D surfaces represent the ODS of the hydrofoil with bold black lines indicating nodal lines of the
respective modes. The undamped linear normal modes and modal frequencies, computed by 3D finite-element method
(FEM) are shown at the bottom for comparison. The mode shapes and resonant frequencies obtained using the shape-
sensing spars both agree well with the FEM analysis.
RESULTS
The results this work are presented in two subsections.
First, the effects of ventilation and hydrodynamic
loading on the static structural response will be shown,
along with the coupled effects of the structural
deflections on the hydrodynamic response. The static
response corresponds to cases without excitation from
the shaker motor. The dynamic hydroelastic response,
including external excitation via the shaker motor, will
follow. These results will be compared with the
following theoretical model.
Consider the two-dimensional, two-degree-
of-freedom (2D, 2-DOF) model in Figure 7, which
depicts a section taken through the flexible hydrofoil
at some spanwise station. Bending and twisting
deformations are respectively denoted as 𝛿 and 𝜃, both
measured at the elastic axis of the section, formed by
the locus of sectional shear-centers. The structural
stiffness values of the hydrofoil in bending and
twisting are respectively denoted 𝐾𝑠,𝛿 and 𝐾𝑠,𝜃, while
damping values are denoted by 𝐶𝑠,𝛿 and 𝐶𝑠,𝜃.
Figure 7. 2D, 2-DOF model of a flexible hydrofoil
section.

The general equations of motion for the 2D
model may be written in matrix form as,
[𝑚 𝑆𝜃
𝑆𝜃 𝐼𝜃] {�̈�
�̈�} + [
𝐶𝑠,𝛿 0
0 𝐶𝑠,𝜃] {�̇�
�̇�} …
+ [𝐾𝑠,𝛿 0
0 𝐾𝑠,𝜃] {
𝛿𝜃
}
= 𝑭𝑬𝑿 + 𝑭𝐻 .
(13)
𝑚 is the section’s mass per unit span, 𝐼𝜃 is the polar
mass moment of inertia about the elastic axis, and 𝑆𝜃
is the static unbalance.
𝑭𝑬𝑿 is a vector of the disturbing force and
moment exerted by an external source. 𝑭𝑯 is a general
form of the fluid disturbing force vector,
𝑭𝑯 = {𝑙
𝑚𝑍}. (14)
Where 𝑙 and 𝑚𝑍 are respectively the lift and moment
per unit span. Steady, quasi steady, and unsteady
hydrodynamic theory may be used to model 𝐹𝐻. The
resulting hydrodynamic forces can augment or detract
from the effective system mass, damping, and stiffness
matrices, and can induce coupling between otherwise-
decoupled degrees of freedom (Chae, et al, 2016a,
2016b).
Static Hydroelastic Response (Model 1)
In steady conditions, the hydrodynamic force
components are given by steady-state hydrodynamic
theory. Using linear theory, the lift per unit span is
given by,
𝑙 = 𝐶𝑙𝑞𝑐 = 𝑎0𝛼𝑒𝑞𝑐, (15)
where 𝐶𝑙 is the 2D lift coefficient, 𝑞 =𝜌
2𝑈2 is the fluid
dynamic pressure, and 𝑎0 is the linearized slope of the
lift-coefficient as a function of the angle of attack, 𝛼. The twisting moment is given by,
𝑚𝑍 = 𝐶𝑚𝑞𝑐2 = 𝑎0𝛼𝑒
2𝑞𝑐2, (16)
where 𝑒 is the distance from the elastic axis to the
center of pressure, nondimensionalized by the semi-
chord. With EQs 15 and 16 substituted into 𝑭𝑯, EQ 13
may be solved for the steady-state deflections,
𝛿 =𝑎0𝛼𝑞𝑐
𝐾𝑠,𝛿
(1 +𝑎0
𝑒2
𝑞𝑐2
𝐾𝑠,𝜃 − 𝑎0𝑒2
𝑞𝑐2) ; (17)
𝜃 =𝑎0𝛼𝑒
𝑒2
𝑞𝑐2
𝐾𝑠,𝜃 − 𝑎0𝑒2
𝑞𝑐2. (18)
Contours of the 3D lift and moment
coefficients, 𝐶𝐿 and 𝐶𝑀 are shown in Figure 8, along
with contours of the dimensionless static bending and
twisting deformations measured the tip of the
hydrofoil. The 3D lift and moment coefficients are
defined as,
𝐶𝐿 =𝐿
𝑞𝑐ℎ; (19)
𝐶𝑀 =𝑀𝑍
𝑞𝑐2ℎ. (20)
The FW and FV flow regimes are respectively
represented by the blue and red contour lines. As also
described in Breslin & Skalak, (1959); Harwood et al.,
(2014); Harwood, et al, (2016b); Rothblum et al.,
(1969); Rothblum, (1977); Swales, et al, (1973);
Swales et al, (1974), the transition from FW to FV
flow is accompanied by dramatic reductions in the lift
and moment coefficients. In general, the lift is reduced
because the ingestion of air along the suction-surface
of the strut limits the development of low-pressures
which are instrumental in generating large forces. The
moment coefficient is attenuated both because the lift
is reduced and because the center of pressure translates
from its location of approximately 0.25𝑐 forward of
mid-chord in FW flow towards a position at mid-chord
in FV flow, causing both the lift and its moment arm
to be reduced. The result of the attenuated lift is a
proportional attenuation of the tip deflections, and a
result of the reduction in twisting moment is a
reduction in the static twist angle.
Manipulating EQ 18 yields the dimensionless
scaling expression,
𝜃
𝜃 + 𝛼=
𝑐
2𝐾𝑠,𝜃
𝑒 𝑎0 𝑞 ∝ 𝑒𝑎0𝐹𝑛ℎ2 . (21)
For a given lift-slope, 𝑎0, and a fixed center of pressure
(constant 𝑒), EQ 21 predicts a linear relationship
between the squared Froude number and the twist
ratio. The dimensionless ratio on the left-hand side of
EQ 21 is plotted in Figure 9 as a function of 𝐹𝑛ℎ2 . The
data in all three flow regimes (FW, PV, and FV) are
bounded above by the FW data, which lie along a line,
and bounded below by the FV data at 𝛼 = 25∘. It was
shown by (Harwood, et al, 2016b) that, as 𝛼 and 𝐹𝑛ℎ
increase, the mean cavity length increases, causing
both 𝑎0 and 𝑒 to decrease. The FV data behave in a
sublinear fashion with respect to 𝐹𝑛ℎ2 , and the
dimensionless twist decreases with increasing angle of
attack. Both characteristics are consistent with the
notion that both 𝑒 and 𝑎0 decrease as the ventilated
cavity grows with increasing 𝛼 and 𝐹𝑛ℎ.
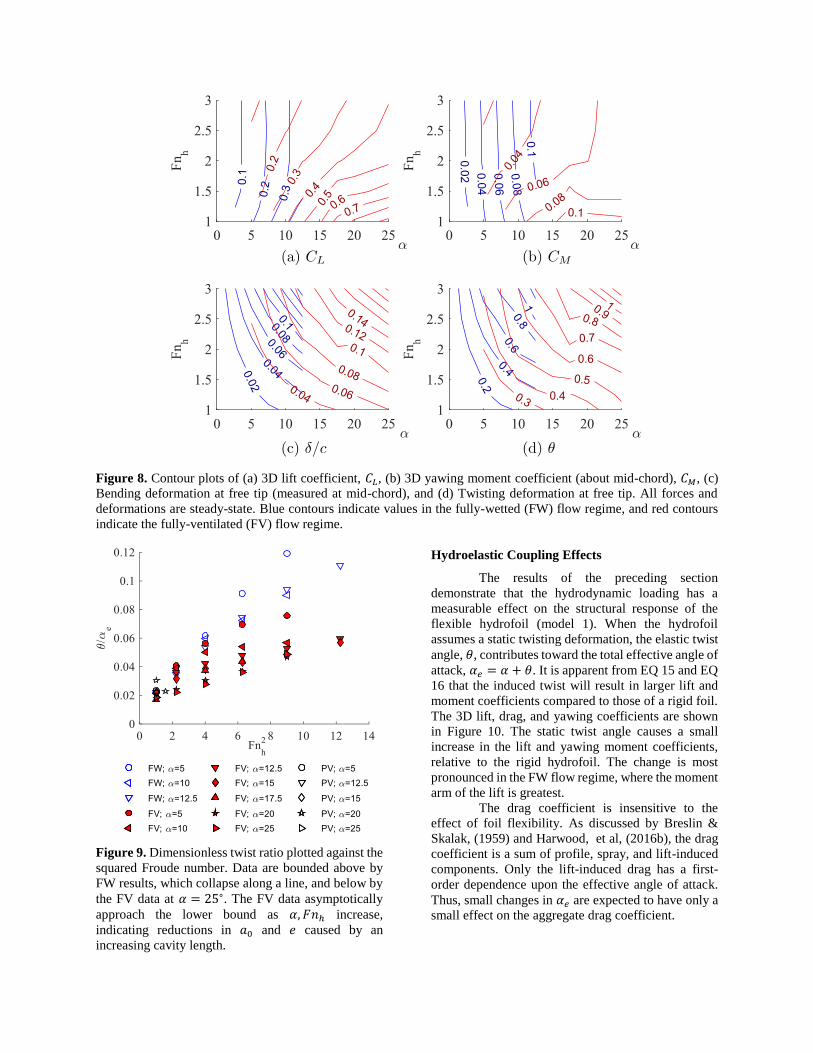
Figure 8. Contour plots of (a) 3D lift coefficient, 𝐶𝐿, (b) 3D yawing moment coefficient (about mid-chord), 𝐶𝑀, (c)
Bending deformation at free tip (measured at mid-chord), and (d) Twisting deformation at free tip. All forces and
deformations are steady-state. Blue contours indicate values in the fully-wetted (FW) flow regime, and red contours
indicate the fully-ventilated (FV) flow regime.
Figure 9. Dimensionless twist ratio plotted against the
squared Froude number. Data are bounded above by
FW results, which collapse along a line, and below by
the FV data at 𝛼 = 25∘. The FV data asymptotically
approach the lower bound as 𝛼, 𝐹𝑛ℎ increase,
indicating reductions in 𝑎0 and 𝑒 caused by an
increasing cavity length.
Hydroelastic Coupling Effects
The results of the preceding section
demonstrate that the hydrodynamic loading has a
measurable effect on the structural response of the
flexible hydrofoil (model 1). When the hydrofoil
assumes a static twisting deformation, the elastic twist
angle, 𝜃, contributes toward the total effective angle of
attack, 𝛼𝑒 = 𝛼 + 𝜃. It is apparent from EQ 15 and EQ
16 that the induced twist will result in larger lift and
moment coefficients compared to those of a rigid foil.
The 3D lift, drag, and yawing coefficients are shown
in Figure 10. The static twist angle causes a small
increase in the lift and yawing moment coefficients,
relative to the rigid hydrofoil. The change is most
pronounced in the FW flow regime, where the moment
arm of the lift is greatest.
The drag coefficient is insensitive to the
effect of foil flexibility. As discussed by Breslin &
Skalak, (1959) and Harwood, et al, (2016b), the drag
coefficient is a sum of profile, spray, and lift-induced
components. Only the lift-induced drag has a first-
order dependence upon the effective angle of attack.
Thus, small changes in 𝛼𝑒 are expected to have only a
small effect on the aggregate drag coefficient.

Figure 10. (a) 3D lift coefficient, (b) 3D drag
coefficient, and (c) 3D moment coefficient (about
mid-chord) as functions of 𝛼 for 𝐹𝑛ℎ = 3, 𝐴𝑅ℎ = 1. Results shown were measured on the rigid aluminum
hydrofoil from Harwood, et al. (2014) and Harwood,
et al. (2016b) and the flexible PVC hydrofoil (model
1). The lift and moment coefficients are larger for the
flexible hydrofoil – a consequence of the elastic twist
angle 𝜃. The drag coefficient is less sensitive because
the viscous and form drag are insensitive to small
changes in 𝛼𝑒.
Harwood, et al, (2016) and Young, et al,
(2016) defined the unsteady transition processes of
ventilated flow: ventilation formation (comprised of
inception and stabilization) and ventilation elimination
(comprised of washout and re-wetting). These serve to
delineate the FW, PV, and FV flow regimes from one
another in a parametric space defined by 𝛼 and 𝐹𝑛ℎ by
forming transition boundaries. The formation and
elimination boundaries for the rigid and flexible
(model 1) hydrofoils are shown in Figure 11a and
Figure 11b, respectively. As in the steady
hydrodynamic loads, the effect of foil flexibility is
subtle, but consistent with the trends observed thus far.
All four boundaries (inception, stabilization, washout,
and re-wetting) for the flexible hydrofoil fall slightly
below and/or to the left of the boundaries for the rigid
hydrofoil. This indicates that for a given initial angle
of attack, 𝛼, the deformation of the hydrofoil causes
ventilation transition mechanisms to occur at
somewhat smaller Froude numbers than in the case of
the rigid hydrofoil, with the potential for slightly
greater hysteresis in the transition between regimes.
Dynamic Hydroelastic Response (Model 2)
In unsteady flows, the hydrodynamic force
vector in EQ 14 may be computed from a variety of
unsteady aerodynamic or hydrodynamic theories,
including Theodorsen’s function (Theodorsen, 1949)
or a convolution of indicial response functions based
upon Sears and Wagner functions (Bisplinghoff et al.,
1996; Brunton & Rowley, 2010; Fung, 1955; Shen &
Fuhs, 1997). The hydrodynamic disturbing force can
manifest as apparent changes to the effective mass,
damping, and stiffness matrices of the dynamical
system. As a result, the modal frequencies and
parameters of the system can change as functions of
the flow conditions and structural motions.
Figure 12 shows the averaged compliance
FRF magnitude of the reinforced PVC hydrofoil
(model 2) as a function of Froude number in the FW
and FV flow regimes. The frequency spectra of the
hydrofoil in dry conditions is also shown. The
locations of the frequency peaks, indicative of
resonance, are projected on the frequency − Fnh
plane, and are reproduced in Figure 13. Relative to the
dry resonant frequencies, the wetted modal
frequencies are significantly reduced, and the
percentage reduction varies from mode to mode. The
same observation was made by Harwood, et al,
(2016a); Kramer, et al, (2013); Motley, et al, (2013).
The reason for the reduction in frequency is an
increase in the fluid added-mass as the foil moves from
a light fluid (air) to a dense one (water). In general, the
wetted modal frequencies slightly decrease with
increasing forward speed or Froude number. This
trend is not consistent across all modes or Froude
(a)
(b)
(c)
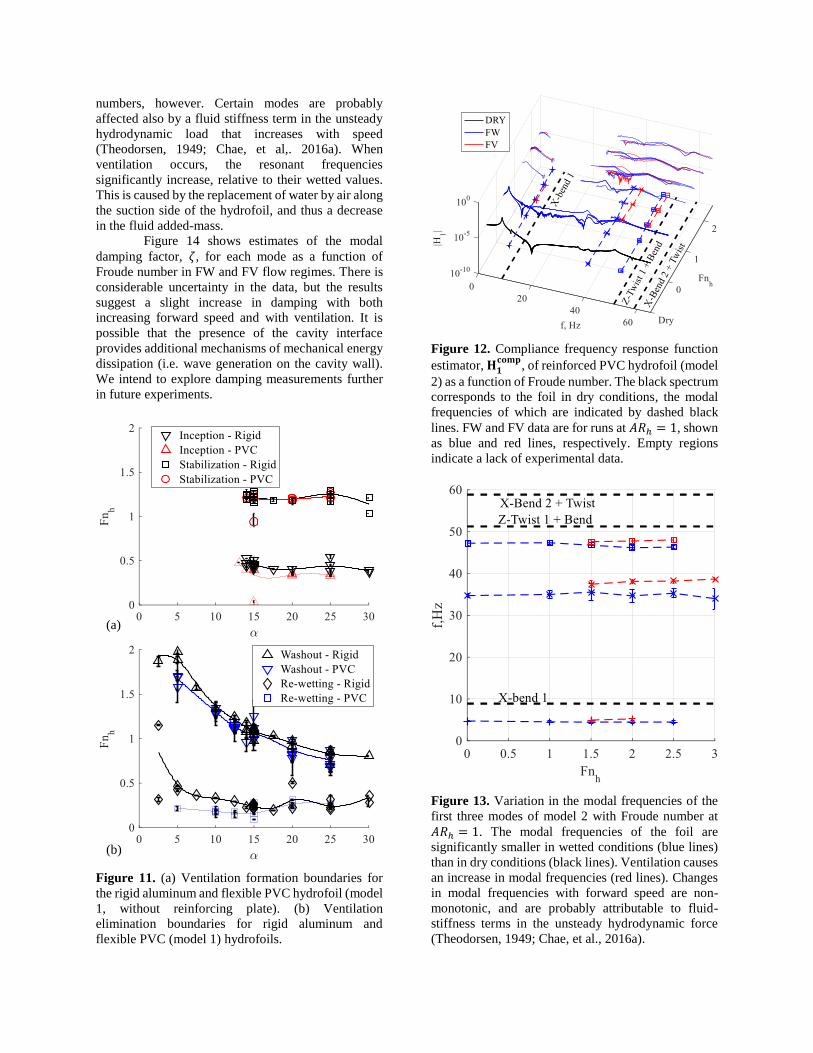
numbers, however. Certain modes are probably
affected also by a fluid stiffness term in the unsteady
hydrodynamic load that increases with speed
(Theodorsen, 1949; Chae, et al,. 2016a). When
ventilation occurs, the resonant frequencies
significantly increase, relative to their wetted values.
This is caused by the replacement of water by air along
the suction side of the hydrofoil, and thus a decrease
in the fluid added-mass.
Figure 14 shows estimates of the modal
damping factor, 𝜁, for each mode as a function of
Froude number in FW and FV flow regimes. There is
considerable uncertainty in the data, but the results
suggest a slight increase in damping with both
increasing forward speed and with ventilation. It is
possible that the presence of the cavity interface
provides additional mechanisms of mechanical energy
dissipation (i.e. wave generation on the cavity wall).
We intend to explore damping measurements further
in future experiments.
Figure 11. (a) Ventilation formation boundaries for
the rigid aluminum and flexible PVC hydrofoil (model
1, without reinforcing plate). (b) Ventilation
elimination boundaries for rigid aluminum and
flexible PVC (model 1) hydrofoils.
Figure 12. Compliance frequency response function
estimator, 𝐇𝟏𝐜𝐨𝐦𝐩
, of reinforced PVC hydrofoil (model
2) as a function of Froude number. The black spectrum
corresponds to the foil in dry conditions, the modal
frequencies of which are indicated by dashed black
lines. FW and FV data are for runs at 𝐴𝑅ℎ = 1, shown
as blue and red lines, respectively. Empty regions
indicate a lack of experimental data.
Figure 13. Variation in the modal frequencies of the
first three modes of model 2 with Froude number at
𝐴𝑅ℎ = 1. The modal frequencies of the foil are
significantly smaller in wetted conditions (blue lines)
than in dry conditions (black lines). Ventilation causes
an increase in modal frequencies (red lines). Changes
in modal frequencies with forward speed are non-
monotonic, and are probably attributable to fluid-
stiffness terms in the unsteady hydrodynamic force
(Theodorsen, 1949; Chae, et al., 2016a).
(a)
(b)
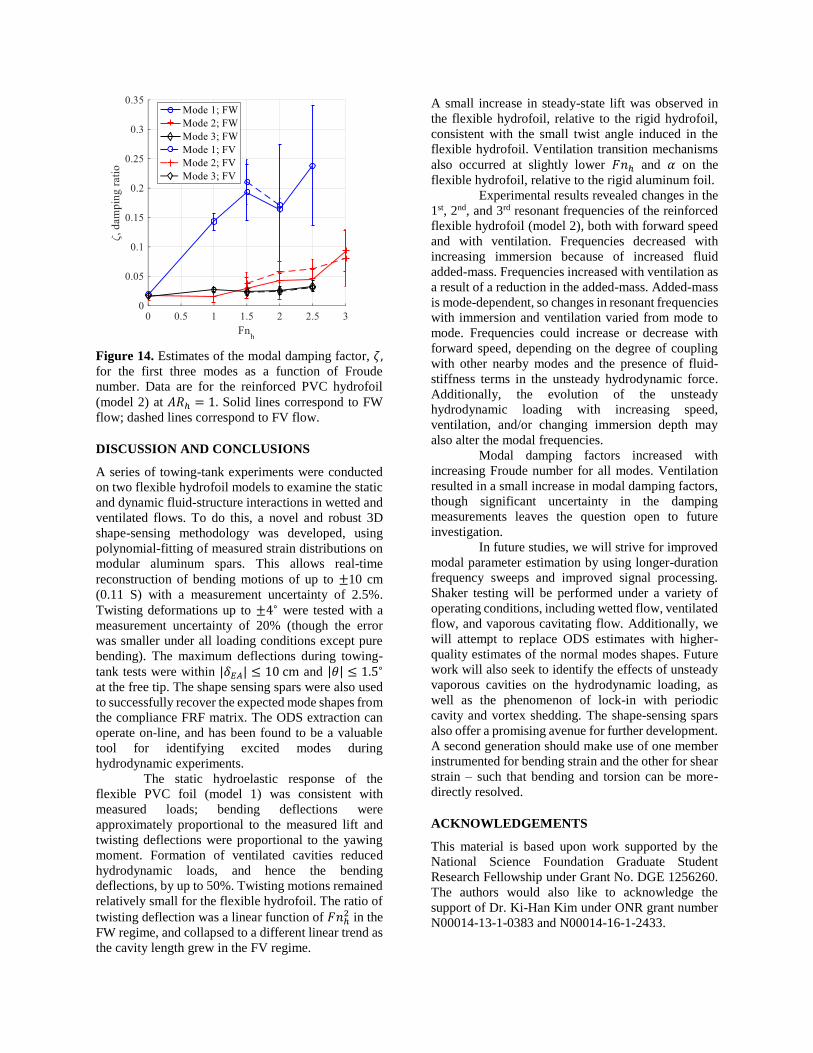
Figure 14. Estimates of the modal damping factor, 𝜁, for the first three modes as a function of Froude
number. Data are for the reinforced PVC hydrofoil
(model 2) at 𝐴𝑅ℎ = 1. Solid lines correspond to FW
flow; dashed lines correspond to FV flow.
DISCUSSION AND CONCLUSIONS
A series of towing-tank experiments were conducted
on two flexible hydrofoil models to examine the static
and dynamic fluid-structure interactions in wetted and
ventilated flows. To do this, a novel and robust 3D
shape-sensing methodology was developed, using
polynomial-fitting of measured strain distributions on
modular aluminum spars. This allows real-time
reconstruction of bending motions of up to ±10 cm
(0.11 S) with a measurement uncertainty of 2.5%.
Twisting deformations up to ±4∘ were tested with a
measurement uncertainty of 20% (though the error
was smaller under all loading conditions except pure
bending). The maximum deflections during towing-
tank tests were within |𝛿𝐸𝐴| ≤ 10 cm and |𝜃| ≤ 1.5∘
at the free tip. The shape sensing spars were also used
to successfully recover the expected mode shapes from
the compliance FRF matrix. The ODS extraction can
operate on-line, and has been found to be a valuable
tool for identifying excited modes during
hydrodynamic experiments.
The static hydroelastic response of the
flexible PVC foil (model 1) was consistent with
measured loads; bending deflections were
approximately proportional to the measured lift and
twisting deflections were proportional to the yawing
moment. Formation of ventilated cavities reduced
hydrodynamic loads, and hence the bending
deflections, by up to 50%. Twisting motions remained
relatively small for the flexible hydrofoil. The ratio of
twisting deflection was a linear function of 𝐹𝑛ℎ2 in the
FW regime, and collapsed to a different linear trend as
the cavity length grew in the FV regime.
A small increase in steady-state lift was observed in
the flexible hydrofoil, relative to the rigid hydrofoil,
consistent with the small twist angle induced in the
flexible hydrofoil. Ventilation transition mechanisms
also occurred at slightly lower 𝐹𝑛ℎ and 𝛼 on the
flexible hydrofoil, relative to the rigid aluminum foil.
Experimental results revealed changes in the
1st, 2nd, and 3rd resonant frequencies of the reinforced
flexible hydrofoil (model 2), both with forward speed
and with ventilation. Frequencies decreased with
increasing immersion because of increased fluid
added-mass. Frequencies increased with ventilation as
a result of a reduction in the added-mass. Added-mass
is mode-dependent, so changes in resonant frequencies
with immersion and ventilation varied from mode to
mode. Frequencies could increase or decrease with
forward speed, depending on the degree of coupling
with other nearby modes and the presence of fluid-
stiffness terms in the unsteady hydrodynamic force.
Additionally, the evolution of the unsteady
hydrodynamic loading with increasing speed,
ventilation, and/or changing immersion depth may
also alter the modal frequencies.
Modal damping factors increased with
increasing Froude number for all modes. Ventilation
resulted in a small increase in modal damping factors,
though significant uncertainty in the damping
measurements leaves the question open to future
investigation.
In future studies, we will strive for improved
modal parameter estimation by using longer-duration
frequency sweeps and improved signal processing.
Shaker testing will be performed under a variety of
operating conditions, including wetted flow, ventilated
flow, and vaporous cavitating flow. Additionally, we
will attempt to replace ODS estimates with higher-
quality estimates of the normal modes shapes. Future
work will also seek to identify the effects of unsteady
vaporous cavities on the hydrodynamic loading, as
well as the phenomenon of lock-in with periodic
cavity and vortex shedding. The shape-sensing spars
also offer a promising avenue for further development.
A second generation should make use of one member
instrumented for bending strain and the other for shear
strain – such that bending and torsion can be more-
directly resolved.
ACKNOWLEDGEMENTS
This material is based upon work supported by the
National Science Foundation Graduate Student
Research Fellowship under Grant No. DGE 1256260.
The authors would also like to acknowledge the
support of Dr. Ki-Han Kim under ONR grant number
N00014-13-1-0383 and N00014-16-1-2433.
REFERENCES
Akcabay, D. T., Chae, E. J., Young, Y. L., Ducoin, A.,
& Astolfi, J. A. “Cavity Induced Vibration of Flexible
Hydrofoils,” Journal of Fluids and Structures, Vol. 49,
Aug. 2014, pp. 463–484.
Akcabay, D. T., & Young, Y. L. “Influence of
Cavitation on the Hydroelastic Stability of
Hydrofoils,” Journal of Fluids and Structures, Vol. 49,
Aug. 2014, pp. 170–185.
Akcabay, D. T., & Young, Y. L. “Parametric
Excitations and Lock-in of Flexible Hydrofoils in
Two-Phase Flow,” Journal of Fluids and Structures,
Vol. 57, Aug. 2015, pp. 344–356.
Besch, P. K., & Liu, Y. "Flutter and Divergence
Characteristics of Four Low Mass Ratio Hydrofoils,"
3410, Jan. 1971, Naval Ship Research and
Development Center, Washington DC.
Besch, P. K., & Liu, Y. N. "Bending Flutter and
Torsional Flutter of Flexible Hydrofoil Struts," 4012,
Feb. 1973, Naval Ship Research and Development
Center, Washington DC.
Besch, P. K., & Liu, Y. N. "Hydroelastic Design of
Subcavitating and Cavitating Hydrofoil Strut
Systems," 4257, Apr. 1974, Naval Ship Research and
Development Center, Washington DC.
Bisplinghoff, R. L., Ashley, H., & Halfman, R. L.
“Aeroelasticity,” Dover, Mineola, New York, 1996
(Reprint of Addison-Wesley Ed., 1956).
Blake, W. K., & Maga, L. J. “On the Flow-Excited
Vibrations of Cantilever Struts in Water. I. Flow-
Induced Damping and Vibration,” Journal of the
Acoustical Society of America, Vol. 57 No. 3, Mar.
1975, pp. 610–625.
Breslin, J. P., & Skalak, R. "Exploratory Study of
Ventilated Flows About Yawed Surface-Piercing
Struts," 2-23-59W, Apr. 1959, NASA, Washington,
DC.
Brunton, S. L., & Rowley, C. W. “Unsteady
Aerodynamic Models for Agile Flight at Low
Reynolds Numbers,” New Horizons, Vol. 0552, Jan.
2010.
Chae, E. J., Akcabay, D. T., Lelong, A., & Astolfi, J.
“Numerical and Experimental Investigation of Natural
Flow-Induced Vibrations of Flexible Hydrofoils,”
Physics of Fluids, Vol. 28, No. 7, Jul. 2016a.
Chae, E. J., Akcabay, D. T., & Young, Y. L. “Dynamic
Response and Stability of a Flapping Foil in a Dense
and Viscous Fluid,” Physics of Fluids, Vol. 25 No. 10.
Oct. 2013.
Chae, E. J., Akcabay, D. T., & Young, Y. L.
“Influence of Flow-Induced Bend-Twist Coupling on
the Natural Vibration Responses of Flexible
Hydrofoils,” Journal of Fluids and Structures. 2016b,
Under Review.
Fu, Y., & Price, W. G. “Interactions Between a
Partially or Totally Immersed Vibrating Cantilever
Plate and the Surrounding Fluid,” Journal of Sound
and Vibration, Vol. 118 No. 3. Jan. 1987, pp. 495–513.
Fung, Y. C. “An Introduction to the Theory of
Aeroelasticity,” Wiley, New York, 1955.
Harwood, C. M., Brucker, K. A., Miguel Montero, F.,
Young, Y. L., & Ceccio, S. L. “Experimental and
Numerical Investigation of Ventilation Inception and
Washout Mechanisms of a Surface-Piercing
Hydrofoil,” in Proceedings of the 30th Symposium on
Naval Hydrodynamics, Hobart, Tasmania. November
2014.
Harwood, C. M., Stankovich, A. J., Young, Y. L., &
Ceccio, S. L. “Combined Experimental and Numerical
Study of the Free Vibration of Surface-Piercing
Struts,” in Proceedings of the International
Symposium on Transport Phenomenomena and
Dynamics of Rotating Machinery, Honolulu, April,
2016a.
Harwood, C. M., Young, Y. L., & Ceccio, S. L.
“Ventilated Cavities on a Surface-Piercing Hydrofoil
at Moderate Froude Numbers: Cavity Formation,
Elimination, and Stability,” Journal of Fluid
Mechanics, Vol. 800, Jun. 2016b, pp 5–56.
Kiceniuk, T. “A Preliminary Experimental Study of
Vertical Hydrofoils of Low Aspect Ratio Piercing a
Water Surface,” Report E-55.2, 1954, California
Institute of Technology, Pasadena, Calif.
Kouroussis, G., Ben Fekih, L., Conti, C., Verlinden,
O., Kouroussis, G., Ben Fekih, L., Verlinden, O.
“EASYMOD: a Matlab/Scilab Toolbox for Teaching
Modal Analysis,” in 19th International Congress on
Sound and Vibration, International Institute of
Acoustics and Vibration, Vilnius, Jul. 9–12, 2012.
Kramer, M. R., Liu, Z., & Young, Y. L. “Free
Vibration of a Cantilevered Composite Plate in Air
and in Water,” Journal of Composite Structures, Vol.
95, Jan. 2013, pp. 254–263.

Motley, M. R., Kramer, M. R., & Young, Y. L. “Free
Surface and Solid Boundary Effects on the Free
Vibration of Cantilevered Composite Plates,” Journal
of Composite Structures, Vol. 96, Feb. 2013, pp. 365–
375.
Motley, M. R., Liu, Z., & Young, Y. L. “Utilizing
Fluid-Structure Interactions to Improve Energy
Efficiency of Composite Marine Propellers in
Spatially Varying Wake,” Composite Structures, Vol.
90 No. 3, Oct. 2009, pp. 304–313.
Motley, M. R., & Young, Y. L. “Performance-Based
Design and Analysis of Flexible Composite
Propulsors,” Journal of Fluids and Structures, Vol. 27,
No. 8, Nov. 2011, pp. 1310–1325.
Richardson, M., & Formenti, D. “Parameter
Estimation from Frequency Response Measurements
Using Rational Fraction Polynomials,” Proceedings of
the International Modal Analysis Conference, Nov.
1982.
Rothblum, R. S. “Investigation of Methods of
Delaying or Controlling Ventilation on Surface-
Piercing Struts,” PhD Thesis, University of Leeds,
1977.
Rothblum, R. S., Mayer, D. A., & Wilburn, G. M.
“Ventilation, Cavitation and other Characteristics of
High Speed Surface-Piercing Struts,” 3023, July 1969,
Naval Ship Research and Development Center,
Washington DC.
Shen, Y., & Fuhs, D. “Blade Section Lift Coefficients
for Propellers at Extreme Off-Design Conditions,”
CRDKNSWC/HD-1205-02m Dec. 1997, Naval
Surface Warfare Center, Carderock Division,
Washington DC.
Swales, P. D., Wright, A. J., McGregor, R. C., & Cole,
B. N. “Pressure, Flow Visualization and Ventilation,”
Hovering Craft and Hydrofoil, Vol. 13 No. 1. October
1973, pp. 11–16.
Swales, P. D., Wright, A. J., McGregor, R. C., &
Rothblum, R. S. “The Mechanism of Ventilation
Inception on Surface Piercing Foils,” Journal of
Mechanical Engineering Science, Vol. 16, No. 1,
1974, pp. 18–24.
Theodorsen, T. “General Theory of Aerodynamic
Instability and the Mechanism of Flutter” Report 496,
Jan 1949, NACA, Washington DC.
Wetzel, J. M. “Experimental Studies of Air
Ventilation of Vertical, Semi-submerged Bodies,”
Report 57, Jul 1957, St. Anthony Falls Hydraulic
Laboratory, St. Anthony Falls, MN.
Young, Y. L., Harwood, C. M., Montero, F. M., Ward,
J. C., & Ceccio, S. L. “Ventilation of Lifting Surfaces:
Review of the Physics and Scaling Relations,”
Applied Mechanics Reviews, 2016a. Under Review.
Young, Y. L., Motley, M. R., Barber, R. B., Chae, E.
J., & Garg, N. “Adaptive Composite Marine
Propulsors and Turbines: Progress and Challenges,”
Applied Mechanics Reviews, 2016b. Under Review.
DISCUSSION #1
Thomas C. Fu, Ship System and Engineering Division
(331)
Office of Naval Research
The authors should be commended for a very complete
and detailed experimental study of a very complicated
flow phenomenon.
The authors state that the three “objectives of
this paper are as follows: (1) Develop and validate a
non-optical method of measuring the static and
dynamic deformations of a flexible surface-piercing
hydrofoil in wetted and ventilated flows; (2) Quantify
the effects of wetted and ventilated flow regimes on
the steady and unsteady hydro-elastic response of the
flexible hydrofoil; and (3) Quantify the effects of
spanwise bending and twisting deformations on
steady-state hydrodynamic loads and flow regime
stability boundaries.
1. It appears that the “validation” of the
development and calibration of the shape-sensing
beam can the authors comment on any steps they
took or concerns they have concerning the
responsiveness of the system to dynamic loading,
and how they fastened the foil to the spars?
2. Additionally, can the authors comment further on
the large uncertainty in the damping
measurements and things that could be done to
try to reduce this uncertainty?
AUTHOR’S REPLY
We wish to thank Dr. Fu for taking the time to review
our submission, and we appreciate his feedback. We
have provided responses to each discussion point in
the following text.
Question 1: The validation & calibration process
reported in this work concerned only static loads, with
the assumption that the shape-sensing spars would
behave in substantially the same manner when
dynamically loaded. Unlike accelerometers, rate
gyros, or other similar transducers, the strain gauges
should not suffer from phasing issues, resonance, or
finite response times because they are not themselves
characterized as dynamical systems.
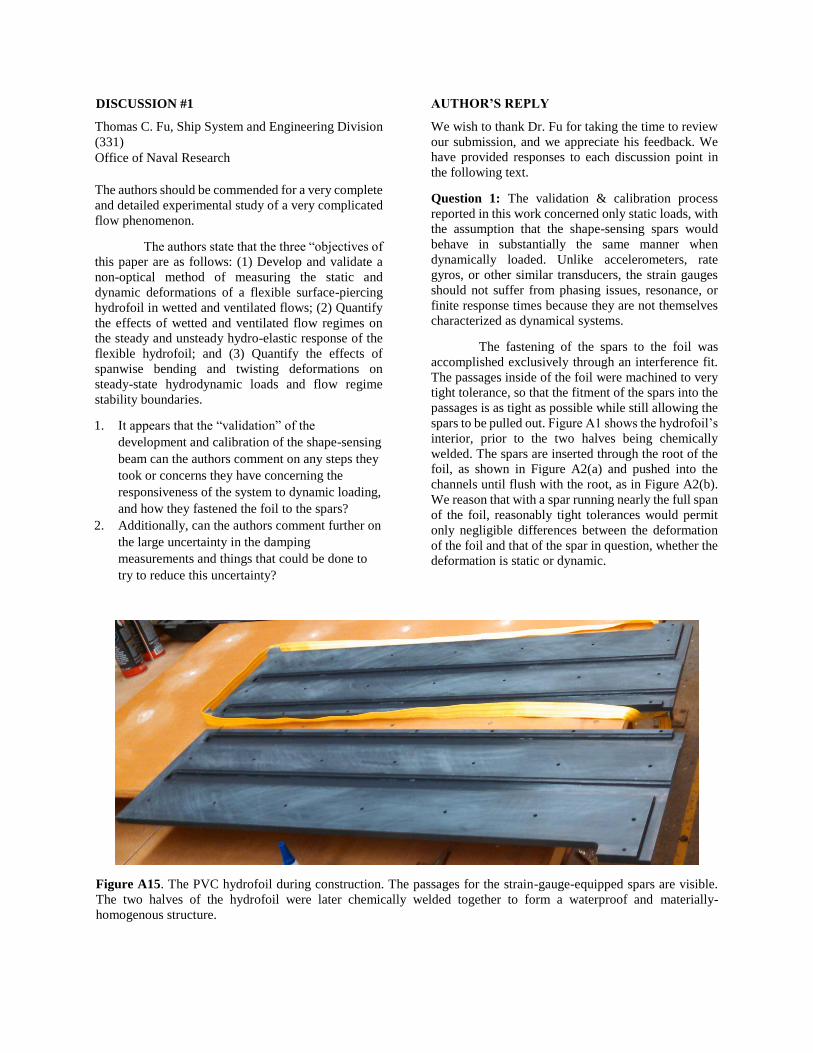
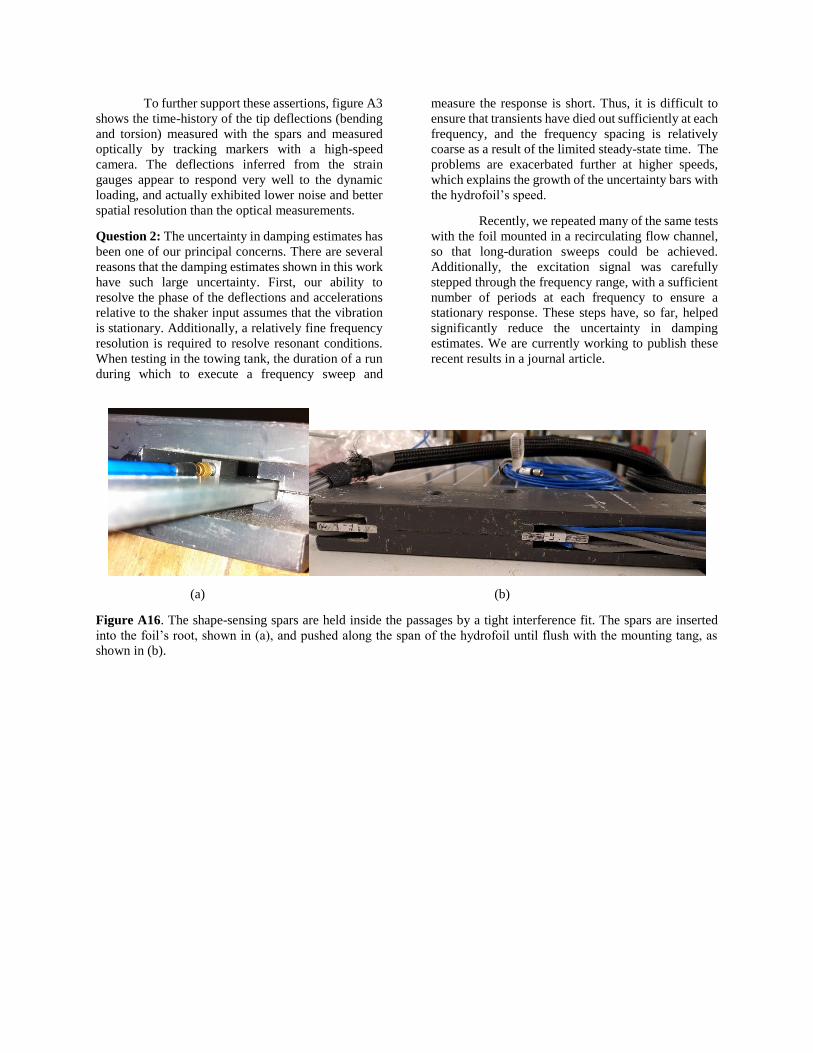
The fastening of the spars to the foil was
accomplished exclusively through an interference fit.
The passages inside of the foil were machined to very
tight tolerance, so that the fitment of the spars into the
passages is as tight as possible while still allowing the
spars to be pulled out. Figure A1 shows the hydrofoil’s
interior, prior to the two halves being chemically
welded. The spars are inserted through the root of the
foil, as shown in Figure A2(a) and pushed into the
channels until flush with the root, as in Figure A2(b).
We reason that with a spar running nearly the full span
of the foil, reasonably tight tolerances would permit
only negligible differences between the deformation
of the foil and that of the spar in question, whether the
deformation is static or dynamic.
Figure A15. The PVC hydrofoil during construction. The passages for the strain-gauge-equipped spars are visible.
The two halves of the hydrofoil were later chemically welded together to form a waterproof and materially-
homogenous structure.
To further support these assertions, figure A3
shows the time-history of the tip deflections (bending
and torsion) measured with the spars and measured
optically by tracking markers with a high-speed
camera. The deflections inferred from the strain
gauges appear to respond very well to the dynamic
loading, and actually exhibited lower noise and better
spatial resolution than the optical measurements.
Question 2: The uncertainty in damping estimates has
been one of our principal concerns. There are several
reasons that the damping estimates shown in this work
have such large uncertainty. First, our ability to
resolve the phase of the deflections and accelerations
relative to the shaker input assumes that the vibration
is stationary. Additionally, a relatively fine frequency
resolution is required to resolve resonant conditions.
When testing in the towing tank, the duration of a run
during which to execute a frequency sweep and
measure the response is short. Thus, it is difficult to
ensure that transients have died out sufficiently at each
frequency, and the frequency spacing is relatively
coarse as a result of the limited steady-state time. The
problems are exacerbated further at higher speeds,
which explains the growth of the uncertainty bars with
the hydrofoil’s speed.
Recently, we repeated many of the same tests
with the foil mounted in a recirculating flow channel,
so that long-duration sweeps could be achieved.
Additionally, the excitation signal was carefully
stepped through the frequency range, with a sufficient
number of periods at each frequency to ensure a
stationary response. These steps have, so far, helped
significantly reduce the uncertainty in damping
estimates. We are currently working to publish these
recent results in a journal article.
(a) (b)
Figure A16. The shape-sensing spars are held inside the passages by a tight interference fit. The spars are inserted
into the foil’s root, shown in (a), and pushed along the span of the hydrofoil until flush with the mounting tang, as
shown in (b).
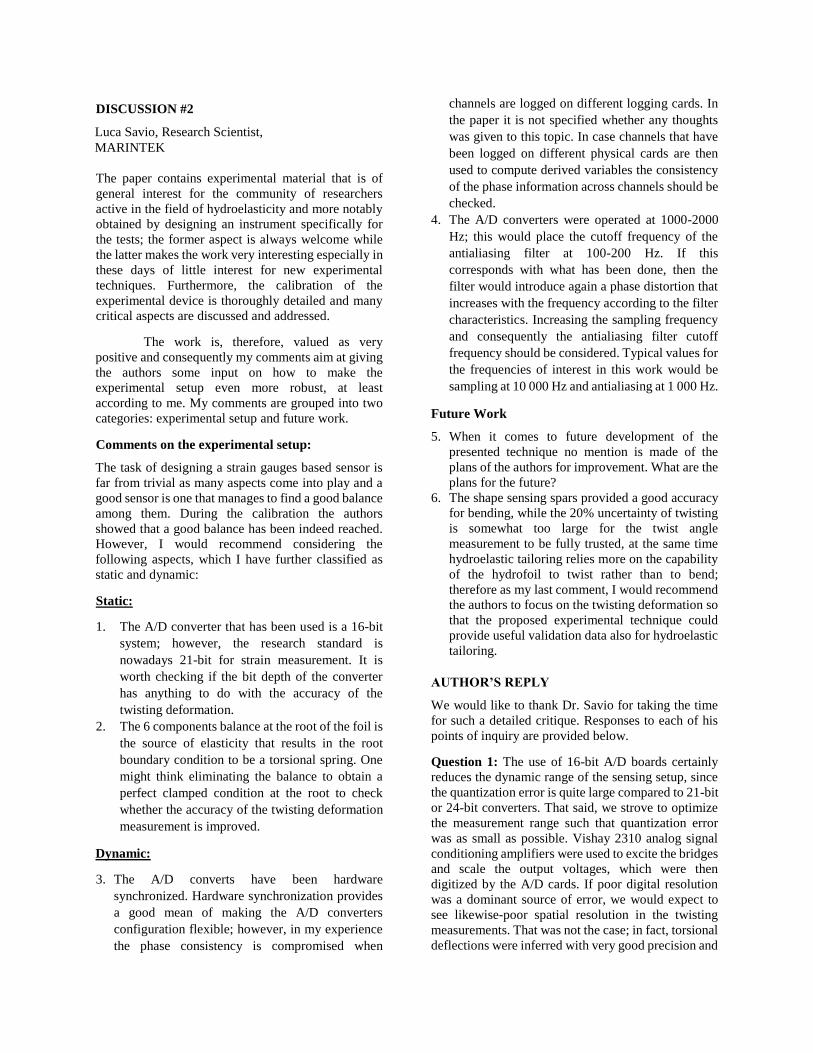
DISCUSSION #2
Luca Savio, Research Scientist,
MARINTEK
The paper contains experimental material that is of
general interest for the community of researchers
active in the field of hydroelasticity and more notably
obtained by designing an instrument specifically for
the tests; the former aspect is always welcome while
the latter makes the work very interesting especially in
these days of little interest for new experimental
techniques. Furthermore, the calibration of the
experimental device is thoroughly detailed and many
critical aspects are discussed and addressed.
The work is, therefore, valued as very
positive and consequently my comments aim at giving
the authors some input on how to make the
experimental setup even more robust, at least
according to me. My comments are grouped into two
categories: experimental setup and future work.
Comments on the experimental setup:
The task of designing a strain gauges based sensor is
far from trivial as many aspects come into play and a
good sensor is one that manages to find a good balance
among them. During the calibration the authors
showed that a good balance has been indeed reached.
However, I would recommend considering the
following aspects, which I have further classified as
static and dynamic:
Static:
1. The A/D converter that has been used is a 16-bit
system; however, the research standard is
nowadays 21-bit for strain measurement. It is
worth checking if the bit depth of the converter
has anything to do with the accuracy of the
twisting deformation.
2. The 6 components balance at the root of the foil is
the source of elasticity that results in the root
boundary condition to be a torsional spring. One
might think eliminating the balance to obtain a
perfect clamped condition at the root to check
whether the accuracy of the twisting deformation
measurement is improved.
Dynamic:
3. The A/D converts have been hardware
synchronized. Hardware synchronization provides
a good mean of making the A/D converters
configuration flexible; however, in my experience
the phase consistency is compromised when
channels are logged on different logging cards. In
the paper it is not specified whether any thoughts
was given to this topic. In case channels that have
been logged on different physical cards are then
used to compute derived variables the consistency
of the phase information across channels should be
checked.
4. The A/D converters were operated at 1000-2000
Hz; this would place the cutoff frequency of the
antialiasing filter at 100-200 Hz. If this
corresponds with what has been done, then the
filter would introduce again a phase distortion that
increases with the frequency according to the filter
characteristics. Increasing the sampling frequency
and consequently the antialiasing filter cutoff
frequency should be considered. Typical values for
the frequencies of interest in this work would be
sampling at 10 000 Hz and antialiasing at 1 000 Hz.
Future Work
5. When it comes to future development of the
presented technique no mention is made of the
plans of the authors for improvement. What are the
plans for the future?
6. The shape sensing spars provided a good accuracy
for bending, while the 20% uncertainty of twisting
is somewhat too large for the twist angle
measurement to be fully trusted, at the same time
hydroelastic tailoring relies more on the capability
of the hydrofoil to twist rather than to bend;
therefore as my last comment, I would recommend
the authors to focus on the twisting deformation so
that the proposed experimental technique could
provide useful validation data also for hydroelastic
tailoring.
AUTHOR’S REPLY
We would like to thank Dr. Savio for taking the time
for such a detailed critique. Responses to each of his
points of inquiry are provided below.
Question 1: The use of 16-bit A/D boards certainly
reduces the dynamic range of the sensing setup, since
the quantization error is quite large compared to 21-bit
or 24-bit converters. That said, we strove to optimize
the measurement range such that quantization error
was as small as possible. Vishay 2310 analog signal
conditioning amplifiers were used to excite the bridges
and scale the output voltages, which were then
digitized by the A/D cards. If poor digital resolution
was a dominant source of error, we would expect to
see likewise-poor spatial resolution in the twisting
measurements. That was not the case; in fact, torsional
deflections were inferred with very good precision and
low noise. Figure A3, below, is produced from recent
tests. Deformations were measured with the strain-
gauge arrays as described in this paper, as well as by
optically tracking several markers on the foil’s tip with
a high-speed camera. The foil was excited at the first
bending frequency in still-water conditions. Note that
the optical measurements are quite noisy – a result of
dropouts in visual access to markers during certain
frames. However, the strain-gauge reconstructions are
quite smooth, with very good resolution in both
bending and torsion. This, of course, does not address
the issue of the sensors’ accuracy, but it suggests that
insufficient digital resolution is probably not a source
of twisting error.
Question 2: This is a very good point, and it would
certainly be interesting to perform the calibration
again with a rigid member in place of the load cell. The
load cell used in this test is an overbuilt unit with an
extremely stiff construction. Torsional spring
constants are 1.6×10⁶ − 3.3×10⁶ 𝑁𝑚/𝑟𝑎𝑑 for each
axis, so angular deflections are expected to be on the
order of 0.01 degree for the loads reported herein. That
said, small discrepancies in measured deflections are
– as we mention in the report – amplified when
converted into torsional deflections, so the load cell is
quite feasibly a source of error.
Question 3: This is a pertinent question, and one upon
which we would like to expand our discussion
somewhat. There are two obvious reasons that data
channels may be logged asynchronously or out of
phase with one another. The first source is, as Dr.
Savio suggests, potential for phase mismatch between
the clocks on the individual boards in a component
DAQ system with many boards. In an ideal setup, all
sampling would be performed on a single board with
synchronized A/D converters. In reality, the boards
each used a single A/D converter muxed between 8-16
channels. The “switching” delay is another possible
source of phase mismatch between channels.
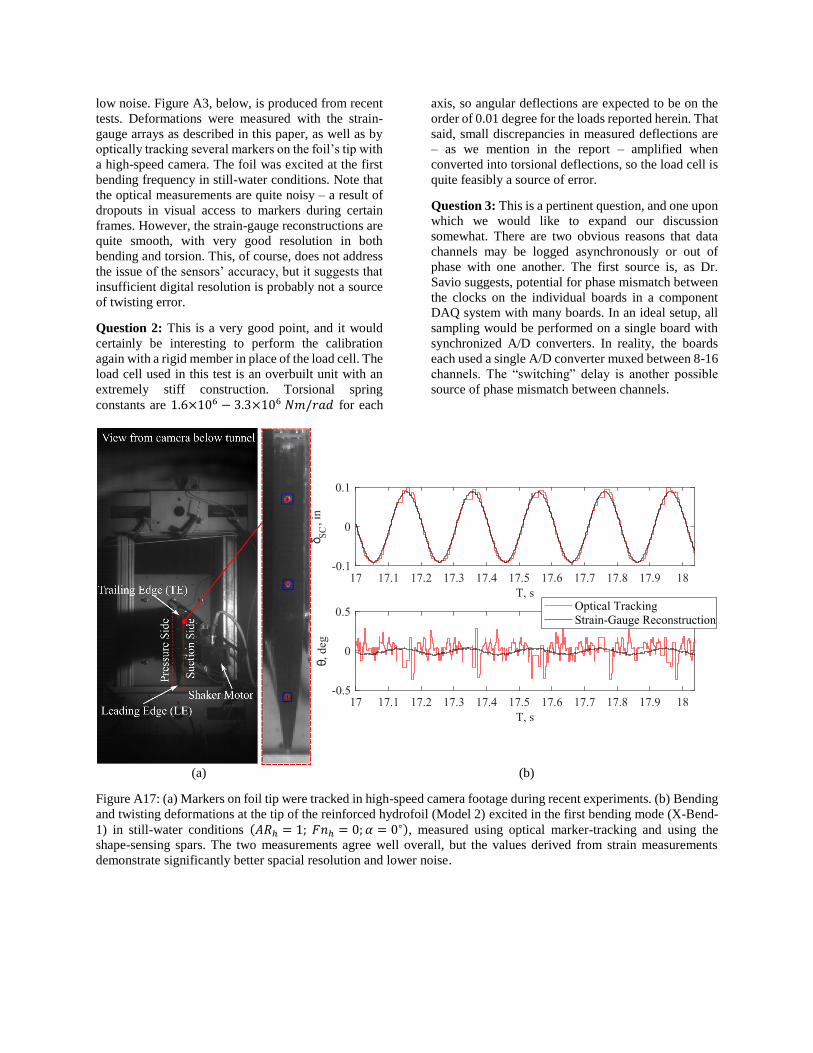
(a) (b)
Figure A17: (a) Markers on foil tip were tracked in high-speed camera footage during recent experiments. (b) Bending
and twisting deformations at the tip of the reinforced hydrofoil (Model 2) excited in the first bending mode (X-Bend-
1) in still-water conditions (𝐴𝑅ℎ = 1; 𝐹𝑛ℎ = 0; 𝛼 = 0∘), measured using optical marker-tracking and using the
shape-sensing spars. The two measurements agree well overall, but the values derived from strain measurements
demonstrate significantly better spacial resolution and lower noise.

We dedicated significant effort to timing-
considerations. With respect to board-to-board
synchronicity between the boards used, a master-slave
setup was established. A 10 MHz reference clock was
tapped from one board (master) and each of the other
two boards was set to phase-lock their onboard clocks
and A/D conversions with respect to the imported 10
MHz pulse train. “Start” and “stop” TTL triggers were
also used to synchronize the beginning and ending
samples. The muxing delay is impossible to eliminate,
but if one considers the relative timescales of the
sampling and muxing clocks, then the topic is of little
concern. A DAQ board typical of our setup has a
cumulative A/D conversion rate exceeding 106
samples / second. During one nominally synchronized
sample across, for example, 16 channels, the delay
between channel 1 and channel 16 would be at most
1.6×10⁻⁵ seconds. At 1000 Hz sampling-rate, this is
on the order of 1% of the sampling period.
We have, in the time since the reported
experiments, verified that synchronicity is maintained
between multiple channels on multiple boards (and
even across multiple DAQ systems) by acquiring
duplicate measurements of a common sine wave at
varying frequencies. The results of these tests showed
no appreciable phase discrepancies between channels
or cards.
Question 4: This is a very interesting point. While we
will surely pay close attention to our anti-aliasing
approaches (and will probably use much higher
sampling rates) in future work, the data in the reported
tests were collected without any anti-aliasing filtering.
While this is a shortfall in our experimental setup, we
do not believe that aliasing errors are too great a
concern. We reason that mean values are unaffected
by aliasing, and that aliased frequencies would simply
elevate our noise floor somewhat, thereby increasing
the uncertainty of steady-state measurements. During
vibration-testing with the electrodynamic shaker, the
shaker itself deposits most energy into a limited range
of frequencies below the Nyquist limit, effectively
band-limiting the response, so that aliased frequencies
are proportionally small, compared to the excited
response of the hydrofoil.
Question 5: We have amended the paper to mention
future plans for the work; the additional text is
reproduced below:
“In future studies, we will strive for improved modal
parameter estimation through the use of longer-
duration frequency sweeps and improved signal
processing. Shaker testing will be performed under a
variety of operating conditions, including wetted flow,
ventilated flow, and vaporous cavitating flow.
Additionally, future work will seek to identify the
effects of unsteady vaporous cavities on the
hydrodynamic loading, as well as the phenomenon of
lock-in when regular cavity and vortex shedding are
present. The shape-sensing spars also offer a
promising avenue for further development. In
particular, a second generation might make use of
separate bending and torsion members – one
instrumented for bending strain and the other for
shear strain – such that bending and torsion can be
more-directly resolved.”
Question 6: We agree with Dr. Savio on this point.
While the uncertainty of 20% is quite high, we suspect
that the number is at least partially inflated by
uncertainty in the reference data itself. Additionally, it
was found that, when subjected to eccentric loading-
cases only (i.e. when the pure-bending and pure-
torsion cases are removed from the validation data),
the RMSE is closer to 10% -- a far-more useable
number. Of course, it is hard to justify an arbitrary
removal of some training data, so we have opted to
report the conservative 20% until a more-thorough
verification study can be performed.
Aside from the fidelity of the benchmarking
data, there are obvious improvements to be made with
the design of the sensor itself. The sensors reported
upon in this work were the first iteration, and their
design highlighted the need to include shear-strain
measurements. Future designs may very well make
use of a bending spar and a torsion link – one
instrumented for bending strain and another for shear
strain – to more-directly resolve the torsional
deflections of the parent structure.