EXPERIMENTAL INVESTIGATION OF THE EFFECTS...
165
EXPERIMENTAL INVESTIGATION OF THE EFFECTS OF CATHODE POSITION ON HK40 HALL EFFECT THRUSTER PERFORMANCE AND CATHODE COUPLING by Nazlı Turan B.S., Mechanical Engineering, Bo˘gazi¸ci University, 2014 Submitted to the Institute for Graduate Studies in Science and Engineering in partial fulfillment of the requirements for the degree of Master of Science Graduate Program in FBE Program for which the Thesis is Submitted Bo˘ gazi¸ciUniversity 2016
Transcript of EXPERIMENTAL INVESTIGATION OF THE EFFECTS...

EXPERIMENTAL INVESTIGATION OF THE EFFECTS OF CATHODE
POSITION ON HK40 HALL EFFECT THRUSTER PERFORMANCE AND
CATHODE COUPLING
by
Nazlı Turan
B.S., Mechanical Engineering, Bogazici University, 2014
Submitted to the Institute for Graduate Studies in
Science and Engineering in partial fulfillment of
the requirements for the degree of
Master of Science
Graduate Program in FBE Program for which the Thesis is Submitted
Bogazici University
2016

ii
EXPERIMENTAL INVESTIGATION OF THE EFFECTS OF CATHODE
POSITION ON HK40 HALL EFFECT THRUSTER PERFORMANCE AND
CATHODE COUPLING
APPROVED BY:
Assoc. Prof. Murat Celik . . . . . . . . . . . . . . . . . . .
(Thesis Supervisor)
Assoc. Prof. Name Surname . . . . . . . . . . . . . . . . . . .
Assist. Prof. Name Surname . . . . . . . . . . . . . . . . . . .
Name Surname, Ph.D. . . . . . . . . . . . . . . . . . . .
DATE OF APPROVAL: DD.MM.YYYY

iii
ACKNOWLEDGEMENTS
I would like to thank Prof. Murat Celik for his invaluable guidance and help
during the preparation of this thesis. His commitment to pure science has helped me
to clarify my thinking and methods. He has shown me that a curious nature can lead
to great research.
I would like to thank the members of my thesis committee, Prof. Sebnem Ozupek
and Prof. Arif Karabeyoglu, for the time they spent reading and correcting in the
preparation process of this dissertation.
I would also like to thank Prof. Huseyin Kurt for his patience, insight, and
continuous support over the period of my graduate education. His immense knowledge
of absolutely everything, his enthusiasm, and willingness to share this knowledge have
been most invaluable.
I would like to thank my colleague Ugur Kokal for his curiosity, help, support
and joyful friendship during long laboratory hours. Also, I am grateful to have a
chance to study with Mehmet Serhan Yıldız. Our fruitful discussions at BUSTLab
have contributed greatly to the development of this work.
I also want to thank to my precious friends, Volkan Yurdabak, Merve Nur Yavuzkaya,
Beybin Ilhan, Ozgur Atik, and Patik for their sincere conversations and advices on wide
variety of subjects. I am so lucky to have you.
Last but not least, I am grateful to my mother, Muberra Turan, my father, Sayit
Turan, my sister Aslı Turan Seven and her husband Ilhan Seven for supporting me
at every stage of my education. Without their invaluable support, I could never have
become an honest, hardworking and dedicated person to succeed in academic area.

iv
ABSTRACT
EXPERIMENTAL INVESTIGATION OF THE EFFECTS
OF CATHODE POSITION ON HK40 HALL EFFECT
THRUSTER PERFORMANCE AND CATHODE
COUPLING
Electric propulsion systems are being developed for orbital and deep space ma-
neuvers of spacecraft. Hall effect thrusters, studied under electric propulsion systems,
are among the most preferred thrusters for future space missions. Hall effect thrusters
utilize electric and magnetic fields. The propellant gas, such as Argon or Xenon, is
ionized by the cathode electrons which are trapped by the magnetic field lines and
the positive ions are accelerated out of the thruster by Lorentz force. HK40 Hall effect
thruster, which is designed and manufactured at BUSTLab, is used in this study. Mag-
netic field measurements and the magnetic modeling of the HK40 Hall effect thruster
are conducted. Initial characterization tests of BUSTLab hollow cathode are carried
out and the thermal model of the cathode is completed. In Hall thrusters, external
magnetic field forms a pattern called separatrix. In this study, the effects of the posi-
tion of hollow cathode with respect to separatrix surfaces are investigated by moving
the cathode using a 2D translational stage. The effects of magnetic field topology and
the cathode location on ionization efficiency and thrust are studied. Additionally, two
different electrical wiring configurations for the thruster-cathode system are studied,
and the effects of the vacuum tank on the cathode and the thruster operation are
investigated.

v
OZET
KATOT KONUMUNUN HK40 HALL ITICI CALISMASI
VE KATOT ESLEME UZERINE ETKISININ DENEYSEL
INCELENMESI
Elektrikli itki sistemleri uzay araclarının yorunge hareketleri ve derin uzay gorevle-
ri icin gelistirilmektedir. Hall iticiler, elektrikli itki sistemleri baslıgında incelenen ve
gelecekteki uzay gorevleri icin en cok tercih edilen itki sistemleri arasındadır. Bu iti-
cilerde, elektrik ve manyetik alan bir arada kullanılır. Yakıt olarak kullanılan Argon,
Ksenon gibi gazlar, itici dısında bulunan katottan yayılan, manyetik alan tarafından tu-
tulmus elektronlar yardımıyla iyonlastırılır ve pozitif iyonlar itici dısına Lorentz kuvveti
ile hızlandırılarak atılır. Bu tez calısması cercevesinde yapılan deneylerde kullanılan
HK40 Hall itici BUSTLab bunyesinde tasarlanmıs ve uretilmistir. HK40 Hall iticinin
manyetik alan olcumleri ve manyetik modellemesi yapılmıstır. BUSTLab oyuk katotu-
nun ilk karakterizasyon testleri ve ısıl modeli tamamlanmıstır. Manyetik alan, Hall iti-
cilerde ayrılma adını verdigimiz bir olusuma sebep olur. Bu calısmada katotun konumu
iki eksenli bir hareket duzenegi kullanılarak degistirilmis ve katotun ayrılma bolgesine
gore konumunun itici-katot sisteminin calısmasına etkileri incelenmistir. Manyetik alan
topolojisi ve katot konumunun iyonlasma verimi ve itkiye olan etkileri arastırılmıstır.
Ayrıca, itici-katot sistemi icin iki farklı elektrik devresi tasarlanmıs ve vakum tankının
katot ve itici calısmasına etkileri arastırılmıstır.

vi
TABLE OF CONTENTS
ACKNOWLEDGEMENTS . . . . . . . . . . . . . . . . . . . . . . . . . . . . . iii
ABSTRACT . . . . . . . . . . . . . . . . . . . . . . . . . . . . . . . . . . . . . iv
OZET . . . . . . . . . . . . . . . . . . . . . . . . . . . . . . . . . . . . . . . . . v
LIST OF FIGURES . . . . . . . . . . . . . . . . . . . . . . . . . . . . . . . . . ix
LIST OF TABLES . . . . . . . . . . . . . . . . . . . . . . . . . . . . . . . . . . xx
LIST OF SYMBOLS . . . . . . . . . . . . . . . . . . . . . . . . . . . . . . . . . xxi
LIST OF ACRONYMS/ABBREVIATIONS . . . . . . . . . . . . . . . . . . . . xxiv
1. INTRODUCTION . . . . . . . . . . . . . . . . . . . . . . . . . . . . . . . . 1
1.1. Electric Propulsion . . . . . . . . . . . . . . . . . . . . . . . . . . . . . 2
1.2. Hall Thruster-Cathode Coupling . . . . . . . . . . . . . . . . . . . . . . 9
1.3. Contribution of this Work . . . . . . . . . . . . . . . . . . . . . . . . . 12
2. HALL THRUSTER OVERVIEW . . . . . . . . . . . . . . . . . . . . . . . . 14
2.1. Electron Motion in Magnetized Plasma . . . . . . . . . . . . . . . . . . 17
2.2. Hall Thruster Design Parameters . . . . . . . . . . . . . . . . . . . . . 20
2.3. HK40 Hall Thruster . . . . . . . . . . . . . . . . . . . . . . . . . . . . 22
2.3.1. Construction of HK40 . . . . . . . . . . . . . . . . . . . . . . . 24
2.3.2. Magnetic Circuit Design . . . . . . . . . . . . . . . . . . . . . . 27
2.3.3. Hall Probe Measurements and the Magnetic Model of HK40 . . 30
3. LaB6 HOLLOW CATHODE OVERVIEW . . . . . . . . . . . . . . . . . . . 40
3.1. Thermionic Emission . . . . . . . . . . . . . . . . . . . . . . . . . . . . 41
3.2. Double Sheath Inside the Cathode . . . . . . . . . . . . . . . . . . . . 42
3.3. Current Extraction Mechanism . . . . . . . . . . . . . . . . . . . . . . 44
3.4. BUSTLab Hollow Cathode . . . . . . . . . . . . . . . . . . . . . . . . . 45
3.4.1. Construction of BUSTLab Hollow Cathode . . . . . . . . . . . . 46
3.4.2. Plume and Spot Mode Operations . . . . . . . . . . . . . . . . . 53
3.4.3. Thermal Model of the Cathode . . . . . . . . . . . . . . . . . . 55
4. EXPERIMENTS AND RESULTS . . . . . . . . . . . . . . . . . . . . . . . . 60
4.1. Cathode - Virtual Anode Tests . . . . . . . . . . . . . . . . . . . . . . 61
4.1.1. Biased Anode Voltage . . . . . . . . . . . . . . . . . . . . . . . 61

vii
4.1.2. Biased Anode Current . . . . . . . . . . . . . . . . . . . . . . . 66
4.2. Cathode Tests with Current Measurements . . . . . . . . . . . . . . . . 67
4.2.1. Cathode Measurements without HK40 in Operation . . . . . . . 68
4.2.1.1. Cathode with continuous heating . . . . . . . . . . . . 69
4.2.1.2. Cathode without heating . . . . . . . . . . . . . . . . 70
4.2.2. Cathode Measurements with HK40 in Operation . . . . . . . . . 72
4.2.2.1. Built Langmuir probe . . . . . . . . . . . . . . . . . . 72
4.2.2.2. Current schematic . . . . . . . . . . . . . . . . . . . . 74
4.2.2.3. Grounded setup . . . . . . . . . . . . . . . . . . . . . 75
4.2.2.4. Calculating efficiency from the ground current . . . . . 76
4.2.3. Results . . . . . . . . . . . . . . . . . . . . . . . . . . . . . . . . 78
4.3. Cathode Placement Tests with HK40 Hall Effect Thruster . . . . . . . 81
4.3.1. Cathode and Probe Measurements with HK40 in Operation . . 82
4.3.1.1. Floating setup . . . . . . . . . . . . . . . . . . . . . . 86
4.3.1.2. Voltage distribution . . . . . . . . . . . . . . . . . . . 87
4.3.1.3. Calculating efficiency from cathode to ground voltage . 88
4.3.2. Results . . . . . . . . . . . . . . . . . . . . . . . . . . . . . . . . 89
5. CONCLUSION . . . . . . . . . . . . . . . . . . . . . . . . . . . . . . . . . . 96
5.1. Future Work . . . . . . . . . . . . . . . . . . . . . . . . . . . . . . . . . 98
REFERENCES . . . . . . . . . . . . . . . . . . . . . . . . . . . . . . . . . . . . 100
APPENDIX A: PLASMA-SURFACE INTERACTIONS . . . . . . . . . . . . 107
A.1. Collisionless Sheath Assumption . . . . . . . . . . . . . . . . . . . . . . 108
A.1.1. Bohm Sheath Criterion . . . . . . . . . . . . . . . . . . . . . . . 111
A.1.2. Presheath . . . . . . . . . . . . . . . . . . . . . . . . . . . . . . 112
A.1.3. Debye Length . . . . . . . . . . . . . . . . . . . . . . . . . . . . 114
A.1.4. Child-Langmuir Law . . . . . . . . . . . . . . . . . . . . . . . . 115
A.1.5. Double Sheath . . . . . . . . . . . . . . . . . . . . . . . . . . . 117
APPENDIX B: LANGMUIR PROBE THEORY . . . . . . . . . . . . . . . . . 120
B.1. Planar Probes . . . . . . . . . . . . . . . . . . . . . . . . . . . . . . . . 120
B.1.1. Ion Saturation Current . . . . . . . . . . . . . . . . . . . . . . . 121
B.1.2. Electron Saturation Current . . . . . . . . . . . . . . . . . . . . 122

viii
B.1.3. Electron Retardation Current . . . . . . . . . . . . . . . . . . . 123
B.1.4. Floating Potential . . . . . . . . . . . . . . . . . . . . . . . . . . 123
B.2. Cylindrical Probes . . . . . . . . . . . . . . . . . . . . . . . . . . . . . 124
B.2.1. Orbital Motion about Cylindrical Probe . . . . . . . . . . . . . 125
B.3. Interpretation of the Probe Characteristics . . . . . . . . . . . . . . . . 128
B.4. Magnetic Field Effects on Probes . . . . . . . . . . . . . . . . . . . . . 131
APPENDIX C: BUSTLAB THRUSTER OPERATION PROCEDURES . . . 134
C.1. BUSTLab Hollow Cathode Operation With 0.25 mm Ta heater wire . . 135
C.2. HK40 Operation . . . . . . . . . . . . . . . . . . . . . . . . . . . . . . 136
APPENDIX D: WINPROLADDER PROGRAM FOR 2D LINEAR STAGES 137
APPENDIX E: LABVIEW PROGRAM FOR GAUSSMETER . . . . . . . . . 138
APPENDIX F: LABVIEW PROGRAM FOR VACUUM RATED STAGES . . 139
APPENDIX G: LANGMUIR PROBE INTERFACE . . . . . . . . . . . . . . 141

ix
LIST OF FIGURES
Figure 1.1. Rocket propulsion. . . . . . . . . . . . . . . . . . . . . . . . . . . . 1
Figure 1.2. The comparison of the different propulsion systems [1]. . . . . . . 3
Figure 1.3. Basic ion thruster schematic with ring cusps [2]. . . . . . . . . . . 4
Figure 1.4. RF ion thruster schematic [3]. . . . . . . . . . . . . . . . . . . . . 4
Figure 1.5. BUSTLab RF ion thruster in operation inside BUSTLab vacuum
chamber. . . . . . . . . . . . . . . . . . . . . . . . . . . . . . . . . 5
Figure 1.6. The configuration of microwave discharge ion engine [4]. . . . . . . 6
Figure 1.7. Schematic of a Hall effect thruster. . . . . . . . . . . . . . . . . . . 7
Figure 1.8. Schematic of a cusped field Hall thruster [5]. . . . . . . . . . . . . 8
Figure 1.9. CFHT-40 while operating inside the vacuum chamber. . . . . . . . 8
Figure 1.10. HK40 Hall effect thruster while operating inside BUSTLab vacuum
chamber. . . . . . . . . . . . . . . . . . . . . . . . . . . . . . . . . 10
Figure 1.11. Thruster voltage schematic. . . . . . . . . . . . . . . . . . . . . . 11
Figure 2.1. Basic Hall thruster configuration. . . . . . . . . . . . . . . . . . . 14
Figure 2.2. Schematic of the channel regions. . . . . . . . . . . . . . . . . . . 16

x
Figure 2.3. Schematic of the paths of electrons with ionization. . . . . . . . . 18
Figure 2.4. Comparison of the different thrusters from the literature [6]. . . . 21
Figure 2.5. The relation between magnetic flux density and magnet current [7]. 21
Figure 2.6. The materials used to construct HK40. . . . . . . . . . . . . . . . 23
Figure 2.7. HK40 Hall effect thruster (views from the front and the back sides). 23
Figure 2.8. HK40 Hall effect thruster with LaB6 hollow cathode. . . . . . . . . 24
Figure 2.9. The first design of the anode and the gas distribution. . . . . . . . 25
Figure 2.10. The second design of the anode and the gas distribution. . . . . . 25
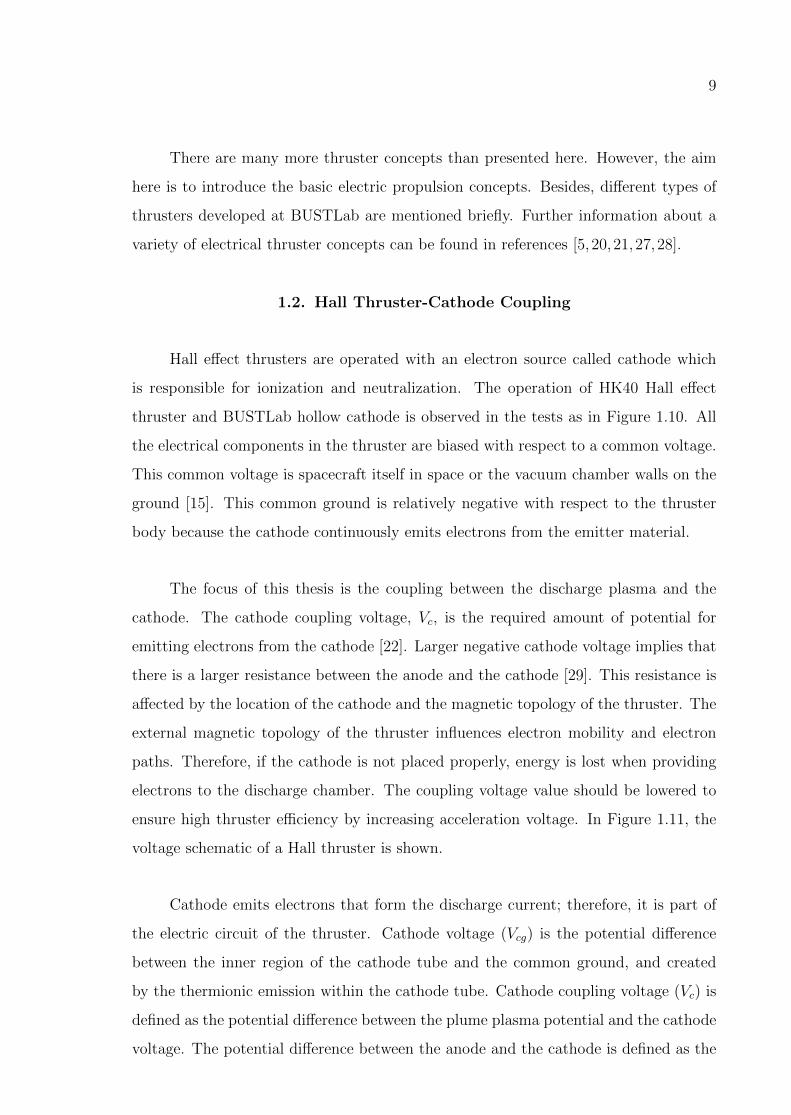
Figure 2.11. The latest design of the anode and the discharge channel. . . . . . 26
Figure 2.12. Cold mounting for the gas line. . . . . . . . . . . . . . . . . . . . . 26
Figure 2.13. The magnet and the cap inside the BN channel. . . . . . . . . . . 26
Figure 2.14. The magnet holder with magnet coils. . . . . . . . . . . . . . . . . 27
Figure 2.15. Magnetic field lines in radial direction [7]. . . . . . . . . . . . . . . 28
Figure 2.16. Depiction of the electron movement inside the channel of HK40. . 29
Figure 2.17. HK40 plume with magnetic contours. . . . . . . . . . . . . . . . . 30
Figure 2.18. Illustration of the operation of a Hall probe [8]. . . . . . . . . . . . 31

xi
Figure 2.19. Lakeshore transverse Hall probe [9]. . . . . . . . . . . . . . . . . . 31
Figure 2.20. Magnetic field measurements of HK40. The transverse Hall probe
is placed at the center of the exit plane of the thruster. . . . . . . 32
Figure 2.21. The directions for the tests. . . . . . . . . . . . . . . . . . . . . . 32
Figure 2.22. Photograph and schematic of thruster showing the placement of
the permanent magnets. . . . . . . . . . . . . . . . . . . . . . . . 33
Figure 2.23. The comparison of modelled and measured axial external magnetic
flux density of the design with permanent magnets (values are in
Gauss). . . . . . . . . . . . . . . . . . . . . . . . . . . . . . . . . . 34
Figure 2.24. The comparison of modelled and measured axial external magnetic
flux density of the design with magnetic coils (inner = 2 A, outer
= 1.75 A) (values are in Gauss). . . . . . . . . . . . . . . . . . . . 35
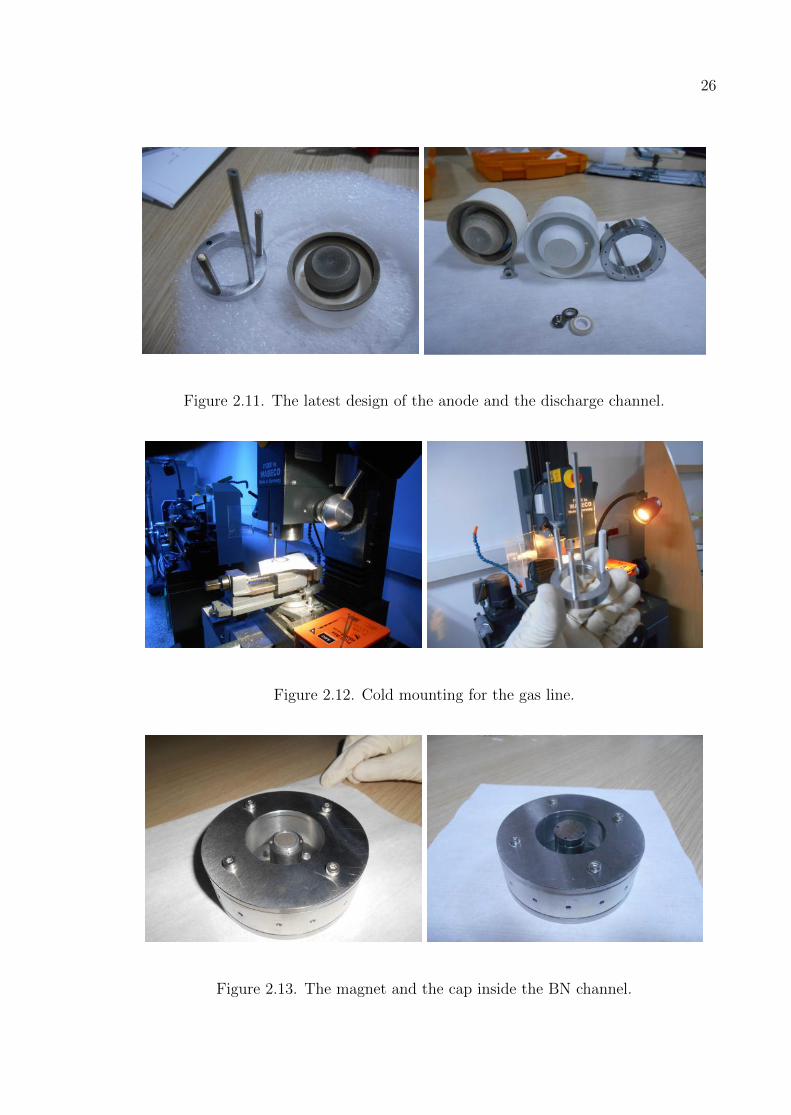
Figure 2.25. The separatrix surfaces of two designs (inner = 2 A outer = 1.75
A for the design with coils). . . . . . . . . . . . . . . . . . . . . . 36
Figure 2.26. Measured axial magnetic flux density from the center of the thruster
exit to 10 cm axial distance (magnet angle: 22.5 degree, inner = 2
A outer = 1.75 A for the design with coils). . . . . . . . . . . . . 36
Figure 2.27. Profiles of magnetic and electric fields along the channel [10]. . . . 37
Figure 2.28. The comparison of modelled and measured radial external magnetic
flux density in Gauss of the design with magnetic coils, inner = 2
A, outer = 1.75 A. . . . . . . . . . . . . . . . . . . . . . . . . . . 38

xii
Figure 2.29. The radial magnetic flux density (G) in discharge channel and the
change in the radial magnetic field in axial direction forming mag-
netic lens. . . . . . . . . . . . . . . . . . . . . . . . . . . . . . . . 38
Figure 3.1. Basic hollow cathode parts. . . . . . . . . . . . . . . . . . . . . . . 40
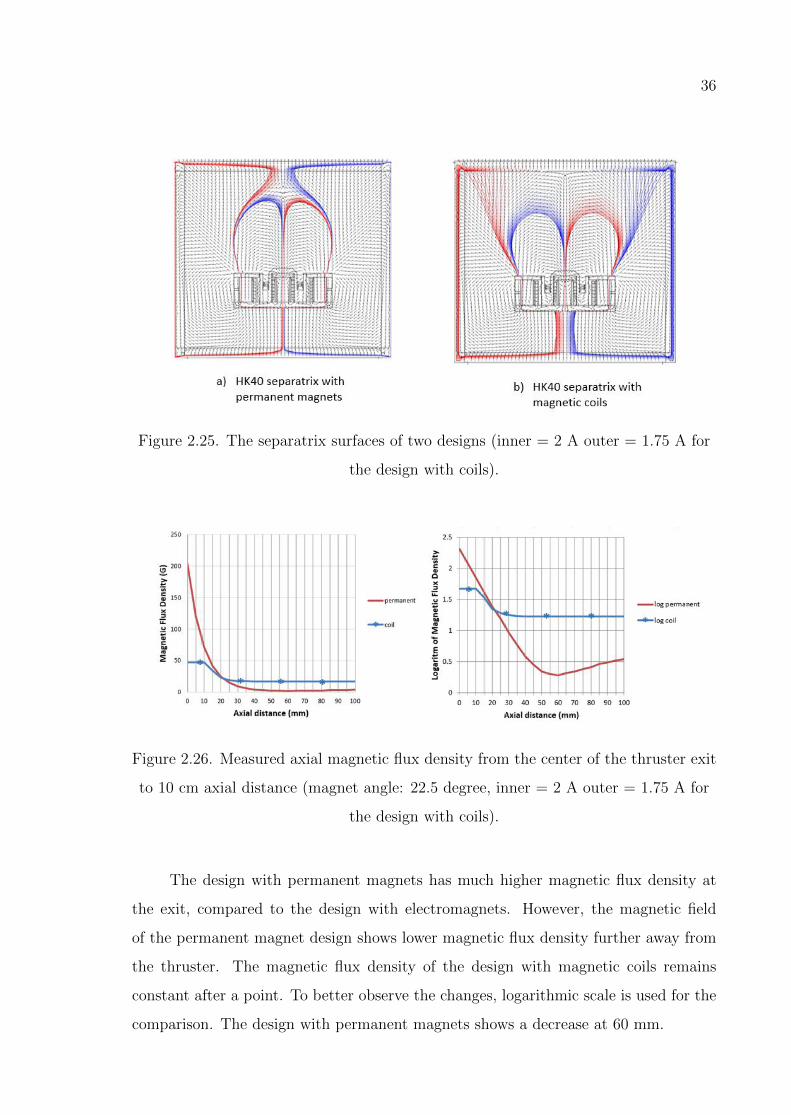
Figure 3.2. Emission mechanisms of BaO −W and LaB6 [11]. . . . . . . . . . 41
Figure 3.3. Evaporation rate vs. emission current density [12]. . . . . . . . . . 42
Figure 3.4. Double layer formation and quasi-neutral plasma inside the cathode. 43
Figure 3.5. Electron extraction from LaB6 emitter surface. . . . . . . . . . . . 44
Figure 3.6. The schematic of BUSTLab hollow cathode. . . . . . . . . . . . . 45
Figure 3.7. The parts of the first cathode produced. . . . . . . . . . . . . . . . 47
Figure 3.8. Heater A: classical heater with sheated tantalum wire wrapped
around cathode tube. Heater B: Tantalum bare wire wrapped in-
side helical shaped groove. Heater C: Tantalum bare wire wrapped
inside horizontal shaped groove [13]. . . . . . . . . . . . . . . . . . 48
Figure 3.9. Tantalum shields after alumina deposition on their surfaces, and
glow of the keeper tube when tantalum shields do not work as
planned. . . . . . . . . . . . . . . . . . . . . . . . . . . . . . . . . 49
Figure 3.10. The heater wire turning in 14 alumina tubes. . . . . . . . . . . . . 50
Figure 3.11. The wrapped heater coil with the cathode structure and the wrapped
heater coil in grooves with advanced thermal dissipation. . . . . . 50

xiii
Figure 3.12. The wear on the cathode base. . . . . . . . . . . . . . . . . . . . . 51
Figure 3.13. The wear on the keeper due to the cathode position relative to the
thruster plume. . . . . . . . . . . . . . . . . . . . . . . . . . . . . 51
Figure 3.14. The first and the latest heater designs. . . . . . . . . . . . . . . . 52
Figure 3.15. The coaxial cathode parts. . . . . . . . . . . . . . . . . . . . . . . 52
Figure 3.16. The coaxial cathode construction. . . . . . . . . . . . . . . . . . . 53
Figure 3.17. a) Spot mode operation b) Plume mode operation with electron
attracting sheath due to lower electron density. . . . . . . . . . . . 54
Figure 3.18. Pictures of BUSTLab hollow cathode in a) Spot mode operation
b) Plume mode operation. . . . . . . . . . . . . . . . . . . . . . . 55
Figure 3.19. Pictures of BUSTLab hollow cathode in a) Spot mode operation
b) Plume mode operation. . . . . . . . . . . . . . . . . . . . . . . 55
Figure 3.20. The schematics of the first BUSTLab hollow cathode and the new
coaxial hollow cathode, respectively. . . . . . . . . . . . . . . . . . 56
Figure 3.21. Schematic of BUSTLab coaxial hollow cathode (the black regions
show graphite parts). . . . . . . . . . . . . . . . . . . . . . . . . . 57
Figure 3.22. Temperature distribution of the first and the latest hollow cathode
designs with 107 W power dissipation from heater. . . . . . . . . . 57
Figure 3.23. Temperature distribution of the latest design with 200 W power
dissipation from heater. . . . . . . . . . . . . . . . . . . . . . . . . 58

xiv
Figure 3.24. Emission currents [11]. . . . . . . . . . . . . . . . . . . . . . . . . 59
Figure 3.25. LaB6 comparison. . . . . . . . . . . . . . . . . . . . . . . . . . . . 59
Figure 4.1. Vacuum chamber assembly with the constructed test setup at the
inside. . . . . . . . . . . . . . . . . . . . . . . . . . . . . . . . . . 60
Figure 4.2. BUSTLab vacuum chamber. . . . . . . . . . . . . . . . . . . . . . 61
Figure 4.3. Power sources and PC on the rack. . . . . . . . . . . . . . . . . . 62
Figure 4.4. LaB6 hollow cathode test setup for current extraction with a virtual
anode. . . . . . . . . . . . . . . . . . . . . . . . . . . . . . . . . . 62
Figure 4.5. Current extraction with a virtual anode biased with voltage. . . . 63
Figure 4.6. The changes in currents and voltages by varying anode voltage for
mass flow rate of the Argon propellant = 2.5 sccm. . . . . . . . . . 64
Figure 4.7. The changes in currents and voltages by varying mass flow rate for
keeper current=1 A, anode voltage=70 V. . . . . . . . . . . . . . . 65
Figure 4.8. The changes in currents and voltages for varying keeper current for
mass flow rate = 1.8 sccm, anode voltage=70 V. . . . . . . . . . . 65
Figure 4.9. Current extraction with a virtual anode biased with current. . . . 66
Figure 4.10. Virtual anode current and the voltages by varying mass flow rate
for keeper current = 1.4 A. . . . . . . . . . . . . . . . . . . . . . . 67
xv
Figure 4.11. Representation of the electrical circuit for the thruster-cathode sys-
tem. . . . . . . . . . . . . . . . . . . . . . . . . . . . . . . . . . . 68
Figure 4.12. HK40 Hall thruster with moveable cathode. . . . . . . . . . . . . . 69
Figure 4.13. Cathode current for varying heater current. . . . . . . . . . . . . . 69
Figure 4.14. Changes in keeper voltage and extracted emission current from
LaB6 with respect to keeper current. . . . . . . . . . . . . . . . . 71
Figure 4.15. Cathode current for varying cathode propellant flow rate. . . . . . 71
Figure 4.16. Langmuir probe parts. . . . . . . . . . . . . . . . . . . . . . . . . 73
Figure 4.17. Single Langmuir probe constructed for the tests. . . . . . . . . . . 73
Figure 4.18. Electron extraction from LaB6 emitter surface. . . . . . . . . . . 74
Figure 4.19. Schematic of the currents in the thruster-cathode system. . . . . 74
Figure 4.20. Electrical circuit for the thruster-cathode system for the grounded
setup. . . . . . . . . . . . . . . . . . . . . . . . . . . . . . . . . . . 76
Figure 4.21. Current values for varying anode voltages. . . . . . . . . . . . . . 79
Figure 4.22. Keeper and plasma voltage values for varying anode voltage values
(probe data is taken at the thruster plume). . . . . . . . . . . . . 80
Figure 4.23. Extracted electron current from ground for various inner and outer
magnet coil current values for varying anode voltages. . . . . . . . 80

xvi
Figure 4.24. The current ratios for different magnetic field cases. . . . . . . . . 81
Figure 4.25. a) Side view of the HK40 and BUSTLab hollow cathode inside the
chamber (with a Langmuir probe in front of the thruster) b) 3D
rendering of the experimental setup (with axial and radial direc-
tions indicated). . . . . . . . . . . . . . . . . . . . . . . . . . . . . 82
Figure 4.26. Test points in 2D plane for the grounded setup (inner coil = 1.7 A,
outer coils = 2 A). . . . . . . . . . . . . . . . . . . . . . . . . . . 83
Figure 4.27. Separatrix surfaces. left:inner coil = 0.75 A, outer coils = 1.25 A
right:inner coil = 0.8 A, outer coils = 0.9 A. . . . . . . . . . . . . 84
Figure 4.28. Separatrix surfaces. left:inner coil = 0.75 A, outer coils = 1.06 A
right:inner coil = 1 A, outer coils = 0.75 A. . . . . . . . . . . . . . 85
Figure 4.29. COMSOL modelling of the magnetic field topology of HK40 over-
lapped with the 3D drawing inside the chamber (inner coil = 1 A,
outer coils = 1.2 A). . . . . . . . . . . . . . . . . . . . . . . . . . . 85
Figure 4.30. Test points in 2D plane for the floating setup (inner coil = 1 A,
outer coils = 1.2 A). . . . . . . . . . . . . . . . . . . . . . . . . . . 86
Figure 4.31. Electrical circuit for the thruster-cathode system for floating setup. 86
Figure 4.32. Hall thruster voltage schematic. . . . . . . . . . . . . . . . . . . . 87
Figure 4.33. Schematic of HK40 Hall effect thruster with BUSTlab LaB6 hollow
cathode. . . . . . . . . . . . . . . . . . . . . . . . . . . . . . . . . 89
Figure 4.34. HK40 Hall effect thruster with BUSTlab LaB6 hollow cathode. . . 90

xvii
Figure 4.35. a) Test points with respect to separatrix surfaces (inner coil = 1.7
A, outer coils = 2 A) b) Changes in electron current and plasma
potential at specified points (inner coil = 1.7 A, outer coils = 2 A). 91
Figure 4.36. a) Test points with respect to separatrix surfaces (inner coil = 1 A,
outer coils = 1.2 A) b) Cathode to ground voltage, Vcg, and plasma
potential, Vp, at specified points (inner coil = 1 A, outer coils =
1.2 A). . . . . . . . . . . . . . . . . . . . . . . . . . . . . . . . . . 91
Figure 4.37. a) Efficiency and thrust values at specified points (inner coil = 1.7
A, outer coils = 2 A) b) Thrust and efficiency at specified points
(inner coil = 1 A, outer coils = 1.2 A). . . . . . . . . . . . . . . . 92
Figure A.1. The representation of plasma and sheath regions in contact with a
boundary. . . . . . . . . . . . . . . . . . . . . . . . . . . . . . . . 107
Figure A.2. The potential and density changes in the sheath region [14]. . . . . 110
Figure A.3. Schematic of the double layer potential distribution [15]. . . . . . 117
Figure B.1. a) Design of a simple planar probe b) Planar probe with guard ring
c) Construction of a cylindrical probe [16]. . . . . . . . . . . . . . 120
Figure B.2. I: ion saturation regime II: electron retardation regime III: electron
saturation regime. . . . . . . . . . . . . . . . . . . . . . . . . . . . 121
Figure B.3. log-lin plot of the (negative) electron current vs. probe voltage
shows that a Maxwellian results in a straight line, which can be
used to determine the electron temperature [16]. . . . . . . . . . . 125
xviii
Figure B.4. Orbital motion in the thick collisionless sheath around a cylindri-
cal or spherical probe. The impact parameter bc determines the
effective probe cross section [16]. . . . . . . . . . . . . . . . . . . . 126
Figure B.5. Schematic diagram of the electric potential variation near the sur-
face of a negatively biased probe [8]. . . . . . . . . . . . . . . . . . 129
Figure B.6. The electron distribution near a repelling probe. The cut off above
uc is due to collection (rather than reflection) of electrons with
higher energy [8]. . . . . . . . . . . . . . . . . . . . . . . . . . . . 129
Figure B.7. Characteristics of cylindrical (C), spherical (S) and planar probes
(P) [17]. . . . . . . . . . . . . . . . . . . . . . . . . . . . . . . . . 130
Figure B.8. Schematic representation of sheath and presheath in a strong mag-
netic field [8]. . . . . . . . . . . . . . . . . . . . . . . . . . . . . . 133
Figure D.1. The program to move 2D linear motion stages. . . . . . . . . . . . 137
Figure E.1. Labview program to measure magnetic flux density. . . . . . . . . 138
Figure E.2. Labview interface for the gaussmeter. . . . . . . . . . . . . . . . . 138
Figure F.1. Example Labview program to move the stages. . . . . . . . . . . . 139
Figure F.2. Example Labview interface for the stages. . . . . . . . . . . . . . . 139
Figure F.3. Developed Labview program to move the stages. . . . . . . . . . . 140
Figure F.4. Developed Labview interface for the stages. . . . . . . . . . . . . . 140

xix
Figure G.1. Langmuir probe I-V interface. . . . . . . . . . . . . . . . . . . . . 141

xx
LIST OF TABLES
Table 2.1. Comparison of the geometric and the operational parameters of
several Hall effect thrusters. . . . . . . . . . . . . . . . . . . . . . . 22
Table 4.1. Performance characteristics of HK40 Hall Thruster. . . . . . . . . 78
Table 4.2. Magnetic flux density for varying magnetic coil currents . . . . . . 84

xxi
LIST OF SYMBOLS
Across Effective cross sectional area
Ah Heater sleeve area
Ak Keeper area
Aslice Slice area
A∗ Richardson constant
a Divergence losses constant
B Magnetic field
bc Channel width
E Electric field
Ew Electric field at the wall
e Electron charge
F Force
g0 Gravitational acceleration
Ia Anode current
Icathode Cathode current
Id Discharge current
Ieb Electron current to beam neutralization
Iec Electron current emitted from cathode to ionize propellant
Iei Electron current obtained after ionization
Iground Ground current
Iib Ion beam current
Ikeeper Keeper current
Isp Specific impulse
i Inner coil current
Je Electron current density
Ji Ion current density
k Boltzmann constant
Lc Channel length

xxii
le Larmor radius of electron
li Larmor radius of ion
M Dry mass of the spacecraft
M0 Total mass of the spacecraft
m Propellant mass
m Propellant mass flow rate in mg/s
me Electron mass
mi Ion mass
o Outer coil current
Pb Beam power
Pcathode Cathode power
Pmagnet Magnet power
Pt Total power
q Charge
Rb Resistance between plasma and anode
Rc Resistance between plasma and cathode
Rk Resistance between keeper and LaB6 insert
Rtb Resistance between tank wall and thruster plume
Rtc Resistance between tank wall and cathode
T Thrust
Tw Wall temperature
ui Ion velocity
ue Electron velocity
Va Anode voltage
Vb Beam voltage
Vc Coupling voltage
Vcg Cathode to ground voltage
Vd Discharge voltage
Vground Ground voltage
Vheater Heater voltage
Vkeeper Keeper voltage
xxiii
Vkeeper sheath Keeper sheath voltage
Vmagnet Magnetic coil voltage
Vp Plasma potential
vavg Average axial exit velocity
ve Velocity of expelled mass
β Hall parameter
ε0 Permittivity of free space
εh Emissivity of heater sleeve
εk Emissivity of keeper
λd Debye length
ηT Total efficiency
ωe Cyclotron frequency of electron
φs Sheath potential
ρe Electron charge density
ρi Ion charge density
σ Electric conductivity
ν Electron-heavy particle collision frequency
νB Bohm diffusion term
νei Electron-ion collision frequency
νen Electron-neutral collision frequency
νm Electron momentum collision frequency
νw Wall collision frequency

xxiv
LIST OF ACRONYMS/ABBREVIATIONS
2D Two Dimensional
3D Three Dimensional
AWG American Wire Gauge
BN Boron Nitrite
CAD Computer-aided Design
GPIB General Purpose Interface Bus
RF Radio Frequency
SPT Stationary Plasma Thruster
1
1. INTRODUCTION
Space journey was only an imagination for people living in the early 20th century
until some of the visionaries among them have come up with solutions to fundamental
issues of rockets. The concept of rocketry had already been used by the Chinese when
they were celebrating their festivals with fireworks more than a thousand years ago.
Although the Chinese had known how to fire a rocket, Konstantin E. Tsiolkovsky and
Robert H. Goddard presented the groundbreaking theoretical and mathematical expla-
nation for spaceflight [18]. Tsiolkovsky was the first to provide detailed calculations of
rocket motion when he published his work in 1903 [19]. After these visionaries paved
the way for the idea of rocket propulsion, numerous propulsion concepts have been
developed over the last hundred years.
Propulsion basically works with the physical principle that states: action equals
reaction. A rocket is accelerated by expelling the propellant out of the system. At
the same time, the rocket moves in the opposite direction in such a way to conserve
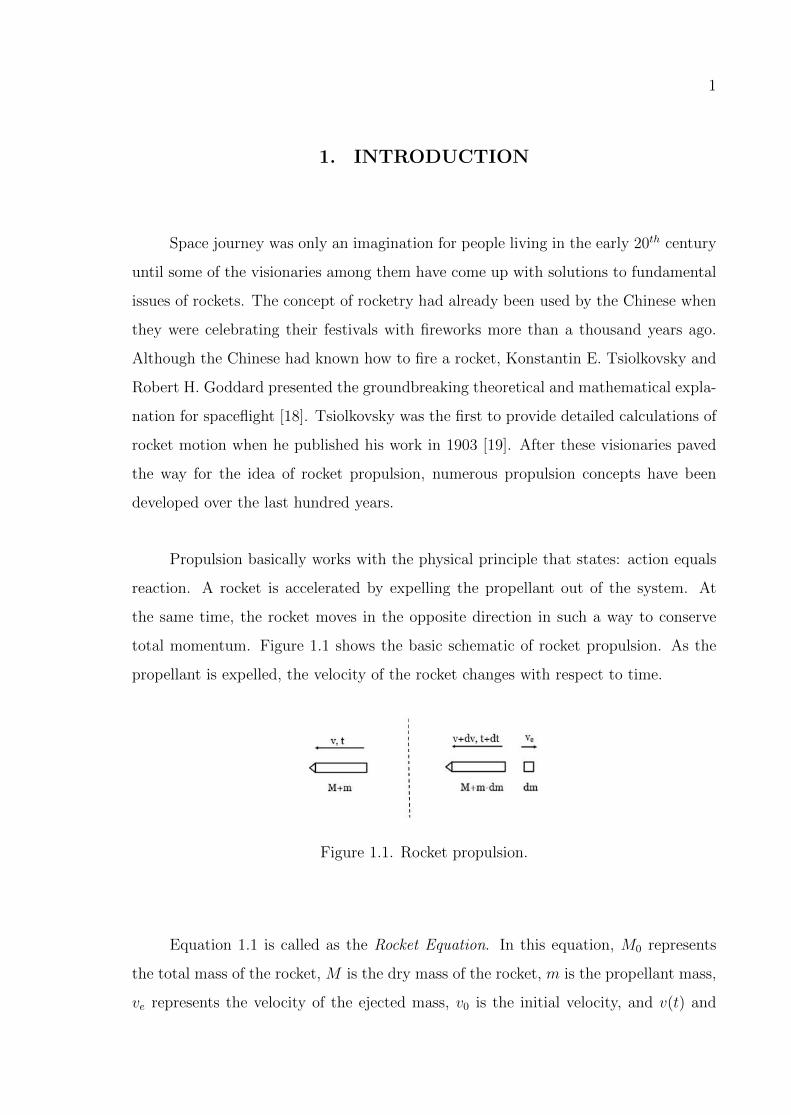
total momentum. Figure 1.1 shows the basic schematic of rocket propulsion. As the
propellant is expelled, the velocity of the rocket changes with respect to time.
Figure 1.1. Rocket propulsion.
Equation 1.1 is called as the Rocket Equation. In this equation, M0 represents
the total mass of the rocket, M is the dry mass of the rocket, m is the propellant mass,
ve represents the velocity of the ejected mass, v0 is the initial velocity, and v(t) and

2
M(t) are instantaneous velocity and mass of the rocket.
v(t) = v0 + velnM0
M(t)and M0 = M +m (1.1)
Thrust is calculated as the mass flow rate of the propellant times its velocity as in
Equation 1.2:
T = mve (1.2)
For rockets, Specific Impulse, Isp, represents the ratio of the thrust to the rate of the
weight of propellant consumed to achieve that thrust [15]:
Isp =Total impulse
weight=T∆t
mg0
=T
mg0
=veg0
(1.3)
Figure 1.2 shows the range of specific impulse versus thrust values for different
propulsion systems. Electric propulsion systems use propellant more efficiently albeit
at lower thrust values compared to the chemical and the nuclear propulsion systems.
For launch vehicles, chemical systems are preferable because of their higher thrust
values, however for in-space propulsion applications, despite their low thrust values
thrusters with higher specific impulse would be preferable.
1.1. Electric Propulsion
Spacecraft use propulsion systems for their maneuvers in orbit or in interplanetary
space. Thrusters using electric energy were built as a practical alternative to chemical
thrusters for reducing the amount of propellant used, and thus the cost, for in orbit
propulsion needs as well as to meet the demands of deep space exploration missions.
For the spacecraft, after the huge impulse requirement of the launch was handled, ef-
fective solutions were investigated to utilize the excess onboard electric power. Electric
propulsion systems became acceptable for planned long-term missions, and researchers

3
Figure 1.2. The comparison of the different propulsion systems [1].
focused on thrusters that use electrical energy broadly [20].
There are different types of electric propulsion systems. Ideas about ion propul-
sion emerged in Russia and the United States approximately around the same time.
In the US, Robert H. Goddard was the first who explained the ion thruster basics in
1906. Konstantin E. Tsiolkovsky, in Russia, proposed his ideas about ion propulsion
in 1911. In 1959, Harold R. Kaufman at the NASA Glenn Research Center paved
the way to construct an ion thruster with an efficient ionization mechanism enhanced
with magnetic cusps as in Figure 1.3 [21]. In 1964, on SERT I spacecraft, US flew its
first electric propulsion thruster. It was a gridded ion thruster with a hollow cathode
neutralizer [22].
EADS Astrium GmbH (European Aeronautics Defense and Space Company) in
Germany developed RF (radio-frequency) ion thrusters. For this type, neutral gas is
ionized with radio waves in a chamber and then expelled as the gridded thrusters. RF
ion thrusters were used on satellites EURECA and ARTEMIS [23]. Schematic of an
RF ion thruster is shown in Figure 1.4.

4
Figure 1.3. Basic ion thruster schematic with ring cusps [2].
Figure 1.4. RF ion thruster schematic [3].

5
At BUSTLab (Bogazici University Space Technologies Laboratory), a prototype
RF ion thruster has been designed and built, and preliminary tests have been con-
ducted. Recently, the ion energy distribution of this ion thruster has been measured
with an RPA (Retarding Potential Analyzer) probe. The tests and improvements for
this thruster are ongoing as an improved version of the thruster is being re-designed
and rebuilt. A picture from our tests at BUSTLab is presented in Figure 1.5.
Figure 1.5. BUSTLab RF ion thruster in operation inside BUSTLab vacuum
chamber.
The other ion thruster concept that has been developed uses microwaves. Mi-
crowave ion thrusters were first studied in Japan. The MUSES-C ion thruster with
Xenon propellant was used in Hayabusa asteroid mission in 2003 [4]. The working prin-
cipal is similar to RF ion thrusters, but microwaves are used instead of radio frequency
waves. In microwave ion thrusters 4GHz− 6GHz microwave is used for the ionization
of the propellant and to operate the microwave cathode. The schematic in Figure 1.6
shows the main parts of the microwave thruster-cathode system.
As mentioned, the gridded ion thrusters have been used in numerous space mis-
sions. However, grid erosion has been a significant problem for these type of thrusters.

6
Figure 1.6. The configuration of microwave discharge ion engine [4].
To handle the erosion problem, different materials and geometries have been
studied [15]. As an alternative to ion thrusters, other propulsion concepts that use
different magnetic topologies to enhance ionization and to electrostatically expel the
created ions without grids.
In 1970’s, Soviet Union and United Stated started their research on Hall thruster
independently. At the beginning of research, studies focused on determining basic
design parameters to optimize discharge chamber geometry, magnetic field topology
and propellant used. Soviet studies achieved more suitable magnetic topologies of Hall
thruster for flight and Hall thrusters were used for the first time in 1971. In 1990s,
after the end of the cold war, the Soviet researchers found the opportunity to bring
their experience and knowledge to western countries. In the US, Hall thruster re-
search was conducted by universities, government agencies and the industry [24]. With
improvements on Hall thruster systems, these systems became desirable propulsion
alternatives for LEO (Low Earth Orbit) to GEO (Geostationary Earth Orbit) orbit
raising, north-south station keeping and GEO orbit topping applications [25]. ESA
(European Space Agency) made contributions to the development of Hall thrusters by
sending SMART-1 spacecraft that orbited the Moon in 2003 [26]. In the US, several
companies such as Aerojet and Busek have conducted research and development of
Hall effect thrusters [22].

7
Hall effect thrusters (HET) are one of the best alternatives for deep space missions
because of their higher specific impulse. They consume less propellant to achieve
the desired total impulse. Hall effect thrusters use electric and magnetic fields to
extract ions from plasma discharge. The neutral gas is ionized with the energetic
electrons emitted from a cathode which is mounted near the exit plane of the thruster.
The extracted ions are neutralized by the cathode electrons. Inside the Hall thruster
channel, the ions are accelerated towards the exit of the thruster electrostatically. The
plume plasma pulls the ions outside the thruster. The grids cause a limitation of the
ion current for the gridded ion thrusters but Hall thrusters are free of this concern as
they do not employ grids.
The schematic of an HET is presented in Figure 1.7. This figure shows the
thruster with dielectric walls, an anode and the magnetic materials generating the
magnetic field. Electric field is in azimuthal direction to expel the created ions. Mag-
netic field is in the radial direction to impede electron motion towards the anode, thus
to enhance the ionization of the propellant gas. A prototype HET, named as HK40, is
designed and built at BUSTLab.
Figure 1.7. Schematic of a Hall effect thruster.

8
As a variation of Hall thruster, another thruster, with magnetic cusps along the
thruster axis, is developed. By doing this, the ionization of the propellant is increased
and the walls of the thruster is better protected. The schematic of this concept is
shown in Figure 1.8. A prototype thruster with magnetic cusps has been built at
Figure 1.8. Schematic of a cusped field Hall thruster [5].
BUSTLab. CFHT-40 (Cusped Field Hall Thruster) is a 40 mm diameter thruster with
ring magnets. A photo of this thruster while operating is shown in Figure 1.9.
Figure 1.9. CFHT-40 while operating inside the vacuum chamber.
9
There are many more thruster concepts than presented here. However, the aim
here is to introduce the basic electric propulsion concepts. Besides, different types of
thrusters developed at BUSTLab are mentioned briefly. Further information about a
variety of electrical thruster concepts can be found in references [5, 20,21,27,28].
1.2. Hall Thruster-Cathode Coupling
Hall effect thrusters are operated with an electron source called cathode which
is responsible for ionization and neutralization. The operation of HK40 Hall effect
thruster and BUSTLab hollow cathode is observed in the tests as in Figure 1.10. All
the electrical components in the thruster are biased with respect to a common voltage.
This common voltage is spacecraft itself in space or the vacuum chamber walls on the
ground [15]. This common ground is relatively negative with respect to the thruster
body because the cathode continuously emits electrons from the emitter material.
The focus of this thesis is the coupling between the discharge plasma and the
cathode. The cathode coupling voltage, Vc, is the required amount of potential for
emitting electrons from the cathode [22]. Larger negative cathode voltage implies that
there is a larger resistance between the anode and the cathode [29]. This resistance is
affected by the location of the cathode and the magnetic topology of the thruster. The
external magnetic topology of the thruster influences electron mobility and electron
paths. Therefore, if the cathode is not placed properly, energy is lost when providing
electrons to the discharge chamber. The coupling voltage value should be lowered to
ensure high thruster efficiency by increasing acceleration voltage. In Figure 1.11, the
voltage schematic of a Hall thruster is shown.
Cathode emits electrons that form the discharge current; therefore, it is part of
the electric circuit of the thruster. Cathode voltage (Vcg) is the potential difference
between the inner region of the cathode tube and the common ground, and created
by the thermionic emission within the cathode tube. Cathode coupling voltage (Vc) is
defined as the potential difference between the plume plasma potential and the cathode
voltage. The potential difference between the anode and the cathode is defined as the

10
Figure 1.10. HK40 Hall effect thruster while operating inside BUSTLab vacuum
chamber.
discharge voltage (Vd). Plasma potential (Vp) is measured in the thruster plume and
defined as the voltage at the thruster exit where the ion acceleration is completed.
The accelerated ions fall through a potential (Vb), that corresponds to the potential
difference between the anode voltage and the plasma potential. The beam voltage
with respect to the applied anode voltage is a measure of the thruster efficiency. While
calculating the efficiency, the cathode coupling voltage (Vc) should be small compared
to the discharge voltage (Vd).

11
Figure 1.11. Thruster voltage schematic.
In addition to Hall thrusters, the coupling voltage is a factor that should be
considered for the gridded ion thrusters as well. In Bechtel’s study on electron bom-
bardment ion thruster in 1973, the effects of keeper current, mass flow rate and the
coupling voltage on power consumption were examined [30]. After enhancements are
accomplished for reducing thruster discharge losses, the remaining power losses stem
from the neutralizer. Thus, the location of the neutralizer becomes significant because
it should continuously emit sufficient amount of electrons to the beam, but also be pro-
tected from energetic ions [30]. In the study, it was shown that higher keeper current in
hollow cathode does not significantly change the coupling voltage. An increase in the
keeper current slightly decreases the requirement for mass flow rate of the cathode, and
enhances self-heating, thus resulting in a decrease in power consumption. The position
of the neutralizer was investigated on the basis of the erosion of the cathode and the
grids [30]. In another study conducted by Nishiyama et al., it was demonstrated that
the optimum position of microwave discharge neutralizer also decreases the coupling
voltage and the mass flow rate [31]. From these different studies, it is shown that the
location of any type of neutralizer becomes important in reducing the coupling voltage
and increasing the efficiency of the thruster.

12
The effect of mass flow rate of the cathode on the coupling voltage was investi-
gated in different studies. A decrease in coupling voltage with decreasing mass flow
rate was observed in all studies regardless of the type of cathode used [32–34].
1.3. Contribution of this Work
In this research, experimental results for the testing of HK40 Hall thruster oper-
ated with a prototype LaB6 hollow cathode, also developed at BUSTLab, are presented.
Magnetic field topology of HK40 is examined to determine the proper location of the
LaB6 hollow cathode.
During the experiments various currents to and from the thruster and the cathode
have been measured. The relations between the magnetic field and the discharge prop-
erties have been studied by considering the emitted electron current. The measurement
results along with relevant discussions are presented. Also, the position of the cathode
which determines the resistance between the plume plasma and the cathode has been
varied to observe the changes in the plasma potential and the cathode voltage.
The concept of magnetic field separatrix is discussed. To investigate the effects of
the separatrix surfaces, the location of the cathode is changed in-situ with respect to the
Hall thruster with a 2D translational stage in two different grounding configurations,
one connecting the vacuum chamber to the same ground with the power supplies, and
the other with the power supplies connected to a common floating ground.
It is shown that the influence of the external magnetic field on the thruster ef-
ficiency can be predicted from the electron current coming from the cathode emitter
surface. The thesis also presents that the cathode to ground voltage provides a way
to estimate the efficiency with respect to the cathode placement. The mechanisms
and the efficiency values of the two setups are compared for the ground and the space
operations.

13
In the thesis, Hall thruster is introduced in Chapter 2 on the basis of the electrical
and magnetic mechanisms to ionize the neutral gas with the magnetized electrons
and to expel the created ions. HK40 Hall thruster is introduced in detail in this
chapter. Hollow cathode basics and electron extraction are explored theoretically in
Chapter 3. Then, BUSTlab hollow cathode, constructed with LaB6 emitter material,
is presented and the detailed design procedure is explained. In Chapter 4, first, the
experimental facility is described. The experimental setups used are presented with
the relevant discussions and results. The cathode characteristics are examined with a
virtual anode during the earlier experiments. Then, further cathode tests are conducted
with HK40 Hall effect thruster. For those experiments, the magnetic topology of the
thruster is varied, and the effects on the cathode current and the plasma potential are
measured. Finally, two different wiring configurations for the thruster-cathode system
are compared. The position of the cathode is varied for both setups and the external
magnetic topology effects are examined. Thrust and efficiency values are presented
for certain data points which are decided with respect to the separatrix surfaces. In
Chapter 5, overall conclusions are presented and the future work is described.

14
2. HALL THRUSTER OVERVIEW
In Hall effect thrusters, the neutral gas is ionized with collisions with the mag-
netized electrons. The neutral propellant gas is supplied to the discharge channel and
electrons flow towards the channel from a cathode mounted outside of the thruster as in
Figure 2.1. A radial magnetic field created with the help of magnets and the axial elec-
tric field cause the electrons to move in an azimuthal direction, confining the electrons
in a narrow region in the discharge channel. This effect enhances the ionization and
creates a region with sharp electrical potential drop. The created ions are accelerated
by the axial electric field between the anode potential and the plasma potential at the
exit of the thruster.
Figure 2.1. Basic Hall thruster configuration.
Electrons should be pulled by an anode effectively while the created ions are
accelerated outside the thruster. Acceleration depends on the anode voltage and the
plasma potential at the exit of the thruster. The plasma potential is formed by cathode
electrons and the expelled ions.

15
Electric field is observed in the direction of the thruster axis while magnetic
field is in radial direction for the proper ionization and acceleration processes. The
cross direction of the two fields gives rise to a current in azimuthal direction: Hall
current. This current has an effect on potential distribution in the channel and in
the near plume region [35]. Electrons move azimuthally constituting Hall current and
improving ionization of the propellant gas. Hall parameter is a measure of electron
magnetization and its conductivity along the electric field and it will be explained in
Section 2.1. The physics behind the azimuthal instabilities caused by the electron-wall
interactions, 2D sheath formation on walls and secondary electron emission have been
studied extensively [35–37]. The enhanced electron flow inside the channel towards the
anode is considered to be a result of these instabilities and this phenomenon is called
anomalous electron transport.
A significant component of HET is the cathode, since it emits electrons to ionize
neutral atoms in the discharge channel. The created ions move towards the exit while
electrons are partially trapped inside the discharge channel of HET due to magnetic
field. The second role of the cathode is completely different from the former in a way
that equal amount of electrons to exiting ions should be emitted to compensate for the
charge effects on thruster and to prevent the spacecraft from charging. This is done
by placing the neutralizer cathode on a mount near the thruster exit plane. By doing
this, charging is prevented and quasi-neutrality in the beam plasma is obtained.
Electron mass is much smaller compared to the ion mass, therefore, the effects of
electric and magnetic fields are observed differently on electrons and ions. Because of
high acceleration of electrons, plasma interactions with the surroundings are dominated
by the electrons. Besides, relatively low mass of electrons implies that they are affected
by the fields with Lorentz Force, ~F = q ~E + q~v × ~B, much more significantly. Larmor
radius calculated in uniform magnetic field shows how strongly magnetic field can trap
a particle. Since Larmor radius is proportional to particle’s mass, ions have much
larger Larmor radius than electrons. Therefore, ions could escape from the HET while
electrons could not [22].

16
Figure 2.2. Schematic of the channel regions.
Extracted ions should be neutralized because thruster efficiency is strongly tied to
neutralization in three ways: focusing ion beams to generate higher thrust, producing
equal amount of electrons to ions, and adjusting cathode coupling voltage [30].
In the thruster discharge channel, there are two main regions: ionization region
and acceleration region. An illustrative schematic is shown in Figure 2.2. In the
ionization region, a large gradient in electron temperature is observed. The ionization
is started by the incoming electrons of the cathode. The electron energy decreases by
the increased ionization [7]. There are equal numbers of electrons and ions after the
ionization of the neutral propellant. The discharge current is equal to the total electron
current coming from the cathode and the ionization process.
The second region is named as the acceleration region. Hall thrusters are designed
such that the acceleration region is located at the exit plane to protect the walls from
sputtering. This region is indicated by the maximum electric field and the maximum
magnetic flux density values.

17
In the acceleration region, supersonic ion flow is observed [7]. Ions are accelerated
by the applied electric field:
e∆φ ≈ eVd ≈1
2miu
2i (2.1)
2.1. Electron Motion in Magnetized Plasma
In Hall effect thrusters, electric and magnetic fields are used to create a plasma
and to expel the ions at high velocities to produce thrust. Even though the imposed
magnetic field affects both the electrons and the ions, the ions move mostly unaffected
by the magnetic field due to their higher mass, and are accelerated by the applied
electric field.
There are three types of electron motion in Hall effect thrusters: (i) electron
motion along the local magnetic field lines into the channel, (ii) closed drift, E × B,
motion to distribute electrons around the channel, (iii) cross-field (transverse) electron
motion towards the anode [38]. The paths of electrons are illustrated in Figure 2.3. The
E×B drift velocity is E/B in magnitude and occurs along the channel circumference
contributing to the Hall current. The maximum magnetic flux density is observed in
this region where the Hall current exists [38]. Electrons are trapped by magnetic field
lines and their cyclotron frequency, ωe = qB/me, is much higher than that of the ions.
Furthermore, the cyclotron frequency of electrons is much greater in comparison to the
electron collisional frequency, ωe >> νe [7]. In E×B drift region, the Hall parameter,
β, is defined as:
β =ωeνe
=eB
meνe(2.2)
where νe is the electron-heavy particle collision frequency. Since the electrons are well
magnetized, the electron Hall parameter is much larger than unity in Hall thrusters.
Cross-field motion is accomplished by electron mobility [38]. The electron momentum

18
Figure 2.3. Schematic of the paths of electrons with ionization.
collision frequency is defined as:
νm = νei + νen (2.3)
where νei is the electron ion collision frequency and νen is the electron neutral collision
frequency.
However, this equation is not sufficient to explain the cross-field motion of elec-
trons and it is an underestimation for electron current towards the anode according to
the experimental results [15].
Morozov included a wall collision frequency term, νw, to get higher cross-field
transport term [39]. The final addition is the Bohm diffusion term, νB. This term
is proposed to be coming from instabilities of E × B drift motion because of the

19
Hall current [15]. This concept was studied first by Bohm, Burhop and Massey in
1946 [40]. Experimental and numerical studies confirmed that cross-field mobility is
highly dominated by Bohm diffusion given by Equation 2.4. In this equation the
multiplication factor of 16 is commonly used to match the experimental data [41].
νB = 16ωe (2.4)
Thus, the total collision frequency becomes:
νm = νei + νen + νw + νB (2.5)
Hall parameter, β, and electric conductivity, σ, provide a way to explain the relation
between electric field and magnetic field in Hall effect thrusters. The current density
is obtained from the relation:
J = σE (2.6)
Conductivity has components in all directions which are all proportional to 1/(1 + β2)
[42]. Thus, the current density in the longitudinal direction has a proportionality
relationship:
Jz ∼E
1 + β2(2.7)
If the magnetic flux density is high in a region, then the Hall parameter is large, and
the current density is low in this region.
According to Equation 2.6, conductivity and current density are affected by the
electric field in a similar manner. Therefore, σz would have a proportionality relation-
ship:
σz ∼1
β2(2.8)

20
According to Equation 2.8, in the strongest magnetic field region, electron current flow
is restricted because electrons are trapped in magnetic field lines. On the other hand,
for large ωe, the Hall parameter is large. Electrons follow the magnetic field lines by
experiencing cyclotron motion. In the acceleration region, electrical conductivity is
low but electric field reaches a maximum value. Along magnetic field lines, electron
temperature and plasma potential gradients are low. Therefore, the lines are considered
to be equipotentials [10]. As a result, electrons ionize the neutrals in the channel and
ions could be attracted to the thruster exit due to low potential at the thruster exit.
2.2. Hall Thruster Design Parameters
The thruster design and operation are affected by both the technical constraints
and the discharge physics [7]. For SPT-type Hall thrusters (Stationary plasma thrusters),
the non-conducting wall material is a lifetime concern. For Hall thrusters with smaller
diameters, magnetic field is stronger in the channel resulting in more ionization and
more damage on the thruster inner walls. To overcome the erosion problem, small
sized thrusters are constructed with wider discharge channel relative to thruster di-
mensions [6]. The geometric constraints such as the size of the discharge chamber is
determined by considering the Larmor radius of particles (le << Lc << li). Lc is the
channel length and bc is the channel width. Ions could escape from the chamber while
electrons are trapped.
There is a relation between the radial magnetic field and the channel width value
[10]. Magnetic flux density increases if the width is decreased. For example, the channel
width for SPT-80 Hall effect thruster is 10 mm to increase the radial magnetic flux
density [43].
Brbc ≈ const if Vd = const (2.9)
Comparison of different thrusters from the literature are presented in Figure 2.4.

21
Figure 2.4. Comparison of the different thrusters from the literature [6].
Another technical constraint for HETs is the limited magnet current. The sup-
plied magnetic current creates magnetic field in the channel for the thrusters with
magnetic coils. However, there is a limitation in terms of how much current can be
supplied to the magnet coils as overheating of the coils can result in demagnetiza-
tion. Higher magnetic field created in narrow spaces generates asymmetries and causes
saturation as seen in Figure 2.5.
Figure 2.5. The relation between magnetic flux density and magnet current [7].

22
2.3. HK40 Hall Thruster
HK40, designed and built at BUSTLab, is an SPT-type Hall thruster with a
dielectric channel outer diameter of 40 mm. In its original design, the thruster had
1/2 inch diameter and 1 inch long cylindrical Samarium-Cobalt permanent magnets;
four outer and one inner. Recently, these permanent magnets were replaced with 1018
steel core electromagnets of the same physical size. The thruster is operated with
different magnetic coil currents to observe the changes in the discharge characteristics.
HK40 is considered to be a low power thruster with an operational power of
250 W . To understand the geometric configuration of HK40 better, a comparison of
the geometric and operational parameters of several thrusters are presented in Table
2.1. P5 Hall effect thruster has eight magnetic coils with a diameter of 173 mm, SPT-
50 Hall effect thruster has one inner coil and four external coils with a diameter of
50 mm, and SPT-20 Hall effect thruster has two magnetic poles with a diameter of
20 mm [44–46].
Table 2.1. Comparison of the geometric and the operational parameters of several
Hall effect thrusters.
Parameters P5 SPT-20 SPT-50 HK40
Dext (mm) 172.8 20 50 41
Dint (mm) 122 10 28 28.6
Dmean (mm) 147.4 15 39 34.8
channel width(d) (mm) 25.4 5 11 6.2
channel length(L) (mm) 38.1 32 25 9.1
magnet currents (outer-inner) (A) 2.5-4.5 2.5 4.2-2.1 1.75-2
Br,max(G) 350 290 170 420
Optimum Vd (V) 300 200 350 260
d/L 0.67 0.16 0.44 0.68
d/Dmean 0.17 0.33 0.28 0.18

23
HK40 Hall thruster is constructed with Boron Nitride (BN) dielectric walls, 316
stainless steel anode, and two AISI 1018 shields to confine the magnetic field lines. The
permanent magnets are made of Samarium-Cobalt as mentioned before. The coils are
wrapped around 1018 steel core with copper wire insulated with Kapton. Each coil
consists of 180 turns. A technical drawing and the materials used for construction are
shown in Figure 2.6.
Figure 2.6. The materials used to construct HK40.
The thruster parts are constructed with the help of Prof. Huseyin Kurt of Istan-
bul Medeniyet University. The material processes, such as the cold mounting for the
gas flow pipe and the heat treatment for the electromagnets, are accomplished at his
laboratory.
Figure 2.7. HK40 Hall effect thruster (views from the front and the back sides).

24
Figure 2.8. HK40 Hall effect thruster with LaB6 hollow cathode.
A picture taken after the assembly process is shown in Figure 2.7. The anode
voltage is supplied from one of the screws and the gas flow connection is handled with
a 1/8 inch stainless steel tube. The thruster is operated with the BUSTLab hollow
cathode as shown in Figure 2.8.
2.3.1. Construction of HK40
In this section, the construction procedure is described and some of the problems
encountered and the solutions to those problems are discussed. The first part that
should be mentioned is the gas distribution system. At first, the gas flow system is
designed as a narrow gap between the two parts of the anode to distribute the propellant
flow equally, as in Figure 2.9.
After the earlier trial tests of the thruster, it was observed that the Argon pro-
pellant cannot flow through this narrow gap uniformly. Thus, to fix this problem, a
second anode was constructed. In this anode, equally spaced holes were drilled on the
top side of the anode for gas distribution as seen in Figure 2.10.

25
Figure 2.9. The first design of the anode and the gas distribution.
Figure 2.10. The second design of the anode and the gas distribution.
During initial tests, the BN discharge channel was damaged. Because of the
cracks observed on BN chamber walls, a new channel was constructed. For further
tests, new BN channel and new anode were used. Pictures of the old and the new BN
channels are seen in Figure 2.11. The gas flow pipe is connected to the gas chamber
inside the anode by cold mounting process as seen in Figure 2.12.
For HK40, the material with high magnetic permeability is decided as 1018 stain-
less steel. The 1018 stainless steel cap inside the BN channel on the top of the magnet
is shown in Figure 2.13. This cap is important for the confinement of the magnetic
field near the channel exit.
26
Figure 2.11. The latest design of the anode and the discharge channel.
Figure 2.12. Cold mounting for the gas line.
Figure 2.13. The magnet and the cap inside the BN channel.

27
The magnet holder of the thruster is constructed with 8 holes but only four of
them are used. In Figure 2.14, the second design of HK40 with electromagnets is shown.
The center cores of the coils are heat treated at the laboratory of Prof. Huseyin Kurt.
The resistance of each electromagnet is approximately 2.75 Ω. The magnet coils can
withstand temperatures up to 250C. They are wrapped with a shrink tube as shown
in Figure 2.14.
Figure 2.14. The magnet holder with magnet coils.
2.3.2. Magnetic Circuit Design
The operation of a Hall thruster strongly depends on the magnetic circuit design.
All the regions inside and outside of the thruster should be considered to give maximum
acceleration for the created ions, to protect the insulator walls from sputtering and to
guide the electrons towards the anode for closing the electric circuit. The anode-side,
the channel inside, the thruster exit and the external fields are discussed in this section.
A symmetric magnetic lens is a desired magnetic field topology for Hall effect
thrusters. Magnetic field lines in radial direction should be parallel to each other in the
acceleration region to reduce inhomogeneities in the field. It is a design parameter that
affects thruster efficiency. Part b in Figure 2.15 shows the optimum case. As mentioned
before, maximum magnetic flux density is observed at the acceleration region.

28
Inside the channel, magnetic field lines are parallel to each other to form the
potential difference that attracts ions to accelerate them towards the thruster exit.
Moreover, on the anode side and at the thruster exit, magnetic field lines are curved
radially.
Figure 2.15. Magnetic field lines in radial direction [7].
The other design consideration is the weak radial magnetic field at the anode-
side (10− 20 G). Electrons have cyclotron motion around the magnetic field lines and
transverse motion towards the anode to close the electric circuit constructed between
the anode and the cathode. However, if electron magnetization still exists near the an-
ode, electrons fail to reach the anode and accumulate on the magnetic lines, shadowing
the anode voltage seen by cathode electrons. A representative schematic of electron
motion for HK40 is shown in Figure 2.16. After the tests, it was concluded that HK40
discharge channel should be redesigned and be made longer, and the magnetic field
along the channel be optimized accordingly.

29
Figure 2.16. Depiction of the electron movement inside the channel of HK40.
The magnetic contours generated by COMSOL modeling of the HK40 Hall thruster
are shown in Figure 2.17 with a picture of the thruster in operation.
The magnetic field lines that close at the back of the thruster could cause the
magnetization of the electrons near the cathode and it could prevent the electrons from
reaching the beam ions by traveling across the magnetic field lines. The solution is
to place the cathode in an appropriate position. The experiments are conducted to
demonstrate this.
External magnetic field topology of a Hall effect thruster has an important char-
acteristic called magnetic field separatrix that signifies the surface which forms the
boundary between closed magnetic surfaces and open field lines. Inside the separatrix,
magnetic field lines capture electrons near the anode and along the beam while the
lines outside the separatrix orient electrons away from the beam. Therefore, it can
be suggested that the cathode should be placed inside the region determined by the
separatrix surfaces. However, the cathode should be protected from sputtering dam-
age of the high energy ions exiting the thruster. Also, according to the experimental

30
Figure 2.17. HK40 plume with magnetic contours.
results of Sommerville, the thruster efficiency is observed to be low when the cathode
is positioned very close to the thruster [22]. Considering these, there should be an
optimum placement for the cathode to protect it from ion bombardment, to emit elec-
trons without causing double layer formation, to reduce the plasma potential in the
near plume region, and to increase the cathode to ground voltage.
2.3.3. Hall Probe Measurements and the Magnetic Model of HK40
Before the thruster-cathode tests, the magnetic field topologies of the thruster
with the permanent magnets and the electromagnets are measured using a transverse
Hall probe. The magnetic flux density values are measured by a Lakeshore DSP 455
Gaussmeter operated with LabVIEW on computer. The Hall probe results are com-
pared with COMSOL modeling of the thruster magnetic field topology and the model
is adjusted based on the measurements.

31
For the invariant fields, Hall effect provides a way to measure the magnetic flux
density. Hall probe includes a semiconductor standing in a magnetic field, B. An
electrical current j, thus moving electrons, flowing perpendicular to this magnetic field
in this semiconductor experiences a Lorentz force perpendicular to both j (motion of
the electrons) and B as in Figure 2.18. As a result, there is a net charge build up on
the side faces of this probe, and that causes the formation of electric potential opposing
the magnetic force. This created potential is measured from the faces by electrodes to
deduce the magnetic flux density.
Figure 2.18. Illustration of the operation of a Hall probe [8].
Figure 2.19. Lakeshore transverse Hall probe [9].
In order to map the magnetic field topology and to determine the location of
the separatrix region, magnetic field was measured with a Gaussmeter. For the mea-
surements, HK40 is moved with two linear stages instead of moving the probe. The
magnetic flux density values are read from the screen of Lakeshore DSP 455 Gaussme-

32
ter. The Hall probe of this Lakeshore model is a transverse probe as shown in Figure
2.19.
The region outside the thruster is scanned to verify the model by comparing
the measured axial component of the magnetic field as shown in Figure 2.20. The
probe is moved through the channel vertically to measure the radial component of the
magnetic field. The measurements of the radial magnetic field in the channel are used
to investigate the magnetic lens and to validate the magnetic model.
Figure 2.20. Magnetic field measurements of HK40. The transverse Hall probe is
placed at the center of the exit plane of the thruster.
Figure 2.21. The directions for the tests.

33
For the probe measurements, the radial and the axial directions are shown in
Figure 2.21. The stages are moved independently using a PLC controller.
The region investigated starts at the center of the thruster exit. There are four
outer permanent magnets those are assembled 90 degrees apart and one inner per-
manent magnet for the first design. The cross-section plane for the magnetic probe
measurements does not pass through the outer magnets as could be seen in Figure
2.22, but instead the magnets are positioned at a 22.5 degrees angle with respect to
the plane of the magnetic probe measurements.
Figure 2.22. Photograph and schematic of thruster showing the placement of the
permanent magnets.
To observe the separatrix surface, a finite element model of the HK40 Hall effect
thruster was constructed over a 2D domain which was obtained from the cross-section
of the 3D CAD drawing of the thruster. The numerical simulations were done using
COMSOL, a finite element software. The cross-section plane passes through the center
of the thruster head and the centers of two of the outer pole permanent magnets. The
numeric results are adapted to the measurements with a 22.5 degrees angle with the
help of our lab member Yavuz Emre Kamis. Since the magnetic field is planar, the
magnetic vector potential has only z-component according to Gauss’s Law.

34
The relation between the magnetic field and the magnetic vector potential is given
by:
B = ∇×A (2.10)
B =∂Az∂y
x− ∂Az∂x
y (2.11)
The measurements are carried out for the 100 mm by 100 mm region in front of the
thruster that started from the center of the thruster exit and extended parallel to the
thruster axis. The axial magnetic field measurements are conducted by the Hall probe
at the points represented by the white dots in Figure 2.23b. The first measurements
conducted with the probe are done to verify the magnetic model of the thruster. The
comparison of the measurements and the model is shown in Figure 2.23. The model
Figure 2.23. The comparison of modelled and measured axial external magnetic flux
density of the design with permanent magnets (values are in Gauss).
and the measured data are compared by considering the two different designs of the
thruster. The magnetic field topology of the thruster with the electromagnets is also
measured by the transverse Hall probe.

35
In these measurements, two different power sources are used for supplying the
desired currents to inner and outer magnet coils. The measurements of the design with
coils are presented in Figure 2.24. The coil currents are decided arbitrarily for the
purposes of comparison.
Figure 2.24. The comparison of modelled and measured axial external magnetic flux
density of the design with magnetic coils (inner = 2 A, outer = 1.75 A) (values are in
Gauss).
There are some differences for the two designs stemming from the actual and the
tabulated material properties information, such as magnetic permeability, entered into
the COMSOL model regarding the SmCo ring magnets and the magnetic materials (in
this case 1018 stainless steel) used in the construction of the thruster.
In Figure 2.25, the two different designs are compared in terms of their separa-
trix surfaces. The arrows represent the direction of the magnetic field as normalized,
whereas the colored contours show the z-component of the vector potential with values
very close to zero, that stands for the separatrix surface.
Magnetic flux density is compared along the thruster center line at the exit of
the thruster. There are certain differences for the designs as could be seen in Figure
2.26.
36
Figure 2.25. The separatrix surfaces of two designs (inner = 2 A outer = 1.75 A for
the design with coils).
Figure 2.26. Measured axial magnetic flux density from the center of the thruster exit
to 10 cm axial distance (magnet angle: 22.5 degree, inner = 2 A outer = 1.75 A for
the design with coils).
The design with permanent magnets has much higher magnetic flux density at
the exit, compared to the design with electromagnets. However, the magnetic field
of the permanent magnet design shows lower magnetic flux density further away from
the thruster. The magnetic flux density of the design with magnetic coils remains
constant after a point. To better observe the changes, logarithmic scale is used for the
comparison. The design with permanent magnets shows a decrease at 60 mm.

37
The desired electric and magnetic field profiles inside the discharge channel can
be seen in Figure 2.27. In the figure, the electric field in the axial direction reaches its
maximum at the exit plane. Inside the channel, magnetic field is mostly in the radial
direction, therefore the magnitude of the magnetic field in this figure represents the
radial field flux density.
Figure 2.27. Profiles of magnetic and electric fields along the channel [10].
Expecting the maximum magnetic flux density to be at the exit, the radial mag-
netic field measurements are done inside the channel of HK40, near the inner wall and
the results are compared with the simulation results as shown in Figure 2.28. The
thruster exit is located at a distance of 9.2 mm from the anode as in the CAD mod-
eling. However, the measurement uncertainties cause a difference for the exit plane.
Also, the Hall probe tip is not the measurement point, instead the region measuring
magnetic field is near the tip within 3.81 ± 1.27 mm from the tip according to the
probe specifications [47]. Therefore, the measurements are started at 5 mm from the
anode face.
As shown in Figure 2.15, a symmetric magnetic lens is the desired magnetic field
topology for Hall effect thrusters. As mentioned before, the maximum magnetic flux
density is observed at the acceleration region. The mapping of the discharge channel of
HK40 is shown on the left in Figure 2.29. The spatial probe measurements are made in
this region of the thruster and the data are sketched with MATLAB. On the right side
of Figure 2.29, the contour graph of the gradient of the magnetic field for the same coil

38
Figure 2.28. The comparison of modelled and measured radial external magnetic flux
density in Gauss of the design with magnetic coils, inner = 2 A, outer = 1.75 A.
Figure 2.29. The radial magnetic flux density (G) in discharge channel and the
change in the radial magnetic field in axial direction forming magnetic lens.
current values is shown. Because of the probe dimensions, the measurements start from
that location as in Figure 2.28. The inner channel wall is located at a radial distance

39
of 3.5 mm. The axial distance of 9 mm is observed as the thruster exit. The expected
change in the magnetic flux density is observed in the acceleration region which is
the region with maximum magnetic flux density region. This measurements show the
location of the maximum magnetic flux density and the formation of magnetic lens at
the thruster exit with radially parallel lines and curved lines outside the thruster and
near the anode.

40
3. LaB6 HOLLOW CATHODE OVERVIEW
Hall effect thrusters utilize electric and magnetic fields to extract ions from a
plasma discharge. The cathode is responsible for the ionization of the propellant and
the neutralization of the ion beam by emitting an equal number of electrons to prevent
spacecraft charging. Hollow cathode electrons are extracted from an insert surface by
thermionic emission.
Hollow cathode operation depends on many factors including the insert material,
the required temperature to start the electron emission, the keeper voltage to extract
electrons and mass flow rate of the propellant gas. Apart from these, the chosen ma-
terials to construct the cathode are crucial because to start the thermionic emission,
high temperature needs to be achieved inside the cathode. Temperature inside the
cathode should be kept high to sustain thermionic emission; therefore, very high tem-
peratures should be part of the design consideration. The cathode inside is heated
by a heater wire which can withstand to high temperatures above 1700 K. Thermal
radiation shields reflect the generated heat back to the inside of the cathode to keep
temperature high. 3D CAD drawing of a typical hollow cathode is shown in Figure
3.1.
Figure 3.1. Basic hollow cathode parts.
41
3.1. Thermionic Emission
Thermionic emission is the mechanism that enables hollow cathode to emit elec-
trons. It depends on the insert material used for the cathode. Insert materials start
emitting electrons after a specified temperature. The electron emission current density
is given by:
j = A∗T 2we− eΦ
kTw (3.1)
where A∗ = 120Acm−2K−2, Φ is the work function of the material, k is the Boltzmann
constant, and Tw is the wall temperature [48].
The insert material should be heated in order to obtain the electron current. To
supply continuous electron emissions to the cathode plasma, different heater designs
and different insert materials in the literature are investigated [13].
Figure 3.2. Emission mechanisms of BaO −W and LaB6 [11].
For insert material, BaO −W and LaB6 were compared, and LaB6 was chosen
since it is not affected by impurities in the propellant gas [11]. Figure 3.2 shows emission
mechanisms of these two thermionic materials. As an insert material BaO −W was
the preferred option for many years.
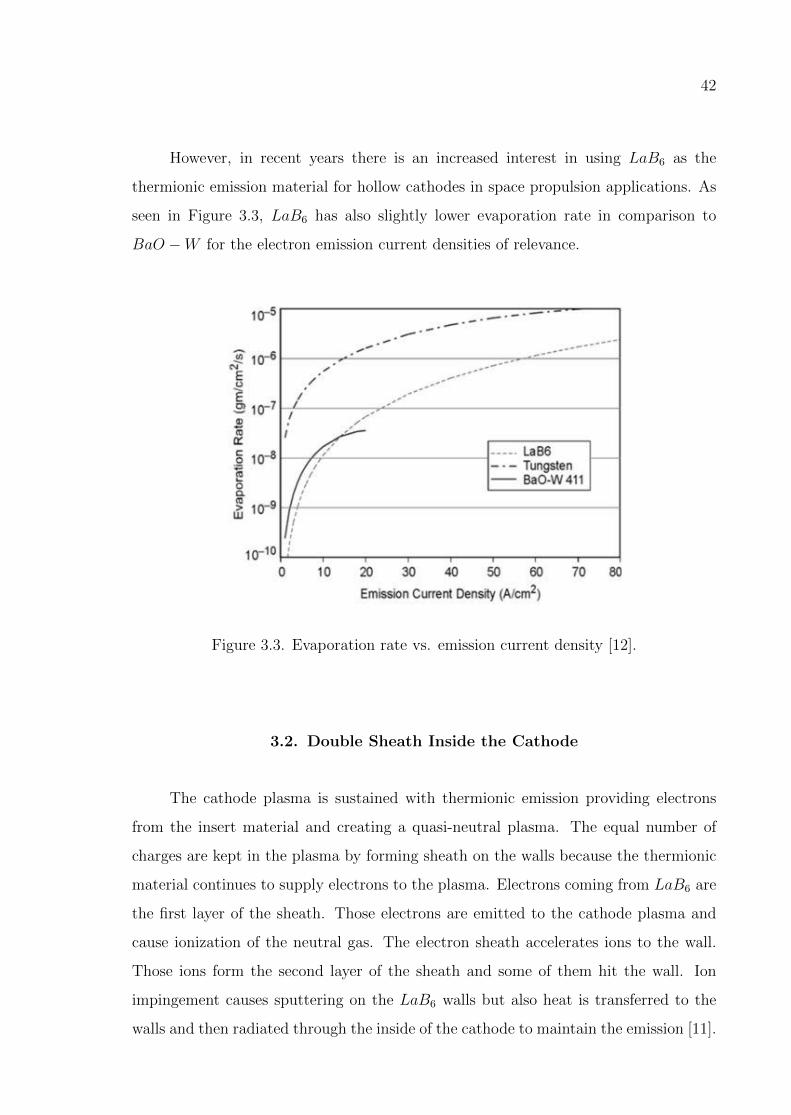
42
However, in recent years there is an increased interest in using LaB6 as the
thermionic emission material for hollow cathodes in space propulsion applications. As
seen in Figure 3.3, LaB6 has also slightly lower evaporation rate in comparison to
BaO −W for the electron emission current densities of relevance.
Figure 3.3. Evaporation rate vs. emission current density [12].
3.2. Double Sheath Inside the Cathode
The cathode plasma is sustained with thermionic emission providing electrons
from the insert material and creating a quasi-neutral plasma. The equal number of
charges are kept in the plasma by forming sheath on the walls because the thermionic
material continues to supply electrons to the plasma. Electrons coming from LaB6 are
the first layer of the sheath. Those electrons are emitted to the cathode plasma and
cause ionization of the neutral gas. The electron sheath accelerates ions to the wall.
Those ions form the second layer of the sheath and some of them hit the wall. Ion
impingement causes sputtering on the LaB6 walls but also heat is transferred to the
walls and then radiated through the inside of the cathode to maintain the emission [11].
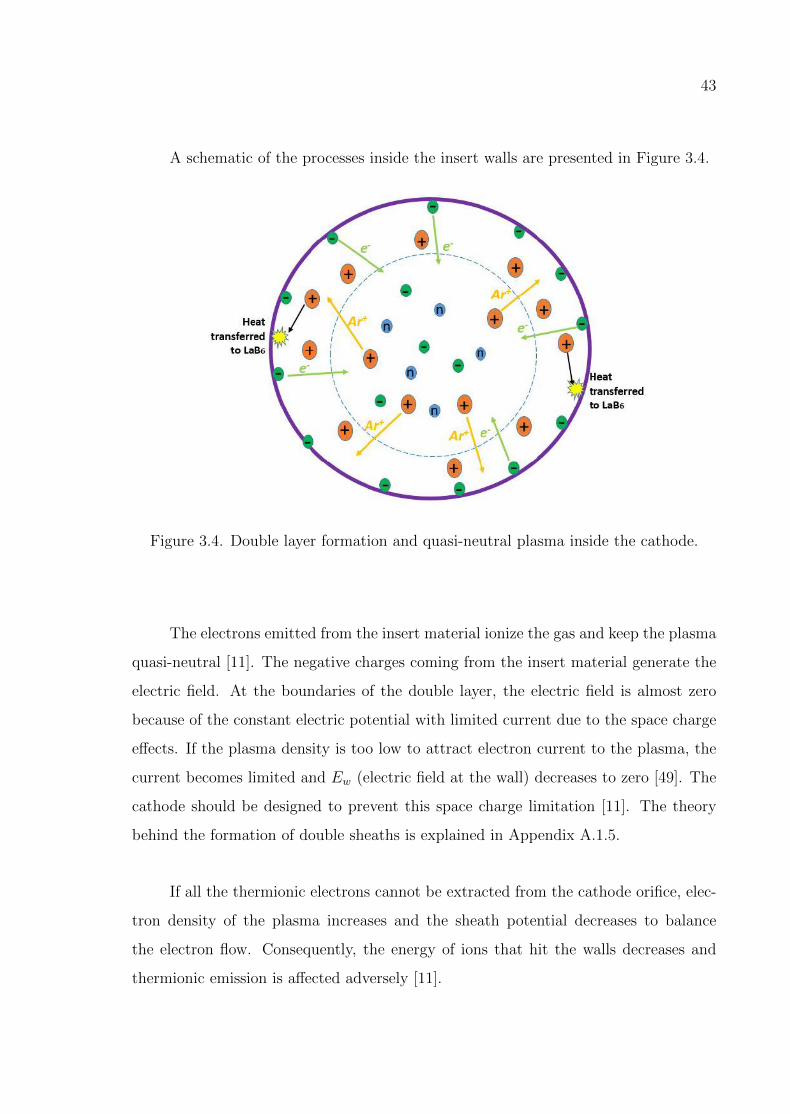
43
A schematic of the processes inside the insert walls are presented in Figure 3.4.
Figure 3.4. Double layer formation and quasi-neutral plasma inside the cathode.
The electrons emitted from the insert material ionize the gas and keep the plasma
quasi-neutral [11]. The negative charges coming from the insert material generate the
electric field. At the boundaries of the double layer, the electric field is almost zero
because of the constant electric potential with limited current due to the space charge
effects. If the plasma density is too low to attract electron current to the plasma, the
current becomes limited and Ew (electric field at the wall) decreases to zero [49]. The
cathode should be designed to prevent this space charge limitation [11]. The theory
behind the formation of double sheaths is explained in Appendix A.1.5.
If all the thermionic electrons cannot be extracted from the cathode orifice, elec-
tron density of the plasma increases and the sheath potential decreases to balance
the electron flow. Consequently, the energy of ions that hit the walls decreases and
thermionic emission is affected adversely [11].

44
3.3. Current Extraction Mechanism
The source of the electrons that leave the cathode, thus providing the cathode
current, is the LaB6 insert located inside the cathode tube. As seen in Figure 3.5, the
insert is at ground potential. As LaB6 insert emits electrons, it would start extracting
electrons from ground.
Figure 3.5. Electron extraction from LaB6 emitter surface.
After the cathode current emission is initiated, electrons emitted from the emitter
surface ionize the Argon propellant inside the cathode tube. An electron-ion pair is
obtained for each ionized Argon atom, which form a quasi-neutral plasma inside the
cathode tube. The quasi-neutral plasma acts as a catalyst medium for the self-heating
thermionic emission process. Electrons are much more energetic, thus they form a
sheath on the LaB6 inner surface and attract positively charged ions from the plasma.
Electrons are pulled by the ions to the cathode plasma while ions are accelerated
towards the inner wall, which provides a mechanism for continuous thermionic emission
[11].
Inside the cathode tube, the self-heating mechanism causes the creation of a
voltage difference between the plasma and the emitter surface. Due to the emitted
electrons, the LaB6 emitter’s surface momentarily becomes positively charged creating
a voltage difference between the inner surface of the LaB6 insert and ground, which
generates ground current (Iground).

45
Cathode voltage is in an equilibrium in response to the continuous electron emis-
sion, which depends on the operating conditions, such as emitter material temperature
and cathode propellant mass flow rate.
After the cathode is heated enough to provide sufficient current density of thermio-
nic electron emission from the LaB6 emitter’s surface, keeper is biased to a high poten-
tial to attract electrons from the inner plasma. As the cathode discharge is initiated,
the magnitude of keeper voltage drops depending on the propellant flow rate and the
set keeper current value. Keeper voltage arranges itself to the operational potential of
the keeper.
3.4. BUSTLab Hollow Cathode
Design processes and operation of the BUSTLab hollow cathode are discussed in
this section. The sketches are generated using SolidWorks and the thermal analysis are
conducted with COMSOL. At BUSTLab, numerous hollow cathodes have been built.
The developed cathodes all utilize a LaB6 insert as the thermionic material. The design
has been made based on the dimensions of this thermionic emission material and the
requirements regarding the temperature that needs to be achieved for the thermionic
emission to begin and to be sustained.
Figure 3.6. The schematic of BUSTLab hollow cathode.

46
BUSTLab hollow cathode has a 6 mm outer diameter 48 mm long graphite
cathode tube. It utilizes a 2 mm ID, 4 mm OD LaB6 tube of 10 mm length as
the thermionic emission material. The insert region of the cathode is heated using a
heater assembly that utilizes 0.25 mm diameter tantalum wire that is wrapped around
a high temperature machinable ceramic (Shapal) tube with external helical grooves.
A specially designed coaxial graphite part is used for providing current to the heating
wire, and alumina parts are used for electrical and thermal insulation of the heater
wire as seen in Figure 3.6.
3.4.1. Construction of BUSTLab Hollow Cathode
The cathode consists of emitter, cathode tube, heater wire, keeper, spring, non-
conducting sleeves, radiation shields, screws and base. The construction starts from the
inner parts. The emitter material is placed with a spring inside the cathode tube which
is mounted on a base. The heater wire is wrapped at the upper part of the cathode tube.
The insulator sleeves separate the electrical parts. The shields surround the cathode
tube and radiates heat back to the cathode tube. As a final step, keeper is placed to
cover the cathode tube. All the cathode parts are designed and manufactured with the
help of Prof. Huseyin Kurt of Istanbul Medeniyet University. After the manufacturing
of the cathode parts, all of them are cleaned with IPA (Isopropyl alcohol).
Since hollow cathode works with the principle of thermionic emission as described
in the previous sections, the emitter material must be heated to a very high temperature
(∼ 1600 C). For this reason, different conducting and insulating materials that can
withstand very high temperatures have been used in hollow cathode manufacturing. In
addition to their electrical properties, machinability, thermal properties and magnetic
properties have been taken into account in the selection of these materials. The design
of the cathode has been changed in the process and a large number of cathodes have
been produced over the last two years. The components of the first cathode produced
are shown in Figure 3.7.
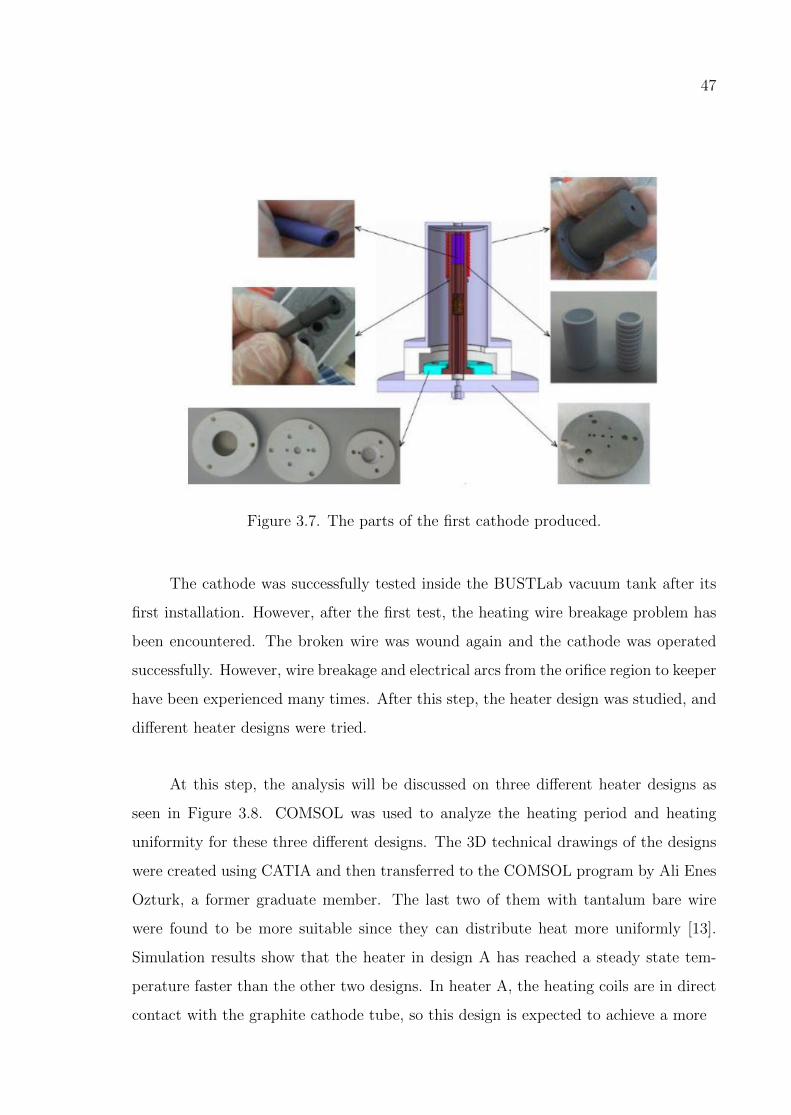
47
Figure 3.7. The parts of the first cathode produced.
The cathode was successfully tested inside the BUSTLab vacuum tank after its
first installation. However, after the first test, the heating wire breakage problem has
been encountered. The broken wire was wound again and the cathode was operated
successfully. However, wire breakage and electrical arcs from the orifice region to keeper
have been experienced many times. After this step, the heater design was studied, and
different heater designs were tried.
At this step, the analysis will be discussed on three different heater designs as
seen in Figure 3.8. COMSOL was used to analyze the heating period and heating
uniformity for these three different designs. The 3D technical drawings of the designs
were created using CATIA and then transferred to the COMSOL program by Ali Enes
Ozturk, a former graduate member. The last two of them with tantalum bare wire
were found to be more suitable since they can distribute heat more uniformly [13].
Simulation results show that the heater in design A has reached a steady state tem-
perature faster than the other two designs. In heater A, the heating coils are in direct
contact with the graphite cathode tube, so this design is expected to achieve a more

48
rapid temperature stability. The helical shaped design of the heater B has been seen to
heat the inner surface faster as expected, as compared to the axial cable design of heater
C. Heater C was redesigned with small alumina tubes instead of horizontal grooves and
tried for the earlier designs. Heater B was preferred for the latest BUSTLab hollow
cathodes.
Figure 3.8. Heater A: classical heater with sheated tantalum wire wrapped around
cathode tube. Heater B: Tantalum bare wire wrapped inside helical shaped groove.
Heater C: Tantalum bare wire wrapped inside horizontal shaped groove [13].
The heater wire is wrapped around an insulator material which is changed for dif-
ferent designs among alumina, Cotronics 960 and Shapal. Those materials can endure
high temperature, but for the continuous tests the heater wire evaporates the insulator
material causing shorts to the graphite cathode tube. Shapal was preferred because of
its high temperature characteristics to heat and its reasonable machinability.
Another problem was the alumina accumulation on the tantalum shields. Alu-
mina sleeves are used to tighten the heater wire wound on the cathode tube. The
shields are necessary to reflect radiation to sustain thermionic emission. Alumina is
preferable because of its durability to high temperature and the thermal insulation
capability. However, after long hours of operation, it was observed that alumina evap-
orates and alumina powder covers the surfaces of the tantalum shields. As a result,
reflectivity of the tantalum shields decrease significantly and heat cannot be reflected
back to the cathode interior and thermionic emission can cease. In Figure 3.9, it is
observed that the keeper glows because the heat generated flows through the keeper
due to a failed shield.

49
Figure 3.9. Tantalum shields after alumina deposition on their surfaces, and glow of
the keeper tube when tantalum shields do not work as planned.
All the problems have been fixed gradually from the first design to the latest
one. The initial design was constructed with small alumina tubes with two holes. The
tantalum wire enters from one of the holes and then enters the other from the opposite
side. There are 28 turns and two sides of the wire are extracted from the bigger hole
separately as in Figure 3.10. One end is connected to the ground and the other supplies
heating current.
The alumina tubes could not withstand high temperature heating during one of
the experiments. As a result, considerable damage on all the parts, carrying tantalum
wire, was observed. An alternative design is made where heater wire is wrapped in
helical grooves on an insulator ceramic as in Figure 3.11. Tests showed that the wire
broke outside the grooved alumina. The excessive heating on the cathode tube parts
was the problem. To increase thermal dissipation, a piece of wire was wrapped around
the tube without connecting it in any circuit as in Figure 3.11. We used the thermo-
couple wire, which was out of order, as a support to wrap the extra wire to dissipate

50
Figure 3.10. The heater wire turning in 14 alumina tubes.
heat. In this design, one end was touched to the ground from inside of the cathode
tube. The other end was wired to the heater current.
Figure 3.11. The wrapped heater coil with the cathode structure and the wrapped
heater coil in grooves with advanced thermal dissipation.

51
After many trials, the cathode materials eroded. The cathode base, manufactured
with stainless steel, was damaged as in Figure 3.12 and the left side of the base and the
keeper were affected by the thruster plume due to long term exposure to the plasma
as seen in Figure 3.13.
Figure 3.12. The wear on the cathode base.
Figure 3.13. The wear on the keeper due to the cathode position relative to the
thruster plume.
As described in the previous sections, the most difficult part was the production
of a long-lasting heater in the designs regarding production and material selection. Over

52
the last year, the cathode parts have repeatedly been produced, and some cathode
parts burned, broke, eroded, and fragmented, resulting from high temperature or arc
problems. For this reason, a more robust cathode has been accomplished with a cre-
ative design called coaxial hollow cathode which is designed by Prof. Huseyin Kurt.
The produced coaxial hollow cathode has been successfully turned on and off dozens
of times and has also been used in tests with the HK40 Hall effect thruster.
The heater wire connections were handled with conductive graphite parts. Figure
3.14 demonstrates the differences between the first design and the coaxial design.
Figure 3.14. The first and the latest heater designs.
Figure 3.15. The coaxial cathode parts.

53
For this design, there are two graphite layers: the one standing on top of the
steel base is for grounding, the second part located under the grooved Shapal is for the
heater wire. The current is carried by the metal screws and the graphite tube to the
wire. The parts of the coaxial cathode are shown in Figure 3.15.
The construction processes are shown in Figure 3.16.
Figure 3.16. The coaxial cathode construction.
3.4.2. Plume and Spot Mode Operations
The cathode operates in two different modes: plume mode and spot mode. The
cathode plasma affects the electron current extraction from the cathode orifice. The
electron density in the plasma determines the operational characteristics of the cathode.
In spot mode, only a small spot appears at the orifice region. If there are enough
electrons in the plasma to feed the cathode current, the keeper pulls electrons to outside
of the cathode forming a thin sheath at the keeper orifice. The keeper voltage is lower
than the plasma potential in spot mode [11]. Keeper becomes relatively negative for
the electrons as shown in Figure 3.17.
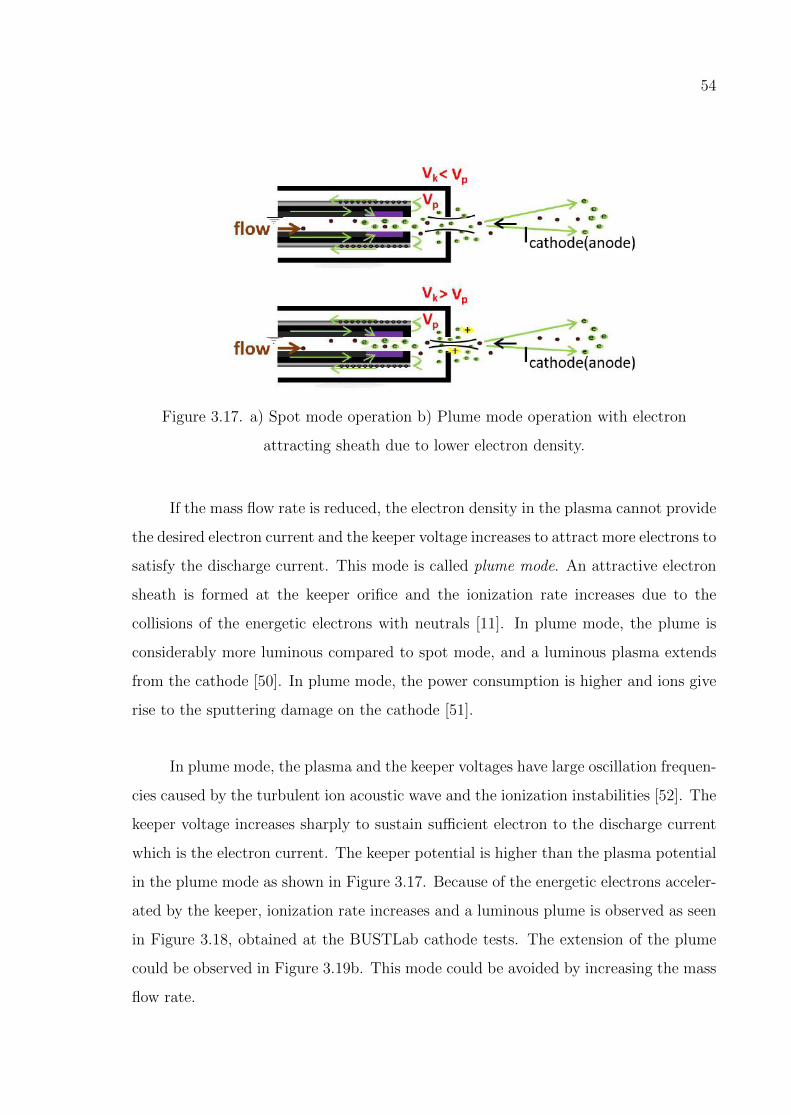
54
Figure 3.17. a) Spot mode operation b) Plume mode operation with electron
attracting sheath due to lower electron density.
If the mass flow rate is reduced, the electron density in the plasma cannot provide
the desired electron current and the keeper voltage increases to attract more electrons to
satisfy the discharge current. This mode is called plume mode. An attractive electron
sheath is formed at the keeper orifice and the ionization rate increases due to the
collisions of the energetic electrons with neutrals [11]. In plume mode, the plume is
considerably more luminous compared to spot mode, and a luminous plasma extends
from the cathode [50]. In plume mode, the power consumption is higher and ions give
rise to the sputtering damage on the cathode [51].
In plume mode, the plasma and the keeper voltages have large oscillation frequen-
cies caused by the turbulent ion acoustic wave and the ionization instabilities [52]. The
keeper voltage increases sharply to sustain sufficient electron to the discharge current
which is the electron current. The keeper potential is higher than the plasma potential
in the plume mode as shown in Figure 3.17. Because of the energetic electrons acceler-
ated by the keeper, ionization rate increases and a luminous plume is observed as seen
in Figure 3.18, obtained at the BUSTLab cathode tests. The extension of the plume
could be observed in Figure 3.19b. This mode could be avoided by increasing the mass
flow rate.

55
Figure 3.18. Pictures of BUSTLab hollow cathode in a) Spot mode operation b)
Plume mode operation.
Figure 3.19. Pictures of BUSTLab hollow cathode in a) Spot mode operation b)
Plume mode operation.
3.4.3. Thermal Model of the Cathode
The thermal model of BUSTLab hollow cathode is built to predict the temper-
ature of the insert region and the heat transmitted to the holder parts. The cathode

56
with alumina tube heater system and the coaxial cathode are compared. The geometric
differences of both designs can be observed in Figure 3.20. The major difference is the
electrical current paths. The difference alters the thermal dissipation of heat caused
by the heater wire. In the latest design, graphite is used instead of the wires inside the
alumina beads as the current carrier. The graphite parts are shown in black color in
Figure 3.21.
Figure 3.20. The schematics of the first BUSTLab hollow cathode and the new
coaxial hollow cathode, respectively.
Figure 3.22 shows the temperature distribution of the two cathodes. The supplied
power was assumed to be 107 W based on the designs in the literature. During the
tests, the first cathode was operated in 100-120 W power range. The same power
generation was used for the coaxial cathode model. The maximum temperature in
the model was observed to be lower in the new design and the cathode did not emit
electrons for that power level during the tests.
Comparing the results presented in Figure 3.22, it could be said that the tem-
perature distribution is less concentrated for the new design. Thermal conductivity
of alumina is around 4.6 W/mK compared with Poco graphite, which has a thermal
conductivity of 95 W/mK [11]. The graphite parts dissipate heat over the cathode.

57
Figure 3.21. Schematic of BUSTLab coaxial hollow cathode (the black regions show
graphite parts).
Figure 3.22. Temperature distribution of the first and the latest hollow cathode
designs with 107 W power dissipation from heater.
For the coaxial design, the model was modified based on the experimental test
results. The power dissipation was entered to the model as 200 W which was ob-

58
tained from the cathode tests with 4.5 A heater current. The temperature distribution
obtained with this power dissipation is shown in Figure 3.23.
Figure 3.23. Temperature distribution of the latest design with 200 W power
dissipation from heater.
The temperature values obtained from the model results are important to predict
the electron current. The cathode electron current could be calculated using the LaB6
dimensions and temperature [11]. For three different thermionic emission materials,
emission current densities versus surface temperatures are shown in Figure 3.24.
The BUSTLab LaB6 and the LaB6 used in reference [11] are compared as in
Figure 3.25. The dimensions and the current requirements of the study in reference [11]
satisfy the relationship between the current density (7 A/cm2) and the temperature
(1800 K). Our current density, based on the dimensions of the emitter material,
is around 3.18 A/cm2 corresponding to 1700 K at 1.2 A discharge current. This
temperature is higher when compared with the model results shown in Figure 3.23.
The reason for this difference could be due to higher concentration of heat on LaB6
during operation, or sufficient non-zero electric field, Ew, observed as the sheath region
on the wall. The electric field on the LaB6 surface causes a decrease in the work

59
Figure 3.24. Emission currents [11].
Figure 3.25. LaB6 comparison.
function of the emitter material and thus, improves thermionic emission [51]. In the
model, electrical effects are not included.

60
4. EXPERIMENTS AND RESULTS
HK40 Hall thruster tests have been conducted inside the BUSTLab vacuum cham-
ber which is a 1.5 m diameter 2.7 m long cylindrical tank. The vacuum chamber is
illustrated as in Figure 4.1.
Figure 4.1. Vacuum chamber assembly with the constructed test setup at the inside.
Rough pumping is achieved by a combination of Oerlikon rotary wane pump and
roots blower. A pressure on the order of 3 × 10⁻³ Torr is obtained by the mechan-
ical pump system. As the next step, approximately 10−7 Torr is achieved with the
help of two Sumimoto Marathon CP-12 cryopump and Sumimoto F-70H water cooled
compressor. The chamber pressure is measured using an MKS Instruments 900 Series
pressure sensor. Gas flow rate control is made by an MKS systems mass flow con-
troller. Argon is supplied with pressure regulators from the gas tube to the chamber.
Swagelok valves are used as shutoff valves for the gas tube and vacuum chamber supply
pipes [53]. The test setups are constructed in the chamber by handling electrical and
gas connections. When the setup is ready, the tank is closed and the pump down is
started. BUSTLab vacuum chamber is as in Figure 4.2 while it is in operation.

61
Figure 4.2. BUSTLab vacuum chamber.
Various gas and electrical feedthroughs have been used to provide gas flow and
power to inside the chamber. The insulation of the cables is vacuum-rated and the
electrical connections are durable to high voltage.
Experiments have been conducted with different power sources for keeper, heater,
anode, and inner and outer magnetic coils. All the power sources, mass flow controller,
sourcemeter and PC are placed on the same rack as in Figure 4.3.
4.1. Cathode - Virtual Anode Tests
BUSTLab hollow cathode characteristics have been determined by conducting
tests using a virtual anode. The setup for the cathode tests with a virtual anode is
shown in Figure 4.4. By operating the cathode in this setup, virtual anode current and
voltage values are obtained for different mass flow rates and keeper current values.
4.1.1. Biased Anode Voltage
There are two tests to observe the cathode current. For the first test, the coaxial
cathode emits electrons as the virtual anode voltage is biased. However, the negative
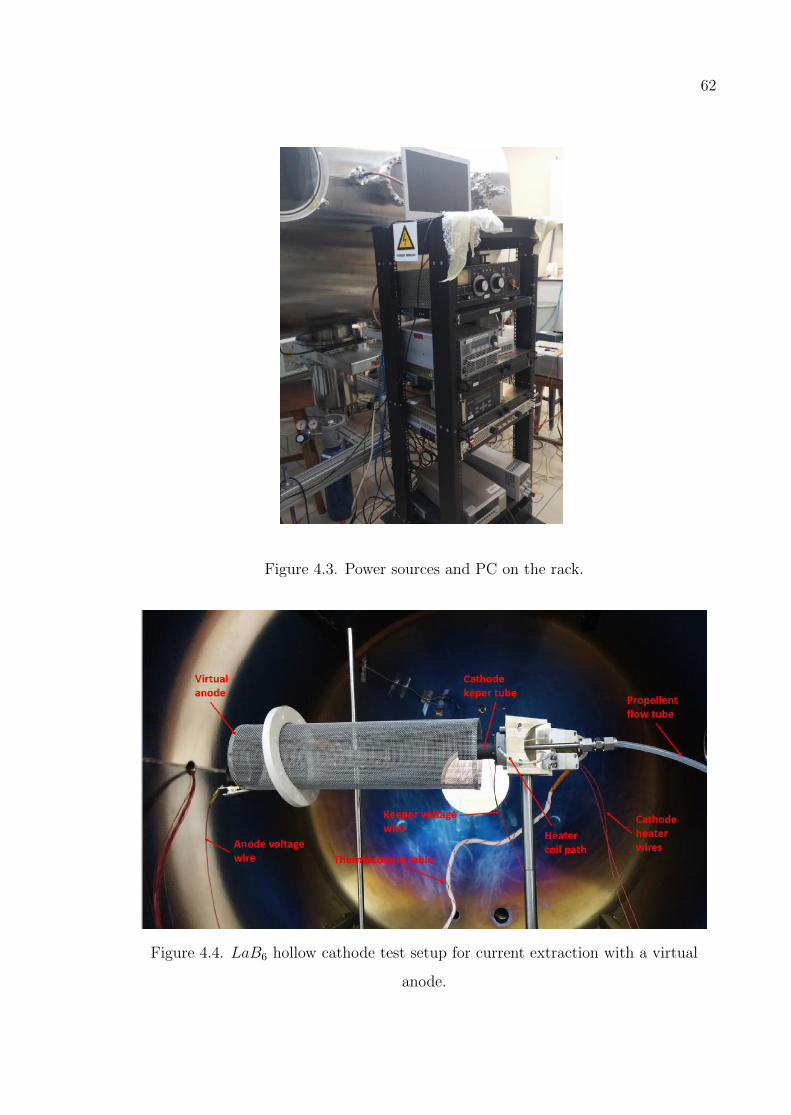
62
Figure 4.3. Power sources and PC on the rack.
Figure 4.4. LaB6 hollow cathode test setup for current extraction with a virtual
anode.
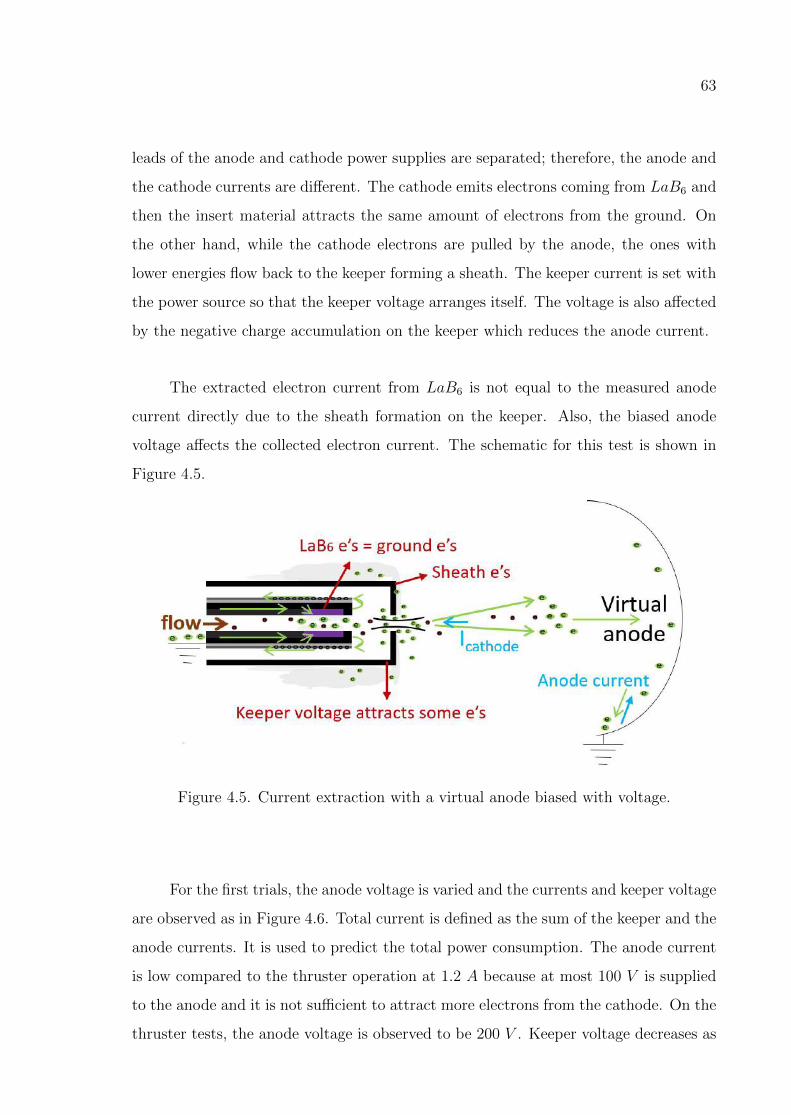
63
leads of the anode and cathode power supplies are separated; therefore, the anode and
the cathode currents are different. The cathode emits electrons coming from LaB6 and
then the insert material attracts the same amount of electrons from the ground. On
the other hand, while the cathode electrons are pulled by the anode, the ones with
lower energies flow back to the keeper forming a sheath. The keeper current is set with
the power source so that the keeper voltage arranges itself. The voltage is also affected
by the negative charge accumulation on the keeper which reduces the anode current.
The extracted electron current from LaB6 is not equal to the measured anode
current directly due to the sheath formation on the keeper. Also, the biased anode
voltage affects the collected electron current. The schematic for this test is shown in
Figure 4.5.
Figure 4.5. Current extraction with a virtual anode biased with voltage.
For the first trials, the anode voltage is varied and the currents and keeper voltage
are observed as in Figure 4.6. Total current is defined as the sum of the keeper and the
anode currents. It is used to predict the total power consumption. The anode current
is low compared to the thruster operation at 1.2 A because at most 100 V is supplied
to the anode and it is not sufficient to attract more electrons from the cathode. On the
thruster tests, the anode voltage is observed to be 200 V . Keeper voltage decreases as

64
the anode voltage is increased on the power supply because electrons located around
the keeper forming the sheath are pulled by the anode.
Figure 4.6. The changes in currents and voltages by varying anode voltage for mass
flow rate of the Argon propellant = 2.5 sccm.
To observe the mass flow rate effects on the cathode operation, the keeper current
is kept constant at 1 A as in Figure 4.7. With an increase in Argon propellant flow rate,
anode current becomes lower for the same anode voltage. Keeper voltage decreases as
seen in Figure 4.7. Less anode current and smaller keeper voltage imply that the sheath
and the anode do not collect more electrons. According to the results, the extracted
electron current decreases with the increase in neutral gas flow. The reason can be
explained by the resistance analogy. Rk, which is the resistance between the LaB6 and
the keeper, becomes lower due to the increase in neutral gas density. If the cathode
current is less according to Figure 4.7, then the voltage difference between the keeper
and the cathode decreases, (Vkeeper−Vcg = IcathodeRk). Therefore, the decrease in keeper
voltage can be explained because less cathode current means lower cathode voltage in
magnitude. It can be asserted that the cathode voltage determines the cathode current
and then the keeper voltage changes. The resistances and voltages will be discussed in
detail in the next sections with the help of Figure 4.11.

65
Figure 4.7. The changes in currents and voltages by varying mass flow rate for keeper
current=1 A, anode voltage=70 V.
By changing the keeper current, the anode current and the keeper voltage are
graphed as in Figure 4.8. The anode voltage is kept constant at 70 V . The keeper
voltage decreases as the keeper current is increased, meaning more electrons join the
keeper current and the sheath becomes thinner. As the keeper voltage pulls less elec-
trons back, the anode collects more current with the same anode voltage.
Figure 4.8. The changes in currents and voltages for varying keeper current for mass
flow rate = 1.8 sccm, anode voltage=70 V.

66
4.1.2. Biased Anode Current
For the second test, the ground current is measured as the biased anode current
1.2 A plus the keeper current 1.4 A while the anode voltage arranges itself to appro-
priate values as the mass flow rate changes. The schematic of the biased current test
is shown in Figure 4.9. The magnitude of the cathode electron current is determined
by the biased anode current because the anode and the cathode are connected by the
negative leads of the power supplies.
Figure 4.9. Current extraction with a virtual anode biased with current.
The mass flow rate is changed and the anode voltage is observed as in Figure 4.10.
As the flow rate is increased, the anode current changes more dramatically. The cathode
voltage has a negative value and changes as the electrons are extracted from LaB6.
The same equation is valid for the biased voltage case, (Vkeeper − Vcg = IcathodeRk).
When the flow is low, the cathode cannot sustain 1.2 A and arranges itself to lower
values as shown in the figure. The keeper voltage and the anode voltage are observed
to be higher due to the sheath formation on the keeper. After a certain flow rate, there
are enough electrons to satisfy the preset current, 1.2 A. The current jump is observed
while the resistance inside the cathode decreases with the increased flow rate. The
keeper voltage also decreases and the sheath disappears as all the electrons emitted
are attracted by the anode. The negative cathode voltage, Vcg, becomes more negative

67
with the current jump. As a result, the voltage difference increases due to the sharp
increase in the cathode voltage magnitude.
Depending on the results, it can be said that the electron current extracted from
the cathode is equal to the current collected on the anode cup. For the thruster
operation, the cathode electrons should start ionization process and then neutralize
the expelled ions in the beam. Therefore, higher electron current is desired for the
operation and the cathode mass flow rate is determined to be 2.2 sccm for Argon
propellant.
Figure 4.10. Virtual anode current and the voltages by varying mass flow rate for
keeper current = 1.4 A.
4.2. Cathode Tests with Current Measurements
In order to illustrate the electrical circuit of the thruster-cathode system, a repre-
sentative schematic is created as shown in Figure 4.11. The anode and the cathode can
be characterized as a closed circuit where Rb, Rc, and Rk are the resistances between
plasma and anode, plasma and cathode, and keeper and LaB6 insert, respectively. Rb
is created by the magnetic field topology in the discharge channel. Rc depends on the
placement of the cathode as well as the external magnetic topology of the thruster.
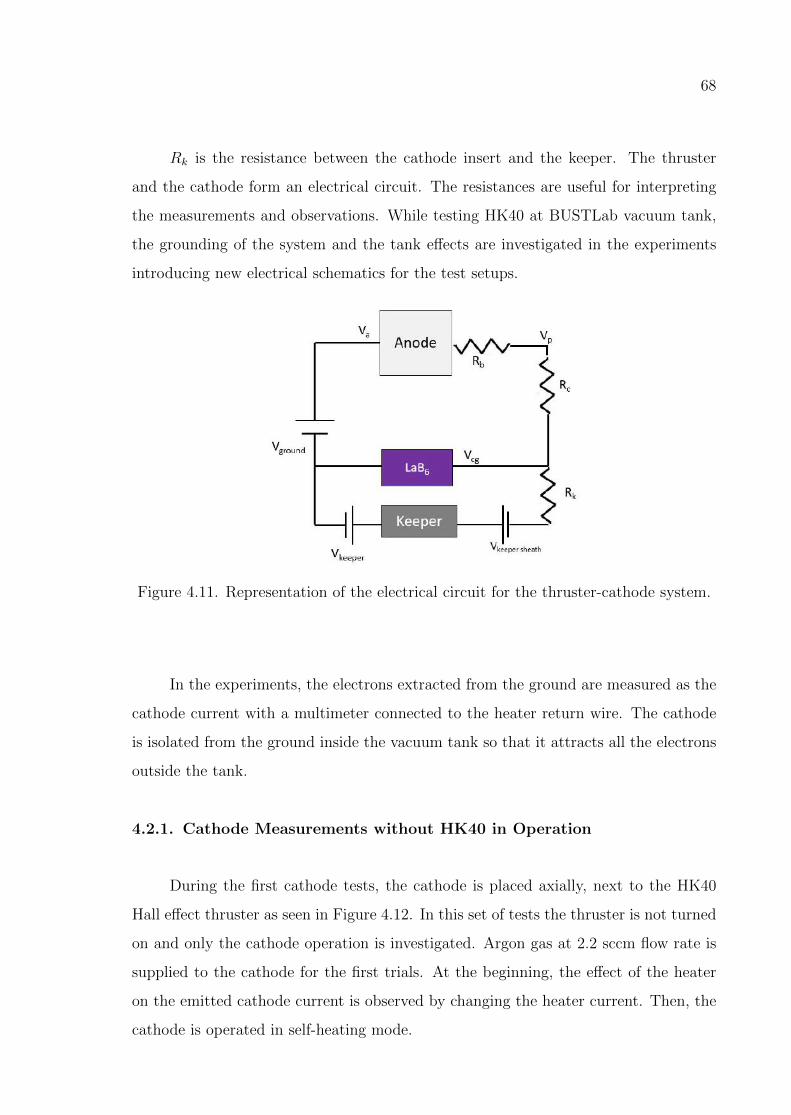
68
Rk is the resistance between the cathode insert and the keeper. The thruster
and the cathode form an electrical circuit. The resistances are useful for interpreting
the measurements and observations. While testing HK40 at BUSTLab vacuum tank,
the grounding of the system and the tank effects are investigated in the experiments
introducing new electrical schematics for the test setups.
Figure 4.11. Representation of the electrical circuit for the thruster-cathode system.
In the experiments, the electrons extracted from the ground are measured as the
cathode current with a multimeter connected to the heater return wire. The cathode
is isolated from the ground inside the vacuum tank so that it attracts all the electrons
outside the tank.
4.2.1. Cathode Measurements without HK40 in Operation
During the first cathode tests, the cathode is placed axially, next to the HK40
Hall effect thruster as seen in Figure 4.12. In this set of tests the thruster is not turned
on and only the cathode operation is investigated. Argon gas at 2.2 sccm flow rate is
supplied to the cathode for the first trials. At the beginning, the effect of the heater
on the emitted cathode current is observed by changing the heater current. Then, the
cathode is operated in self-heating mode.

69
Figure 4.12. HK40 Hall thruster with moveable cathode.
4.2.1.1. Cathode with continuous heating. BUSTLab hollow cathode is heated with
a current of 4.5 A to provide sufficient current density for thermionic emission. The
process is explained step by step in Appendix C.1. This heater current is supplied
gradually to protect the cathode materials from a possible cracking due to fast thermal
expansion.
Figure 4.13. Cathode current for varying heater current.

70
To preserve the cathode materials from excessive heating and to minimize the
cathode energy consumption, the heater current should be turned off; however, it is
left as turned-on to observe the effects of the heating process on the cathode current.
Higher temperature inside the cathode increases thermionic emission from the
emitter surface, which increases the magnitude of the cathode voltage. As a result,
the cathode current is observed to be higher as seen in Figure 4.13. In this test, Rk
is considered to be constant. Based on Figure 4.11, the ground current is the sum of
the keeper current and the cathode current. The cathode current and voltage increase
in magnitude; therefore, the keeper voltage decreases as in the figure, (Vkeeper − Vcg =
IcathodeRk).
4.2.1.2. Cathode without heating. After the heater is turned off, the variations of the
keeper current and the keeper voltage are observed. For the increased keeper current,
the extracted electrons (Icathode) increase as in Figure 4.14. On the contrary, an increase
in the cathode flow rate causes a decrease in the ground current as expected based on
the previous tests. Figure 4.13 and Figure 4.15 can be compared to see the changes
on the ground current for a constant keeper current while the heater current and the
mass flow rate are changing.
During the tests, a thin layer of glow is observed around the keeper. Electrons
inside this layer of glow (Vkeeper sheath) shield the keeper voltage; therefore, the keeper
voltage increases, in order to maintain the keeper current at that level. If the keeper
current is increased, electrons in the sheath layer contribute to the keeper current, and
the sheath layer disappears. As the sheath layer becomes thinner, the keeper shielding
decreases resulting in a decrease in the keeper voltage as in Figure 4.14.
As the voltage difference between the keeper and the cathode voltages increases
for higher keeper current values, more current is extracted from the ground. The
cathode voltage becomes more negative if the plasma resistance between the keeper and
LaB6 surface is assumed to be constant (Rk in Figure 4.11). However, for the increased

71
Figure 4.14. Changes in keeper voltage and extracted emission current from LaB6
with respect to keeper current.
Figure 4.15. Cathode current for varying cathode propellant flow rate.
mass flow rate case, the resistance can be considered as decreasing as explained before.
The keeper voltage arranges itself to lower values while the cathode voltage decreases

72
in magnitude. The reasons will be discussed in the following section.
4.2.2. Cathode Measurements with HK40 in Operation
While the thruster is on, the extracted current from the cathode, the anode
voltage, the plasma potential in the plume and the cathode to ground voltage are
measured for different magnetic coil currents.
Hall thuster plume plasma parameters are measured using a single Langmuir
probe. The probe is operated with a sourcemeter and the I − V curves are sketched
with a built-in interface using a GPIB cable. There are single and double Langmuir
probes with planar and cylindrical geometries at the laboratory. Instead of using these,
a new planar probe has been built by following the construction procedure described
in [53]. The interpretation of the experimental data has been done with the MATLAB
code in reference [53].
4.2.2.1. Built Langmuir probe. A planar Langmuir probe is built for the Hall thruster
experiments. The probe used in these measurements has a 1 mm diameter molybdenum
rod inside a single hole alumina tube of 3.2 mm OD as in Figure 4.16. A Keithley 2410
sourcemeter is used for biasing the probe electrode and collecting the current. The
positive lead of the sourcemeter is connected to the molybdenum collection area with
electrical wires. The negative lead is connected to ground. The molybdenum wire is
attached to 20 AWG wire and all exposed conducting regions are insulated with shrink
tubes.
In the experiments, the probe should be isolated electrically to only collect
the charges that can reach the planar surface. The wire is surrounded by the non-
conducting Loctite glue. The probe is kept stationary while the cathode is moved
during the tests. The probe is attached to a metal rod in front of the thruster. To
prevent arcs on the probe structure, aluminum foil and Kapton tape have been used
as in Figure 4.17.

73
Figure 4.16. Langmuir probe parts.
Figure 4.17. Single Langmuir probe constructed for the tests.
The probe data is analyzed with the PC interface seen in Appendix G. I − V
curves are obtained as in Figure B.2 by biasing the probe from negative voltages to
positive voltages with an average of 1000 steps. The MATLAB code analyzes the probe
data to find floating potential of the probe, plasma potential and electron temperature
[53].

74
4.2.2.2. Current schematic. As seen in Figure 4.18, the source of the electrons are
the LaB6 insert located inside the cathode tube. In the experiments, the electrons
extracted from the ground are measured and the beam current is calculated to obtain
thrust and efficiency values.
Figure 4.18. Electron extraction from LaB6 emitter surface.
A schematic of the currents in the thruster-cathode system is illustrated in Figure
4.19. Cathode emits electrons to ionize the propellant (Iec) and to neutralize the
expelled ion beam (Ieb) [15].
Figure 4.19. Schematic of the currents in the thruster-cathode system.

75
Icathode = Iec + Ieb (4.1)
Cathode provides the primary electrons for the discharge current, and causes secondary
electrons coming from ionization (Iei). These two currents constitute the discharge
current as in Equation 4.2 [15]. The discharge current equals the total electron current:
Id = Iec + Iei (4.2)
Beam current (Iib) is formed by ionization and the number of ions are equal to the
electrons coming from ionization. Therefore,
Id = Iib + Iec (4.3)
Beam ions attract electrons to the thruster plume. Those electrons neutralize the
beam. For the perfect neutralization case, the number of beam ions and the number
of electrons provided to the beam from the cathode are equal:
Iib = Ieb (4.4)
As could be seen from Figure 4.19, in experiments when the electrons extracted from
the ground are measured, this would include the supplied keeper current because all
the parts in the cathode are at ground potential. The keeper current is set and the
cathode current is obtained from the equation:
Iground = Ikeeper + Icathode (4.5)
4.2.2.3. Grounded setup. For this setup the power sources, which provide the an-
ode and keeper voltages, are grounded to the vacuum chamber (Vground). Cathode is
also grounded through a multimeter, which measures the cathode to ground current

76
(Iground). The schematic is shown in Figure 4.20.
Figure 4.20. Electrical circuit for the thruster-cathode system for the grounded setup.
Rb is created by the magnetic field topology in the discharge channel and is
proportional to the square of the Hall parameter as in the Equation 2.8. Therefore, Rb
increases by the increased flux density of the magnetic field resulting in more ionization
in the channel. The magnitude of the radial component of the magnetic field should
not be too high to prevent the electron current towards the anode. Rc depends on the
placement of the cathode and the external magnetic field topology of the thruster as
stated before. Rc is the main concern of this study on the basis of magnetic topology.
In the next tests, the movement of the hollow cathode using a 2-D translational stage
affecting Rc is investigated.
Since the ground tests are conducted inside the vacuum chamber, Rtb and Rtc
terms are added to the system, which represents the resistance between the thruster
plume and vacuum chamber wall, and the resistance between the cathode and the
vacuum chamber wall, respectively.
4.2.2.4. Calculating efficiency from the ground current. The ions are accelerated from
the location of their creation inside the discharge chamber towards the downstream
plume region. The plume plasma potential depends on the electron current supplied
from the cathode, magnetic field topology, the placement of the cathode and the dis-
charge characteristics.

77
Even though the ions are created at a region that has slightly less potential than the
anode potential, it can be estimated that the beam power is:
Pb = Iib(Va − Vp) (4.6)
Beam current (Iib) is calculated from the difference between the discharge current
(Id) and the electron current emitted from the cathode (Iec) as in Equation 4.3. [15].
The discharge current is formed by incoming electrons from the cathode and by the
ionization of the neutrals. There are equal number of electrons and ions in the plasma
discharge after ionization as seen from Equation 4.7:
Iib = Iei (4.7)
where Iei is the electrons created after ionization. The created ions are expelled towards
the exit while electrons flow towards the anode as depicted in Figure 2.3. Thrust is
calculated as:
T =Iibmi
e
√2eVbmi
(4.8)
where Vb represents the beam voltage which is the difference between the anode and
the plasma voltages. Efficiency becomes:
ηT =1
2
T 2
mtPt(4.9)
where Pt is the total power which includes the power to anode, keeper and magnetic
coils [54]. With an increase in magnetic flux density, anode voltage becomes higher for
a constant discharge (anode) current and Rc changes. With constant discharge current,
the ground current (current from ground to the cathode) decreases, meaning that the
electron current extracted from the cathode decreases as will be explained.

78
4.2.3. Results
The beam current is calculated as the difference between the discharge current
and the cathode current as in Equation 4.3. For the operation of HK40 in these tests,
it is assumed that the cathode cannot provide electrons for neutralization. All the
cathode electrons are considered to contribute to the discharge current. With these
assumptions, thrust and total efficiency values are calculated as in Equations 4.8 and
4.9.
The reference thruster while constructing HK40 is SPT-50 [7]. When compared
with the operation parameters of SPT-50, HK40 is close to SPT-50 in terms of power
consumption, thrust and the ratio of the beam current to the discharge current [7,45].
However, it should be optimized regarding the mass flow rates, the cathode current
and the magnetic structure. Table 4.1 shows the discharge parameters obtained with
different inner and outer coil currents.
Table 4.1. Performance characteristics of HK40 Hall Thruster.
Id (A) Va (V) i (A) o (A) Pt (W) Iib (A) Vp (V) T (mN) ηT
1.2 204 1.2 1.25 263.4 0.749 43.6 8.63 0.244
1.2 206 1.4 1.5 269.4 0.763 44.8 8.82 0.249
1.2 208 1.5 1.75 275.1 0.772 45.45 8.96 0.252
1.2 210 1 2 279 0.765 46.8 8.89 0.245
1.2 213 1.7 2 284.7 0.781 47 9.16 0.254
With an increase in magnetic flux density, anode voltage becomes higher. Ioniza-
tion increases inside the channel due to increased number of collisions. Thus, the num-
ber of electrons coming from the ionization of the propellant increase. With constant
discharge (anode) current, the ground current (current from ground to the cathode)
decreases (as seen in Figure 4.21), meaning that the electron current extracted from
the cathode decreases. The keeper currents is kept constant as 1.7 A.

79
Figure 4.21. Current values for varying anode voltages.
Plume plasma potential becomes higher for higher anode voltage because of the
decrease in the number of electrons in the plume as seen in Figure 4.22. However,
beam voltage, which is the difference between anode and plasma potentials increases
because the increase in plasma potential is less than the increase in the anode voltage
as in Figure 4.22. Rb increases by the strong magnetic field.
For the experiments, the currents to the inner and outer magnetic coils are varied.
The results for five different inner and outer magnetic coil current pairs are presented
in Figure 4.23. As seen in this figure, the electron current from the cathode (Iec)
decreases with increased magnetic field. It could be asserted that electrons coming
from ionization of Argon atoms (Iei) contribute to the discharge current more than the
electrons extracted from the cathode. In this case, ion beam current (Iib) is higher
than the electron current in the plume (Ieb) and full neutralization is not achieved.
During the tests, it is observed that the electron current from the cathode is
small compared to electrons coming from the ionization process. The beam current
is calculated with Equation 4.3 by assuming poor neutralization, and the ratio of the
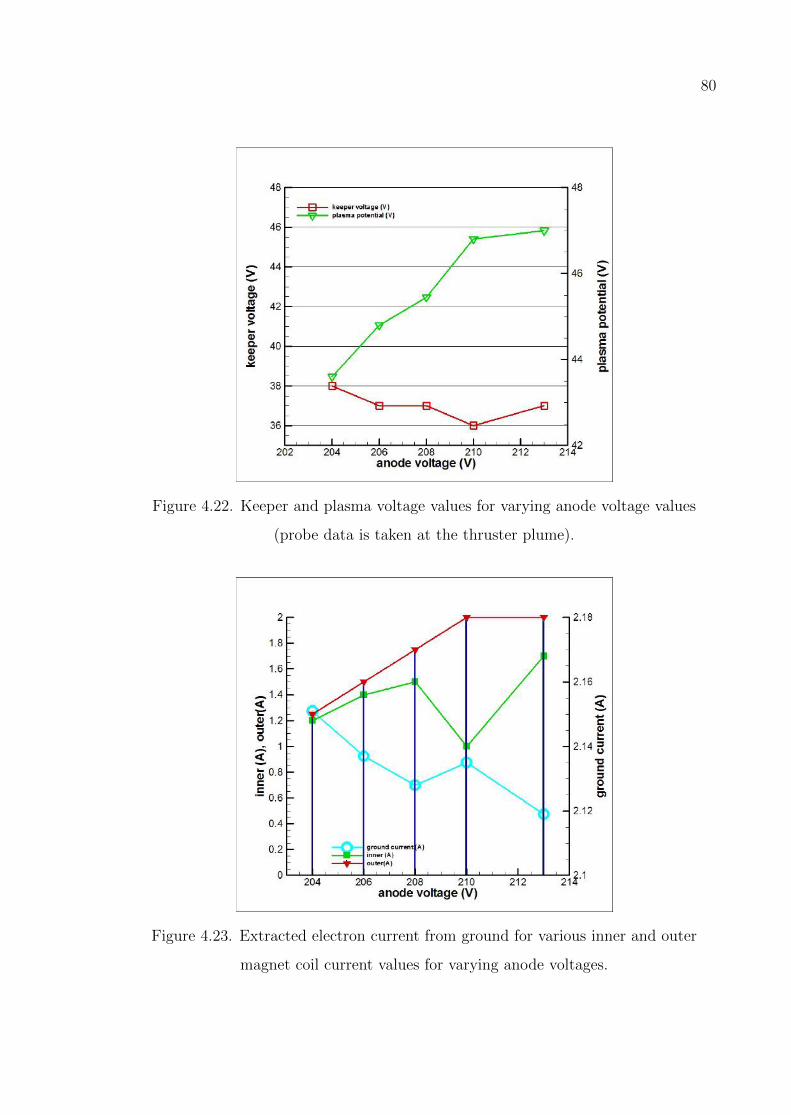
80
Figure 4.22. Keeper and plasma voltage values for varying anode voltage values
(probe data is taken at the thruster plume).
Figure 4.23. Extracted electron current from ground for various inner and outer
magnet coil current values for varying anode voltages.

81
beam current to the discharge current is plotted for different magnetic coil current
values as in Figure 4.24.
Figure 4.24. The current ratios for different magnetic field cases.
4.3. Cathode Placement Tests with HK40 Hall Effect Thruster
A picture of the HK40 Hall thruster placed inside the BUSTLab vacuum chamber
is shown in Figure 4.25a. The cathode is moved by a 2D translational stage. A
Langmuir probe is placed to measure the thruster plume. The origin is decided as
the center of the Boron Nitride channel cup at the exit plane of the thruster. The
directions used in the tests are illustrated on a rendering of the 3D technical drawing
of the experimental setup as shown in Figure 4.25b.
In order to illustrate the electrical circuits of the thruster-cathode system for two
different setups which are grounded and floating, representative schematics are created
as shown in Figures 4.20 and 4.31. BUSTLab hollow cathode is operated at different
locations for these setups.

82
Figure 4.25. a) Side view of the HK40 and BUSTLab hollow cathode inside the
chamber (with a Langmuir probe in front of the thruster) b) 3D rendering of the
experimental setup (with axial and radial directions indicated).
4.3.1. Cathode and Probe Measurements with HK40 in Operation
During the grounded setup experiments, the discharge current is kept constant
at 1.2 A for all the tests. Two different power supplies have been used to supply the
inner magnet coils with a current of 1.7 A, and the outer magnet coils with a current of
2.0 A. These magnet current values are determined as the optimum operation currents
for the grounded tests as seen from Table 4.1. According to the magnetic topology
model, for the stated inner and outer magnet current values, the maximum magnetic
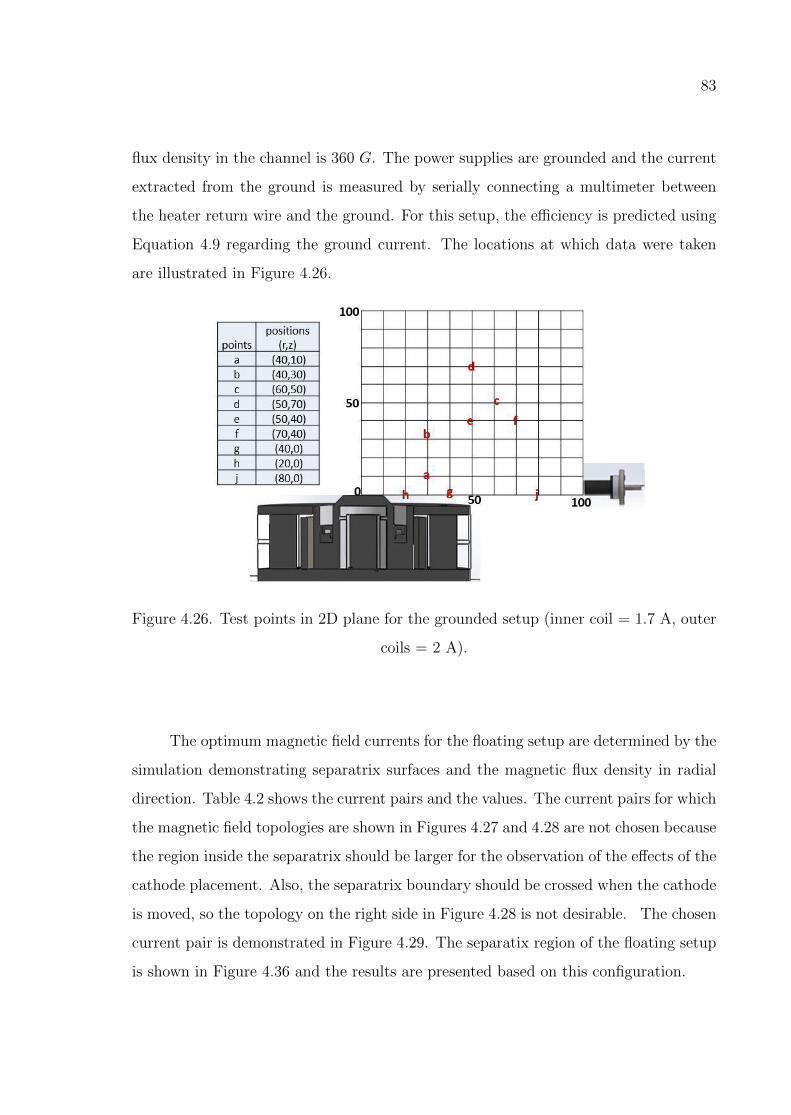
83
flux density in the channel is 360 G. The power supplies are grounded and the current
extracted from the ground is measured by serially connecting a multimeter between
the heater return wire and the ground. For this setup, the efficiency is predicted using
Equation 4.9 regarding the ground current. The locations at which data were taken
are illustrated in Figure 4.26.
Figure 4.26. Test points in 2D plane for the grounded setup (inner coil = 1.7 A, outer
coils = 2 A).
The optimum magnetic field currents for the floating setup are determined by the
simulation demonstrating separatrix surfaces and the magnetic flux density in radial
direction. Table 4.2 shows the current pairs and the values. The current pairs for which
the magnetic field topologies are shown in Figures 4.27 and 4.28 are not chosen because
the region inside the separatrix should be larger for the observation of the effects of the
cathode placement. Also, the separatrix boundary should be crossed when the cathode
is moved, so the topology on the right side in Figure 4.28 is not desirable. The chosen
current pair is demonstrated in Figure 4.29. The separatix region of the floating setup
is shown in Figure 4.36 and the results are presented based on this configuration.

84
Table 4.2. Magnetic flux density for varying magnetic coil currents
inner (A) outer (A) Br (G)
0.75 1.25 175
0.8 0.9 168
0.75 1.06 167
1 0.75 195
1 1.2 220
Figure 4.27. Separatrix surfaces. left:inner coil = 0.75 A, outer coils = 1.25 A
right:inner coil = 0.8 A, outer coils = 0.9 A.
For the tests conducted with the floating setup to measure the cathode to ground
voltage, the optimum magnetic field was obtained by supplying 1 A to the inner coil
and 1.2 A to the outer coils. For these current values, the maximum magnetic flux
density was determined to be 220 G. The discharge characteristics and the cathode-
to-ground voltage have been measured in-situ while changing the relative location of
the cathode with respect to the HK40 during system’s operation inside the vacuum
chamber. The locations at which data were taken for the floating setup are illustrated
in Figure 4.30. During these tests, all the electronic parts are connected to a common
ground as described in Section 4.3.1.1.

85
Figure 4.28. Separatrix surfaces. left:inner coil = 0.75 A, outer coils = 1.06 A
right:inner coil = 1 A, outer coils = 0.75 A.
Figure 4.29. COMSOL modelling of the magnetic field topology of HK40 overlapped
with the 3D drawing inside the chamber (inner coil = 1 A, outer coils = 1.2 A).

86
Figure 4.30. Test points in 2D plane for the floating setup (inner coil = 1 A, outer
coils = 1.2 A).
4.3.1.1. Floating setup. In the floating setup, the negative ends of the power sources
of the anode and keeper, and the return wire of the heater, which is connected to
the insert material, are all connected at a floating common point (called the common
ground). Common ground and the ground of the vacuum chamber are connected
through a multimeter, which measures the voltage (Vcg) between the floating common
voltage and ground voltage. The resistances are defined same as in Section 4.2.2.3.
This setup represents the electrical circuit of a thruster on a spacecraft.
Figure 4.31. Electrical circuit for the thruster-cathode system for floating setup.

87
In this setup as seen in Figure 4.31, the cathode current (Iground) is equal to the
sum of the keeper current (Ikeeper) and the discharge current (Id). In this configuration,
total neutralization of the ion beam leaving the thruster is achieved. The cathode
electrons satisfy Equation 4.1. The efficiency of the floating setup will be assessed with
the formula in Section 4.3.1.3 using the cathode to ground voltage.
Figure 4.32. Hall thruster voltage schematic.
4.3.1.2. Voltage distribution. The voltages and the corresponding currents are sketched
in Figure 4.32. This figure is important in explaining the results of the experiments
which are conducted with two different setups.
The cathode electrons are emitted towards the anode (Iec) and the beam (Ieb).
Electron-neutral collisions create the beam ions (Iib). The voltages are explained at the
beginning of the thesis, in Section 1.2. In the grounded setup, cathode voltage (Vcg)
is zero; therefore, anode voltage (Va) is equal to the discharge voltage and read from
the power source. In the floating setup, cathode voltage (Vcg) is not zero, therefore
the potential difference that is generated by the power source is the discharge voltage
which is equal to the difference between the anode voltage (Va) and cathode voltage
(Vcg).

88
4.3.1.3. Calculating efficiency from cathode to ground voltage. For this setup, the dis-
charge current is equal to the cathode current.
Id = Icathode (4.10)
Also, the cathode electrons ionize the neutrals Iec and neutralize the beam ions, Ieb, as
in Equation 4.1.
The voltage that accelerates the ions is calculated as the difference between the
applied anode voltage and the cathode coupling voltage as in Figure 4.32.
Vb = Vd − Vc (4.11)
Thrust is defined as:
T = mvavg (4.12)
where m is the ionized propellant mass flow rate and vavg is the average axial exit
velocity of ions given by:
vavg = a
√2e(Vd − Vc)
mi
(4.13)
where mi represents ion mass, a is a constant coming from the divergence losses calcu-
lated with the divergence half angle, cos(θ), and e is the electron charge [29]. Argon
ions are assumed to be only singly ionized.
Thruster efficiency is calculated as in Equation 4.9 by calculating the mass flow
rate of the ionized gas from the beam current:
ηT =a2em(Vd − Vc)
mi(IdVd + Pmagnet + Pcathode)(4.14)
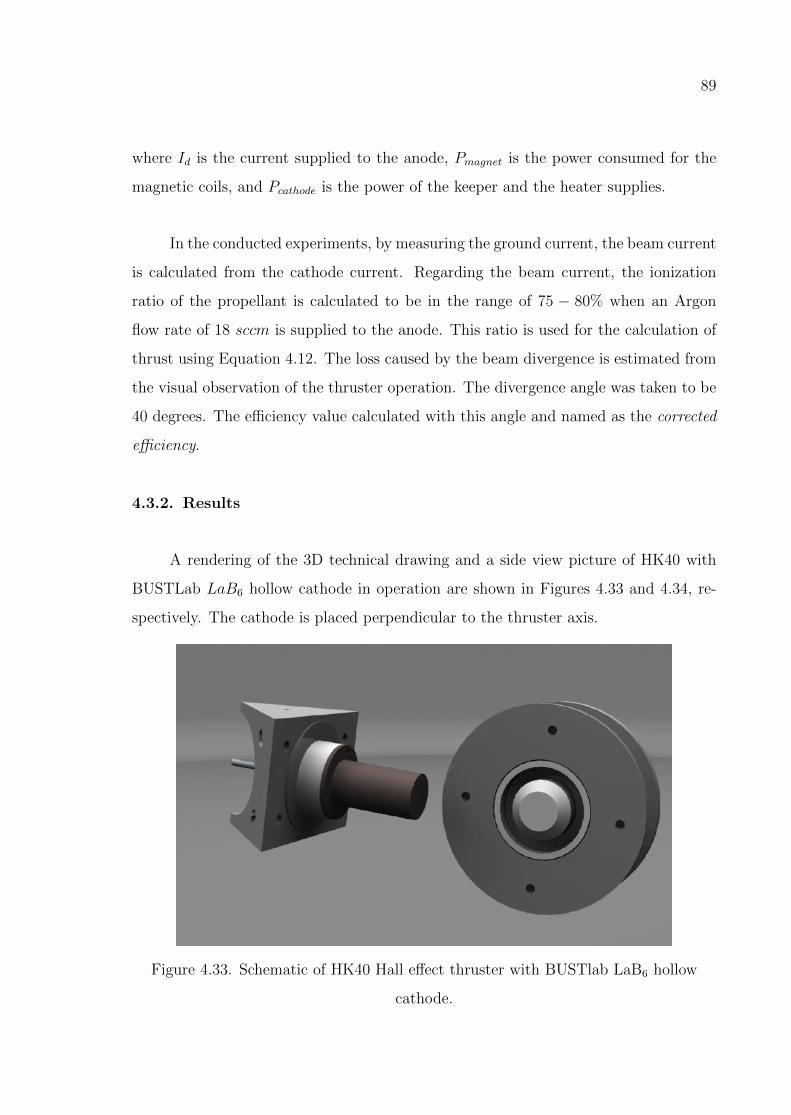
89
where Id is the current supplied to the anode, Pmagnet is the power consumed for the
magnetic coils, and Pcathode is the power of the keeper and the heater supplies.
In the conducted experiments, by measuring the ground current, the beam current
is calculated from the cathode current. Regarding the beam current, the ionization
ratio of the propellant is calculated to be in the range of 75 − 80% when an Argon
flow rate of 18 sccm is supplied to the anode. This ratio is used for the calculation of
thrust using Equation 4.12. The loss caused by the beam divergence is estimated from
the visual observation of the thruster operation. The divergence angle was taken to be
40 degrees. The efficiency value calculated with this angle and named as the corrected
efficiency.
4.3.2. Results
A rendering of the 3D technical drawing and a side view picture of HK40 with
BUSTLab LaB6 hollow cathode in operation are shown in Figures 4.33 and 4.34, re-
spectively. The cathode is placed perpendicular to the thruster axis.
Figure 4.33. Schematic of HK40 Hall effect thruster with BUSTlab LaB6 hollow
cathode.

90
Figure 4.34. HK40 Hall effect thruster with BUSTlab LaB6 hollow cathode.
The tests have been conducted with two different setups as mentioned earlier.
The data points were selected considering the separatrix surfaces. For the grounded
setup, as the cathode is moved away from the thruster radially, the cathode current
decreases sharply after the separatrix. The reason for that could be the increased
resistance (Rc) created by the magnetic field lines in front of the cathode. When the
discharge current is constant at 1.2 A, the ionization in the discharge chamber should
be higher if the cathode is outside the separatrix to satisfy the condition in Equation
4.3. In Figure 4.35, at point j, plasma potential is measured by the Langmuir probe
to be 43 V with less electron supplied from the cathode, while the potential is 23 V at
point h. However, the anode voltage increases as the cathode is moved from point h to
point j due to the resistance caused by the presence of the magnetic field. The increase
in the anode voltage is larger than the increase in the plasma potential. Therefore,
the beam voltage is higher at point j relative to point h. The other points inside the
separatrix have close values for the cathode current and the plasma potential.
For the floating setup where the negative leads of all the supplies are connected
at a common floating ground, the cathode is moved radially and axially by considering
the separatrix surfaces as shown in Figure 4.36. For the radial movement of the cath-

91
Figure 4.35. a) Test points with respect to separatrix surfaces (inner coil = 1.7 A,
outer coils = 2 A) b) Changes in electron current and plasma potential at specified
points (inner coil = 1.7 A, outer coils = 2 A).
Figure 4.36. a) Test points with respect to separatrix surfaces (inner coil = 1 A,
outer coils = 1.2 A) b) Cathode to ground voltage, Vcg, and plasma potential, Vp, at
specified points (inner coil = 1 A, outer coils = 1.2 A).
ode, the cathode to ground voltage values show a linear variation. As the cathode is
located closer to the discharge channel, the cathode to ground voltage (Vcg) is smaller
in magnitude.

92
As the cathode is moved axially from point 7 to point 12, plasma and cathode to
ground voltages are investigated. Points 7, 8 and 9 have the same Vp and Vcg values,
hence it was observed that cathode position does not affect the plume plasma, but
different discharge voltages are measured at these positions. For points from 7 to 12,
the cathode is placed almost inside the plume. Therefore, Rc is small, thus changing
the cathode position affects Rb. In order to attract the same amount of the discharge
current, the anode voltage becomes higher to overcome the resistance caused by the
magnetic field, Rb. It can be claimed that both the radial distance and the axial
distance of the cathode directly affect the discharge voltage.
Figure 4.37. a) Efficiency and thrust values at specified points (inner coil = 1.7 A,
outer coils = 2 A) b) Thrust and efficiency at specified points (inner coil = 1 A, outer
coils = 1.2 A).
Thrust and efficiency values of the tests are compared in Figure 4.37 for the two
different setups discussed earlier. For the grounded setup tests, thrust and efficiency
values are calculated with Equations 4.8 and 4.9. The point j has the highest thrust and
efficiency values, with less cathode current and higher beam current. For the floating
setup, Equations 4.12 and 4.14 are used. Evaluated values for points 4 and 15 show
jumps in the set of data. These two points are almost on the separatrix surfaces as
can be seen in Figure 4.36. Similarly point 10 and 11 also show values that are outside
of the expected trend lines, but the reason for this observation is not clear. Apart

93
from these observations of points where small deviations were observed, the calculated
thrust values are very close to each other and are within 12.1 to 12.4 mN range. The
efficiency values show variations with respect to the cathode position. The efficiency
is lower for cases where the cathode is located outside of the separatrix as in the cases
of points 1 and 18. Point 9 seems to be the optimum cathode location for both thrust
and efficiency.
Magnetic field topology shapes the equipotential surfaces from the anode to the
cathode. High Hall parameter which increases in the high magnetic field region causes
the increase of the beam resistance (Rb) in the high magnetic field region of the dis-
charge chamber (the acceleration region), thus the voltage drop between the anode
and cathode voltages is concentrated in the acceleration region. The trapped electrons
cause a decrease in voltages by helping the ions to move towards the exit. The elec-
trons expelled from the cathode are just a starter for the ionization process. For Hall
thrusters, ionization cost is the main loss mechanism because to accelerate the ions
the propellant should be ionized efficiently first. Then, the ions are accelerated by
Lorentz Force that is created by the electric field resulting from the voltage drop in the
acceleration region.
For the constant discharge current of 1.2 A and the anode propellant mass flow
rate of 18 sccm as in our system, less cathode current means more efficient system,
because the beam current constructed by the ions is the difference between the cathode
(electron) current and the discharge current (Equation 4.3). The thrust depends on
the voltage difference between the anode and the plasma formed between the anode
and the cathode. The cathode electrons play a role in reducing the plasma potential
causing the acceleration of the ions falling from the anode voltage. Therefore, the
cathode should continue emitting electrons to keep the plasma potential at a desired
level.
For the case of the grounded setup, the cathode emits less electrons when placed
outside the separatrix. The cathode potential is near zero as could be seen from Figu-

94
re 4.20. The cathode current is relatively independent of the discharge current. There-
fore, the cathode current is dominated by the magnetic field and the location of the
separatrix. For this setup, the tank walls and the cathode are at potentials very close
to the ground potential. An electron beam towards the tank is not observed. All the
electrons expelled from the cathode flow towards the thruster. This is the reason why
the grounded setup is useful for eliminating the effects of the tank and for observing
the cathode operation.
The floating setup is an example of the space operation. However, the tank
walls affect the electron pathways during the experiments. The cathode current should
be equal to the discharge current. Therefore, the cathode emits the same amount of
electrons regardless of the magnetic field separatrix and the position of the cathode.
However, as the cathode is moved away from the thruster, the cathode coupling voltage
becomes large in magnitude and the electron density inside should be larger. Electrons
continue to collide with neutrals inside the cathode creating more electrons and provide
self-heating. This condition is also a loss mechanism as the electrons get hotter inside
the cathode. For this setup, since the cathode voltage and the ground voltage are
different, electrons exiting from the keeper follow different paths with respect to the
separatrix surface as observed during experiments. Although the same amount of
electrons are expelled, some of them go to the tank walls. When the cathode is moved
outside of the separatrix surfaces, Rc increases and the cathode and plasma voltages
arrange themselves to a new value. As in Figure 4.31, Vcg becomes more negative and Vp
becomes larger to supply the same Id with the increased resistance. When the cathode
has higher negative voltage, the chamber walls attract more electrons. However, in
space, Rtb and Rtc resistances do not exist.
In a study conducted by Frieman et al., the authors claim that separatrix has no
effect on the cathode coupling voltage [55]. The authors propose that due to the loss of
magnetization in regions away from the thruster, electron current collection pathways
towards the thruster body and the facility walls change. For the region very close to
the thruster exit, the path is the thruster body while for the regions away from the

95
thruster, the path is towards the walls. Because of the recombination pathways, it
is suggested that on ground and in space operations are different. However, the mea-
sured thrust and the discharge current do not change significantly by moving cathode
in their study. It is asserted that the cathode placement does not change ionization
process inside the discharge channel [55]. However, Sommerville claims that separatrix
has an effect on the cathode coupling voltage and efficiency [22]. According to our
results, for the floating setup which represents the space application, the cathode to
ground voltage is not affected by the separatrix but the cathode to ground voltage is a
linear function of the radial distance from the thruster center axis irrespective of which
side of the separatrix surface the cathode is located.

96
5. CONCLUSION
In this thesis, the relation between Hall thruster operation and the magnetic
topology of the thruster have been investigated. The cathode is moved considering
the separatrix surfaces to observe the changes in the coupling voltage. Two different
electrical circuit configurations have been constructed to observe the operation of the
thruster and the cathode. Before conducting the study of interest, the optimum opera-
tional conditions for thruster and cathode have been determined by conducting various
tests.
HK40 Hall effect thruster is an SPT type electromagnetic thruster and its mag-
netic circuit design is accomplished by AISI 1018 steel rings and permanent magnets or
electromagnets. At the beginning of the research, the magnetic field topology of HK40
with SmCo permanent magnets has been studied. A Hall probe is used to measure the
field and the values have been compared with the results obtained using COMSOL.
The field strength was not adjustable with permanent magnets, so they are replaced
with electromagnets. The probe measurements have been conducted to determine the
optimum coil currents considering the magnetic field strength inside the thruster chan-
nel and the separatrix region. Inside the channel, magnetic topology is investigated to
create radial magnetic field lines to increase resistance, Rb, for electrons magnetized
along the lines. While deciding on the magnetic topology, electron pathways have
been also taken into account because they are responsible for the electron current to
the anode, and thus the ionization of the propellant. After stable cathode operation
is achieved, HK40 and BUSTLab hollow cathode have been operated to observe the
effects of the cathode placement and the separatrix surfaces.
BUSTLab hollow cathode utilizes a LaB6 insert material as an emitter. It pro-
vides electrons to the discharge channel by thermionic emission at temperatures above
1500 K. The thermal model of the cathode can provide an illustration of the heat
distribution through the cathode parts. Theoretical concepts have been given in the

97
relevant sections of the thesis to provide insights about the operation of the cath-
ode. To investigate the current extraction from the cathode, the parameters such as
the mass flow rate of the propellant and the keeper voltage that affect the cathode
current have been varied. Virtual anode setup provided valuable information on the
cathode characteristics.
For the various tests, the plume plasma potential has been measured with a
Langmuir probe which is a flat disc collecting charges based on its bias voltage. In
some of the experiments conducted inside the vacuum chamber, a 2D translational
stage is used to move the cathode. In order to demonstrate the electrical circuit of the
thruster-cathode system, appropriate schematics are created and the corresponding
resistances are defined. First, the ground current which corresponds to the cathode
electron current is measured for a grounded setup. For this setup (in Figure 4.2.2.3),
the magnetic field of the thruster has been changed by varying the coil currents, and
thrust and efficiency values have been calculated.
Next, the cathode position effects on the thruster operation is investigated. For
this purpose, for the mentioned setups the discharge characteristics, the plume plasma
potential to determine the acceleration voltage, the cathode to ground voltage to calcu-
late thruster efficiency for the floating setup, and the cathode current to calculate the
thruster efficiency for the grounded setup are observed. While changing the location
of the cathode, the separatrix surfaces, determined from the verified magnetic model,
are investigated. The first setup is called grounded setup to define that the cathode
is at ground level and all the supplies are grounded separately. The second setup is a
floating setup, meaning all the parts in the system are connected to a common point.
These two setups are compared in terms of their discharge and plasma properties inside
and outside the separatrix surfaces.
In the first setup, the cathode current is measured to determine the optimum
location of the cathode. It is observed that the magnetic field sepratrix has an effect
on the cathode operation according to evaluated thrust and efficiency values.

98
In the second setup where a floating ground is used, the cathode potential is below
the ground potential. It is observed that in this wiring configuration, as the cathode
location is changed, the cathode current remains constant while the cathode to ground
voltage changes. The increase in the cathode to ground voltage, Vcg, is explained by
using an electrical circuit analogy. For the floating setup, the separatrix has no effect
on thruster operation; however, vacuum tank, which is at the ground potential, attracts
part of the electrons exiting the cathode. For this setup, the cathode should be placed
inside the separatrix surfaces.
Since efficiency calculations are done using different cathode characteristics, there
could be some discrepancies in the presented comparisons. Especially, predicting the
beam current without complete neutralization of the ion beam for the grounded setup,
and the uncertainty in beam divergence angle for the floating setup can result in an
over-estimation of the calculated thrust and efficiency values. Considering the obtained
results, the floating setup provides higher thrust and efficiency values. The floating
setup would also better correspond to an in-space operation of the thruster cathode
system. Also, the optimum magnetic coil currents, thus the magnetic field strengths
and topology, are different for the two setups. According to the results, the floating
setup provides a more efficient operation condition for HK40 as this setup requires less
power for the coils. We show that the influence of the external magnetic field strength
on the thruster efficiency can be predicted from the electron current coming from the
cathode emitter surface. It is also shown that the cathode to ground voltage provides
a way to estimate the efficiency with respect to the cathode placement.
5.1. Future Work
This study shows that there is a relation between the separatrix surfaces and
the setup constructed to test the operation conditions. During the experiments, the
thruster body was not separated from the tank, so it was always at ground potential.
However, if we consider the space operation, the body should be connected to a com-
mon floating ground. It is observed that the electrons flow towards the tank wall which
99
is at ground potential since the cathode voltage is below the ground. Also, some
fraction of the electrons can flow directly to the thruster body without causing any
ionization. Therefore, tank effects preventing the simulation of space conditions should
be eliminated while conducting tests.
Recently a retarding potential analyzer (RPA) probe has been built at BUST-
Lab. The study presented in this thesis can be expanded by measuring the ion energy
distribution for the HK40 thruster cathode system. After the measurements, the beam
ion current would be predicted, and thrust and efficiency values obtained in the pre-
vious tests would be validated. Apart from these, the main improvement that can be
attempted is re-designing the thruster by elongating the channel and modifying the
magnetic circuit accordingly.
100
REFERENCES
1. NASA, “The Propulsion Systems”, http://dawn.jpl.nasa.gov/mission/
images/CR-1845.gif, accessed at December 2016.
2. Brophy, J. R., “Ion Thruster Performance Model”, Ph.D. Thesis, Colorado State
University, Fort Collins, Colorado, USA, 1984.
3. Tsay, M., “Two-Dimensional Numerical Modeling of Radio-Frequency Ion Engine
Discharge”, Ph.D. Thesis, Massachusetts Institute of Technology, Cambridge, MA,
USA, 2010.
4. Kuninaka, H. and K. Nishiyama, “Development of 20cm Diameter Microwave Dis-
charge Ion Engine µ20”, 39th Joint Propulsion Conference, Huntsville, AL, USA,
July 2003, AIAA-2003-5011.
5. Mazouffre, S., “Electric Propulsion for Satellites and Spacecraft: Established Tech-
nologies and Novel Approaches”, Plasma Sources Science and Technology , Vol. 25,
No. 3, p. 033002, 2016.
6. Conversano, R. W., D. M. Goebel, R. R. Hofer, T. S. Matlock and R. E. Wirz,
“Magnetically Shielded Miniature Hall Thruster: Development and Initial Test-
ing”, 33rd International Electric Propulsion Conference, Washington, DC, USA,
October 2013, IEPC-2013-201.
7. Ahedo, E. and J. Gallardo, “Low Power Hall Thrusters: Physics, Technical Limi-
tations and Design”, Micropropulsion Workshop, Lerici, Italy, May 2002.
8. Hutchinson, I. H., Principles of Plasma Diagnostics , Cambridge University Press,
Cambridge, UK, 1990.
9. LakeShore Cryotronics, “Transverse Probes”, http://www.lakeshore.com/

101
products/hall-probes/transverse-probes/pages/Overview.aspx, accessed
at December 2016.
10. Kim, V., “Main Physical Features and Processes Determining the Performance of
Stationary Plasma Thrusters”, Journal of Propulsion and Power , Vol. 14, No. 5,
pp. 736–743, 1998.
11. Courtney, D. G., “Development and Characterization of a Diverging Cusped Field
Thruster and a Lanthanum Hexaboride Hollow Cathode”, M.S. Thesis, Mas-
sachusetts Institute of Technology, Cambridge, MA, USA, May 2008.
12. Goebel, D., R. Watkins and K. K. Jameson, “LaB6 Hollow Cathodes for Ion and
Hall Thrusters”, Journal of Propulsion and Power , Vol. 23, No. 3, pp. 552–558,
2007.
13. Ozturk, A. E., O. Korkmaz and M. Celik, “Design and Analysis of Different In-
sert Region Heaters of a Lanthanum Hexaboride Hollow Cathode During Initial
Heating”, Space Propulsion Conference, Cologne, Germany, May 2014, SP2014-
2980902.
14. Lieberman, M. A. and A. J. Lichtenberg, Principles of Plasma Discharges and
Materials Processing , John Wiley and Sons, Inc., 2005.
15. Goebel, D. M. and I. Katz, Fundamentals of Electric Propulsion: Hall Thrusters ,
JPL Space Science and Technology Series, New York, USA, 2008.
16. Piel, A. and M. Brown, Plasma Physics: An Introduction to Laboratory, Space,
and Fusion Plasmas , 2010.
17. Fantz, U., “Plasma Diagnostics of Ion Sources”, CERN Accelerator School, Senec,
Slovakia, 29th May – 8th June 2012.
18. NASA, “Konstantin E. Tsiolkovsky”, https://www.nasa.gov/audience/

102
foreducators/rocketry/home/konstantin-tsiolkovsky.html#.V_92mOCLTZY,
accessed at December 2016.
19. Kosmodemyansky, A. and X. Danko, Konstantin Tsiolkovsky: His Life and Work ,
The Minerva Group, Inc., 2000.
20. Martinez-Sanchez, M. and J. E. Pollard, “Spacecraft Electric Propulsion-An
Overview”, Journal of Propulsion and Power , Vol. 14, No. 5, pp. 688–699, 1998.
21. Choueiri, E. Y., “A Critical History of Electric Propulsion: The First 50 Years
(1906-1956)”, Journal of Propulsion and Power , Vol. 20, No. 2, pp. 193–203, 2004.
22. Sommerville, J. D., “Hall-Effect Thruster–Cathode Coupling: The Effect of Cath-
ode Position and Magnetic Field Topology”, Ph.D. Thesis, Michigan Technological
University, Houghton, MI, USA, 2009.
23. Yavuz, B., E. Turkoz and M. Celik, “Prototype Design and Manufacturing Method
of an 8 cm Diameter RF Ion Thruster”, 6th International Conference on Recent
Advances in Space Technologies (RAST), Istanbul, Turkey, June 2013.
24. Hofer, R. R. and D. Jacobson, “Development and Characterization of High-
Efficiency, High-Specific Impulse Xenon Hall Thrusters”, NASA/CR—2004-
213099, USA, 2004.
25. Tilley, D. L., K. H. de Grys and R. M. Myers, “Hall Thruster-Cathode Coupling”,
35th Joint Propulsion Conference, Los Angeles, CA, USA, June 1999, AIAA-1999-
2865.
26. Kugelberg, J., P. Bodin, S. Persson and P. Rathsman, “Accommodating Electric
Propulsion on SMART-1”, Acta Astronautica, Vol. 55, No. 2, pp. 121 – 130, 2004.
27. Charles, C., “Plasmas for Spacecraft Propulsion”, Journal of Physics D: Applied
Physics , Vol. 42, No. 16, p. 163001, 2009.

103
28. Lerner, E. J., “Plasma Propulsion in Space”, The Industrial Physicist , Vol. 6,
No. 5, pp. 16–19, 2000.
29. Sommerville, J. D. and L. B. King, “Effect of Cathode Position on Hall-Effect
Thruster Performance and Cathode Coupling Voltage”, 43rd Joint Propulsion Con-
ference, Cincinnati, OH, USA, July 2007, AIAA-2007-5174.
30. Bechtel, R. T., “A Hollow Cathode Neutralizer for a 30-cm Diameter Bombardment
Thruster”, NASA TM X-68291, USA, 1973.
31. Nishiyama, K., S. Hosoda, H. Kuninaka and Y. Toyoda, “Operational Character-
istics of a Microwave Discharge Neutralizer for the ECR Ion Thruster µ20”, 31st
International Electric Propulsion Conference, Ann Arbor, MI, USA, September
2009, IEPC-2009-21.
32. Albarede, L., V. Lago, P. Lasgorceix, M. Dudeck, A. Burgova and K. Malik, “In-
teraction of a Hollow Cathode Stream with a Hall Thruster”, 28th International
Electric Propulsion Conference, Toulouse, France, March 2003, IEPC-2003-333.
33. Manzella, D. H., D. Jacobson and R. S. Jankovsky, “High Voltage SPT Perfor-
mance”, NASA TM-2001-211135, USA, 2001.
34. Manzella, D., R. Jankovsky and R. Hofer, “Laboratory Model 50 kW Hall
Thruster”, 38th Joint Propulsion Conference, Indianapolis, IN, USA, July 2002,
AIAA-2002-3676.
35. Taccogna, F., P. Minelli, D. Bruno and N. Oudini, “Hall-Effect Thruster Virtual
Lab”, 5th International Conference on Space Propulsion, Rome, Italy, May 2016.
36. Litvak, A. A. and N. J. Fisch, “Resistive Instabilities in Hall Current Plasma
Discharge”, Physics of Plasmas , Vol. 8, No. 2, pp. 648–651, 2001.
37. Kaganovich, I., Y. Raitses, D. Sydorenko and A. Smolyakov, “Kinetic Effects in a

104
Hall Thruster Discharge”, Physics of Plasmas , Vol. 14, No. 5, p. 057104, 2007.
38. Xu, K. G. and M. L. Walker, “Effect of External Cathode Azimuthal Position on
Hall-Effect Thruster Plume and Diagnostics”, Journal of Propulsion and Power ,
Vol. 30, No. 2, pp. 506–513, 2014.
39. Morozov, A. I., Y. Esipchuck, A. M. Kapulkin, V. A. Nevrovskii and V. A. Smirnov,
“Effect of the Magnetic Field on a Closed Electron Drift Accelerator”, Sov. Phys.
Tech. Phys., Vol. 17, p. 482, 1972.
40. Chen, F. F., Introduction to Plasma Physics and Controlled Fusion, Plenum Press,
New York, USA, 1984.
41. Fossum, E. C. and L. B. King, “Design and Construction of an Electron Trap for
Studying Cross-Field Mobility in Hall Thrusters”, 43rd Joint Propulsion Confer-
ence, Cincinnati, OH, USA, July 2007, AIAA-2007-5207.
42. Petit, J. P., “Cancellation of the Velikhov Instability by Magnetic Confinement”,
8th International Conference on MHD Electrical Power Generation, Moscow,
USSR, September 1983.
43. Kim, V., V. Kozlov, A. Lazurenko, G. Popov, A. Skrylnikov, C. Clauss, M. Day
and J. Sancovic, “Development and Characterization of Small SPT”, Cleveland,
OH, USA, July 1998.
44. Haas, J. M., “Low-Perturbation Interrogation of the Internal and Near-Field
Plasma Structure of a Hall Thruster Using a High-Speed Probe Positioning Sys-
tem”, Ph.D. Thesis, The University of Michigan, Ann Arbor, MI, USA, 2001.
45. Guerrini, G., C. Michaut, M. Dudeck, A. Vesselovzorov and M. Bacal, “Character-
ization of Plasma Inside the SPT-50 Channel by Electrostatic Probes”, Proceedings
of the 25th International Electric Propulsion Conference, 1997.

105
46. Guerrini, G., C. Michaut, M. Dudeck and M. Bacal, “Parameter Analysis of Three
Ion Thrusters (SPT-20, SPT-50 and A-3)”, European Spacecraft Propulsion Con-
ference, 1997.
47. LakeShore Cryotronics, “Specifications”, http://www.lakeshore.com/products/
hall-probes/transverse-probes/pages/Specifications.aspx, accessed at
December 2016.
48. Neamen, D. A., Semiconductor Physics and Devices , McGraw-Hill Higher Educa-
tion, 2003.
49. Prewett, P. and J. Allen, “The Double Sheath Associated with a Hot Cathode”,
Proceedings of the Royal Society of London A: Mathematical, Physical and Engi-
neering Sciences , Vol. 348, pp. 435–446, The Royal Society, 1976.
50. Mandell, M. and I. Katz, “Theory of Hollow Cathode Operation in Spot and
Plume Modes”, 30th Joint Propulsion Conference, Indianapolis, IN, USA, June
1994, AIAA-94-3134.
51. Korkmaz, O., “Global Numerical Model for the Evaluation of the Geometry and
Operation Condition Effects on Hollow Cathode Insert and Orifice Region Plas-
mas”, M.S. Thesis, Bogazici University, Istanbul, Turkey, February 2015.
52. Goebel, D. M., K. Jameson, I. Katz and I. Mikellides, “Plasma Potential Behavior
and Plume Mode Transitions in Hollow Cathode Discharges”, 30th International
Electric Propulsion Conference, Florence, Italy, September 2007, IEPC-2007-277.
53. Satir, M., “Design, Manufacturing And Testing Of Plasma Diagnostics Probes In
Electric Propulsion: Retarding Potential Analyzer And Langmuir Probe”, M.S.
Thesis, Bogazici University, Istanbul, Turkey, (in preparation).
54. Jameson, K. K., D. M. Goebel, R. R. Hofer and R. M. Watkins, “Cathode Coupling
in Hall Thrusters”, 30th International Electric Propulsion Conference, Florence,

106
Italy, September 2007, IEPC-2007-278.
55. Frieman, J. D., J. A. Walker, M. L. Walker, V. Khayms and D. Q. King, “Electri-
cal Facility Effects on Hall Thruster Cathode Coupling: Performance and Plume
Properties”, Journal of Propulsion and Power , Vol. 32, No. 1, pp. 251–264, 2015.
56. Alexander Fridman, L. A. K., Plasma Physics and Engineering, Second Edition,
CRC Press, 2011.
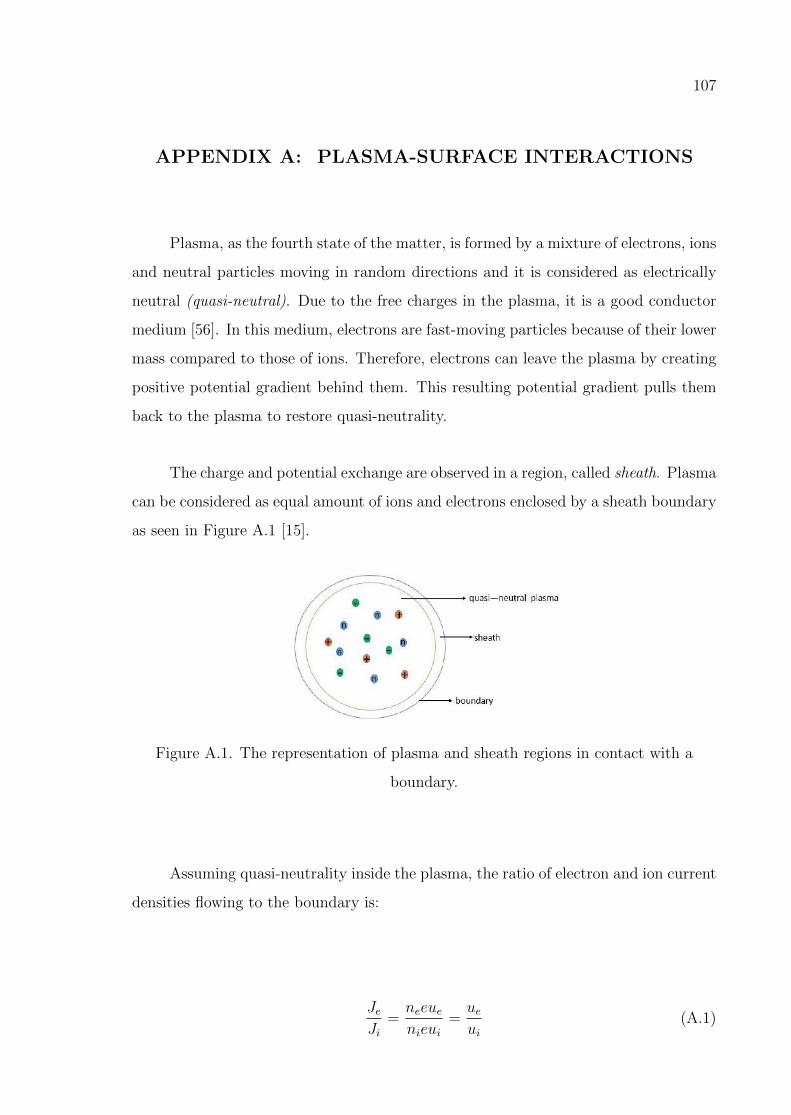
107
APPENDIX A: PLASMA-SURFACE INTERACTIONS
Plasma, as the fourth state of the matter, is formed by a mixture of electrons, ions
and neutral particles moving in random directions and it is considered as electrically
neutral (quasi-neutral). Due to the free charges in the plasma, it is a good conductor
medium [56]. In this medium, electrons are fast-moving particles because of their lower
mass compared to those of ions. Therefore, electrons can leave the plasma by creating
positive potential gradient behind them. This resulting potential gradient pulls them
back to the plasma to restore quasi-neutrality.
The charge and potential exchange are observed in a region, called sheath. Plasma
can be considered as equal amount of ions and electrons enclosed by a sheath boundary
as seen in Figure A.1 [15].
Figure A.1. The representation of plasma and sheath regions in contact with a
boundary.
Assuming quasi-neutrality inside the plasma, the ratio of electron and ion current
densities flowing to the boundary is:
JeJi
=neeuenieui
=ueui
(A.1)

108
where n’s are particle densities and u’s are velocities. Writing energy conservation
equation to obtain the particle velocities:
1
2meu
2e =
kTee
1
2miu
2i =
kTie
(A.2)
where Te is electron temperature and Ti is ion temperature.
Thus, the ratio of the current density is as in Equation A.3:
JeJi
=ueui
=
√miTemeTi
(A.3)
A.1. Collisionless Sheath Assumption
Collisions in a plasma cause the ionization of neutral atoms, diffusion, the particle
mobility, and resistivity. The collisions could be either elastic or inelastic and the
probability of occurrence depends on the effective cross sectional area, Across. Within
a slice, the number of neutral atoms are:
N = naAslicedx (A.4)
where na is the stationary neutral atom density, Aslice is the area of the slice, and dx
is the thickness of the thin slice. The fraction of area filled with atoms assumed as
spheres [15]:
naAsliceAcrossdx
Aslice= naAcrossdx (A.5)

109
Defining Γ0 as the incident flux of particles, the flux flowing without making any
collisions in the slice area becomes:
Γ(x) = Γ0(1− naAcrossdx) (A.6)
The change in flux is calculated as:
dΓ
dx= −ΓnaAcross (A.7)
Solving the equation above for Γ:
Γ(x) = Γ0exp(−naAcrossx) = Γ0exp(−x
λ) (A.8)
where λ is the mean free path that represents the distance for electrons or ions to travel
in a stationary density of neutral particles before making a collision [15]:
λ =1
naAcross(A.9)
If λ is higher than the length scale of the interest, plasma is accepted as collisionless
which means that the long range electromagnetic forces dominate over the collisional
forces. The properties of this kind of plasma sheaths are:
(1) Thermal electron velocity shows Maxwellian distribution.
(2) Temperature of ions is considered as zero.
(3) At the plasma-sheath interface, the densities of electrons and ions are equal [14].
Ion velocity is defined to be us and the potential is taken to be zero at the sheath
boundary. Considering collisionless plasma, ion energy conservation is written as:
1
2miu
2i (x) =
1
2miu
2s − eΦ(x) (A.10)

110
The continuity equation for ions in the sheath is:
ni(x)ui(x) = nisus (A.11)
where nis is the ion density at the sheath boundary. Figure A.2 shows the parameters
for the quasi-neutral plasma and the sheath. Using equations A.10 and A.11:
Figure A.2. The potential and density changes in the sheath region [14].
ni = nis(1−2eΦ
miu2s
)−1/2 (A.12)
Regarding the Boltzmann relation, electron density is defined as:
ne(x) = neseeΦ(x)/kTe (A.13)
Poisson’s equation is:
d2Φ
dx2=
e
ε0
(ne − ni) (A.14)
At the sheath boundary, nes = nis = ns is valid. Putting ni and ne into Poisson’s

111
equation:
d2Φ
dx2=ensε0
[exp
eΦ
kTe−(
1− Φ
Φs
)−1/2](A.15)
where eΦs = 12miu
2s is the initial ion energy and Φs is the potential of the sheath [14].
A.1.1. Bohm Sheath Criterion
Ions enter the sheath region with a velocity higher than the acoustic velocity [40].
Ion velocity, ui, is zero at the center of discharge plasma due to the symmetry and it
increases towards the walls. To obtain ion velocity, Equation A.17 should be solved
after the integration of Equation A.16. Equation A.16 is obtained by multiplying
Equation A.15 with dΦ/dx and integrating over x from 0 to Φ:
∫ Φ
0
dΦ
dx
d
dx
(dΦ
dx
)dx =
ensε0
∫ Φ
0
dΦ
dx
[exp
eΦ
kTe−(
1− Φ
Φs
)−1/2]dx (A.16)
1
2
(dΦ
dx
)2
=ensε0
[Teexp
eΦ
kTe− Te + 2Φs
(1− Φ
Φs
)1/2
− 2Φs
](A.17)
When the boundary conditions are written at x = 0 as Φ = 0 and dΦ/dx = 0, the
potential distribution over x is obtained as could be seen in Figure A.2. However, the
right hand side of Equation A.17 should be positive because of the square on the left
side. This means that ion density is higher than electron density in the sheath region.
To solve the equation, second order Taylor expansion is applied to the electron
and ion density equations [15]:
ni = ns
√Φs
Φs − Φ= ns
(1− 1
2
Φ
Φs
+ ...
)(A.18)

112
ne = nsexpeΦ
kTe= ns
(1− eΦ
kTe+ ...
)(A.19)
The inequality is obtained as:
1
2
Φ2
Te− 1
4
Φ2
Φs
> 0 (A.20)
Equation A.20 is satisfied for Φs > Te/2 in the collisionless sheath. Then substituting
Φs:
us > uB =
(kTemi
)1/2
(A.21)
Equation A.21 is called Bohm Sheath Criterion where uB is Bohm velocity. From
Equation A.21, it is seen that for us < uB, the condition satisfies quasi-neutral bulk
plasma solution. As ions move towards the walls, ion velocity approaches Bohm velocity
and then enters the collisionless sheath at the boundary when us = uB [14].
A.1.2. Presheath
The region, which is located between the plasma and the sheath and includes
equal numbers of ions and electrons, is called as presheath region. In presheath region,
Bohm sheath criterion will be discussed while interpreting the potential distribution
and Bohm current. Taylor expansion is used for the exponential term to solve Equation
A.19 and A.18 [15]:
Poisson’s equation becomes:
d2Φ
dx2=en0Φ
ε0
[1
2Φs
− e
kTe
](A.22)
where n0 is the density in the bulk plasma.

113
The similar argument used in obtaining Equation A.20 is applied to Equation A.22:
1
2Φs
>e
kTe(A.23)
Φs >kTe2e
(A.24)
Ions should enter the presheath region with at least a velocity of us to show the stable
sheath characteristics as discussed in Section A.1.1. For this ion velocity, the corre-
sponding potential difference is Te/2.
In the presheath region, electron density is lower in comparison to the center of
the discharge plasma and there are equal number of electrons to those of ions which
are accelerated towards the walls as seen in Figure A.2. The potential at the sheath
edge is −kTe/2e. Electron density becomes:
ne = n0exp
[(e
kTe
)(−kTe
2e
)]= 0.61n0 (A.25)
Ion current density;
Ji = 0.61n0eui ≈1
2npse
√kTemi
(A.26)
where nps represents the plasma density at the start of presheath region and it is
considered as the center of collisionless plasma or one collision mean free path from
the edge of the sheath for the collisional plasma. Approximation to 1/2 was made by
Bohm as a convention [15]. By defining A as the ion collection area at the boundary
of the sheath, Bohm current is written:
Ii =1
2npse
√kTemi
A (A.27)
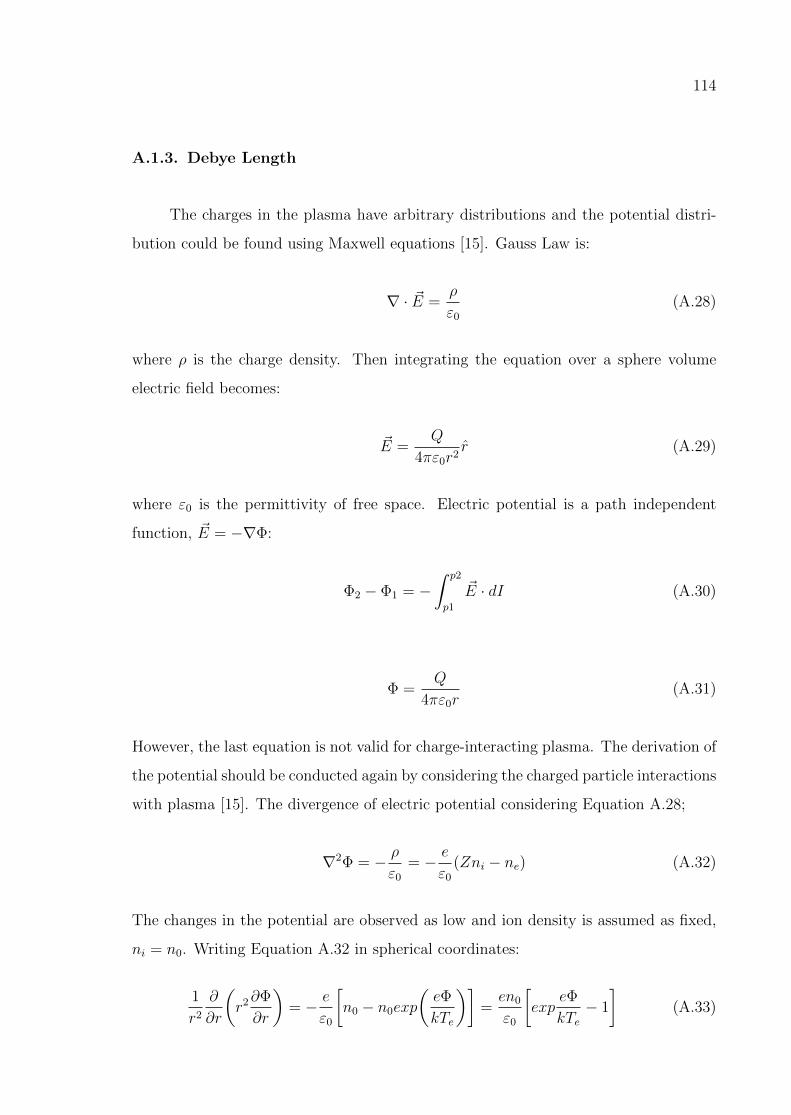
114
A.1.3. Debye Length
The charges in the plasma have arbitrary distributions and the potential distri-
bution could be found using Maxwell equations [15]. Gauss Law is:
∇ · ~E =ρ
ε0
(A.28)
where ρ is the charge density. Then integrating the equation over a sphere volume
electric field becomes:
~E =Q
4πε0r2r (A.29)
where ε0 is the permittivity of free space. Electric potential is a path independent
function, ~E = −∇Φ:
Φ2 − Φ1 = −∫ p2
p1
~E · dI (A.30)
Φ =Q
4πε0r(A.31)
However, the last equation is not valid for charge-interacting plasma. The derivation of
the potential should be conducted again by considering the charged particle interactions
with plasma [15]. The divergence of electric potential considering Equation A.28;
∇2Φ = − ρ
ε0
= − e
ε0
(Zni − ne) (A.32)
The changes in the potential are observed as low and ion density is assumed as fixed,
ni = n0. Writing Equation A.32 in spherical coordinates:
1
r2
∂
∂r
(r2∂Φ
∂r
)= − e
ε0
[n0 − n0exp
(eΦ
kTe
)]=en0
ε0
[exp
eΦ
kTe− 1
](A.33)

115
where ne is written from the Boltzmann relation. As mentioned before, the potential
change is very small compared to the electron temperature (eΦ << kTe) and this
feature allows us to introduce the simplified solution using only the first term of Taylor
series [15]:
1
r2
∂
∂r
(r2∂Φ
∂r
)=en0
ε0
[eΦ
kTe+
1
2
(eΦ
kTe
)2
+ ...
](A.34)
Solving Equation A.34 to obtain the potential function:
Φ =e
4πε0rexp
(− r/√
ε0kTen0e2
)(A.35)
Then, Debye Length could be defined as:
λd =
√ε0kTen0e2
(A.36)
The potential could be written in the form of Debye Length:
Φ =e
4πε0rexp
(− r
λd
)(A.37)
This potential distribution is also observed on grids and probes which interact with
plasma. A few Debye length is considered to be the thickness of the sheath around an
object [15].
A.1.4. Child-Langmuir Law
Child-Langmuir Law states that current per unit area passing through a planar
sheath is limited due to space charge effects. In this case, the sheath formation is
observed when the potential is much higher than the electron temperature, Φ >>
kTe/e. The sheath thickness is large enough to repel all electrons from the sheath
for this case. Because of this nature, electron density goes to zero and electron space

116
charge effects are not observed [15]. Ion current density becomes:
Ji = nieui = nie
√2e
mi
[Φs − Φ]1/2 (A.38)
Without electron density contribution, Poisson’s equation becomes:
d2Φ
dx2= −eni
ε0
= −Jiε0
(mi
2e(Φs − Φ)
)1/2
(A.39)
Multiplying both sides with dΦ/dx:
dΦ
dx
d2Φ
dx2= −dΦ
dx
Jiε0
(mi
2e(Φs − Φ)
)1/2
(A.40)
Applying the derivation identity which is stated in Equation A.41 to the equation
above, then integrating with respect to x:
2df
dx
(d2f
dx2
)=
d
dx
(df
dx
)2
(A.41)
1
2
[(dΦ
dx
)2
−(dΦ
dx
)2
x=0
]=
2Jiε0
[mi(Φs − Φ)
2e
]1/2
(A.42)
Assuming dΦ/dx is zero at x=0 as in Figure A.2:
dΦ
dx= 2
(Jiε0
)1/2[mi(Φs − Φ)
2e
]1/4
(A.43)
Then, defining the potential difference as V and the sheath thickness as d and inte-
grating and taking the square of Equation A.43:
Ji =4ε0
9
(2e
mi
)1/2V 3/2
d2(A.44)

117
For an ion thruster design, d is the gap between the grids [15]. Therefore, the ion
current which can be extracted from an ion thruster is limited.
A.1.5. Double Sheath
The sheaths with different potentials are in contact inside the thermionic cathodes
and around the grids. Ion and electron currents flow in opposite directions inside the
sheath regions. This formation is called as double sheath or double layer [15]. As an
illustrative example, Figure A.3 shows that electrons flow from zero potential on the
left and ions flow from Φs on the right. Local space charge effects are important at
Figure A.3. Schematic of the double layer potential distribution [15].
the sheath boundaries; therefore, the curved potential distribution is observed at the
boundaries which differs from the linear vacuum solution as in Figure A.3. Also, local
electric field is lower at both boundaries because the change in potential decreases. On
the contrary, the change in potential inside of the double layer is higher than vacuum.
At the sheath edge, both velocities are assumed to be zero and then the particles are
accelerated in opposite directions in the double layer [15].
For electrons:
1
2meu
2e = eΦ (A.45)

118
ue =
(2eΦ
me
)1/2
(A.46)
For ions:
1
2miu
2i = e(Φs − Φ) (A.47)
ui =
(2e(Φs − Φ)
mi
)1/2
(A.48)
Total charge density is:
ρ = ρi + ρe =Jiui− Jeue
=Ji√
Φs − Φ
√mi
2e− Je√
Φ
√me
2e(A.49)
Writing Poisson’s equation in one dimension:
dE
dx=
ρ
ε0
=Ji
ε0
√Φs − Φ
√mi
2e− Je
ε0
√Φ
√me
2e(A.50)
Using the mathematical relation:
2df
dx
(d2f
dx2
)=
d
dx
(df
dx
)2
(A.51)
Integrating equation A.50 from 0 to x by considering the identity introduced in Equa-
tion A.51:
ε0
2E2 = 2Ji
√mi
2e
[Φ1/2s − (Φs − Φ)1/2
]− 2Je
√me
2eΦ1/2 (A.52)
Electric field becomes zero on the right edge of the plasma, Φ = Φs. Putting those into
Equation A.52:
Je =
√mi
me
Ji (A.53)

119
This condition is called as Langmuir condition and stands for the space charge limited
flow of ions and electrons between two interacting plasmas [15]. If the ratio of the
temperature of electrons to the temperature of ions is considered, a constant κ should
be added to the equation. It changes from 0.8 to 0.2 while Te/Ti varies from 2 to 20.
For a typical thruster, κ is 0.5 approximately [15].
Je = κ
√mi
me
Ji (A.54)
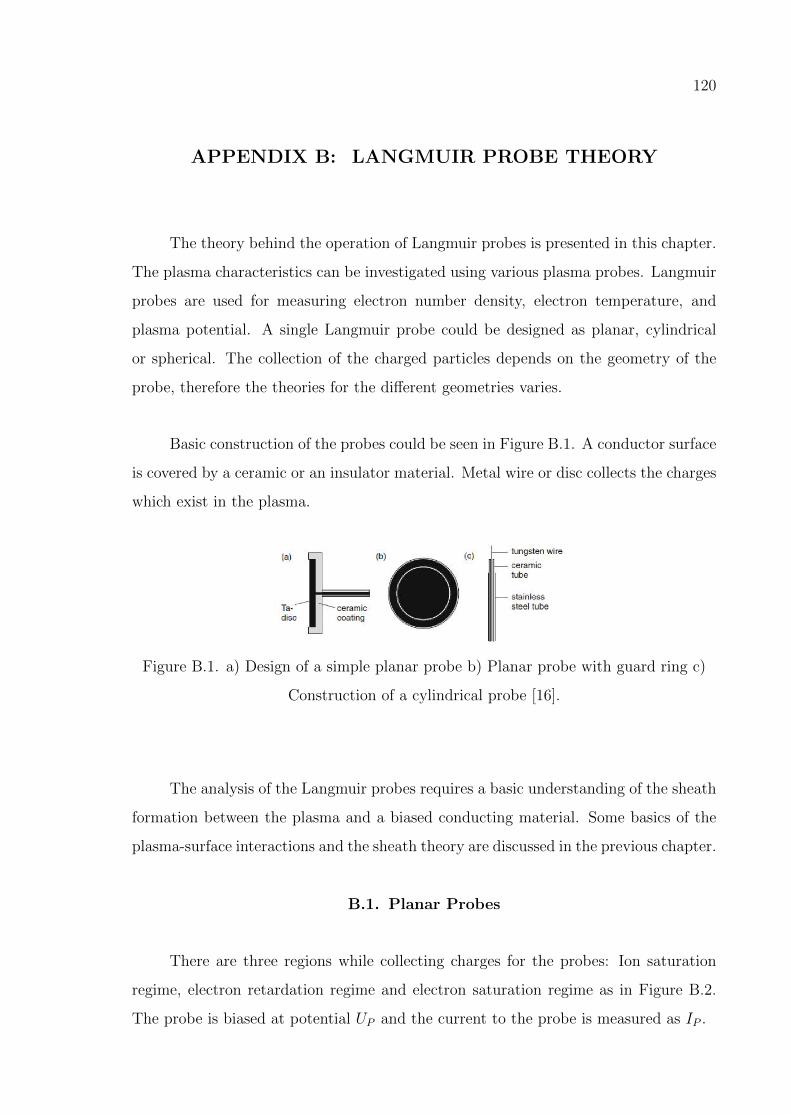
120
APPENDIX B: LANGMUIR PROBE THEORY
The theory behind the operation of Langmuir probes is presented in this chapter.
The plasma characteristics can be investigated using various plasma probes. Langmuir
probes are used for measuring electron number density, electron temperature, and
plasma potential. A single Langmuir probe could be designed as planar, cylindrical
or spherical. The collection of the charged particles depends on the geometry of the
probe, therefore the theories for the different geometries varies.
Basic construction of the probes could be seen in Figure B.1. A conductor surface
is covered by a ceramic or an insulator material. Metal wire or disc collects the charges
which exist in the plasma.
Figure B.1. a) Design of a simple planar probe b) Planar probe with guard ring c)
Construction of a cylindrical probe [16].
The analysis of the Langmuir probes requires a basic understanding of the sheath
formation between the plasma and a biased conducting material. Some basics of the
plasma-surface interactions and the sheath theory are discussed in the previous chapter.
B.1. Planar Probes
There are three regions while collecting charges for the probes: Ion saturation
regime, electron retardation regime and electron saturation regime as in Figure B.2.
The probe is biased at potential UP and the current to the probe is measured as IP .

121
While the probe is negatively biased, electrons cannot reach the probe and ion sat-
uration current can be measured. Electron saturation region shows the same behavior
with ions for the positively biased case. In electron retardation region, there are en-
ergetic electrons that can pass the potential barrier and reach the probe. Plasma
potential Φp is found at the inflection point as in the figure.
Figure B.2. I: ion saturation regime II: electron retardation regime III: electron
saturation regime.
B.1.1. Ion Saturation Current
Considering Bohm Sheath Criterion for the ion current, ion saturation current for
the probe surface area, A, is calculated as in Equation A.26. Ion density in unperturbed
plasma, ni0, could be found with known electron temperature.
Ii,sat = 0.61ni0euBA = 0.61ni0e
√kTemi
A (B.1)

122
B.1.2. Electron Saturation Current
Electron saturation current is measured when the probe voltage exceeds the
plasma potential. At the plasma potential, there is no sheath formation for electrons.
Because of this, all the electrons can reach the probe with different velocities. Ions in
the discharge plasma enter the sheath region as monoenergetic by gaining energy in
the presheath region [16].
The perpendicular velocity of the electrons should be considered, u⊥ = uecosθ,
while electrons are entering in an angular range.
dnene0
=2πsinθdθ
4π(B.2)
Electron velocities are thermally distributed; therefore, the mean thermal velocity is
introduced, uth,e. Electron saturation current is calculated by considering uth,e at half
range.
Ie,sat = −Ae∫uth,ecosθdne = −1
2Aene0uth,e
∫ π/2
0
cosθsinθdθ (B.3)
Ie,sat = −1
4Aene0uth,e = −1
4Aene0
√8
π
kTeme
(B.4)
The ion and electron saturation currents are compared as:
|Ie,sat|Ii,sat
=0.25
0.61
√8
π
mi
e= 0.65
√mi
me
(B.5)
As an example, in an argon plasma, the electron saturation current is 177 times that
of the ion saturation current [16].
123
B.1.3. Electron Retardation Current
The electron retardation current is calculated similarly to determine the electron
density in a plasma (see Equation A.13). U is the potential variable and U −Φp = Up
[16].
Ie(U) = Ie,satexp(e(U − Φp)
kTe) (B.6)
This current could also be obtained by subtracting the ion saturation current from the
probe current in the retardation region where Φp is the plasma potential. If the change
in electron current with respect to the probe bias voltage is plotted on logarithmic base,
the slope of the straight line becomes e(kTe)−1. Electron temperature is determined
from this relation:
ln
(|Ie(U)|mA
)= ln
(|Ie,sat|mA
)+e(U − Φp)
kTe(B.7)
B.1.4. Floating Potential
As considered in the sheath formation section, electron mobility is higher and the
mass of electron is much smaller. It causes the plasma boundary walls to become more
negative compared to the plasma potential. This condition is valid for the surface of
the planar probes. The negative charges reaching the probe attract ions to the probe.
As a result, the electron and the ion currents become equal. Assuming IP = 0 and
putting Equation B.4 into Equation B.6 without considering the area:
Je =1
4ne0uth,eexp(eUp/kTe) (B.8)

124
Total electric current drawn from the probe is calculated considering Bohm formula
for ion current:
Ip = n0eAp
(Temi
)1/2[1
2
(2mi
πme
)1/2
exp
(eUpkTe
)− AsApexp
(− 1
2
)](B.9)
where As is the area of the sheath surface.
The floating potential Φf is obtained by setting Ip = 0 where As/Ap is considered
as in Equation B.23 and taken as unity for planar probes [8]:
eΦf
kTe=
1
2
[ln
(2πme
mi
)− 1
](B.10)
B.2. Cylindrical Probes
Cylindrical probes are constructed with a thin wire which is insulated electrically.
The difference between the planar and the cylindrical probes stems from a short ex-
tension of the wire collecting charges. Because of this, the cylindrical probes attract
the charges as they rotate in an orbit instead directly passing a thin sheath as seen in
planar probes.
The similar saturation regions are observed in cylindrical probe, however electron
and ion saturation regimes show an increase with the applied voltage. The probe po-
tential is the same as the floating piece of tungsten or molybdenum wire in the plasma.
Electron temperature is found as in Equation B.7. The process should be started by
finding a current function showing changes with respect to the potential as in Equation
B.19. Then, ion saturation current can be considered in the Φp − Up > 5kTe/e region
to ensure the ion collection region while probe potential is highly negative with respect
to the plasma potential [16]. As described before, the plasma potential is obtained at
the inflection point, d2Ip/dU2p = 0.

125
Electron current, Ie(Up), is shown in log plot as in Figure B.3. The relation
between the logarithm of the electron retardation current and the probe bias voltage
is linear. Electron temperature is calculated using Equation B.6.
Figure B.3. log-lin plot of the (negative) electron current vs. probe voltage shows
that a Maxwellian results in a straight line, which can be used to determine the
electron temperature [16].
With the known electron temperature, electron density is calculated as:
ne =I(Φp)
rpIpe
√me
2πkTe(B.11)
where Φp is the plasma potential, rp is the radius of the probe and Ip is the probe
current [17].
B.2.1. Orbital Motion about Cylindrical Probe
If a sphere or a thin wire with a diameter of a is constructed as a negative-
biased probe, ions are pulled around the probe as an orbital motion and this causes
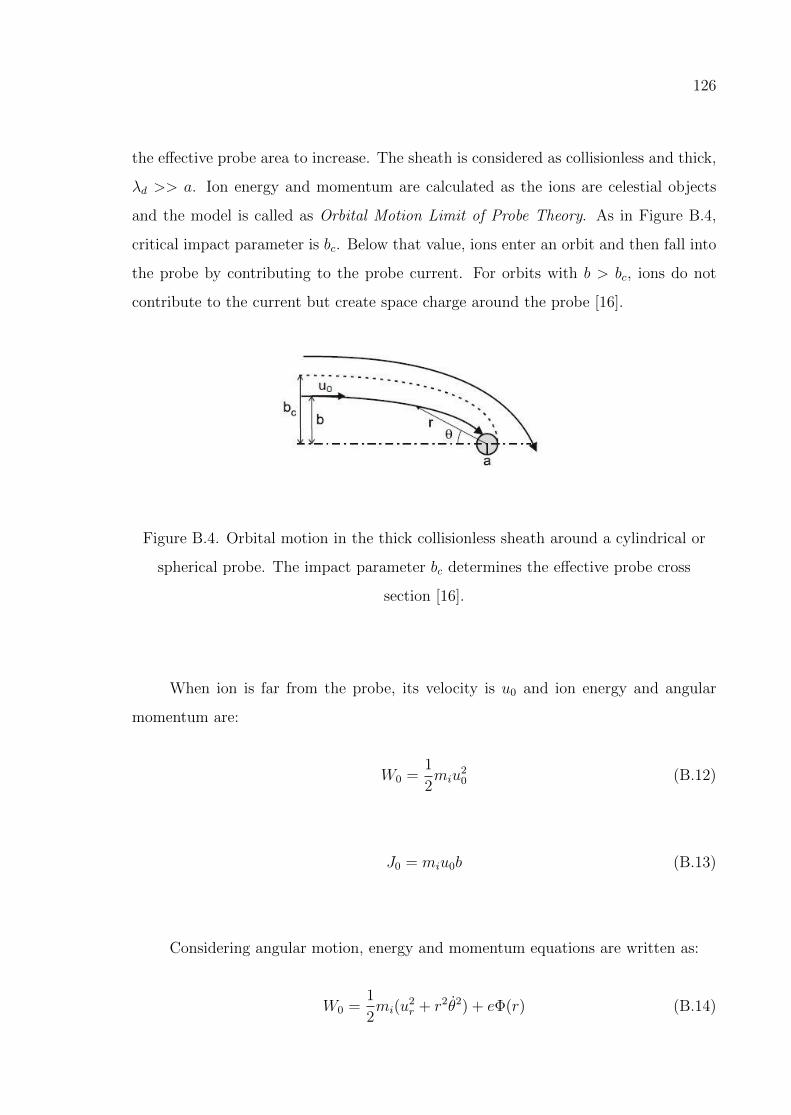
126
the effective probe area to increase. The sheath is considered as collisionless and thick,
λd >> a. Ion energy and momentum are calculated as the ions are celestial objects
and the model is called as Orbital Motion Limit of Probe Theory. As in Figure B.4,
critical impact parameter is bc. Below that value, ions enter an orbit and then fall into
the probe by contributing to the probe current. For orbits with b > bc, ions do not
contribute to the current but create space charge around the probe [16].
Figure B.4. Orbital motion in the thick collisionless sheath around a cylindrical or
spherical probe. The impact parameter bc determines the effective probe cross
section [16].
When ion is far from the probe, its velocity is u0 and ion energy and angular
momentum are:
W0 =1
2miu
20 (B.12)
J0 = miu0b (B.13)
Considering angular motion, energy and momentum equations are written as:
W0 =1
2mi(u
2r + r2θ2) + eΦ(r) (B.14)

127
W0 =1
2miu
2r +
J20
2mir2+ eΦ(r) (B.15)
where J0 = mir2θ.
Then, considering Equation B.12 and putting B.13 to obtain an equation for
radial motion:
W0 =1
2miu
2r +W0
b2
r2+ eΦ(r) (B.16)
For the critical impact parameter, ur = 0 at r = a:
b = r
[1− eΦ(r)
W0
− miu2r
2W0
]1/2
(B.17)
bc = a
[1− eΦ(a)
W0
]1/2
(B.18)
Since the potential has negative value to attract ions, bc becomes greater than
a according to Equation B.18. It is concluded that the effective probe area is greater
than the geometrical cross sectional area of the probe.
For a cylindrical probe, bc/a is called as Orbital Motion Limit factor and ion
current of cylindrical probe should be calculated by considering this factor. To obtain
electron and ion currents, W0 ≈ kTe and W0 ≈ kTi are used respectively. Electron
saturation current is determined at the plasma potential.
Je,cyl(U) = Je,sat
(1 +
eU
kTe
)1/2
(B.19)

128
Because of the thick sheath assumption, sheath edge is considered at infinity with
λd →∞. Therefore, all the domains are taken as sheath region. Orbital motion limit
model is extended through in the order of ion mean free path. While considering ion
current, orbital motion approach requires ion temperature in contrast to Bohm current
including electron temperature. But the approach is considered to be valid because
the collisions with neutral gas cause a decrease in energy from Bohm energy to ion
temperature. As a characteristic of orbital motion, ion current collected in the probe
increases with applied probe voltage [16].
B.3. Interpretation of the Probe Characteristics
Determination of the sheath thickness is essential before choosing appropriate
solution method. The solution is started with Equation A.43 by taking square of the
equation [8]. Φ is the potential variable.
(dΦ
dx
)2
=2Jiε0
(2mie)1/2[(−Φ)− (−Φs)]
1/2 (B.20)
Integrating the above equation:
[√
(−Φ)−√
(−Φs)]1/2[√
(−Φ) + 2√
(−Φs)] =3
4
[8J2
imie
ε20
]1/4
(xs − x) (B.21)
where xs represents the position of the sheath edge. To obtain the sheath thickness,
Ji should be determined as Bohm current density as in Equation A.26. Omitting the
presheath region, Φ should be equal to the probe potential, Up. Arranging the equation:
xsλd
=2
3
[2
exp(−1)
]1/4[(−eUpTe
)1/2
− 1√2
]1/2[(−eUpTe
)1/2
+√
2
](B.22)
If a thin sheath is observed surrounding the probe, planar probe solution is valid.
The particles, whose potential energy is greater than the difference between the probe
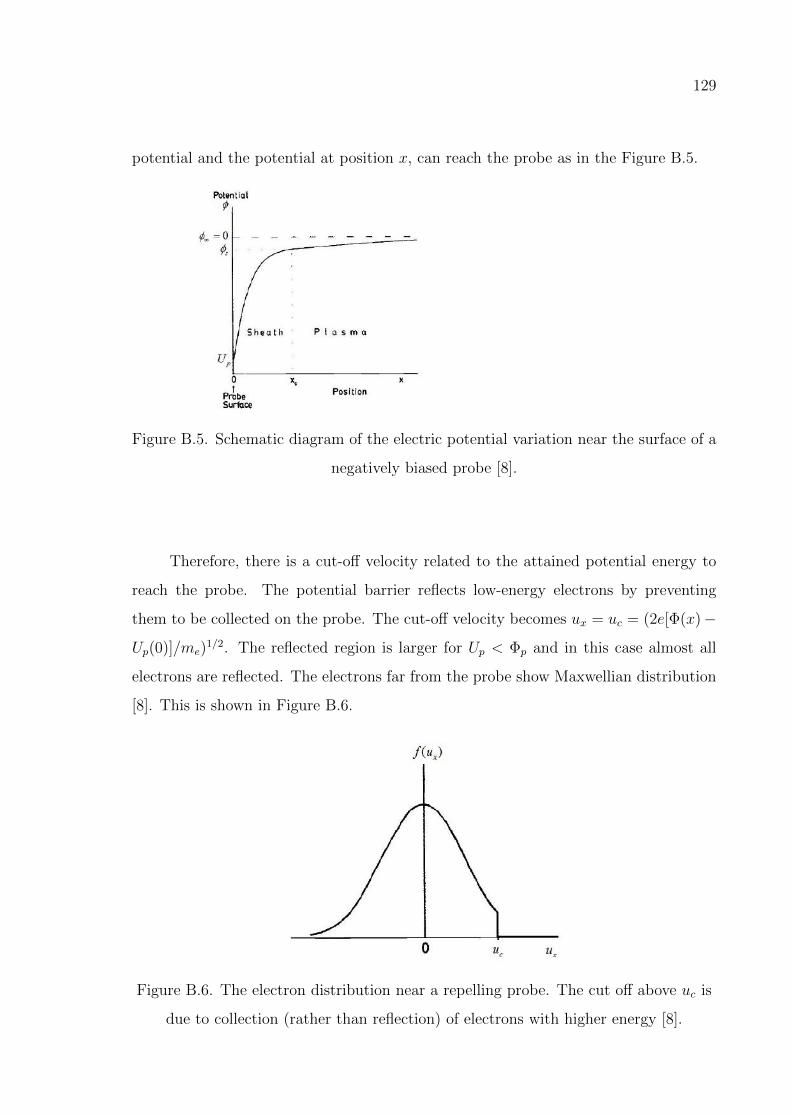
129
potential and the potential at position x, can reach the probe as in the Figure B.5.
Figure B.5. Schematic diagram of the electric potential variation near the surface of a
negatively biased probe [8].
Therefore, there is a cut-off velocity related to the attained potential energy to
reach the probe. The potential barrier reflects low-energy electrons by preventing
them to be collected on the probe. The cut-off velocity becomes ux = uc = (2e[Φ(x)−
Up(0)]/me)1/2. The reflected region is larger for Up < Φp and in this case almost all
electrons are reflected. The electrons far from the probe show Maxwellian distribution
[8]. This is shown in Figure B.6.
Figure B.6. The electron distribution near a repelling probe. The cut off above uc is
due to collection (rather than reflection) of electrons with higher energy [8].

130
While considering overall solution, the region which has almost quasineutral dis-
tribution and the region in which the electron density is considerably smaller than the
ion density should both be satisfied. The condition could be achieved if λd is much less
than a, and also xs. xs is taken as a few λd in general. To make that assumption, the
geometry is assumed to be planar and the area A is taken as constant, As = Ap [8].
Equation B.22 proves the thin sheath assumption with a few Debye length thick-
ness. From the equation, 23[2/exp(−1)]1/4 is equal to 1.02 [8]. If the probe potential is
taken as close to the floating potential, then the probe is negative enough to repel all
particles with an order of√
(me/mi) of electrons, as in Equation A.53. This means
that eUp/Te is approximately 12ln(me/mi). Then xs becomes ∼ 3.75λd for Hydrogen
and the sheath thickness is ∼ 4λd at the floating potential. Thus, the equation gives a
result close to the real value.
Figure B.7. Characteristics of cylindrical (C), spherical (S) and planar probes
(P) [17].
If the sheath thickness is large enough to assume the sheath as thick, then orbital
motion limit is valid. The characteristics of the current collection show differences for
planar and cylindrical types. For a cylindrical probe, As is calculated in terms of xs.

131
Then, As could be used for getting ion current from Bohm formula.
As ≈ Ap
(1 +
xsa
)(B.23)
The comparison between planar, cylindrical and spherical probes are shown in
Figure B.7. In theory, the planar probes collects electrons as seen in the figure; however,
in the experimental data as in Figure B.2, which is drawn by using MATLAB, the
saturation currents increase slightly. The cylindrical and the spherical probes continue
to collect charges because of the orbital motion as in Figure B.7.
B.4. Magnetic Field Effects on Probes
Langmuir probe measurements could be affected by the strength and the topology
of the magnetic field. The effects are discussed in this section.
Magnetic field forces electrons and ions to move in helical orbits with a radius
called Larmor radius, r = mu/eB, rather than in straight lines. The effects of magnetic
field are not observed when r >> a and the probe characteristics are calculated as there
is no magnetic field [8].
The magnetic field affects electrons strongly, so Larmor radius of electrons are
smaller than the radius of ions. As a result, electron saturation current is reduced
due to the trapped electrons. Mostly, re < a is the situation. If the probe is biased
negative enough, the large part of the electrons are reflected. Then, electron density is
calculated as:
ne = n∞exp(eΦ/Te) (B.24)
Here, infinity represents the large distance from the probe. Electron current has an
exponential relation with respect to the probe potential as in without magnetic field
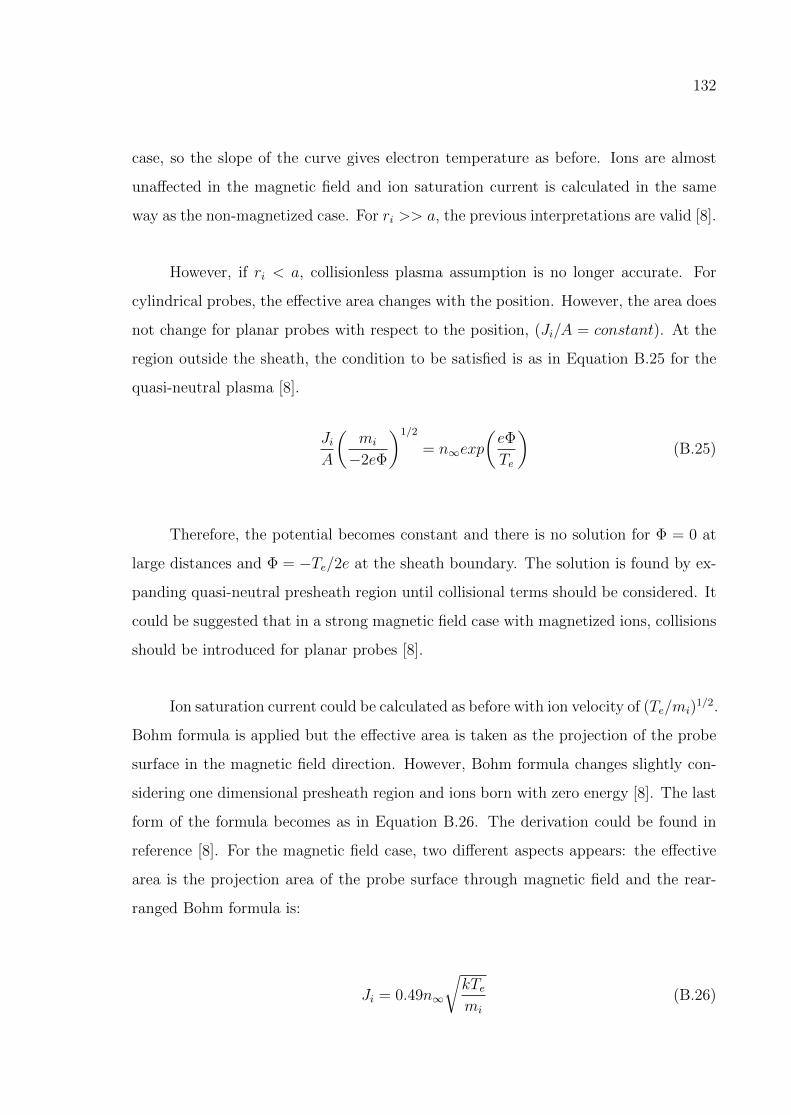
132
case, so the slope of the curve gives electron temperature as before. Ions are almost
unaffected in the magnetic field and ion saturation current is calculated in the same
way as the non-magnetized case. For ri >> a, the previous interpretations are valid [8].
However, if ri < a, collisionless plasma assumption is no longer accurate. For
cylindrical probes, the effective area changes with the position. However, the area does
not change for planar probes with respect to the position, (Ji/A = constant). At the
region outside the sheath, the condition to be satisfied is as in Equation B.25 for the
quasi-neutral plasma [8].
JiA
(mi
−2eΦ
)1/2
= n∞exp
(eΦ
Te
)(B.25)
Therefore, the potential becomes constant and there is no solution for Φ = 0 at
large distances and Φ = −Te/2e at the sheath boundary. The solution is found by ex-
panding quasi-neutral presheath region until collisional terms should be considered. It
could be suggested that in a strong magnetic field case with magnetized ions, collisions
should be introduced for planar probes [8].
Ion saturation current could be calculated as before with ion velocity of (Te/mi)1/2.
Bohm formula is applied but the effective area is taken as the projection of the probe
surface in the magnetic field direction. However, Bohm formula changes slightly con-
sidering one dimensional presheath region and ions born with zero energy [8]. The last
form of the formula becomes as in Equation B.26. The derivation could be found in
reference [8]. For the magnetic field case, two different aspects appears: the effective
area is the projection area of the probe surface through magnetic field and the rear-
ranged Bohm formula is:
Ji = 0.49n∞
√kTemi
(B.26)

133
As in Figure B.8, the sheath is thin but the presheath region expands through the
magnetic field. This long-tube presheath region includes ions created in the region or
crossing the region. Inside the sheat region, quasicollisionless assumption is preferred
because after the presheath region, ions probably reach the probe without making any
collisions.
Figure B.8. Schematic representation of sheath and presheath in a strong magnetic
field [8].
The quasicollisionless assumption in the sheath region should be proved mathe-
matically. The procedure includes ion mean free path, l, and the length of the presheath
region, L. Only if l > L, the assumption is valid [8]. In most plasmas, the ion diffusion
through the presheath tube is achieved by additional cross-field effects that enhance
the ion diffusion. To fix collision contradiction about collisionless assumption, the case
should be handled by considering large l/L ratio and applying collisionless assump-
tion [8].

134
APPENDIX C: BUSTLAB THRUSTER OPERATION
PROCEDURES
Check electrical cables of the cathode and HK40 with a multimeter
Check gas flow cables for the cathode and the thruster
Place the Langmuir probe
Close the vacuum tank
Turn ON mechanic pump and reduce the tank pressure 3x10⁻³ Torr
Open the gate valve for cryogenic pump
Open Argon tank valve and turn on MKS mass flow controller
Turn on the power supplies
Turn ON the cathode
Turn ON the thruster

135
C.1. BUSTLab Hollow Cathode Operation With 0.25 mm Ta heater wire
Set Argon flow rate to 2.2 sccm
Turn ON heater power supply, set heater current to 2 A
Increase heater current to 4.3 A− 41 V gradually
Turn ON keeper power supply, set to 600 V
Observe keeper current to jump to 1.7 A (keeper supply Sorensen DCS 600− 1.7)
Cathode is ON
Reduce heater current to zero
Turn OFF heater power supply

136
C.2. HK40 Operation
Set Argon flow rate in the range 16− 21 sccm (optimum = 18 sccm)
Turn ON anode power supply, set to 400 V
Anode draws current max 1.2 A (current limit for Glassman power supply)
Supply coil currents slowly starting from 0 A
Keep thruster operation stable with magnets

137
APPENDIX D: WINPROLADDER PROGRAM FOR 2D
LINEAR STAGES
Figure D.1. The program to move 2D linear motion stages.

138
APPENDIX E: LABVIEW PROGRAM FOR
GAUSSMETER
Figure E.1. Labview program to measure magnetic flux density.
Figure E.2. Labview interface for the gaussmeter.
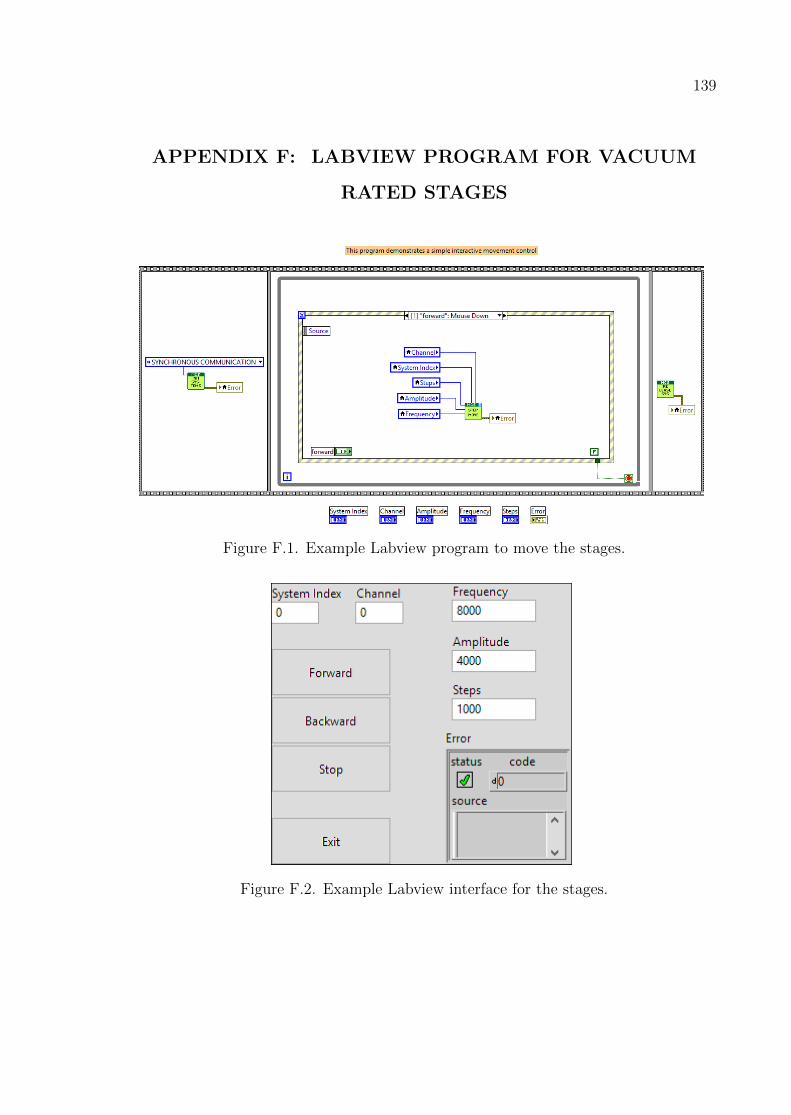
139
APPENDIX F: LABVIEW PROGRAM FOR VACUUM
RATED STAGES
Figure F.1. Example Labview program to move the stages.
Figure F.2. Example Labview interface for the stages.
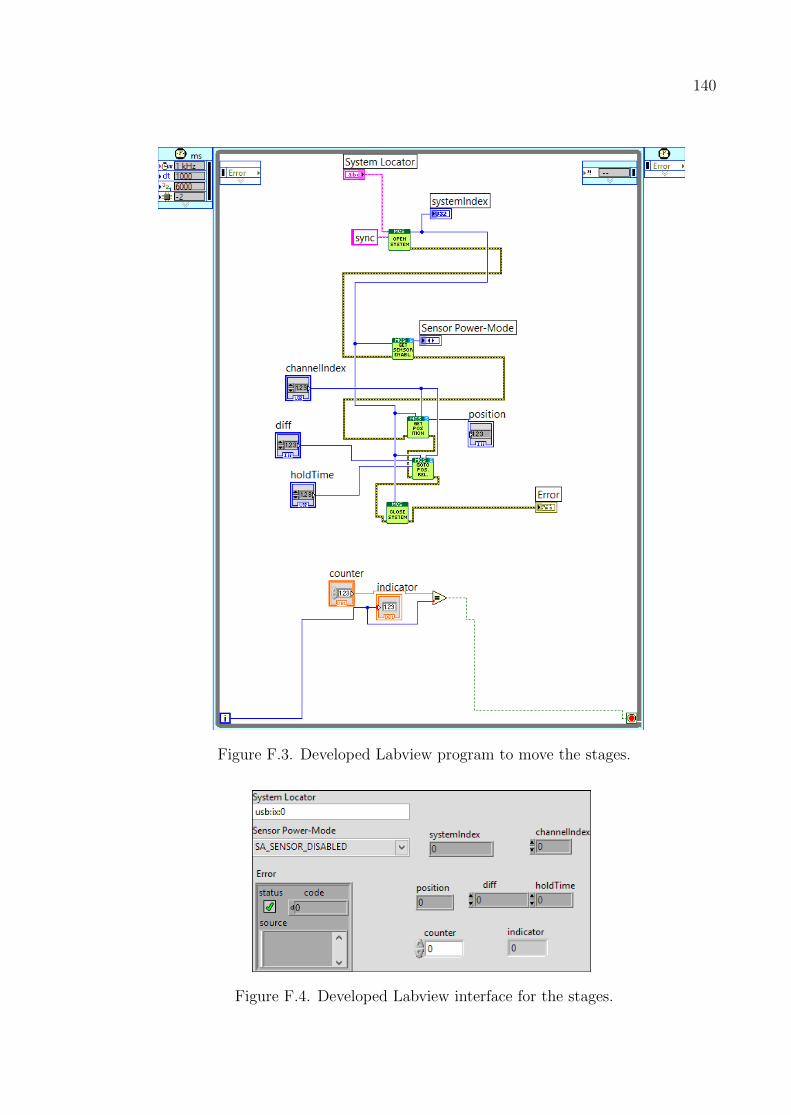
140
Figure F.3. Developed Labview program to move the stages.
Figure F.4. Developed Labview interface for the stages.

141
APPENDIX G: LANGMUIR PROBE INTERFACE
Figure G.1. Langmuir probe I-V interface.


![EXPERIMENTAL, QUASI-EXPERIMENTAL, AND …nur.uobasrah.edu.iq/images/pdffolder/Experimental studies 6.pdf · Experimental Design: Experiments (or randomized controlled trials [RCTs])](https://static.fdocuments.in/doc/165x107/5f4c009b337890199f4ada04/experimental-quasi-experimental-and-nur-studies-6pdf-experimental-design.jpg)