![Automated Autonomous Vehicles: Prospects and …thinking Transportation 2020-2030” [4]. The report claimed that vehicles equipped with gasoline fueled internal combustion engine](https://static.fdocuments.in/doc/165x107/5f206a0c09f2a96278431928/automated-autonomous-vehicles-prospects-and-thinking-transportation-2020-2030a.jpg)
Experimental investigation of the effect of a B70 ... · common rail injection system – equipped...
26
Experimental investigation of the effect of a B70 biodiesel blend on a common rail, passenger car Diesel engine Dimitris Tziourtzioumis, Loucas Demetriades, Olympia Zogou, Tassos Stamatelos LTTE, Mechanical Engineering Department, Univesity of Thessaly Pedion Areos, GR-383 34 Volos ABSTRACT The results of engine bench tests of a 2.0 liter, common rail, high pressure injection passenger car Diesel engine fuelled by B70 biodiesel blend are compared to the respective results of baseline tests with standard EN 590 Diesel fuel. Engine performance and CO, THC and NO x emissions were measured. Also, indicative particulate sampling was made with a simplified, undiluted exhaust sampler. Aim of this study was to better understand how the Engine Control Unit (ECU) responds to the different fuel quality. A series of characteristic operation points for engine testing is selected to better serve this purpose. Data acquisition of the engine ECU variables was made through the INCA software. Also, additional data acquisition based on external sensors was carried out by means of Labview software. Τhe results enhance our understanding of the engine ECU behavior with the B70 biodiesel blend. Also, they are compared to what is known from the related literature for the behavior of common rail Diesel engines with biodiesel blends. NOMENCLATURE A/F Air to Fuel ratio (A/F) st Stoichiometric Air to Fuel ratio bmep Brake mean effective pressure [bar] b sp Fuel delivery per stroke (fuel consumption) [mm 3 /st.] bsfc Brake specific fuel consumption [g/kWh] CA Crank Angle [deg.] ECU Engine Control Unit E str Fuel energy input per stroke [J/st.] FAME Fatty Acid Methyl Ester H u Gross heating value [MJ/kg] m f Fuel mass flow rate [kg/s] mfr Mass flow rate [kg/s] P Engine power [kW] PM Particulate Matter UEGO Universal Exhaust Gas Oxygen (sensor) β Coefficient of volume thermal expansion [K ‐1 ] η th Thermal efficiency [%] λ lambda = (A/F)/(A/F) st [‐] ρ Density [kg/m 3 ] ρ 0 Density at 15 o C [kg/m 3 ]
Transcript of Experimental investigation of the effect of a B70 ... · common rail injection system – equipped...

Experimental investigation of the effect of a B70 biodiesel blend on a common rail, passenger car Diesel engine
Dimitris Tziourtzioumis, Loucas Demetriades, Olympia Zogou, Tassos Stamatelos LTTE, Mechanical Engineering Department, Univesity of Thessaly
Pedion Areos, GR-383 34 Volos
ABSTRACT
The results of engine bench tests of a 2.0 liter, common rail, high pressure injection passenger car Diesel
engine fuelled by B70 biodiesel blend are compared to the respective results of baseline tests with standard EN 590
Diesel fuel. Engine performance and CO, THC and NOx emissions were measured. Also, indicative particulate
sampling was made with a simplified, undiluted exhaust sampler. Aim of this study was to better understand how
the Engine Control Unit (ECU) responds to the different fuel quality. A series of characteristic operation points for
engine testing is selected to better serve this purpose. Data acquisition of the engine ECU variables was made
through the INCA software. Also, additional data acquisition based on external sensors was carried out by means of
Labview software. Τhe results enhance our understanding of the engine ECU behavior with the B70 biodiesel blend.
Also, they are compared to what is known from the related literature for the behavior of common rail Diesel
engines with biodiesel blends.
NOMENCLATURE
A/F Air to Fuel ratio
(A/F)st Stoichiometric Air to Fuel ratio
bmep Brake mean effective pressure [bar]
bsp Fuel delivery per stroke (fuel consumption) [mm3/st.]
bsfc Brake specific fuel consumption [g/kWh]
CA Crank Angle [deg.]
ECU Engine Control Unit
Estr Fuel energy input per stroke [J/st.]
FAME Fatty Acid Methyl Ester
Hu Gross heating value [MJ/kg]
mf Fuel mass flow rate [kg/s]
mfr Mass flow rate [kg/s]
P Engine power [kW]
PM Particulate Matter
UEGO Universal Exhaust Gas Oxygen (sensor)
β Coefficient of volume thermal expansion [K‐1]
ηth Thermal efficiency [%]
λ lambda = (A/F)/(A/F)st [‐]
ρ Density [kg/m3]
ρ0 Density at 15oC [kg/m3]

2
According to the ambitious Vision Paper of the Biofuels Research Advisory Council (1), the European Union
could replace 25% of its transportation fuels by biofuels until 2030. Due to the specific fuel balances existing in the
European Fleet, that make Europe a net exporter of gasoline and importer of Diesel fuel it is estimated that this
target would be most probably realized mainly by biodiesel (75% biodiesel‐vs‐25% bioethanol) (2). In Greece,
biodiesel, in the form of Fatty Acid Methyl Esters (FAME), is produced since 2005 and currently mixed in the Diesel
fuel at about 4% vol., this percentage being slowly but steadily increasing. The production capacity of existing
biodiesel factories in Greece can supply the required quantities to increase the biodiesel blending percentage up to
15%, provided that the necessary vegetable oil and recycled oil quantities should become available and prices be
favorable. According to Greek legislation, at least 30% of the raw material must be domestically produced.
Nowadays, automotive manufacturers allow running of modern diesel powered passenger cars on blends of
biodiesel up to B30, provided that certain additional maintenance measures are taken, including more frequent
fuel and oil filter changes, along with inspection of engine oil level and the fuel lines and injection system
components for possible leaks. In order to ensure customer’s acceptance, standardization and quality assurance
are key factors for the market introduction of biodiesel as transport fuel.
According to a common statement by the diesel fuel injection systems manufacturer’s association (3),
diesel fuel specifications (ΕΝ 590 in Europe, D6751 in the USA), should be regularly updated to allow for the
gradually increasing percentage of biodiesel mixing (currently 5% but soon to be extended to 7%+3%). In this way,
the injection system’s components are to be protected from possible secondary effects of fatty acid methylesters
that include fuel leakage or filter plugging due to the softening, swelling or hardening and cracking of some
elastomers and displacement of deposits from diesel operation, corrosion of aluminium or zinc parts in fuel
injection equipment due to free methanol residues, filter plugging or corrosion of fuel injection equipment due to
residues of FAME process chemicals, corrosion of fuel injection equipment or filter plugging due to hydrolysis of
FAME by free water residues – bacterial growth, filter plugging or injector coking due to corrosion of non‐ferrous
metals by free glycerine residues, filter plugging – lacquer formation by soluble polymers in hot areas due to the
precipitation of deposits, generation of excessive local heat in rotary distributor or supply pumps, due to the high
viscosity of the biodiesel (4). Also, further oxidation stability improvements are considered essential to the increase
of biodiesel blending percentages above 20%. Resistance to oxidative degradation during storage is an increasingly
important issue for biodiesel (5, 6).
The effects of biodiesel blends on the operation, performance and emissions of Diesel engines have been
studied by a vast amount of published and unpublished research work, since 1980 (4, 7, 8). The combustion of
biodiesel in engines equipped with pump–line–nozzle fuel systems normally results in advancement of the start of
injection and combustion, due to differences in chemical and physical properties of the fuels. Unit injector or
common rail injection system – equipped engines do not exhibit the same behavior (9, 10).
As a general trend, combustion of biodiesel blends reduces CO, HC and particulate emissions, both in older
technology and modern diesel engines, depending also on the specific quality of biodiesel employed (11). In
addition to legislated pollutants, biodiesel is known to significantly reduce several unregulated pollutant species.
In this paper, an attempt is made to better understand how the engine ECU operates with a high biodiesel
(FAME) blend in modern common‐rail injection Diesel engines, and thus explain the observed effects on the engine
performance and emissions characteristics. The results are compared to what is reported in the specialized
literature for the specific engine category and high blending rates (12, 13).
The variety of reported trends in the effect of biodiesel fuel blends on Diesel engine combustion can be
mainly attributed to the variety of existing, older and modern fuel injection systems, especially for passenger car
Diesels. Starting from the pre‐chamber and swirl‐chamber engines where the combustion was initiated at rich
blend conditions in the pre‐chamber and continued later in the main chamber, where the partially burned blend
1 Introduction
2 The evolution to the common rail diesel injection systems

3
was injected, equipped with glow plugs for the preheating of the pre‐chamber and rotary type fuel pumps, that
distribute at 130‐150 bar the fuel to the pressure‐operated injectors, with the increased particulate emissions in
transient operation, technology shifted during the nineties to the Direct Injection Diesel engines, with a distributor
pump with increased injection pressure levels (180‐250 bar) and some electronic parts. Thus, the passenger diesel
cars acquired the well known fuel economy, reliability, lower cylinder head thermal loading, lack of preheaters etc,
advantages of the DI engines traditionally employed in trucks and buses. However, they also took their
disadvantages, like the increased noise levels, and the difficulties to attain the increasingly stringent particulate and
NOx emissions standards.
Modern passenger car diesel engines are of the common rail, high pressure direct injection technology. A
rotary pump supplies a common rail with high pressure (1300‐2000 bar) fuel. The injectors are fed by this rail,
controlled by an electric valve, based on ECU signals. These engines are more quiet and more clean as regards
emissions, especially during acceleration, due to the improved control of combustion, by means of dividing
injection in pilot injection, main injection and possibly post‐injection, when necessary for exhaust temperature
increase to induce regeneration of the diesel filter.
Diesel engine emissions are known to be affected by fuel quality, engine operation temperature,
combustion chamber type and technology, fuel injection system technology, engine operation point and operation
conditions. During the last fifteen years, engine exhaust emission standards in Europe, measured according to the
NEDC (New European Driving Cycle), evolved from Euro 1 (1993 – CO < 3.16 g/km, HC+NOx< 1.13 g/km, particulate
< 0.16 g/km) to Euro 4 (2006 ‐ CO < 0.5 g/km, (HC+NOx)< 0.56 g/km, NOx < 0.25 g/km, particulate < 0.025 g/km)
and beyond. Especially the NOx and particulate standards are extremely stringent – the latter require the use of a
particulate filter as standard equipment in modern diesel passenger cars.
Fuel quality standards on the other hand, are gradually diminishing sulfur content (e.g. EN‐590: 1996: 0.05
%, 2005: 50 ppm, 2009:10 ppm). Also, they are generally increasing cetane index and allow the use of additives
assisting emissions reduction.
Injection pressure in common rail systems can be controlled irrespective of engine rpm, and stays constant
during the injection phase. The accurate control of injector opening and closing by the microcomputer, allows for a
wide range of possibilities for tailoring the injection and combustion curve by the engine manufacturer. The
injected fuel quantity can be divided in separate parts, as the pilot injection which reduces engine noise due to self‐
ignition of the initial injected quantity, as well as the NOx formation. This small quantity of fuel (1 ‐ 4 mm3) allows
for a more regular combustion, with a gradual increase of temperature and pressure in the combustion chamber.
The microcomputer control of all injection parameters, based on previously defined maps that are saved in the ECU
memory, allow the optimization of steady state and transient engine operation.
The high pressure pump has been designed to supply significant fuel quantities with respect to the engine
needs. The surplus quantity returns to the tank by means of a leak orifice that is controlled by the pressure
regulator. The pressure regulator controls the rail pressure, based on the engine speed and load. The required
pressure value is computed by the ECU and confirmed based on the information fed back by the rail pressure
sensor. Rail pressure varies between 280 bar (low load) and 1400 bar (high load), or even more, up to 2000 bar
(14).
The injection pressure control loop is based on the determination, by the ECU, based on rpm and load, of
the target value of the injection pressure. This value is fed to the pressure regulator. The actual rail pressure is fed
back to the ECU to complete the control loop. The activation time of the injector solenoid valve varies between 200
‐ 1200 μs.
In contrast with older injection systems, the ECU determines independently the injected fuel quantity and
injection advance. The injected fuel quantity is determined by the ECU, by means of a combination of rail pressure
and injection duration. The regulation of the fuel quantity is based on the estimation by the ECU, based on the
respective sensors’ signals and the rail pressure signal and the respective maps, of the required fuel quantity and
the respective duration of injectors’ current.
4
The rail pressure significantly affects the injected fuel quantity per degree Crank Angle, as well as the
degree of atomization of the fuel. The injector opening duration, the injector needle lift and the number and
diameter of injection orifices are the main factors determining the fuel delivery per stroke.
The engine ECU takes into account the following sensor’s signals:
throttle position
cooling water temperature
fuel temperature
engine speed and crankshaft position
ambient absolute pressure and intake manifold pressure
vehicle speed
activation of braking and clutch decoupling contact
intake air mass flow rate and temperature.
EGR valve position
compressor boost pressure. The ECU takes additionally into account the respective engine operating mode, i.e. engine startup
(additional fuel delivery for startup), engine idle (idle fuel flow rate), normal operation, cold start, acceleration fuel
enrichment etc.
An important sensor for the operation with biodiesel fuel blends is the fuel temperature sensor, normally
of the CTN type, usually placed on the rail or on the fuel return circuit. This sensor’s signal allows the ECU to correct
the injected fuel quantity, to make up for the fuel viscosity decrease with temperature.
Rapeseed biodiesel is in use in Germany since the early eighties. Its use has been progressively increasing
in Europe and North America during the following years. An initial review of the related literature, published by (7),
soon became obsolete. The last decade was marked by an impressive expansion of international interest on
biofuels, supported by a highly ambitious position by the European Union (1, 15). However, a certain slowdown in
the expansion of the use of biofuels is observed recently, that is due to skepticism about possible side effects on
the prices of foodstuff, as well as the need to better study the plant‐ to‐ wheel efficiency and sustainability of
biofuel production and use. Despite the slower increase of biofuels penetration in the market, the specialized
research literature is expanding at an ever‐increasing rate.
An inclusive literature review on the general subject of the effect of biodiesel on engine performance and
emissions, that covers more recent work done during the last decade is presented in (8). As regards the effects of
biodiesel blends on CO and THC emissions, most researchers report a sharp decrease when substituting
conventional diesel fuel with biodiesel fuels. A review by EPA (16), points to a 70% mean reduction in THC levels
and about 50% in CO when the engine is fuelled by pure biodiesel instead of conventional diesel. The reasons
proposed to explain this decrease include the oxygen content of the biodiesel, the higher cetane number of
biodiesel reducing combustion delay, the higher final distillation point of diesel fuel (THC emissions), the advanced
injection and combustion timing. Nevertheless, it will be necessary to carry out significant research work with
modern, common rail Diesel engines, in order to better understand the effects of biodiesel blends on the injection,
combustion and emissions of ultra low emitting engines. Especially with the EURO‐4 engines, equipped with diesel
particulate filters, which are now on the European market, it will be necessary to study in depth the effect of
biodiesel on the operation of the different filter and regeneration technologies and engine durability effects due to
oil dilution from post‐injection.
NOx and Particulate Matter (PM) emissions are the main concern for modern Diesel engines, due to the
high temperature, lean, diffusion flame of the Diesel combustion chamber. NOx and PM emissions of modern Diesel
engines are very close to the legislated standards, which are becoming increasingly stringent. For example, Euro 5
legislation is expected to reduce NOx and PM emissions of passenger cars from 0.25 and 0.025 g/km of today up to
0.18 and 0.005 g/km, respectively, in the NEDC (17). Moreover, Euro 5 legislation may additionally check particulate
3 Literature review – common rail diesel engines with biodiesel

5
number and not only mass, provided that a commonly accepted methodology and measurement device is agreed
upon (18). An improved understanding of the pollution reduction potential of biodiesel in modern Diesel engines
would help car manufacturers to better adapt their engines to the use of higher percentages of biodiesel,
compromising between efficiency and cost. Also, it would help local authorities to further promote biodiesel use in
urban areas with a high percentage of diesel powered vehicles as a means of improving air quality.
3.1 ENGINE POWER AND EFFICIENCY
Biodiesel presents a reduced gross heating value compared to diesel fuel (see Table 1). This holds true also
per unit volume and results in higher volume fuel consumption whenever diesel fuel is substituted by biodiesel.
Thus, when we test the engine on the test bench, maximum power is reduced unless the fuel pump maximum fuel
delivery per stroke is increased to compensate for the lower heating value reduction. Although the reported rated
power reduction range at about 8% for B100 and by analogy to lower blends, there exist some variation around
these percentages among different engines and researchers (19‐23). In older injection systems, the higher viscosity,
which reduces the back flow across the piston clearance of the injection pump, may further compensate the loss in
heating value. In addition, the higher bulk modulus and sound velocity of biodiesel (24‐26) , together with its higher
viscosity (27), lead to an advanced start of injection. This, jointly with cetane number increase, may slightly advance
the start of combustion, which sometimes may increase the power output.
Engine thermal efficiency, as calculated from brake‐specific fuel consumption, is employed to compare the
performance of different fuels, besides their heating value. Most researchers observed no significant change in
thermal efficiency when using biodiesel (8, 28). However, thermal efficiency with alternative fuels should always be
calculated with the necessary accuracy: that is, the heating value of the fuel must be measured, along with the fuel
density, in the case of volumetric fuel flow rate measurement. Fuel density changes with temperature should also
be taken into account (29).
3.2 NOX EMISSIONS
Most of the literature reviewed in (8) shows either a slight NOx emissions increase with biodiesel blends, or
no important effect at all. Increase in NOx in older technology engines is mainly attributed to the advancement in
injection derived from the physical properties of biodiesel (viscosity, density, compressibility, speed of sound). The
effect of the physical properties of biodiesel on the injection advance (with respect to the start of injection with
diesel fuel) has been widely proved in older technology engines. When biodiesel is injected, the pressure rise
produced by the pump propagates more quickly towards the injectors due to its higher sound velocity. In addition,
the higher viscosity reduces leakages in the pump leading to an increase in the injection line pressure. Therefore, a
quicker and earlier needle opening is observed with respect to diesel fuel. Nowadays, the injection cartographies
are optimized by engine designers as a function of the NOx‐soot trade‐off (8). Delaying injection can reduce the NOx
emissions level, increasing of course PM emissions [14]. Leung et al. (30) proposed that other injection parameters,
in combination with injection timing, should be modified in order to eliminate the expected NOx emissions increase
without any penalty in PM reductions. The effect of the increased oxygen availability on NOx emissions has also
been examined. Lapuerta et al. (8) concluded that the oxygen content of biodiesel could not cause any increase in
NO formation because diffusion combustion occurs mainly in regions with oxygen‐fuel ratio around the
stoichiometric one, which is 2.81 for biodiesel and 3.58 for a standard diesel fuel. They argue that internal oxygen
in the fuel molecule is not enough to compensate this difference.
3.3 PARTICULATE MATTER AND SMOKE OPACITY
The literature search made by (8) concludes that almost the majority of authors report a noticeable
decrease in PM emissions with the use of biodiesel blends as fuel. However, this reduction in the solid fraction of
the particulate is accompanied by an increase in the soluble organic fraction (SOF). Such an increase could be due

6
to the lower volatility of the unburned hydrocarbons from biodiesel combustion, which favors their condensation
and adsorption on the particles surface. Yamane et al. (31) carried out optical visualizations of the fuel jet and
found that evaporation and air‐mixing are slower with biodiesel. The following factors are reported to explain the
particulate reduction by use of biodiesel: The oxygen content of the biodiesel molecule, which promotes
combustion even in fuel‐rich regions, the lower stoichiometric A/F of biodiesel combustion, which reduces the
probability of fuel‐rich regions. Also, the non‐existence of aromatics in biodiesel fuels and the zero sulfur content of
most biodiesel fuels, which prevents sulfate formation. Finally, it is known that biodiesel, despite its higher average
distillation temperature, demonstrates a lower final boiling point. That is, heavy distillates that are unavoidably
present in small quantities in Diesel fuel, are absent in biodiesel due to its natural origin. The absence of such heavy
hydrocarbons unable to vaporize, (soot precursors), reduces soot emissions (8, 32, 33).
The fuels under investigation are pure Diesel (0% biodiesel), and a blend of 70 vol. % Biodiesel in pure
Diesel. Throughout this paper the tested fuels were denoted as B0 and B70, respectively. B0 conforms to European
standard EN 590. The biodiesel employed in the measurements is a fatty acid methyl ester produced by 40%
rapeseed oil, 30% soybean oil and 30% recycled cooking oils. It was supplied by ELIN biofuels SA (Volos factory) and
conforms to EN‐14214:2003 specifications (34). A comparison between the tested fuels is given in Table 1, along
with the corresponding range of variation of each parameter in the different fuel types used in Europe and North
America (35, 36). Unfortunately, the exact methyl esters profile of the tested biodiesel was not available. However,
since the fatty acid profile of biodiesel is identical to that of the parent oil, an approximate profile corresponding to
the above parent oil mixing percentages can be estimated based on the indicative methyl esters profiles discussed
in (37). Based on the additional assumption that our recycled cooking oils are composed of sunflower and palm oil,
we estimated an approximate methyl ester profile consisting of 12% C16:0, 5% C18:0, 40% C18:1, 36% C18:2 and
7% C18:3. Based on this profile, the stoichiometric (A/F) of our pure biodiesel is calculated to 12.48
Table 1 Comparison of the range of variation of the main fuel properties, between biodiesel and diesel fuel.
Properties of the specific fuels employed in this study are also included in separate columns.
Specifications / ranges Biodiesel (range) Diesel (range)
Our case Biodiesel (FAME)
Our case Diesel
Density (15 C) (kg/m3) 860–895 815–845 865 825
Viscosity (40 C) (cSt) 3.5–5.5 2–3.5 4.7 2.5
Cetane number 45–65 40–55 55 50
Cold filter plugging point (oC) -5 to 10 -25 to 0 -3 -12
Gross heating value (MJ/kg) 40.3 46.1
Lower heating value (MJ/kg) 36.5–38 42.5–44 37.7 43.3
Water content (mg/kg) 0–500 330 -
Acid number (mg KOH/g) 0–0.60 0.16 -
Sulfur content (ppm) 10–500 50
Iodine number g iodine/100g 117 -
4 Properties of tested fuels

7
5 Test equipment and procedure
The experimental work (38) was made on a PSA 2.0 l., 4 cylinder, 4‐stroke, turbocharged, intercooled,
common rail, direct injection, light duty Diesel engine connected to an Froude ‐ Consine eddy current
dynamometer with Texcel 100 direct digital controller and a PWM engine throttle actuator. The main specifications
of the engine are given in Table 2. The engine is equipped with a Bosch common rail fuel injection system which
enables up to three injections per cycle and provides a 1350 bar maximum rail pressure. The injection system
parameters and exhaust gas recirculation (EGR) are controlled via the engine’s electronic control unit (ECU).
ETAS/MAC 2 interface and the INCA software interface were used to the data acquisition of the engine ECU
variables. Also, additional data acquisition based on external sensors was carried out by means of NI Data
acquisition cards and Labview software. These include pressures (by piezo‐resistive transducers) and temperatures
(by K‐type thermocouples) at various points along the engine inlet and exhaust line, fuel and air flow rate, A/F for
control purposes by means of an UEGO sensor. Sampling of exhaust gas is led to a pair of THC analyzers (JUM HFID
3300A), CO, CO2 (Signal Model 2200 NDIR) and NOx (Signal Model 4000 CLD) analyzers.
Table 2 Engine technical data
Engine type HDI turbocharged engine
Engine model DW10 ATED
Cylinders 4, in-line
Bore 85 mm
Stroke 88 mm
Displacement 1997 cm3
Rated power /rpm 80 kW/4000 rpm
Rated torque/rpm 250 Nm/2000 rpm
Compression ratio 18:1
ECU version Bosch EDC 15C2 HDI
Diesel filter IBIDEN SiC filter
5.1 BASIC FUEL INJECTION MAPS
In order to better understand the variation of the specific engine’s behavior with biodiesel blends, the
mapping of the basic injection parameters in the engine ECU is to be discussed first. The main maps that are stored
in the ECU are summarized below. They are employed in the calculation of the following variables:

8
Common rail pressure as function of engine speed and fuel delivery per stroke
(
Figure 2 Common Rail pressure as function of engine speed and fuel delivery per stroke
Figure 3 Injector opening duration (μs) as function of rail pressure and fuel delivery per stroke (pilot, main and
post‐injection)
).
Injector opening duration (μs) as function of rail pressure and fuel delivery per stroke. The injection system enables up to three injections per cycle, pilot, main and post injection (Error! Reference source not found.).
Pilot injection fuel delivery (mm3/stroke) as function of engine speed and total fuel delivery (Figure 4).
Pilot injection advance (oCA) as function of engine speed and fuel delivery per stroke (Figure 5).

9
Main injection advance (oCA) (with pilot injection) as function of engine speed and fuel delivery per stroke (Figure 6).
Figure 1 ECU flowchart for the calculation of the main injection parameters (common rail injection system)
Figure 2 Common Rail pressure as function of engine speed and fuel delivery per stroke

10
Figure 3 Injector opening duration (μs) as function of rail pressure and fuel delivery per stroke (pilot, main and
post‐injection)
Figure 4 Pilot injection fuel delivery [μs] as function of engine speed and total fuel delivery

11
Figure 5 Pilot injection advance (oCA) as function of engine speed and fuel delivery per stroke
Figure 6 Main injection advance (oCA) (with pilot injection) as function of engine speed and fuel delivery per
stroke

12
Figure 7 Sequence of operation points selected for the comparison of fuels
Data acquisition of the engine ECU variables was made through the INCA software, which may record
several hundreds of ECU variables. The following variables were regularly recorded (with a time step of 100 ms)
during our measurements: Engine speed, Pedal position, Water temperature, EGR valve position, Throttle valve
position, Turbo valve position, Intake air temperature, Intake pressure (set point and measured), Air mass flow (set
point and measured), Fuel temperature, Fuel pressure (set point and measured), Fuel mass delivery per cycle,
Injection advance (pilot), Injection advance (main), Injection duration (pilot, main and post injection).
Also, additional data acquisition based on external sensors was carried out by means of Labview software,
was made for the following quantities: Engine Speed, Engine Torque, Cooling water inlet and outlet temperatures,
Fuel mass flow rate, Air flow rate, A/F ratio, Compressor boost pressure, Turbo in pressure, temperatures and
pressures at various points in engine inlet and exhaust lines, including oxidation catalyst and Diesel filter.
A succession of steady state operation points was selected as shown in Figure 7. The set of operation
points was selected to cover the full extent of the engine operation map (from low speed – low load to high speed‐
high load), and thus study also engine operation that is not represented in the legislated cycles (e.g. NEDC), which
usually focus to the lower left quadrant of speed – load regime. The specific sequence of operation points was
programmed in the dyno controller (Test Sequence Editor). The transition time between each two successive points
was set to 5 seconds.
As regards secondary effects of the use of the B70 biodiesel blend, during the tests with B70, we noticed
fuel leaks due to the loosening of the fitting of the elastic pipe which leads fuel returns to the fuel tank.
Additionally, high fuel temperatures were measured in the fuel return line, and we had to install a counter‐flow
heat exchanger (water‐to‐fuel) for return line cooling, by means of 20oC water from the supply. This effect is
already reported by other researchers with injection systems based on rotary supply or distributor pumps (4).

13
6.1 EFFECT OF B70 ON ENGINE PERFORMANCE AND FUEL CONSUMPTION
As already reported in the experimental section, the dyno controller was programmed to attain the same
operation points for both alternative fuels used. However, the real engine performance was slightly affected as
shown in Figure 8. Small differences in engine torque are observed, that fall within the statistical variability of
engine performance. The results are presented below in the form of line graphs, where the horizontal axis contains
always the numbers of the 15 operation points of the sequence of Figure 7. Thus, the lines connecting the 15 values
of each variable in the graphs are not representing any intermediate operation points. They are just connecting the
points to allow the simultaneous presentation of the variation of more, related variables in one graph, which could
not easily be done with a bar chart.
Figure 8 Comparison of engine speed, bmep, power with Diesel fuel and B70 blend at the 15 operation points of
the cycle
The most marked difference in the performance of the engine fuelled by B70 is the increase in fuel
delivery per stroke, for the respective operation points, as presented in Figure 9. There exists only one operation
point where we observe a decrease of fuel consumption with B70. This could be possibly due to a significant
difference in engine efficiency and turbocharger speed at this low load operation point with EGR.
6 Results and Discussion

14
Figure 9 Fuel consumption (bsp) increase with B70 –vs‐ Diesel fuel at the 15 operation points of the cycle
The increase in fuel delivery per stroke is expected, as already mentioned. Additional fuel mass is required
in order to produce the same power per cycle burning a blend with lower heating value (see Table 3). Gross heating
value of the two fuels was measured in a Parr 1261 Oxygen Bomb. The results are presented in Table 3.
Table 3 Results of Gross heating value measurements with the bomb calorimeter
Diesel
EN590
Gross heating value [MJ/kg]
Mean Gross heating value [MJ/kg]
Mass of H2O in exhaust gas per kg of fuel
Lower heating value [MJ/kg] (computed)
1 46.0434 46.2276 1.17 43.30
2 46.2124
3 46.4261
Biodiesel EN 14214
Gross heating value [MJ/kg]
Mean Gross heating value [MJ/kg]
Mass of H2O in exhaust gas per kg of fuel
Lower heating value [MJ/kg] (computed)
1 40.1051 40.2913 1.04 37.69
2 40.4928
3 40.2761

15
According to the results of the above Table, the lower heating value of the B70 blend is 37.7 MJ/kg,
whereas the respective value for the Diesel fuel is 43.3 MJ/kg.
In order to calculate the fuel energy input per stroke, we additionally need to take into account fuel
density, which is also a function of fuel temperature.
f 0ρ =ρ /(1+βΔt) (1)
The coefficient of thermal expansion of biodiesel is assumed β = 8.3 E‐4 (39). The coefficient of thermal
expansion of Diesel fuel is assumed β = 11 E‐4 (40), and ρ0 is the reference density at 15oC (Table 1).
Based on the above, the fuel energy input per stroke is given by the equation:
str f u spE =ρ H b (2)
If we apply this equation, e.g. at operation point 15, the fuel energy input per stroke for the Diesel fuel is
1692.6 J/stroke, whereas the respective value for the B70 blend is 1689.6 J/stroke. Thus, the required fuel energy
input per stroke to produce the same engine power, is almost equal for the two alternative fuels. This implies also
that engine efficiency is not modified from the shift to the biodiesel blend. The results of detailed calculations of
engine efficiency for all operation points are included in Figure 12 below.
Figure 10 Comparison of fuel delivery per stroke, fuel temperature, bmep and fuel mass per stroke for B0 and
B70 at the 15 points of the cycle
The above remarks suggest that the engine is obliged to burn a higher B70 fuel quantity in order to
produce the same torque at each operating point. Next step is to see if this change in fuel quantity also affects A/F
ratio and λ. To this end, one must take into account that a Diesel engine is expected to draw approximately the
same air quantity (mass) for a given engine speed and load. Since, as explained above, the engine needs to draw a
higher fuel mass per stroke to account for the lower energy content of B70, it is expected that A/F will be lower
with the B70 fuel at all operating points. This is confirmed in Figure 11. It must be noted here that A/F is measured
16
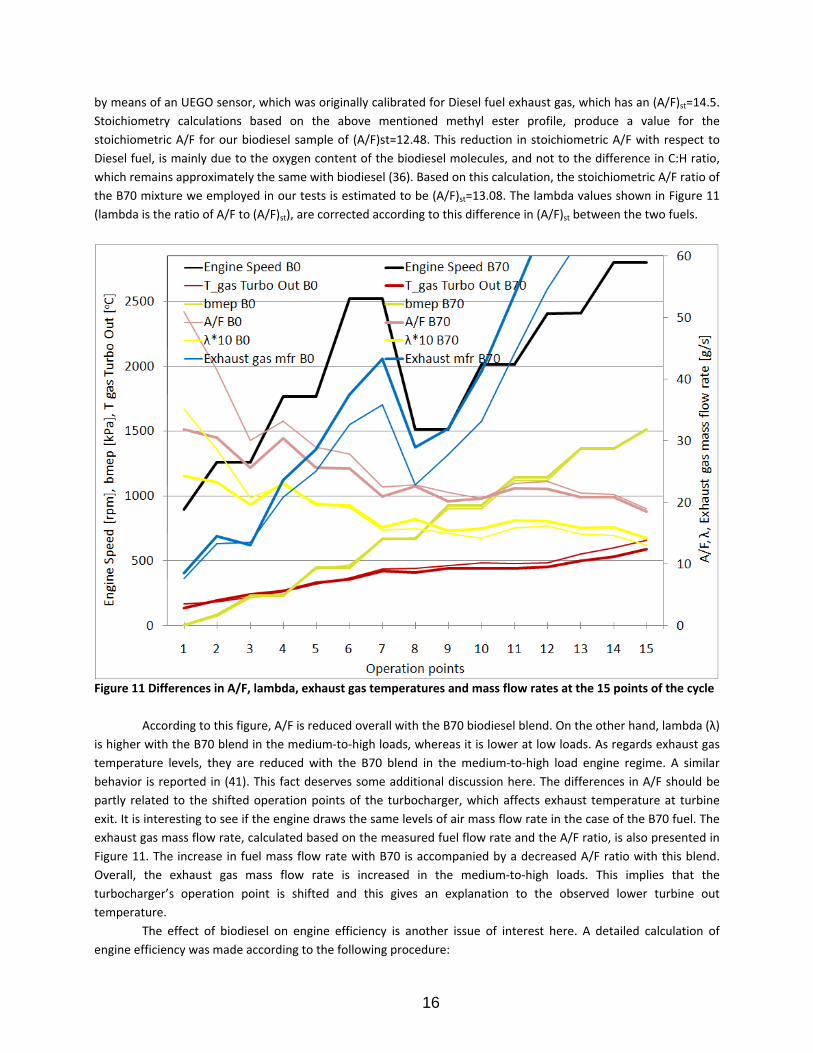
by means of an UEGO sensor, which was originally calibrated for Diesel fuel exhaust gas, which has an (A/F)st=14.5.
Stoichiometry calculations based on the above mentioned methyl ester profile, produce a value for the
stoichiometric A/F for our biodiesel sample of (A/F)st=12.48. This reduction in stoichiometric A/F with respect to
Diesel fuel, is mainly due to the oxygen content of the biodiesel molecules, and not to the difference in C:H ratio,
which remains approximately the same with biodiesel (36). Based on this calculation, the stoichiometric A/F ratio of
the B70 mixture we employed in our tests is estimated to be (A/F)st=13.08. The lambda values shown in Figure 11
(lambda is the ratio of A/F to (A/F)st), are corrected according to this difference in (A/F)st between the two fuels.
Figure 11 Differences in A/F, lambda, exhaust gas temperatures and mass flow rates at the 15 points of the cycle
According to this figure, A/F is reduced overall with the B70 biodiesel blend. On the other hand, lambda (λ)
is higher with the B70 blend in the medium‐to‐high loads, whereas it is lower at low loads. As regards exhaust gas
temperature levels, they are reduced with the B70 blend in the medium‐to‐high load engine regime. A similar
behavior is reported in (41). This fact deserves some additional discussion here. The differences in A/F should be
partly related to the shifted operation points of the turbocharger, which affects exhaust temperature at turbine
exit. It is interesting to see if the engine draws the same levels of air mass flow rate in the case of the B70 fuel. The
exhaust gas mass flow rate, calculated based on the measured fuel flow rate and the A/F ratio, is also presented in
Figure 11. The increase in fuel mass flow rate with B70 is accompanied by a decreased A/F ratio with this blend.
Overall, the exhaust gas mass flow rate is increased in the medium‐to‐high loads. This implies that the
turbocharger’s operation point is shifted and this gives an explanation to the observed lower turbine out
temperature.
The effect of biodiesel on engine efficiency is another issue of interest here. A detailed calculation of
engine efficiency was made according to the following procedure:

17
th f u uη =P/(m H )=1/(bsfcH ) (3)
Fuel mass is calculated based on fuel volume flow rate as measured by the ECU, taking into account the
variable fuel density as function of fuel temperature, as measured by the ECU. The results are employed in the
calculation of brake specific fuel consumption and thermal efficiency values presented in Figure 12.
Figure 12 Differences in bsfc, bmep and engine efficiency at the 15 points of the cycle
To obtain the same torque and power output for both tested fuels, the brake specific fuel consumption
was higher for the B70 blend in inverse proportion to the lower heating value per volume of fuel, this leading to
similar thermal efficiencies.
It should be mentioned here that the highest load selected for the comparison of the two fuels was less
than the maximum torque. The reason for this selection lies to a certain reduction in the maximum torque that was
observed with the B70 blend (240 instead of 250 Nm). This reduction is explained by the fact that the maximum

18
fuel delivery per stroke of about 55 mm3/st. in the engine ECU maps (see
Figure 2 Common Rail pressure as function of engine speed and fuel delivery per stroke
Figure 3 Injector opening duration (μs) as function of rail pressure and fuel delivery per stroke (pilot, main and
post‐injection)
‐ Figure 6), does not suffice for the case of fuelling with B70 (Figure 10) due to its lower heating value.
Obviously, the ECU does not have the possibility of detecting the difference in fuel properties. At high load
conditions, the request by the accelerator of more torque increases the fuel delivery per stroke to the limits of the
ECU’s cartography. In order to keep the same maximum torque with biodiesel blends, an extension of the limits of
the fuel delivery map would suffice, since an adequate margin of A/F exists. Moreover, if it would become possible

19
to trace the biodiesel percentage in the fuel by some kind of sensor, additional improvements would be possible in
the ECU maps, to further improve performance with the biodiesel blends.
6.2 EFFECT OF B70 FUEL ON THE INJECTION SYSTEM PARAMETERS
The effect of B70 blend on the main fuel injection system parameters is presented in Figure 13.
Figure 13 Differences in fuel injection parameters (common rail pressure, pilot and main injection advance, pilot
and main injection duration) at the 15 points of the cycle
As shown in Figure 13, the main injection advance and the pilot injection time were not affected by the
use of the biodiesel blend. That is, as expected for a common rail fuel injection system (8, 9), the difference of the
speed of sound in biodiesel does not affect the start of the main injection (see Figure 6). On the other hand, the rail
pressure, pilot injection advance and main injection time are increased with the B70 blend. This is explained by the
algorithm of calculation of these variables by the ECU, along with the ECU cartography: Rail pressure is mapped in
the ECU as function of engine speed and fuel delivery per stroke. Since biodiesel has a lower heating value than

20
pure diesel, more fuel needs to be injected into the engine cylinder which causes the higher fuel delivery and thus
increased rail pressures (see
Figure 2 Common Rail pressure as function of engine speed and fuel delivery per stroke
Figure 3 Injector opening duration (μs) as function of rail pressure and fuel delivery per stroke (pilot, main and
post‐injection)
) for the B70 fuel blend. The increase in pilot injection advance (see Figure 5) and main injection time (see
Error! Reference source not found.) was caused by the effect of the increased fuel delivery, as calculated by the
ECU based on the maps of Figures 2 to 6.
6.3 EFFECT OF B70 ON THE POLLUTANT EMISSIONS

21
The effect of the B70 fuel blend on the engine HC and CO emissions is presented in Figure 14. The
reduction of CO emissions is quite observable in the figure, especially at high loads. It is in line with the reported
results of the literature. On the other hand, the effect of B70 fuel on THC emissions is less pronounced, and is
mainly seen at low to medium loads. Again, this is in line with what is reported in the literature for common rail
Diesel engines (28).
Figure 14 Differences in HC and CO emissions between B70 and B0 at the 15 points of the cycle
22
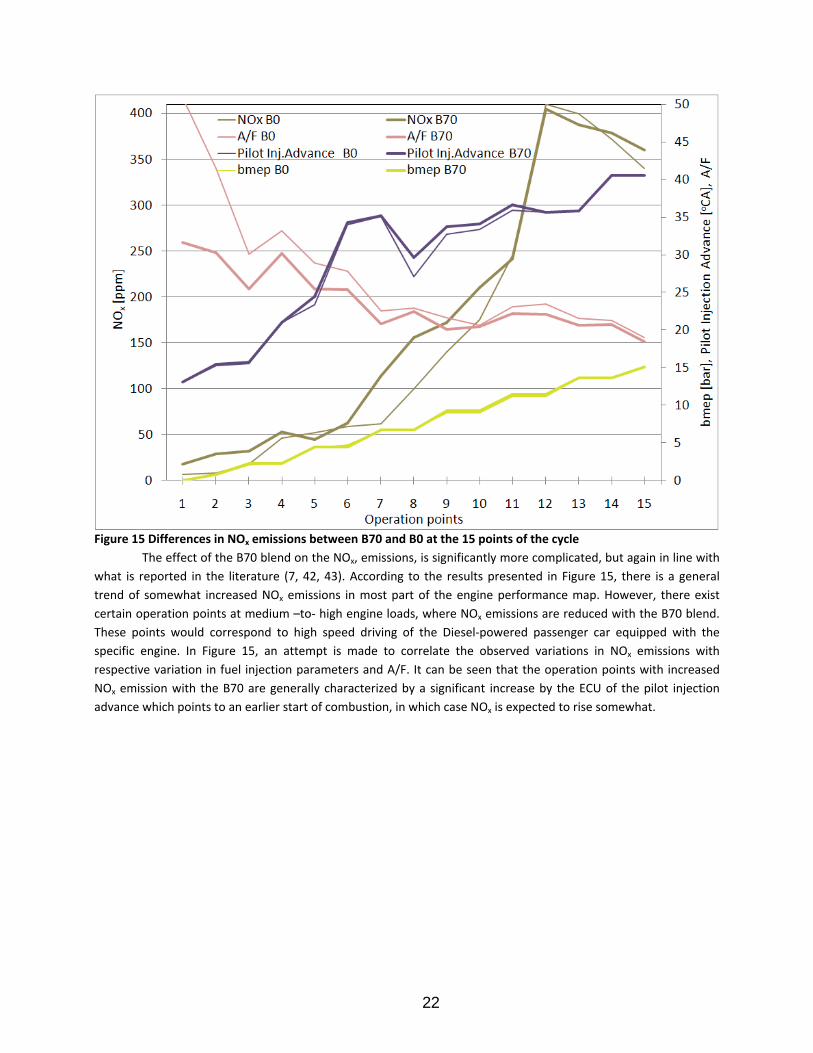
Figure 15 Differences in NOx emissions between B70 and B0 at the 15 points of the cycle
The effect of the B70 blend on the NOx, emissions, is significantly more complicated, but again in line with
what is reported in the literature (7, 42, 43). According to the results presented in Figure 15, there is a general
trend of somewhat increased NOx emissions in most part of the engine performance map. However, there exist
certain operation points at medium –to‐ high engine loads, where NOx emissions are reduced with the B70 blend.
These points would correspond to high speed driving of the Diesel‐powered passenger car equipped with the
specific engine. In Figure 15, an attempt is made to correlate the observed variations in NOx emissions with
respective variation in fuel injection parameters and A/F. It can be seen that the operation points with increased
NOx emission with the B70 are generally characterized by a significant increase by the ECU of the pilot injection
advance which points to an earlier start of combustion, in which case NOx is expected to rise somewhat.

23
Figure 16 Comparison of particulate samples (undiluted exhaust gas upstream filter passing through a Pallflex
47mm filter during the total cycle. Left: Diesel fuel. Right: B70 biodiesel blend.
Finally, although we did not carry out the legislated particulate sampling from diluted exhaust gas, the
samples taken from undiluted gas very close to the exhaust line in 47mm filters, one for each cycle, are
comparatively presented in Figure 16 just for a qualitative comparison. The lower blackening of the filter in the B70
case is apparent, along with the characteristic yellowish color of the B70 particulate, which implies a higher SOF
content. These observations, which are in accordance with the literature (11, 12), can be mainly explained by the
oxygen content of the biodiesel molecule, which enables more complete combustion and promotes the oxidation
of the already formed soot. In addition the lower stoichiometric need of air in case of biodiesel blend combustion
reduces the probability of fuel – rich regions in the non – uniform fuel – air blend.
The specialized literature is relatively sparse regarding the effect of fuelling modern, common rail diesel
engines by high biodiesel content fuel blends. This paper aims to contribute in this area, by presenting comparative
test results with a common rail, high pressure injection, passenger car diesel engine fuelled by B70 versus normal
diesel fuel.
A sequence of 15 steady state engine operation points was selected as representative of the engine
operation map. This test sequence was programmed in the controller of the eddy current dynamometer and the
most important engine performance and emissions characteristics were recorded, with the engine fuelled by B70
and alternatively, by pure Diesel fuel.
The biodiesel employed in the tests was a FAME based on 40% rapeseed oil, 30% soybean oil and 30%
waste cooking oils as raw material, supplied by a local factory.
Engine tests performed under low, medium and high load conditions have shown a sharp reduction in CO
and HC emissions upstream catalyst, with the use of the B70 blend.
The effect of the decreased heating value of the biodiesel (despite its slightly increased density) in the
brake specific fuel consumption increase was confirmed by the measurements. Engine efficiency was not generally
observed to change with biodiesel combustion.
As expected, decreased air to fuel ratio values were measured with the B70 at all operation points. On the
other hand, lambda was observed to increase at the medium‐to‐high load range.
7 Conclusions

24
The effect of the B70 blend on the main fuel injection parameters (common rail pressure, pilot and main
injection advance and time) was measured and explained based on the maps stored in the ECU of the engine.
A significant increase of the fuel temperatures was observed with the B70 blend. It was necessary to install
a heat exchanger in the fuel return line, in order to keep fuel at acceptable temperatures (less than 50 oC).
The effect of the B70 on NOx emissions was less pronounced and more complex. NOx reduction was only
observed at medium‐to‐high loads. Again, this can be explained based on the modification by the ECU of certain
fuel injection parameters for the B70 combustion.
Reduced PM emissions and smoke opacity was observed by a qualitative comparison of the soot collected
on Pallflex filters from undiluted exhaust gas sampled directly from the exhaust line for the total duration of each
test. Again, this is in line with what is known from the literature.
The discussion improves understanding of how the common rail injection engine responds to the biofuel
blend, as compared to the reference fuel, based on the injection control flowchart.
The financial support of the Hellenic General Secretariat of Research and Technology, in the frame of the
collaborative project “RIP A6 – Production of biofuels in Thessaly”, is gratefully acknowledged. Also, the authors
wish to thank the local biodiesel production company ELIN biofuels SA for kindly supplying the quantity of biodiesel
employed in the measurements free of charge.
8 Aknowledgments

1. BIOFRAC. EUR 22066 Final report of the Biofuels Research Advisory Council http://ec.europa.eu/research/energy/pdf/biofuels_vision_2030_en.pdf; 2007 Contract No.: Document Number|. 2. European. Biofuels Technology Platform: Strategic Research Agenda & Strategic Deployment Document http://cordis.europa.eu/technology‐platforms/pdf/biofuels.pdf; 2008 Contract No.: Document Number|. 3. FIE. Diesel Fuel Injection Equipment Manufacturers Common Position Statement: FAME Fuels as a Replacement or Extender for Diesel Fuels http://www.greenfuels.org/biodiesel/res/2004_10_FAME_Statement.pdf. 2004. 4. Agarwal AK. Biofuels (alcohols and biodiesel) applications as fuels for internal combustion engines. Progress in Energy and Combustion Science. 2007;33(3):233‐71. 5. Bouaid A, Martinez M, Aracil J. Production of biodiesel from bioethanol and Brassica carinata oil: Oxidation stability study. Bioresource Technology. 2009;100(7):2234‐9. 6. Xin J, Imahara H, Saka S. Oxidation stability of biodiesel fuel as prepared by supercritical methanol. Fuel. 2008;87(10‐11):1807‐13. 7. Graboski M, McCormick R. Combustion of fat and vegetable oil derived fuels in diesel engines. Prog Energy Combust Sci. 1998;24:125–64. 8. Lapuerta M, Armas O, Rodriguez‐Fernandez J. Effect of biodiesel fuels on diesel engine emissions. Progress in Energy and Combustion Science. 2008;34(2):198‐223. 9. McCormick R, A W, J I, M B, RR H. Effects of biodiesel blends on vehicle emissions,: National Renewable Energy Laboratory; 2006 Contract No.: Document Number|. 10. Tsolakis A, Megaritis A, Wyszynski ML, Theinnoi K. Engine performance and emissions of a diesel engine operating on diesel‐RME (rapeseed methyl ester) blends with EGR (exhaust gas recirculation). Energy. 2007;32(11):2072‐80. 11. Szybist JP, Song J, Alam M, Boehman AL. Biodiesel combustion, emissions and emission control. Fuel Processing Technology. 2007;88(7):679‐91. 12. Wu F, Wang J, Chen W, Shuai S. A study on emission performance of a diesel engine fueled with five typical methyl ester biodiesels. Atmospheric Environment. 2009;In Press, Corrected Proof. 13. Asad U, Zheng M. Fast heat release characterization of a diesel engine. International Journal of Thermal Sciences. 2008;47(12):1688‐700. 14. Renault. DDCR Diesel Injection ‐ Fault finding ‐ Diagnostics. In: (DDCR) DKDDCRI, editor. 2 ed; 2007. 15. DIRECTIVE 2003/30/EC OF THE EUROPEAN PARLIAMENT AND OF THE COUNCIL. (2003). 16. EPA. 420‐P‐02‐001 A comprehensive analysis of biodiesel impacts on exhaust emissions. Assessment and Standards Division (Office of Transportation and Air Quality) 2002. 17. EU. New European Driving Cycle (NEDC). Directive 98/69/EC of the European Parliament; 1998. 18. EU. Proposed Euro 5 regulation COM (2005) 683. European Parliament; 2005. 19. Puhan S, Vedaraman N, Sankaranarayanan G, Bharat RB. Performance and emission study of Mahua oil (Madhuca indica oil) ethyl ester in a 4‐stroke natural aspirated direct injection diesel engine. Renewable Energy. 2005;30:1269–78. 20. Armas O, Rodrıguez J, Cardenas MD, AF. A. Efecto del biodiesel procedente de aceites vegetales usados sobre las emisiones y prestaciones de un motor diesel. Anales del XVI Congreso Nacional de Ingenierıa Mecanica; 2004; Leon, Spain. 2004. 21. Lapuerta M, Hernandez J, Ballesteros R, Duran A. Composition and size of diesel particulate emissions from a commercial European engine tested with present and future fuels. IMechE. 2003;217(Part D):907–19. 22. Lapuerta M, Armas O, Ballesteros R, editors. Diesel particulate emissions from biofuels derived from Spanish vegetable oils; 2002. SAE paper 2002‐01‐1657.
References

26
23. Senatore A, Cardone M, Rocco V, MV. P, editors. A comparative analysis of combustion process in D.I. Diesel engine fueled with biodiesel and diesel fuel; 2000. SAE paper 2000‐01‐0691. 24. Alam M, Song J, Acharya R, Boehman A, K. M, editors. Combustion and emissions performance of low sulfur, ultra low sulfur and biodiesel blends in a DI diesel engine; 2004. SAE paper 2004‐01‐3024. 25. Szybist J, Boehman A, Taylor J, McCormick R. Fuel Process Technol Evaluation of formulation strategies to eliminate the biodiesel NOx effect. 2005;86:1109–26. 26. Boehman A, Song J, Alam M. Impact of biodiesel blending on diesel soot and the regeneration of particulate filters. Energy Fuels. 2005;19:1857–64. 27. Tat ME. Investigation of oxides of nitrogen emissions from biodiesel‐fueled engines. PhD thesis: Iowa State University; 2003. 28. Lapuerta M, Herreros J, Lyons L, L., Garcia‐Contreras R, Briceno. Y. Effect of the alcohol type used in the production of waste cooking oil biodiesel on diesel performance and emissions. Fuel. 2008;87(15‐16):3161‐9. 29. Rodriguez‐Anton LM, Aparicio C, Guignon B, Sanz PD. Volumetric properties at high pressure of waste oil methyl ester compared with diesel oil. Fuel. 2008;87(10‐11):1934‐40. 30. Leung DYC, Luo Y, Chan TL. Optimization of exhaust emissions of a diesel engine fuelled with biodiesel. Energy and Fuels. 2006;20(3):1015‐23. 31. Yamane K, Ueta A, Shimamoto Y. Influence of physical and chemical properties of biodiesel fuels on injection, combustion and exhaust emission characteristics in a direct injection compression ignition engine. Int J Engine Res. 2004;4:249–61. 32. Rakopoulos CD, Hountalas DT, Zannis TC, Levendis YA, editors. Operational and environmental evaluation of diesel engines burning oxygen‐enriched intake air or oxygen‐enriched fuels: a review; 2004. SAE paper 2004‐01‐2924. 33. Rakopoulos DC, Rakopoulos CD, Kakaras EC, Giakoumis EG. Effects of ethanol‐diesel fuel blends on the performance and exhaust emissions of heavy duty DI diesel engine. Energy Conversion and Management. 2008;49(11):3155‐62. 34. EU. EN‐14214, Fatty acid methyl esters (FAME) for diesel engines—requirements and test methods. 2003. 35. Jääskeläinen H. Biodiesel Standards & Properties. www.dieselnet.com; Revision 2007.07b [cited. Available from: www.dieselnet.com. 36. DieselNet. Appendix: Biodiesel Composition And Properties of Components. www.dieselnet.com; Revision 2007.07 [cited. Available from: www.dieselnet.com. 37. Knothe G. “Designer” Biodiesel: Optimizing Fatty Ester Composition to Improve Fuel Properties. Fuel. 2008(22):1358‐64. 38. Demetriades L, Tziourtzioumis D, Zogou O, A. S. RIP A6 – Production of biofuels in Thessaly: Engine tests with biodiesel mixtures. Volos; 2008 Contract No.RIP A6: Document Number #2. 39. Castellon‐Elizondo E, Lutz G, Mata‐Segreda G. The soft‐solid model for liquids. Application to biodiesel and other materials of technological interest. Physical Organic Chemistry. 2006;19:744‐7. 40. VDI. Waermeatlas. Springer Verlag; 2002. 41. Kegl B. Effects of biodiesel on emissions of a bus diesel. Bioresource Technology. 2007;99(4):863‐73. 42. Knothe G, Matheaus A, Ryan TW. Cetane numbers of branched and straight‐chain fatty esters determined in an ignition quality tester. Fuel. 2003;82(8):971‐5. 43. Murphy M, Taylor J, McCormick R. Compendium of Experimental Cetane Number Data. NREL/SR‐540‐36805. 2004 [cited.


![Effects of Ethanol on Combustion and Emissions a Gasoline ... · valve. Urata et al [5] manufactured engine equipped with newly developed hydraulic variable valve train (HVT), which](https://static.fdocuments.in/doc/165x107/5e86566676e9cc7bbe2ed55e/effects-of-ethanol-on-combustion-and-emissions-a-gasoline-valve-urata-et-al.jpg)