Experimental Investigation of Performance, Flow ...470709/FULLTEXT01.pdf · Experimental...
89
Experimental Investigation of Performance, Flow Interactions and Rotor Forcing in Axial Partial Admission Turbines Jens Fridh Doctoral Thesis 2012 Division of Heat and Power Technology Department of Energy Technology Royal Institute of Technology Stockholm, Sweden
-
Upload
vuongkhanh -
Category
Documents
-
view
215 -
download
1
Transcript of Experimental Investigation of Performance, Flow ...470709/FULLTEXT01.pdf · Experimental...

Experimental Investigation of Performance, Flow Interactions and Rotor Forcing in Axial
Partial Admission Turbines
Jens Fridh
Doctoral Thesis 2012
Division of Heat and Power Technology Department of Energy Technology
Royal Institute of Technology Stockholm, Sweden

TRITA KRV Report 13/10 ISSN 1100-7990 ISRN KTH/KRV/11/12-SE ISBN 978-91-7501-224-7 © Jens Fridh 2012

Kunskap växer inte på träd, ej heller plockas den gratis eller mognar utan näring och ljus. Vetskapens solljumma eftersmak står att finna i fallfruktens första innehållsrika timma. Men att förutse erfarenheten och låtas berusas av vetenskapens jäsande vinkrus, är en svårbemästrad konst som lätt kan försvinna.


Doctoral Thesis / Jens Fridh Page I
ABSTRACT
The thesis comprises a collection of four papers with preceding summary and supplementary appendices. The core investigation solely is of experimental nature although reference and comparisons with numerical models will be addressed.
The first admission stage in an industrial steam turbine is referred to as the control stage if partial admission is applied. In order to achieve high part load efficiency and a high control stage output it is routinely applied in industrial steam turbines used in combined heat and power plants which frequently operate at part load. The inlet flow is individually throttled into separate annular arcs leading to the first stator row. Furthermore, partial admission is sometimes used in small-scale turbine stages to avoid short vanes/blades in order to reduce the impact from the tip leakage and endwall losses. There are three main aspects regarding partial admission turbines that need to be addressed. Firstly, there are specific aerodynamic losses: pumping-, emptying- and filling losses attributed to the partial admission stage. Secondly, if it is a multistage turbine, the downstream stages experience non-periodic flow around the periphery and circumferential pressure gradients and flow angle variations that produce additional mixing losses. Thirdly, the aeromechanical condition is different compared to full admission turbines and the forcing on downstream components is also circumferentially non-periodic with transient load changes.
Although general explanations for partial admission losses exist in open literature, details and loss mechanisms have not been addressed in the same extent as for other sources of losses in full admission turbines. Generally applicable loss correlations are still lacking. High cycle fatigue due to unforeseen excitation frequencies or due to under estimated force magnitudes, or a combination of both causes control stage breakdowns. The main objectives of this thesis are to experimentally explore and determine performance and losses for a wide range of partial admission configurations. And, to perform a forced response analysis from experimental data for the axial test turbine presented herein in order to establish the forced response environment and identify particularities important for the design of control stages.
Performance measurements concerning the efficiency trends and principal circumferential and axial pressure distortions demonstrate the applicability of the partial admission setup employed in the test turbine. Findings reveal that the reaction degree around the circumference varies considerably and large flow angle deviations downstream of the first rotor are present, not only in conjunction to the sector ends but stretching far into the admission sector. Furthermore, it is found that the flow capacity coefficient increases with reduced admission degree and the filling process locally generates large rotor incidence variation associated with high loss. Moreover, the off-design conditions and efficiency deficit of downstream stages are evaluated and shown to be important when considering the overall turbine efficiency. By going from one to two arcs at 52.4% admission nearly a 10% reduction in the second stage partial admission loss, at design operating point was deduced from measurements.
Ensemble averaged results from rotating unsteady pressure measurements indicate roughly a doubling of the normalized relative dynamic pressure at rotor emptying compared to an undisturbed part of the admission jet for 76.2% admission. Forced response analysis reveals that a large number of low engine order force impulses are added or highly amplified due to partial admission because of the blockage, pumping, loading and unloading processes. For the test turbine investigated herein it is entirely a combination of number of rotor blades and low engine order excitations that cause forced response vibrations. One possible design approach in order to change the force spectrum is to alter the relationship between admitted and non-admitted arc lengths. Keywords: axial turbine, partial admission, part loads, experimental investigation, turbine performance, losses, dynamic rotor forces, forced response, unsteady flow.

Page II Doctoral Thesis / Jens Fridh

Doctoral Thesis / Jens Fridh Page III
SAMMANFATTNING
Denna sammanläggningsavhandling består av fyra artiklar och föregås av en sammanfattning med kompletterande bilagor. Kärnan av undersökningen är experimentell även om referenser och jämförelser med numeriska modeller förekommer där så bedöms lämpligt.
Det första steget i en industriell ångturbin kallas reglersteg om partialpådrag tillämpas. Det används rutinmässigt i kraftvärmeanläggningar som ofta körs vid dellaster för att åstadkomma en hög dellastverkningsgrad och hög stegeffekt. Inloppsflödet delas in separata och individuellt strypreglerade pådragsbågar som leder till det första munstycksgittret. Ibland används partialpådrag i små turbiner för att undvika korta blad och på så sätt minska takläckage och ändväggsförlusternas inflytande på den totala förlusten. Det finns i huvudsak tre aerodynamiska/aeromekaniska egenheter som bör beaktas. Först det första är det speciella aerodynamiska förluster associerade till partialpådrag eller reglersteget: ventilations-, tömnings- och fyllningsförluster. För det andra, om det är en flerstegsturbin påverkas också nedströms steg negativt av det asymmetriska flödet runt omkretsen som innefattar stora tryckvariationer och flödesvinkelvariationer. För det tredje är den aeromekaniska situationen speciell jämfört med ett fullpådraget steg. För partialpådrag existerar dynamiska krafter med snabba laständringar vid in- och utpassering i pådragsbågen.
Även om det existerar generella förklaringar i den öppna litteraturen angående förluster så har inte förlustmekanismerna utretts i samma omfattning jämfört med fullpådrag. Ingen generell förlustkorrelation finns. Utmattning på grund oförutsedda excitationsfrekvenser, underskattade kraftamplituder eller en kombination av båda orsakar reglerstegshaveri för ångturbinintressenter. De huvudsakliga målsättningarna med denna studie är att experimentellt utforska och bestämma prestanda och förluster för ett stort antal partialpådragskonfigurationer. Samt att genomföra en vibrationsanalys (relaterat till aerodynamiska kraftimpulser) utifrån mätdata från provturbinen avhandlad häri. Detta för att kartlägga de aeromekaniska förutsättningarna och om möjligt identifiera egenheter viktiga för konstruktion av reglersteg.
Prestandamätningar rörande verkningsgradstrender och generella strömningsvariationer runt omkretsen bekräftar resultat från den öppna litteraturen och därmed demonstrerar dugligheten av den partialpådragskonfiguration som används i luftprovturbinen. Dessutom visar resultaten bland annat att reaktionsgraden varierar kraftigt runt omkretsen med stora variationer i rotorns utloppsvinkel inte enbart i anslutning till sektorändar utan långt in i pådragssektorn. Flödeskapacitetskoefficienten eller turbinkonstanten ökar med minskat pådrag och fyllningsprocessen genererar stora variationer i rotorns inloppsvinkel förknippade med höga förluster. Det är viktigt att beakta dellastförutsättningarna och verkningsgradsminskningen för nedströms steg. Genom att använda två pådragsbågar istället för en för ett givet pådrag av 52,4% minskar partialpådragsförlusterna för nedströmssteget med nästan 10 % vid designpunkten, härlett från mätningar.
Samlade medelvärden från roterande instationära mätningar visar på en fördubbling av det relativa dynamiska trycket vid rotortömning jämfört med en opåverkad del av pådragsbågen. Vibrationsanalys (relaterat till aerodynamiska kraftimpulser) av mätdata avslöjar att partialpådrag orsakar en stor mängd kraftimpulser med låga varvtalsmultiplar, främst från ventilationen och på- avlastningsprocesserna. För provturbinen så är det helt och hållet kombinationer mellan antalet rotorblad och dessa kraftimpulser som orsakar strömningspåverkade vibrationer. Ett möjligt tillvägagångssätt konstruktionsmässigt för att ändra kraftspektrumet är att ändra längförhållandet mellan pådragen och blockerad del. Nyckelord: axialturbin, partialpådrag, dellaster, reglersteg, experimentell undersökning, turbinprestanda, förluster, dynamiska krafter, rotorvibration, instationär strömning.

Page IV Doctoral Thesis / Jens Fridh
Doctoral Thesis / Jens Fridh Page V
PREFACE
Thesis format The dissertation is a compilation thesis that comprises an introduction, a short summary of four articles (I – IV), supplementary appendices and the full length articles (I – IV). The articles are arranged in chronological order and stated below. I. Fridh, J., Bunkute, B., Fakhrai, R., Fransson, T., 2004. “An Experimental Study on
Partial Admission in a Two-Stage Axial Air Test Turbine with Numerical Comparisons”, Proc. of ASME Turbo Expo 2004 conf., paper presented by the first author in Vienna, Austria, GT 2004-53774.
II. Fridh, J., Fransson, T., Andersson, N-E., Magnusson, P., 2006. “Redundant Rotating Measurements in an Axial Cold Flow Test Turbine – Development and Procedure”, Proc. of the XVIII Symposium on Measuring Techniques in Turbomachinery Transonic and Supersonic Flow in Cascades and Turbomachines, Presented by the first author in Thessaloniki, Greece, September 2006, PAPER No: 18MTT09.
III. Fridh, J., Wikström, R., Fransson, T., 2007. “Dynamic Features of Partial Admission: Outcomes from Rotating Measurements”, Proc. of 7th European Conference on Turbomachinery Fluid Dynamics and Thermodynamics, pp. 451-462, Presented by the first author in Athens, Greece, March 2007.
IV. Fridh, J., Laumert, B., Fransson, T., 2011. “Forced Response in Axial Turbines under the Influence of Partial Admission”, Draft submitted to ASME Turbo Expo 2012, Copenhagen, Denmark, GT2012-68303
Contributions of the authors are as follows: Paper I: First author was main author; research idea, all experimental works and analysis were done by the first author. Second author performed the numerical computation. Third author acted as mentor for the numerical work and reviewer. Fourth author acted as reviewer. Paper II: First author was main author; research idea, all experimental works and analysis were done by the first author. The second author acted as reviewer and third and fourth authors as mentors regarding the instrumentation works. Paper III: First author was main author; research idea, all experimental works and analysis were done by the first author. The second author acted as mentor and reviewer and third author as reviewer. Paper IV: First author was main author; research idea, all experimental works and analysis were done by the first author. The second author acted as mentor and reviewer and third author as reviewer.

Page VI Doctoral Thesis / Jens Fridh
Other publications not included in this thesis
During the course of the study there have been some other articles and reports published that relate to the investigation presented in this thesis, either with the respondent as co-author or as main author. They are listed below in chronological order, section-wise. Reviewed conference and journal papers I. B. Hushmandi, N., Hu, J., Fridh, J., Fransson, T., 2007. ”Numerical Investigation of
Partial Admission Phenomena at Midspan of an Axial Steam Turbine”, Proc. of 7th European Conference on Turbomachinery, Fluid Dynamics and Thermodynamics, Athens, Greece, pp. 885-895.
II. B. Hushmandi, N., Hu, J., Fridh, J., Fransson, T., 2008. ”Numerical Study of
Unsteady Flow Phenomena in a Partial Admission Axial Steam Turbine”, Proc. of ASME Turbo Expo 2008, Berlin, Germany, GT2008-50538
III. B. Hushmandi, N., Fridh, J., Fransson, T., 2011. ”Unsteady Forces of Rotor Blades in Full and Partial Admission Turbines”, ASME Journal of Turbomachinery, Vol.133, Iss.4, 2011
Non-reviewed conference papers, poster/abstract IV. Vogt, D., Fridh, J., Fransson, T., 2008. ”Characterization and first application of a
thin-film electret unsteady pressure measurement technique”, Proc. of the XIX Symposium on Measuring Techniques in Turbomachinery Transonic and Supersonic Flow in Cascades and Turbomachines, Belgium, September 2008
V. Mironovs, A., Doronkins, P., Fridh, J., 2009. ”Modeling of variable aerodynamic forces in turbine Based on experimental data”, Proc. of the 12th International Symposium on Unsteady Aerodynamics, Aeroacoustics and Aeroelasticity of Turbomachines, London, England, 2009
Internal and technical reports VI. Fridh, J., 2001. “Efficient Steam Turbines for Small-Scale Energy Conversion Plants -
Literature survey”, Literature report, Report Nr. EKV 14/01, Div. of Heat and Power, Dept. of Energy Technology, Royal Institute of Technology (KTH), Sweden.
VII. Fridh, J., 2002. “Experiences from Through-Flow Calculations with SCAM-T for a
Two-stage Axial Turbine - The streamline curvature method”, Technical report, Report Nr. EKV 05/02, Div. of Heat and Power, Dept. of Energy Technology, Royal Institute of Technology (KTH), Sweden.
VIII. Fridh, J., 2002. “Experimental Configurations and Partial Admission - Experience
from 1D mean-line aerodynamic performance program AXIAL”, Technical report, Report Nr. EKV 09/02, Div. of Heat and Power, Dept. of Energy Technology, Royal Institute of Technology (KTH), Sweden.

Doctoral Thesis / Jens Fridh Page VII
IX. Fridh, J., 2003. “Partial Admission in Axial Turbines - A literature study on design,
control, aerodynamic flow and losses of partial admission”, Literature report, Report Nr. EKV 03/03, Div. of Heat and Power, Dept. of Energy Technology, Royal Institute of Technology (KTH), Sweden.
X. Fridh, J., 2003. “Calibration of pneumatic probes for the test turbine - Experience from probe calibration (probes 61&101) in a free stream jet”, Technical report, Report Nr. EKV 16/03, Div. of Heat and Power, Dept. of Energy Technology, Royal Institute of Technology (KTH), Sweden.
XI. Fridh, J., 2008. “Reference Tests of the Test Turbine - A Report on Reference Tests in the Test Turbine Performed in June-July 2007 and Comparisons with 2005 Measurements Related to the Moving of the HPT/KTH Laboratory”, Technical report, Report Nr. EKV 01/08, Div. of Heat and Power, Dept. of Energy Technology, Royal Institute of Technology (KTH), Sweden.
XII. Fridh, J., 2008. “High Frequency Vibration Trials in the Test Turbine - Outcome from a SUSPOWER project”, Technical report, Report Nr. EKV 09/08, Div. of Heat and Power, Dept. of Energy Technology, Royal Institute of Technology (KTH), Sweden.
XIII. Fridh, J., 2011. “Partial Admission in Axial Steam Turbines - A detailed experimental study”, Technical report, Report Nr. EKV 06/11, Div. of Heat and Power, Dept. of Energy Technology, Royal Institute of Technology (KTH), Sweden.
XIV. Fridh, J., 2011. “Forced Response in Axial Turbines Under Influence of Partial Admission”, Technical report, Report Nr. EKV 07/11, Div. of Heat and Power, Dept. of Energy Technology, Royal Institute of Technology (KTH), Sweden.

Page VIII Doctoral Thesis / Jens Fridh

Doctoral Thesis / Jens Fridh Page IX
ACKNOWLEDGEMENTS
This study has been financially supported by Swedish Energy Agency (contract No. P12457), Div. of Heat and Power Technology (HPT) at KTH and Siemens Industrial Turbomachinery AB (SIT). Their financial support has been a prerequisite for the existence of this study and is hereby gratefully acknowledged. Without the enduring support of skilled technicians an experimental study like this would not have been possible. Sincere gratitude is directed towards the technicians both at KTH and SIT AB: Rolf Bornhed (posthumously), Stellan Hedberg, Christer Blomqvist, Mikael Schullström, Leif Ruud, Lars Malmlöv, Leif Pettersson. I would like to thank Prof. Torsten Fransson, KTH, for giving me the opportunity to study at the Dept. of Energy Technology, and for his insistent belief in my capabilities to finally defend my thesis. Special thanks go to Lars Hedlund at SIT AB who gave me a great deal of encouragement and skillful technical guidance throughout the entire study, and Björn Laumert at HPT who encouraged me to pursue my Doctoral degree. There are many persons that in one or another way have been involved in my doings related to my somewhat long study period and that I am in gratitude to: Miroslav Petrov who have been my office roommate for many years and that have ever so intelligent enlightenments in a wide variety of issues, Prof. Emeritus László Hunyadi who thankfully lured me into the field of research, Rolf Wikström, Åke Göransson and Arne Karlsson at Siemens for fruitful discussions and their inexhaustible support, Per Almqvist for his many ideas followed by fruitful argumentations, Lars Atterhem and Bengt-Olof Näslund for their skilled views from the “user end”, Peter Magnusson for his encouragement and clever ideas, the entire Fluid Lab at SIT, Finspong, for a great collaboration throughout the years, the experimentalists at HPT and all my other colleagues at HPT for contributing to a creative working atmosphere. Thank You! Furthermore, I would like to thank the persons involved in all the other interesting research projects that I have participated in during the time period of my PhD studies, which has really broadened my perspective and view on technically challenging and interesting tasks; Esa Utriainen, Mats Annerfeldt, Sergey Shukin, Aleksey Mironovs, Pavel Doronkins, Yasa Tolga, Erik Prisell, Magnus Genrup, Prof. Boris Mamaev, Prof. Hannu Ollkonen and all the rest, you know who you are. Finally, I would like to direct a very special and personal message of gratitude from the bottom of my heart to my beloved wife Mikaela and our beautiful daughter Othilia, whom have supported me endlessly with love, regardless of late evenings and weekends at KTH during my study. I love you!

Page X Doctoral Thesis / Jens Fridh
Doctoral Thesis / Jens Fridh Page XI
TABLE OF CONTENTS
ABSTRACT ............................................................................................................................................ I
SAMMANFATTNING ....................................................................................................................... III
PREFACE ............................................................................................................................................. V
ACKNOWLEDGEMENTS ................................................................................................................ IX
TABLE OF CONTENTS .................................................................................................................... XI
LIST OF FIGURES .......................................................................................................................... XII
LIST OF TABLES ........................................................................................................................... XIII
NOMENCLATURE ........................................................................................................................... XV
1. INTRODUCTION ........................................................................................................................ 1
1.1 BACKGROUND ........................................................................................................................ 1 1.2 LITERATURE REVIEW ............................................................................................................. 4
1.2.1 Partial admission performance and flow field .................................................................. 4 1.2.2 Aerodynamic losses ........................................................................................................... 6 1.2.3 Partial admission losses .................................................................................................... 8 1.2.4 Unsteady blade forces ....................................................................................................... 9 1.2.5 Rotor forcing in partial admission turbines .................................................................... 11 1.2.6 Summary of Literature review ......................................................................................... 13
2. RESEARCH OUTLINE ............................................................................................................. 15
2.1 RESEARCH MOTIVATIONS .................................................................................................... 15 2.2 RESEARCH HYPOTHESES ...................................................................................................... 15 2.3 RESEARCH QUESTIONS ......................................................................................................... 15 2.4 OBJECTIVES OF THE THESIS .................................................................................................. 15 2.5 RESEARCH METHODS ........................................................................................................... 16 2.6 RESEARCH LIMITATIONS ...................................................................................................... 16
3. EXPERIMENTAL METHODS ................................................................................................ 17
3.1 A BRIEF DESCRIPTION OF THE TEST TURBINE ....................................................................... 17 3.2 STEADY MEASUREMENTS (PAPER I & APPENDICES A TO D) ............................................... 19 3.3 UNSTEADY MEASUREMENTS (PAPER II TO IV) .................................................................... 20
4. RESULTS .................................................................................................................................... 23
4.1 STEADY MEASUREMENTS (PAPER I & APPENDICES A TO D) ............................................... 23 4.2 UNSTEADY MEASUREMENTS (PAPER II TO IV) .................................................................... 29
5. SUMMARY AND CONCLUSIONS ......................................................................................... 33
6. FUTURE WORK ........................................................................................................................ 35
7. BIBLIOGRAPHY ....................................................................................................................... 37
APPENDIX A UNCERTAINTY ANALYSIS OF PERFORMANCE MEASUREMENTS ...... 43
APPENDIX B SECOND STAGE PERFORMANCE PENALTY ................................................ 53
APPENDIX C CIRCUMFERENTIAL REACTION DEGREE ................................................... 57
APPENDIX D AREA TRAVERSE MEASUREMENTS .............................................................. 59

Page XII Doctoral Thesis / Jens Fridh
LIST OF FIGURES
Figure 1-1: Typical steam turbine for district heating (two condensers). Courtesy of B+V Industrietechnik GmbH, Hamburg [B+V Industrietechnik, 2001] ................................................. 2
Figure 1-2: Control valves, typical arrangement. A sectional view in the turbine axis direction. Courtesy of B+V Industrietechnik GmbH, Hamburg [B+V Industrietechnik, 2001] ..................... 2
Figure 1-3: Simplified sketches showing two ways of throttling. Left-hand picture: Throttling by pressure reduction valve. Right-hand picture: Throttling by a control stage, i.e. partial admission. ....................................................................................................................................... 3
Figure 1-4: Illustrated emptying, pumping and filling processes for a partial admission stage ............ 4 Figure 1-5: Isentropic stage efficiency of an impulse control stage at 100% and 50% partial
admission (Traupel, 1977) .............................................................................................................. 4 Figure 1-6: Overall turbine efficiency at partial admission, Lewis (1993) ............................................ 4 Figure 1-7: View of flow structure through a blade row, adopted from Denton (2001) ........................ 6 Figure 1-8: Endwall vortex pattern, adopted from Langston (1980) ..................................................... 6 Figure 1-9: Blade forces at rotor entry into admission jet (ftp: tangential force partial admission, fxp:
axial force, ft: tangential force full admission). Adapted from Ohlsson (1962) ........................... 10 Figure 1-10: Aerodynamic force on one rotor blade during 10 blade passing periods (Fy: Tangential
blade force; Cax: Axial blade chord; P0: Total pressure at nozzle inlet; T: Time step; Tp: Blade passing period). Adopted from He (1997) .................................................................................... 10
Figure 1-11: Computed axial forces of first stage rotor blades @ ε = 0.762. Adopted from Hushmandi (2010) ........................................................................................................................ 11
Figure 1-12: Computed tangential forces of first stage rotor blades @ ε = 0.762. Adopted from Hushmandi (2010) ........................................................................................................................ 11
Figure 1-13: ZZENF diagram for a control stage, ε = 0.5 distributed over four admission arcs, NR=161, Wildheim (1979) ............................................................................................................ 12
Figure 1-14: General character of blade forces for partial admission, adopted from Pigott (1980) .. 12 Figure 1-15: A Campbell diagram, Srinivasan (1997) ......................................................................... 12 Figure 3-1: The test turbine facility (right-hand-side: stator and rotor discs assembled) ................... 17 Figure 3-2: The air supply layout with main measurement setup ........................................................ 17 Figure 3-3: The test object (two stage configuration) .......................................................................... 18 Figure 4-1: Efficiency trends, solid lines: two-stage efficiency, dashed lines: single stage efficiency. 23 Figure 4-2: Second stage penalty loss due to partial admission. ......................................................... 24 Figure 4-3: Wall pressures, ε = 0.762 .................................................................................................. 25 Figure 4-4: Absolute flow angle at rotor exit, ...................................................................................... 25 Figure 4-5: Total temperature at turbine exit, ...................................................................................... 26 Figure 4-6: Reaction degree, ε = 0.762 ............................................................................................... 26 Figure 4-7: absolute flow angle at stator exit ....................................................................................... 26 Figure 4-8: Area averaged flow turning in rotor ................................................................................. 26 Figure 4-9: Span wise mass averaged loss for stator and rotor rows, respectively (full admission) ... 27 Figure 4-10: Top view, measurement stations 4 to 7. Area traverses regions - thick dashed lines. ..... 28 Figure 4-11: Circumferential stator loss at 80, 50 and 20% span, suction and pressure sided sector
ends compared with full admission (reference case). ................................................................... 28 Figure 4-12: Circumferential rotor loss at 80, 50 and 20% span, suction and pressure sided sector
ends compared with full admission (reference case). ................................................................... 29 Figure 4-13: Left-hand: ensemble average of relative total pressure at rotor entry. ........................... 30 Figure 4-14: ZZENF diagram - test turbine (Natural frequencies courtesy of Siemens Industrial
Turbomachinery AB).Zig-zag lines at design speed ..................................................................... 30 Figure 4-15: Qualitative forcing function at admission 76.2% (design speed 4450 rpm). Numerical
results adapted from Hushmandi (2010) ...................................................................................... 30 Figure 4-16: Campbell diagrams at two admission degrees (full & partial admission) ...................... 31

Doctoral Thesis / Jens Fridh Page XIII
LIST OF TABLES
Table 3-1: Test turbine characteristics (midspan) at design point, full admission ............................... 19 Table 3-2: Presented steady measurements .......................................................................................... 19 Table 3-3: Presented unsteady measurements ...................................................................................... 20 Table 4-1: Summary of observations of forcing and vibration response .............................................. 32

Page XIV Doctoral Thesis / Jens Fridh

Doctoral Thesis / Jens Fridh Page XV
NOMENCLATURE
Latin A area [m2] D diameter [m] Ma Mach number [-] H height [m] S pitch [m] z number of admission arcs [-] p pressure [Pa, kPa] p~ ensemble averaged pressure [Pa, kPa] p̂ pressure amplitude [Pa, kPa]
T absolute temperature [°K] t time [s] C blade chord [-] c absolute velocity [m/s] w relative velocity [m/s] w systematic uncertainty h specific enthalpy [J/kg] u blade speed [m/s] s specific entropy [J/(kg,K)] s random uncertainty, standard deviation m& mass flow [kg/s] M torque [Nm] n rotational speed, nodal diameter (0,1,2,…) [rpm], [-] N number of samples (1,2,3…) [-] Q generalized force [-] R reaction degree, gas constant [-], [J/(kg⋅K)]
Re Reynolds number υ
sS
Cc ⋅=Re
υR
RCw ⋅
=Re [-]
r radius [m] U total uncertainty Greek α absolute tangential flow angle [°] β relative tangential flow angle, diameter ratio (d/D) [°], [-] δ incremental length [m] ε admission fraction (0-1), expansion factor [-], [-] γ flow turning [°] η efficiency [-]
ϕ flow coefficient u
cax=ϕ [-]
κ ratio of specific heats [-] μ flow capacity coefficient ϕνμ ⋅= , dynamic viscosity [-], [kg⋅m/s]
ν isentropic velocity ratio sh
uΔ
=2
ν [-]

Page XVI Doctoral Thesis / Jens Fridh
νP Parson number (multistage velocity ratio) s
P h
u
Δ=
∑2
2
ν [-]
ρ density [kg/m3] Π pressure ratio [-] υ kinematic viscosity [m2/s] Ω angular velocity [1/s] ωn1,2,…, 11 eigenfrequencies (1 to 11) [Hz] ζ loss coefficient [-] ξ global loss coefficient (1 – η) [-]
ψ load coefficient 2
2u
hsΔ=ψ [-]
Subscripts avg average
ax axial direction
h, hub hub in inlet (measurement location 2) m mid-span N nozzle p partial admission r radial component / direction, or reversible R rotor rel, w relative frame of reference S stator s isentropic ss static-to-static condition t, tip tip ts total-to-static condition two-stage two-stage configuration, stage1+2 or “4ab” 02, 03,… 07 stagnation condition for respective measurement location 2, 3,….,7 static condition for respective measurement location Abbreviations CHP Combined Heat and Power EO Engine Order (Excitation Order) RO Resonance Order (vibration response) HPT Heat and Power Technology KTH Kungliga Tekniska Högskolan (Royal Institute of Technology) LE Leading Edge ND Nodal Diameter OD Outer Diameter PS Pressure Surface SS Suction Surface TE Trailing Edge ZZENF Zig-Zag-shaped Excitation lines in Nodal diameters vs. Frequency diagram 4a first stage in a single mode configuration 4b second stage in a single mode configuration 4ab two-stage configuration

Doctoral Thesis / Jens Fridh Page 1
1. INTRODUCTION
1.1 Background
Ever since the cradle of electrification in the late 19th century steam turbines have been the most dominant prime movers for electricity generation, in terms of installed capacity. A phase shift in the energy generation policies (worldwide) is noticeable. Up till the last decade the heat and power generation was driven by strong centralization and therefore the research and development was focused on large-scale units, but during recent decades a global understanding has been crystallized where the necessity of decentralized systems utilizing local “green” energy flows has become obvious, mainly in order to meet the demands for a future environmentally friendly energy conversion. Decentralization is an attractive scenario in the perspective of the Swedish transfer of electricity generation from nuclear to other options. Year 2007 Sweden had a total heat generation of approximately 47 TWh in the district-heating network, and out of these approximately 19 TWh were delivered by combined heat and power plants (CHP), which at the same time gave a total electricity generation of 7 TWh from which approximately 47% is generated out of renewable energy resources (Svensk Fjärrvärme, 2007). This gives an idea of the potential size of electricity generation from CHPs: hypothetically, if the entire district-heating demand is utilized as heat load in CHPs (with an assumed average electricity-to-heat ratio that is the same as of 2007) there is a built-in yearly capacity of electricity of approximately 10 TWh, which corresponds to approximately an annual average of electricity generation from 1.5 nuclear reactors in Sweden (Energy in Sweden, 2008). Furthermore, the enticements of generating electricity from renewable resources are growing stronger and stronger, year after year, not least depending on the share of “green” electricity certificates in relation to the total production that the producers are imposed to maintain (Energy in Sweden, 2008), and which is increased by the Swedish government on annual basis just in order to promote electricity generation from renewable resources. Moreover, the certificates provide commercial mechanisms for “green” electricity on the market, something that producers of “green” electricity can benefit from by trading certificates. Based on the abovementioned, a focus on small-scale options and their effectiveness seems logical and desired. The steam turbine is an important part of small-scale CHP and combined cycle plants for future de-centralized power generation, and it has not been thoroughly investigated in detail with the prerequisites of today. Here, small-scale is defined as turbines generating less than 25 MWel. The first admission stage in an industrial steam turbine is referred to as the control stage if partial admission is applied (see Figure 1-1), which has through history shown to be a cost effective option when rapid load changes are required. It is routinely applied on industrial steam turbines in CHP plants which frequently operate at part load (reduced mass flow) due to the fact that the district heating grid is used as a heat sink. The inlet steam flow is individually throttled with control valves (see Figure 1-2) into separate annular arcs of the first stator row (so-called partial admission). This results in jets which only occupy parts of the annulus, leaving the first stator row and entering the following rotor row. Traditionally, the first stage is of impulse design, i.e. the entire pressure drop for the stage is realized across the stator row. This leaves only a small circumferential pressure gradient after the stator so the spreading of the jets circumferentially may be attenuated.

Page 2 Doctoral Thesis / Jens Fridh
Figure 1-1: Typical steam turbine for district heating (two condensers). Courtesy of B+V Industrietechnik GmbH, Hamburg [B+V Industrietechnik, 2001]
Figure 1-2: Control valves, typical arrangement. A sectional view in the turbine axis direction. Courtesy of B+V Industrietechnik GmbH, Hamburg [B+V Industrietechnik, 2001] Partial admission applied as control stage yields high part load efficiency and high specific work output due to a maintained high inlet pressure for the turbine in the fully admitted sectors. The thermodynamics of partial admission can be explained by a comparison to simple throttling valve, as illustrated in Figure 1-3, where it is noted that the average entropy of the steam into the subsequent stage is lower for the control stage than for a simple throttling valve due to the maintained large pressure ratio across the open admission arcs. It must be stressed that the simplified explanation illustrated in Figure 1-3 is valid, efficiency-wise, as long as the additional losses caused by partial admission (explained further on) are less detrimental than
Control valves
Control stage Steam inlet
Multistage turbine
Extractions/exits
Actuator, hydraulic cylinder
By-pass valve
Four control valves; each one throttles steam into an individual admission arc.
Inlet steam

Doctoral Thesis / Jens Fridh Page 3
the loss in connection to throttling the entire mass flow. In practice, the final choice is a trade-off between these considerations.
Figure 1-3: Simplified sketches showing two ways of throttling. Left-hand picture: Throttling by pressure reduction valve. Right-hand picture: Throttling by a control stage, i.e. partial admission. Furthermore, partial admission is sometimes used in small-scale turbine stages to avoid short blades in order to reduce the tip leakage loss and losses induced by endwall flows. The physical size of the turbines has a great deal of importance for the isentropic turbine efficiency. Radial dimensions of turbine blades and flow channels are primarily a function of the volumetric flow rate throughout the machine, and consequently become reduced for small turbines. In an “ideal” machine where clearances, blade thickness and surface roughness could be held at a constant ratio to other geometrical parameters, the small size would have very little impact on turbine efficiency (according to similarity rules, only a decrease in Reynolds number may affect the losses). However, these ratios are presently not possible to practically uphold and consequently the losses become large for small machines. One way to prevent this is to increase the blades’ dimensions and hopefully decrease the total entropy production to energy input ratio (losses), and applying partial admission may achieve this. Although part load efficiency increases, there are three main particularities regarding partial admission turbines related to aerodynamics, thermodynamics and aeromechanics that need to be addressed. Firstly, there are special aerodynamic losses; pumping-, emptying- and filling losses attributed to the partial admission stage (e.g. control stage) here schematically illustrated in Figure 1-4. Secondly, in multistage turbines the downstream stages experience non-periodic flow around the periphery and substantial circumferential pressure gradients and flow angle variations that produce additional mixing losses. Thirdly, compared to full admission turbines, the forcing on downstream components is also circumferentially non-periodic with rapid load changes, especially for the rotor in the admission stage.
0 1
2
p0 p1
p2
s
h
0 Steam condition before the throttling valve
1 Steam condition before the first stage 2 Steam condition before the second stage
0 1
2a
2b
2c
p0 p1
p2
s
h
0 -> 1 Flow in the throttled valve 1 -> 2b Flow through a throttled segment of
the control stage 0 -> 2a Flow through a fully opened segment
of the control stage 2c Steam condition into the second
stage

Page 4 Doctoral Thesis / Jens Fridh
Figure 1-4: Illustrated emptying, pumping and filling processes for a partial admission stage
1.2 Literature review
1.2.1 Partial admission performance and flow field
Several works on partial admission performance have been performed and in principal all efficiency plots show about the same tendency, which is illustrated for changing number of admission arcs in figure 1-5, adopted from Traupel (1977). The y-axis states the isentropic stage efficiency and the x-axis states the velocity ratio (ratio of blade speed to isentropic fluid velocity through the stage). Curve “1/1” corresponds to full admission and “a” to “e” corresponds to different admission arc configurations shown on the right-hand side. Figure 1-5 shows that “a” has a higher efficiency than “b” as regards to only the control stage. This is not quite justified when considering the overall efficiency of a multistage turbine. Stodola (1927), Klassen (1968), Schumacher (1973) and Roelke (1973) among others also performed performance studies on partial admission. Figure 1-6 shows typical efficiency trends for a decreased admission degree from Lewis (1993) for a 4-stage turbine, here plotted against the total to total isentropic velocity ratio.
The explanation for the decrease of optimum velocity ratio as admission degree decreases is here adapted from Roelke (1973). The aerodynamic efficiency of the turbine is a maximum at
Figure 1-5: Isentropic stage efficiency of an
impulse control stage at 100% and 50% partial admission (Traupel, 1977)
Figure 1-6: Overall turbine efficiency at partial admission, Lewis (1993)
pumpingemptying filling
flow blockage

Doctoral Thesis / Jens Fridh Page 5
the designed optimum velocity ratio (e.g. about 0.38 in Figure 1-6), irrespective of admission degree, and decreases with decreasing blade speed. Pumping and disc friction losses that decrease with decreasing blade speed, become a larger part of the gross aerodynamic loss as admission fraction decreases. Hence, as admission degree is reduced, the maximum net output power, which is the aerodynamic power minus the pumping and disc friction power, is obtained at lower velocity ratios. Macchi and Lozza (1985) developed a correlation (based on incompressible flow) that serves as an aerodynamic design tool which enables selecting whether or not to use a partial admission stage and selecting the optimum degree of admission at design point. Partial admission as a design option is beneficial to use for full admission stages with low specific speeds and low volume flow rates. The reason for the greater efficiency at low specific speeds is explained by the relative decrease of end-wall and tip leakage losses due to the increased blade height when partial admission is applied. Machi and Lozza defined the specific speed (Ns) as follows: 4/3
souts hVN ΔΩ= & where outV& is the exit volume flow rate in m3/s. Traupel’s loss correlation (1977) for the partial admission losses was employed in the correlation. Skopek et al. (1999) investigate partial admission numerically and experimentally in a one-stage axial turbine. They point out the strong impact the axial clearance δax (distance between stator and rotor row) has on the aerodynamic performance of the turbine, i.e. the importance of keeping the δax/Dh small. Here Dh is the hub diameter. The circumferential pressure gradients in partial admission turbines were experimentally investigated by Lewis (1993) in a multistage environment. According to Lewis the circumferential pressure distortion due to partial admission was rapidly attenuated for all test cases with the two front stages operating significantly off-design and the two rear stages less affected. Lewis concludes that the influence of partial admission on a downstream high-pressure reaction turbine can be substantial especially if the control stage is closely located to the high-pressure turbine. In addition, the use of several flow segments is preferable to a single arc of admission for a multistage turbine where He (1997) confirmed and strengthened this observation with outcomes from unsteady two-dimensional viscous computations. Wakeley and Potts (1997) numerically investigate the effects of partial admission by using a multistage, multipassage, unsteady 2D Navier-Stokes solver called VIB2D, the same one used by He (1997). The numerical results in general confirm the results presented by Lewis (1993) and He (1997). Wakeley and Potts further stress the circumferential gradients of the inlet mass flow where the inlet nozzles closest to the sector end where rotor exits the admission jet experience a higher mass flow because of the lower exit static pressure at stator trailing edges. Bohn and Funke (2003) studied the flow and temperature equalization in detail for a 4-stage reaction turbine driven by compressed air. Most of the flow equalization is found to occur within the first stage of the multistage turbine (downstream the impulse control stage) for which the guide vane is the main driver, and the temperature distortion does not attenuate significantly throughout the multistage section. The static pressure equalizes quickly in the circumferential direction driven by impulse exchange effects, and the flow inhomogeneity moves axially through the 4-stage turbine. The temperature inhomogeneity moves in rotating direction throughout the multistage turbine, following the theoretical particle tracking based on representative velocity triangles. Swirl effects seem to have no influence on the inhomogeneity.

Page 6 Doctoral Thesis / Jens Fridh
Results from Hushmandi (2010) stress the importance of simulating cavity flows when modeling a partial admission turbine. The cavities between stator and rotor in the investigated low reaction test turbine (same turbine as in this thesis) showed to take a significant part in the flow equalization process, even for the downstream stage.
1.2.2 Aerodynamic losses
A major part of the research regarding partial admission since 1960 has focused on loss correlations and aerodynamic performance investigations. In order to present the material in a logical order, the complex secondary flow features and loss mechanisms observed in axial turbines will first be reviewed briefly. The endwall losses represent a substantial part of the total aerodynamic losses in a stator or blade row, even as high as 30-50% according to Sharma and Butler (1987). A schematic view of the flow structure in a turbine cascade is suggested by Denton (2001) and shown in Figure 1-7. One way to decrease the total loss in small-scale turbines is to apply partial admission, i.e. block nozzle segments, to enable increased turbine blade height and thereby decrease the endwall loss. The secondary flows are the result of the endwall (hub and casing) boundary layers entering the turbine cascade that encounters and separates across the leading edges of the blades/vanes. Sieverding (1985) gives an extensive review of secondary (endwall) flow up until 1985 and Langston (2001) from 1985 until 2001. A simplified three-dimensional flow picture of cascade flow suggested by Langston (1980) is shown in Figure 1-8. The secondary flows show very complex flow pattern, which involves vortices with strong three-dimensionality and for stages with short blades this may result in the entire row annulus being occupied by secondary flows, thus creating very high endwall losses. The inlet boundary layer separates at the leading edge saddle point of the blade/vane and forms the so-called horseshoe vortex; the pressure-side leg moves towards the suction side of neighboring blade in the passage due to the tangential pressure gradient and becomes the passage vortex. The viscous free shear layer friction between the high momentum mainstream flow and the low momentum boundary layer determines the direction of rotation of the passage vortex. The suction-side leg Langston labels as the counter vortex and it rotates in the opposite direction to the larger passage vortex, similar to a small cogwheel driven by a larger (passage vortex) cogwheel.
Figure 1-7: View of flow structure through a blade row, adopted from Denton (2001)
Figure 1-8: Endwall vortex pattern, adopted from Langston (1980)

Doctoral Thesis / Jens Fridh Page 7
The basic thermodynamic processes that contribute to the entropy generation are, according to Denton (1993):
• Viscous friction in either boundary layers or free shear layers. The latter include the mixing process in, for example, a leakage jet, secondary flows etc.
• Heat transfer across finite temperature differences, for example, from the mainstream flow to a coolant flow.
• Non-equilibrium processes, for example, those that occur in rapid expansions or shock waves.
For small-scale steam turbines the viscous effects and non-equilibrium processes play the most vital role for entropy generation. Additionally, significant heat transfer occurs across flow shear layers with different temperatures and will play an important role if there are large cavity flows, e.g. blockage steam flows, or coolant flows. For small-scale partial admission steam turbines some of the main contributing sources for the entropy generation are:
• Mixing processes between main flow and leakage flows (e.g. tip leakage) or boundary layer flows, e.g. blade wake or endwall (secondary) flow.
• Mixing processes between full-admitted flow and partially admitted flow. • Non-equilibrium process across the partial admission control stage. • Viscous friction in free shear layers.
In order to simplify, one can break down the total loss into a number of losses, each loss related to a representative part of the turbine. The classical breakdowns of the total aerodynamic flow loss in a turbine cascade are profile loss, endwall loss and tip leakage loss. The endwall losses are generated within the endwall boundary layer flow and by the complex secondary flow patterns presented earlier. However, these are not independent of each other and there exists an interaction between all of them. Especially the endwall losses and the tip leakage losses may interact strongly, for example the dependence is very different whether shrouded or un-shrouded blades are considered, Denton (1993). The profile loss is often described as the total entropy generated within the laminar and turbulent blade boundary layer and in the viscous and turbulent interaction between the main flow and the blade boundary layer (including the wake). The magnitude of the profile losses is mainly dependent on the free stream velocity, blade roughness, Reynolds number and surface area, Wei (2000). In these simple descriptions of losses the trailing edge loss and shock losses are considered to be included in the profile loss. Two-dimensional theory states the following: if the inlet and exit flow angles are known, and by systematically varying the surface velocity distribution an optimum pitch to chord ratio and minimum profile loss can be estimated, Denton (1993). Zweifel (1945) suggests a rule for choice of optimum pitch to chord ratio, which essentially states that the ratio of the actual to an “ideal” tangential blade loading has a certain constant value for minimum losses. The mixing between the leakage flow over blade tips, or blade shrouds, and the main flow creates entropy and is generally referred to as tip leakage loss. The endwall loss is the total entropy generated by mixing and interaction between the main flow and the very complex secondary flow originating from the endwall (hub and casing) boundary layers entering the blade or vane row as described above. Several loss models that try to interpret and describe the losses in turbines have been presented over the past years and Wei (2000) summarizes extensively most of the existing

Page 8 Doctoral Thesis / Jens Fridh
ones for axial flow turbines and makes comparisons between them applied on five different turbine stages.
1.2.3 Partial admission losses
In the control stage of a small steam turbine the flow is only admitted to certain segments (arcs) of the first stator row, which results in jets that only occupy parts of the annulus (see figure 1-4). The rotor passages entering and leaving the jets are in an unsteady flow and will induce additional entropy increase. In order to exemplify, Denton (1993) considers a turbine with these non-uniform and unsteady flow phenomena, which occur in the following rotor and stator rows after the partially admitted stator row: if the static pressure is, for the sake of simplicity, assumed to be uniform after the second stator row, there must be a heavy mixing of jets and redistribution of the flow before the second stator row, which induces a large entropy increase. This occurs because there exists a strong circumferential pressure gradient at the second stator inlet due to the inhomogeneous flow (some segments have full flow resulting in large pressure drops across the stator while other have low flow resulting in little pressure drop). Partial admission losses can be broken down into pumping loss, filling loss and emptying loss. The pumping loss refers to the pumping in the inactive blade channels rotating in a fluid-filled casing. The losses that originate from the filling and emptying of the rotor passages as the blades pass through the active sector are sometimes combined and referred to as sector loss. Independent researchers have found the pumping power loss to be proportional to the cube of blade speed [Stodola (1927), Traupel (1977), Roelke (1973)]. Roelke presents an empirical relationship (in-line with Stodola’s (1927) findings) for estimating the pumping power loss according to Eq. 1, though Roelke stresses that the effects of blade height and diameter on the pumping power loss are quite uncertain. Furthermore, the type and design of obstructions (adjacent blade rows, casing wall, etc.) were only accounted for the tested cases in the empirical loss coefficient (Kp). Hence, Roelke concludes that a generally applicable expression for pumping power loss is yet to be found.
( )ερ −⋅⋅⋅⋅= 15.13mRmavgpp DHuKP (1)
Here, Pp pumping power loss [W] Kp pumping power loss coefficient [1/m1/2] um Blade speed at midspan [m/s] HR Blade height [m] Dm Diameter at midspan [m] ρavg Average density [kg/m3] ε Active fraction of stator exit area [-] If the disc friction loss is excluded, the pumping power loss coefficient, Kp, is found to be 5.92 [m-1/2]. The sector loss, associated with the emptying and filling of rotor passages as the blades pass by the active stator arc, is found to be
w
swp
KKK
+⋅+
=1
1η
η (2)

Doctoral Thesis / Jens Fridh Page 9
where Ks is a loss coefficient representing the decrease of the momentum of the fluid passing through the rotor compared to the available energy of the fluid. Adapted from Stenning (1953) this loss coefficient is
⎟⎟⎠
⎞⎜⎜⎝
⎛−=
επ m
Rs D
SK
31 (3)
and should be multiplied by the rotor exit momentum. Thus, this indicates that a partial admission rotor should have closely spaced blades to reduce sector losses. On the other hand, the more blades added to the rotor the higher profile loss. Furthermore, Roelke points out that the effect of number of blades on the pumping loss is not known. Other parameters included are: η efficiency of full-admission turbine ηp efficiency of partial-admission turbine Kw exit-to-inlet relative velocity ratio (wex/win) SR rotor blade pitch Traupel (1977) derives a loss coefficient for partial admission losses (ζp) referred to the control stage or admission stage, here adapted into Eq. 4, where the left-hand term represents the pumping loss and the right-hand term represents the sector loss (filling- and emptying loss).
m
Raxpp D
CzC ,21.01⋅
⋅+
−⋅≈
ψεεϕψεζ (4)
Here, Cp is an empirical constant depending on partial admission design where a so-called ventilation plate on the TE of the stator would typically reduce the pumping loss. z is the number of admission arcs, Cax,R is the axial chord of the rotor blade and Dm the midspan diameter of the rotor wheel, i.e. a small number of admission arcs and a large diameter combined with a small axial chord of the rotor blade at a given pitch-to-chord ratio is to prefer in order to reach low partial admission losses. Traupel does point out that the formula differs somewhat from the findings reported by Schumacher (1973), but the difference is not considered crucial.
1.2.4 Unsteady blade forces
Partial admission creates circumferentially non-periodic flow with large dynamic pressure amplitudes at the inlet to the first rotor. This result in specific blade forces in addition to the stator-rotor interaction that for full admission turbines can be assumed periodic. Ohlsson (1962) was among the first to address the unsteady blade forces in partial admission turbines. Ohlsson presents a simplified unsteady-inviscid-incompressible analytical approach regarding the performance and rotor-exit and -entry forces of small scale partial admission turbines (impulse design). Ohlsson finds the axial distance between stator and rotor to have an influence on the efficiency. The axial length of the rotor blade has significant impact on the efficiency and should be kept as small as possible. The axial force magnitude is very sensitive to flow angle variations. Figure 1-9 shows the normalized axial and tangential forces close to
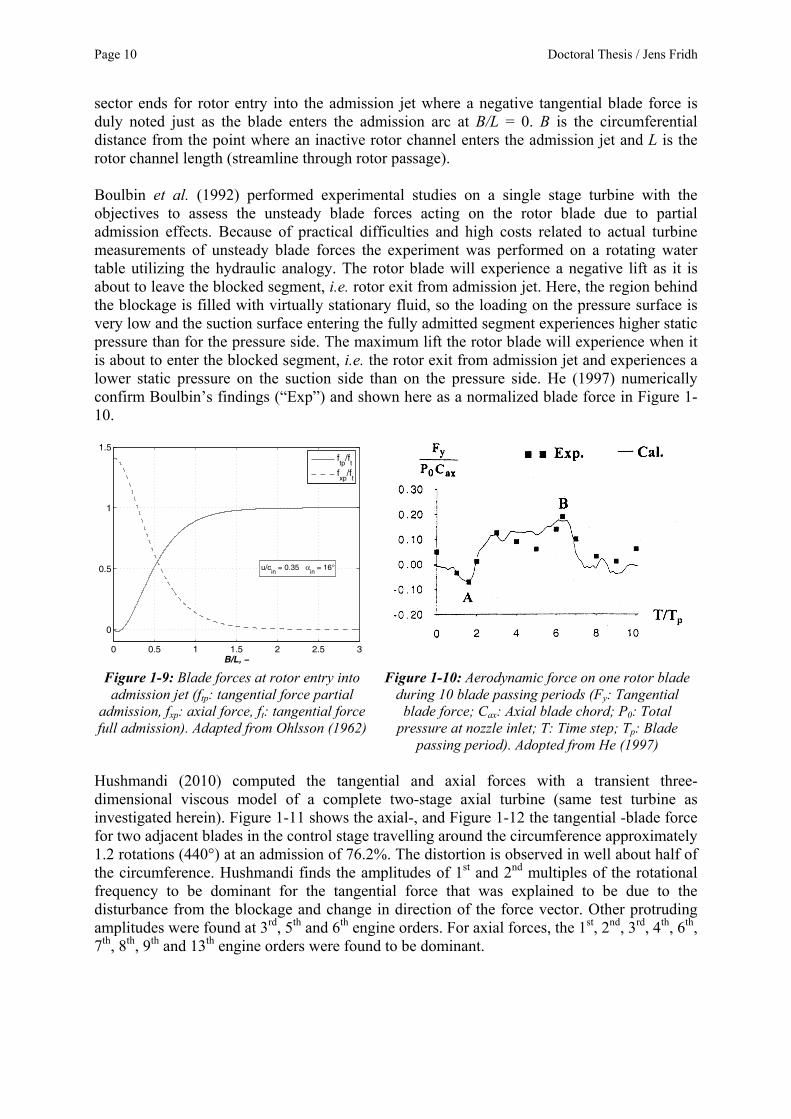
Page 10 Doctoral Thesis / Jens Fridh
sector ends for rotor entry into the admission jet where a negative tangential blade force is duly noted just as the blade enters the admission arc at B/L = 0. B is the circumferential distance from the point where an inactive rotor channel enters the admission jet and L is the rotor channel length (streamline through rotor passage). Boulbin et al. (1992) performed experimental studies on a single stage turbine with the objectives to assess the unsteady blade forces acting on the rotor blade due to partial admission effects. Because of practical difficulties and high costs related to actual turbine measurements of unsteady blade forces the experiment was performed on a rotating water table utilizing the hydraulic analogy. The rotor blade will experience a negative lift as it is about to leave the blocked segment, i.e. rotor exit from admission jet. Here, the region behind the blockage is filled with virtually stationary fluid, so the loading on the pressure surface is very low and the suction surface entering the fully admitted segment experiences higher static pressure than for the pressure side. The maximum lift the rotor blade will experience when it is about to enter the blocked segment, i.e. the rotor exit from admission jet and experiences a lower static pressure on the suction side than on the pressure side. He (1997) numerically confirm Boulbin’s findings (“Exp”) and shown here as a normalized blade force in Figure 1-10.
Hushmandi (2010) computed the tangential and axial forces with a transient three-dimensional viscous model of a complete two-stage axial turbine (same test turbine as investigated herein). Figure 1-11 shows the axial-, and Figure 1-12 the tangential -blade force for two adjacent blades in the control stage travelling around the circumference approximately 1.2 rotations (440°) at an admission of 76.2%. The distortion is observed in well about half of the circumference. Hushmandi finds the amplitudes of 1st and 2nd multiples of the rotational frequency to be dominant for the tangential force that was explained to be due to the disturbance from the blockage and change in direction of the force vector. Other protruding amplitudes were found at 3rd, 5th and 6th engine orders. For axial forces, the 1st, 2nd, 3rd, 4th, 6th, 7th, 8th, 9th and 13th engine orders were found to be dominant.
0 0.5 1 1.5 2 2.5 3
0
0.5
1
1.5
B/L, −
u/cin
= 0.35 αin
= 16°
ftp
/ft
fxp
/ft
Figure 1-9: Blade forces at rotor entry into admission jet (ftp: tangential force partial
admission, fxp: axial force, ft: tangential force full admission). Adapted from Ohlsson (1962)
Figure 1-10: Aerodynamic force on one rotor blade during 10 blade passing periods (Fy: Tangential
blade force; Cax: Axial blade chord; P0: Total pressure at nozzle inlet; T: Time step; Tp: Blade
passing period). Adopted from He (1997)

Doctoral Thesis / Jens Fridh Page 11
1.2.5 Rotor forcing in partial admission turbines
In order to investigate the mechanical effects from unsteady blade forces generated by partial admission an aeromechanical approach with forced response analysis is necessary. Such study for partial admission turbines is very sparsely found in the open literature. Wildheim (1979) numerically investigates rotor disc forcing for a partial admission turbine with a simplified forcing function, Figure 1-13. He excludes blade exit and entry transients and the excitation is regarded as a sum of sinusoidal varying force distributions in intervals separated with a phase angle, representative for the angle in-between the admission arcs. Wildheim introduces a design tool, the ZZENF diagram as a complement to the Campbell diagrams commonly used and explained further on. In the ZZENF diagram the dominant excitation components will lie along the zig-zag shaped excitation lines and if located close to any eigenfrequency a potential resonance situation exists. The resonance conditions in Eq. 5 define the zig-zag lines. Intersections with any eigenfrequency bare potential resonance.
( ) Ω⋅±= nkN Rnω where k = 0, 1, 2,… (5) Pigott (1980) provides a comprehensive theoretical description of blade forcing for partial admission where he applies the principal of superposition by assuming a tuned linear system with each blade group represented as lumped masses connected with mass elastic beams connected to a rigid disc, and neglectable damping during the loading/unloading period. Thus, the stator wake excitation and shock loading at emptying/filling are treated separately as shown schematically in Figure 1-14, where e.g. the length B is dependent on the rotating blade pitch and amplitude and A is coupled to unloading time and pressure ratio. Pigott found that the shock amplification was independent of the degree of admission. The severity of the transient is strongly coupled to the time of loading/unloading and the cycle length (natural periods) of the blade’s eigenfrequency in question.
0 40 80 120 160 200 240 280 320 360 400 440-0.08
-0.06
-0.04
-0.02
0
0.02
0.04
Circumferential Angle (deg)
(FX –
FX,
ave) /
P0,
in L
2
Rotational Direction
0 40 80 120 160 200 240 280 320 360 400 440-0.1
-0.08
-0.06
-0.04
-0.02
0
0.02
0.04
0.06
Circumferential Angle (deg)
(FT –
FT,
ave) /
P0,
in L
2
Rotational Direction
Figure 1-11: Computed axial forces of first stage rotor blades @ ε = 0.762. Adopted from
Hushmandi (2010)
Figure 1-12: Computed tangential forces of first stage rotor blades @ ε = 0.762. Adopted from
Hushmandi (2010)

Page 12 Doctoral Thesis / Jens Fridh
A common design tool used to map and illustrate forced response situations is the Campbell diagram where resonance frequencies and their proximity to each others can be examined (frequency vs. speed), exemplified in Figure 1-15 taken from Srinivasan (1997). The eigenfrequencies of a bladed disk assembly are either measured or calculated and plotted in the diagram (here seen as nearly horizontal lines) and can represent any circumferential wave number (nodal diameter) or radial wave number (nodal circle). The intersections between eigenfrequencies and engine order (EO) lines, i.e. rotational multiples, are potential resonance locations (speeds) where forced response is undesirable, Srinivasan (1997).
Figure 1-15: A Campbell diagram, Srinivasan (1997)
Figure 1-13: ZZENF diagram for a control stage, ε = 0.5 distributed over four
admission arcs, NR=161, Wildheim (1979)
Figure 1-14: General character of blade forces for partial admission, adopted from Pigott
(1980)

Doctoral Thesis / Jens Fridh Page 13
Far from all of the crossings is life threatening and it is virtually impossible to avoid all of them in a typical operating range of a turbine rotor. However, if any combination of stimuli (exciting force impulses) occurs near any of the EO-eigenfrequency crossings there is an increased risk of resonant vibration that may lead to high cycle fatigue (HCF) incidents. Although Srinivasan (1997) does not discuss forced response/vibration from partial admission explicitly, he provides an extensive and thorough summary of flutter and vibration response issues. One challenge is the HFC problems and to accurately estimate aerodynamic forcing functions that relies upon extensive experimental data.
1.2.6 Summary of Literature review
The performance of partial admission turbines have been investigated and published in several studies, stretching from 1920’s and forth, which mainly show similar tendencies. The found loss correlations in literature give some general aerodynamical design aspects for partial admission turbines, e.g. low flow coefficient and rather many blades on a large diameter with short axial chord should be strived for. If high efficiency of the control stage is sought, few admission arcs and an impulse design should be used. Considering a multistage turbine downstream of the control stage, an increased number of admission arcs at a given admission degree is promoting an earlier mixing and results in increased efficiency of the downstream stages compared to fewer admission arcs. However, generally applicable loss correlations are still lacking. For instance, there is no correlation taking the aspect ratio or the blade height into account for the filling and emptying loss and no clear design approach regarding optimum pitch-to-chord ratio. Also, there lies a great uncertainty in the empirical coefficients used that are as contradictory as the number of loss correlations. Analytical approaches like Ohlsson’s (1962) can be helpful for the general physical understanding. However, care should be taken considering the applied assumptions, e.g. flow angle variations will influence not only the time of filling/emptying and forces (blade loading) but also may directly impact the design approach when choosing optimum pitch to chord ratio due to the strongly varying flow angles adjacent to the admission sector ends. Towards the end of 20th and beginning of 21st century much research has largely been directed towards the, until that time unexplored, unsteady flows in partial admission. Increased computational possibilities and advances in miniaturized measurement technology have made that possible. More and more advanced numerical models have given valuable insight into the locations of loss creation, e.g. the significance of the filling loss compared to the emptying loss and the influence that cavity flows in reaction turbines have on the flow equalization. One important contribution is the increased details known about the unsteady blade forces that can lead to enhanced rotor forcing functions which is a prerequisite for a continued forced response analysis. Up until present time, not much has been found in the open literature regarding forced response or rotor forcing with respect to partial admission. The circumferential extension of transients and its amplitudes at rotor emptying and filling are closely coupled to the blade pitch and time of emptying/filling at a given overall blade loading.

Page 14 Doctoral Thesis / Jens Fridh

Doctoral Thesis / Jens Fridh Page 15
2. RESEARCH OUTLINE
The purpose of this section is to state the essential key questions, hypotheses, motivations and applicability of the presented research activities and results.
2.1 Research motivations
(i) High cycle fatigue due to unforeseen excitation frequencies or due to underestimated force magnitudes, or a combination of both causes control stage breakdowns for steam turbines.
(ii) Although general explanations for partial admission losses exist in open literature, details and loss mechanisms have not been addressed in the same extent as for other sources of losses in full admission turbines, and generally applicable loss correlations for partial admission are still lacking in open literature.
2.2 Research hypotheses
(i) A rotor forcing study based on experimental data will provide an extended design toolbox for control stage design criteria.
(ii) With detailed and versatile flow measurements new insight will be provided to the field of partial admission and raise the possibility to re-evaluate the physical understanding and thereby improve loss predictions and aerodynamic design criteria.
2.3 Research questions
(i) What are the nature and impacts of unsteady forces from partial admission onto the control stage rotor in an axial turbine?
(ii) What are the main underlying physical phenomena of partial admission losses and their relative sizes (pumping-, filling-, emptying- and downstream stage penalty loss)?
2.4 Objectives of the thesis
The specific objectives of the thesis are: (i) To experimentally explore and determine performance and losses for a wide range of
partial admission configurations.
(ii) To perform a forced response analysis from experimental data for the axial test turbine presented herein in order to establish the forced response environment and identify particularities important for the design of control stages.
(iii) To establish a basis that in parts can be used as reference to set up partial admission design criteria.

Page 16 Doctoral Thesis / Jens Fridh
2.5 Research methods
In order to indentify, qualitatively and quantitatively, the steady partial admission losses, global performance and detailed aerodynamic probe measurements are performed for a large number of partial admission configurations. The partial admission is achieved by the design and use of aerodynamically shaped annular blocks immediately upstream of the stator vanes. Performance measurements are based on torque measurements and detailed flow investigations rely upon pneumatic probe measurements together with spatially fixed measurement points in the turbine flow path. An uncertainty analysis is performed to identify and determine major sources of measurement errors. To develop an understanding and quantification of control stage rotor forcing a test setup with rotating measurements (unsteady strain and pressure) on the control stage rotor in an axial test turbine is designed and commissioned. Static and dynamic calibrations are performed for the unsteady pressure transducers and impulse hammer tests to identify eigenfrequencies of the rotor disc assembly. In order to achieve a qualitative picture of unsteady rotor inlet pressure and rotor strains ensemble averaged analysis of a large number of cycles is performed. Comparisons with averaged unsteady flow computations (by Hushmandi, 2010) are performed to identify similarities and to verify results where applicable. Sweeps across relevant speed range are performed to establish data for forced response analysis. Profound literature surveys are conducted in order to learn from the past and to support research argumentations outlaid in the thesis. The greater part of the evaluation of experimental results is performed with the mathematical software Matlab® (version 7.8, R2009a).
2.6 Research limitations
A two-dimensional (blade-to-blade plane) approach is employed when studying unsteady phenomena; hence the underlying physics of filling and emptying are thereby discussed with this simplification. The research is limited to axial turbines with low design reaction degrees (about 15%); hence concrete conclusions are only valid for those types of turbines. Herein, the forced response study only concerns the general physical effects of partial admission observed in the test turbine. The nature of forced response in actual turbines with partial admission may be quite different.

Doctoral Thesis / Jens Fridh Page 17
3. EXPERIMENTAL METHODS
3.1 A brief description of the test turbine
The KTH Test Turbine facility is in operation since 1989 and was first described by Södergård et al. (1989). The turbine has interchangeable rotor and stator discs and can be equipped with up to three stages. A 1 MWel air compressor with a maximum pressure of 4 bars(a) and a nominal mass flow of 4.7 kg/s, drives the test turbine in an open air loop with a variable fill hydrokinetic dynamometer (water brake) to control the turbine speed. The air inlet temperature can be set between 30°C and 130°C. The torque is measured with a torque meter based on phase displacement between the two ends of a carefully calibrated torsion shaft. The air flows through a cooler, a condensate water separator, mass flow orifice and thereafter a settling chamber before it enters the turbine. It is possible to simulate both in and out leakage flows in the turbine, e.g. Lindqvist (2001) performed experiments concerning the endwall cavity flow effect on the temperature attenuation in the main flow path in a gas turbine. Figure 3-1 shows a picture of the test turbine with stator and rotor discs on the right-hand, and Figure 3-2 shows a scheme of the air supply and main measurement systems used.
Figure 3-1: The test turbine facility (right-hand-side: stator and rotor discs assembled)
Figure 3-2: The air supply layout with main measurement setup
Settling chamber
Test section
Torquemeter
Dynamometer
OUTLET

Page 18 Doctoral Thesis / Jens Fridh
The test object is shown in Figure 3-3 with axial measurement locations indicated. The turbine can be configured and tested in a two stage mode or with either stage individually. The partial admission is achieved by introducing aerodynamically shaped filling blocks of various circumferential lengths, depending on admission degree, which occupy a partial volume in the inlet annulus upstream the first stator row LE. Intercooled slip rings are used to transfer rotating signals from pressure transducers and strain gauges to the stationary frame of reference.
Figure 3-3: The test object (two stage configuration)
The turbine is of subsonic design with low reaction degree and has the main stage characteristics at design point (full admission) according to Table 3-1. Here the mean reaction (Rm) is based on the real enthalpy drops, and the Reynolds number on the true chord as a characteristic length. The scaled repetitive turbine stages are of high pressure steam turbine design. The stators have a small positive lean and there is an axis-symmetric endwall contouring at the casing. The entering stage in the turbine is not primarily designed for the purpose to act as a control stage, albeit the blade design is similar. Worth noting is the relatively large axial distance between stator and rotor row (0.4·CR,ax). The rotor blades have integral shroud platforms with two wires rolled in to form a continuous elastic shroud. The shroud platforms are at no load in contact but under higher centrifugal loads the edge contact is lost. Tangential gas load on the blade due to the rolled-in lacing wires produce slight elastic bending of the thin part of the shroud platform not covered by the airfoil. The strain caused by bending of the shroud platform and blade root fastening will be used as a measure for the blade gas load. However, it should be stressed that the blades are short and rigid and the gas load is very moderate. Further detailed descriptions of the test rig and instrumentation can be found in papers I to IV.
37.5 mm (1.476’’) FLOW
Inst
rum
en
ted
ro
tor
Slipring Unit
Filling block

Doctoral Thesis / Jens Fridh Page 19
3.2 Steady measurements (Paper I & Appendices A to D)
One of the most important parameters of a turbine is the stage efficiency. For the test turbine it can be determined either thermodynamically by measuring temperatures and pressures or mechanically by measuring the mass flow, pressures, inlet temperature and shaft power. Typically, the temperature drop is low for the test turbine and the outlet temperature measurements sparse. Hence, efficiency based on total temperature drop is very responsive to small changes in temperature, which in general is difficult to measure accurately especially over the entire exit plane. The torsion torque is acquired from phase displacement measurements by a torque meter and proven reliable and therefore used for the tests herein. The evaluated steady measurement trials presented in this thesis are summarized in Table 3-2. Table 3-2: Presented steady measurements Stage config. ε z Πss νss Comments Stage 1 1 1 1.23 0.27-0.70 Efficiency measurements Paper I Stage 2 1 1 1.23 0.27-0.70 Efficiency measurements Paper I, App. B Stage 1 + 2 1 1 1.51 0.27-0.70 Efficiency measurements Paper I, App. A-B Stage 2 0.762 1 1.23 0.27-0.60 Efficiency measurements Paper I, App. B Stage 2 0.524 1 1.23 0.27-0.60 Efficiency measurements Paper I, App. B Stage 2 0.524 2 1.23 0.27-0.60 Efficiency measurements Paper I, App. B Stage 2 0.286 1 1.23 0.27-0.60 Efficiency measurements Paper I, App. B Stage 1 + 2 0.762 1 1.51 0.27-0.70 Efficiency measurements Paper I, App. A-B Stage 1 + 2 0.524 1 1.51 0.27-0.70 Efficiency measurements Paper I, App. A-B Stage 1 + 2 0.524 2 1.51 0.27-0.70 Efficiency measurements Paper I, App. A-B Stage 1 + 2 0.286 1 1.51 0.27-0.70 Efficiency measurements Paper I, App. A-B Stage 1 + 2 0.762 1 1.51 0.475 Circumferential traverse Paper I, App. C Stage 2 1 1 1.23 0.425 Area traverse, losses App. D Stage 2 0.762 1 1.30 0.425 Area traverse, losses App. D Stage 1 + 2 denotes the two stage configuration. ε is the admission degree, z number of admission arcs, νss isentropic velocity ratio (static to static) and Πss is the static to static pressure ratio of the turbine
Table 3-1: Test turbine characteristics (midspan) at design point, full admission
Stage 1 Stage 2 Static pressure ratio Πss 1.22 1.23 Mean velocity ratio νts 0.47 0.47 Mean reaction Rm 0.16 0.17
Stator Rotor Stator Rotor Number of blades - 42 58 42 58 Hub diameter Dh (mm) 355 355 355 355 Tip-to-hub diameter ratio (Dt/Dh)TE 1.13 1.17 1.15 1.19 Pitch-to-chord ratio S/C 0.82 0.81 0.83 0.82 Aspect ratio HTE/C 0.67 1.18 0.77 1.32 Reynolds Number. Re,*105 4.3 2.0 3.9 1.8 Shaft speed n (rpm) - 4450 - 4450 Flow turning γ (°) 76 133 95 134 Relative Mach number at TE Maw 0.48 0.30 0.49 0.32

Page 20 Doctoral Thesis / Jens Fridh
The steady pressures are measured, with the atmospheric pressure as reference, by a set of PSI9010 modules in appropriate ranges, which are re-zeroed pre- and post-measurements in order to check for drift. The absolute temperature is measured with type-K thermocouples. A cold-junction unit with three PT100 resistive temperature sensors is used as temperature reference. Both pressures and temperatures are spatially averaged as well as time averaged. The sampling rate is 1 Hz. A standard orifice flange is employed for mass flow determination by calculation in accordance with ISO 5167-1 (1991) and ISO 5167-1, Amd.1 (1998). Uncertainties evaluated according to ISO/TR 5168 (1998) in appendix A. The flow field measurements are performed solely with in-house calibrated pneumatic probes according to appendix D.
3.3 Unsteady measurements (Paper II to IV)
In order to determine unsteady pressure and rotor forcing the rotor in the first stage is redundantly equipped with piezoresistive miniature absolute pressure transducers (individually excited) and semi conducting strain gauges with high gage factor (130.5). The pressure transducers are mounted in small protruding tubes at the leading edge on four evenly distributed blades aligned towards the average relative flow angle. The protruding tube is used in order to have a defined stagnation point at the rotor inlet. The strain gauges (eight in total) are mounted at accessible locations with high local strains based on strain analysis: on the blade root fastening and on the inner shroud surface at the axial location of the downstream lacing wire. The measured signals from the rotating system are transferred to the stationary system via intercooled slip rings without any pre-amplification. The pressure signals are subject to static and dynamic calibrations (papers II & III) and g-load calibration (paper IV). An ensemble average over a large number of cycles (typically 300 cycles) is used to study trends. For the forced response experiments sweeps throughout a speed range from 50 to 105% of the design speed are performed with a sweeping velocity of 14 turns per second while recording data in a broad band manner. Table 3-3 shows the test matrix of unsteady trials. Table 3-3: Presented unsteady measurements
Stage config. ε z open nozzles Πss νss Comments
Stage 1 + 2 0.762 1 32 1.51 0.475 Meas. techniques Paper II Stage 1 + 2 0.762 1 32 1.51 0.27-0.49 Ensemble average Paper III Stage 1 + 2 0.762 1 32 1.71 0.475 Ensemble average Paper III Stage 1 + 2 0.286 1 12 1.51 0.27-0.49 Ensemble average Paper III Stage 1 + 2 1 1 42 1.51 0.25-0.50 Rotor forcing study Paper IV Stage 1 + 2 0.762 1 32 1.51 0.25-0.50 Rotor forcing study Paper IV Stage 1 + 2 0.524 1 22 1.51 0.25-0.50 Rotor forcing study Paper IV Stage 1 + 2 0.286 1 12 1.51 0.25-0.50 Rotor forcing study Paper IV Stage 1 + 2 0.524 2 12+10 1.51 0.25-0.50 Rotor forcing study Paper IV Stage 1 + 2 0.524 2 6+16 1.51 0.25-0.50 Rotor forcing study Paper IV Stage 1 + 2 denotes the two stage configuration. ε is the admission degree, z number of admission arcs, νss isentropic velocity ratio (static to static) and Πss is the static to static pressure ratio of the turbine

Doctoral Thesis / Jens Fridh Page 21
An optical switch detecting on a tooth wheel is used to achieve the timing signal. A once-per-revolution reference mark (rotor-zero) on the rotor is aligned with the absolute machine zero position with the help of a laser before the measurements. The strain gauge signals are individually amplified using FYLDE dynamic (AC, balanced DC) strain gauge amplifiers with constant current supply, which have a frequency response of up to 50 kHz. A gain of approximately 150 is used to reach a 100 mV/μStrain output. The unsteady measurement signals are acquired by means of a digital high-speed data acquisition system (Kayser Threde KT8000), which also provides stabilized 10VDC excitation for the pressure transducers. The system has a 14 bit A/D conversion for each channel. The trials are performed with a gain of 50 for the pressure signals, no filtering and at a sampling rate of 100 kHz. The accuracy of the sensor for measuring the absolute pressure is determined to ±170 Pa taking into account the static and dynamic transfer characteristic of the sensor. The A/D conversion adds with ±30 Pa, taking into account the transfer characteristic of the sensor. The transfer characteristic adds with an average of ±50 Pa over the calibrated range, hence a total measurement accuracy of ±250 Pa for the total pressure measurements. For amplitude measurements of the unsteady pressure the corresponding total measurement accuracy is determined to ±120 Pa.

Page 22 Doctoral Thesis / Jens Fridh

Doctoral Thesis / Jens Fridh Page 23
4. RESULTS
4.1 Steady measurements (Paper I & Appendices A to D)
Figure 4-1 shows the total-to-static turbine efficiency versus the static-to-static velocity ratio. Both of the subsonic impulse high-pressure turbine stages have identical geometrical design except the blade height, i.e. repetitive stage design. Moreover, the optimum efficiency occurs at a rather high velocity ratio compared to traditional control stages due to the employed blade design. The efficiency peak appears at lower velocity ratios with reduced admission degree, as shown in Figure 4-1. The reasons are explained by Roelke (1973) as the pumping and disc friction losses which decrease with decreasing blade speed, become a larger part of the gross aerodynamic loss as admission arc decreases. The pumping loss is proportional to the blade speed raised to the third power, according to correlations presented by Stodola (1927), Klassen (1968) and Traupel (1977). He (1997) addressed the probable improvement of the overall performance for multistage turbines by using an increased number of admission arcs at a given admission rate. This enhances the tangential mixing further upstream and thereby facilitates an improved performance of downstream stages, although the performance of the control stage evidently decreases. This tendency is detectable in Figure 4-1 where the efficiency decrease is less going from one to two admission arcs, for the two-stage turbine at 52.4% admission, than for the single stage turbine. This is also confirmed by the second stage efficiency penalty study presented in appendix B where the second stage penalty loss is shown in Figure 4-2 as a percentage of the total partial admission loss. It is also noted in Figure 4-1 that the efficiency decrement between one and two admission arcs at the same admission degree does not seem to shift the maximum efficiency peak towards a lower velocity ratio, thus indicating that the loss is mainly related to the filling-emptying losses which is repeated with doubled number of sector-ends. An uncertainty analysis is performed for the efficiency measurements where random and systematic uncertainties are taken into account in a conservative manner as described in appendix A.
0.15 0.25 0.35 0.45 0.55 0.65 0.750.55
0.65
0.75
0.85
0.95
1.05
isentropic velocity ratio νstat−stat
no
rmal
ised
eff
icie
ncy
η/η
max
Figure 4-1: Efficiency trends, solid lines: two-stage efficiency, dashed lines: single stage efficiency.
ε = 0.286
ε = 0.524, 2 arcs
ε = 0.524
ε = 0.762
ε = 1.000

Page 24 Doctoral Thesis / Jens Fridh
0.3 0.35 0.4 0.45 0.5 0.55 0.6 0.65 0.70
5
10
15
20
25
30
35
νtwo stage
(stat−stat)
pen
alty
loss
in d
ow
nst
ream
sta
ge,
as
% o
f to
tal ε−l
oss
ε=0.762ε=0.524ε=0.524x2ε=0.286
Figure 4-2: Second stage penalty loss due to partial admission. Figure 4-3 shows the wall pressures (static) around the circumference for ε = 0.762. A very deep static pressure drop is noted related to the increase of fluid velocity as the fluid enters the cavity downstream of the blockage. Downstream of the blockage the effects from the trailing edges of the nozzles are clearly seen as local variations in static pressure when the fluid moves tangentially behind the blockage. The local static pressure maxima for the open nozzles are located in the main stream, while the local maxima behind the blockage seem to be shifted half a pitch and located downstream of the stator’s TEs. Bohn and Funke (2003) noted a more enhanced tangential pressure equalization downstream of the suction sided sector-end where the rotor exits the admission jet than downstream of the pressure sided sector-end, which is confirmed in this study. By studying the circumferential static pressure variation axially throughout the two-stage turbine it shows clearly that the strong variations seen immediately downstream of the blockage are almost entirely equalized after the second rotor. It can also be noted that the pressure wake after the blockage is moving almost axially through the turbine. A slight tangential shift of the wake opposite to the rotor direction can be noted downstream of the second stage, which is believed to be caused by the negative swirl downstream of the rotor (approximately -5° relative to the axial plane at the operating point for the second stage) and to the fact that the tangential momentum exchange effects are not as dominate downstream of the rotor as at the stator TEs where the velocity is high and almost tangential. The design absolute rotor exit flow angle (full admission) at the current operating point is about –17° (midspan) in measurement location 4 (see paper I or appendix D for denominations). In general, for the partial admission turbine the absolute flow angle decreases at the exit of the first stage that is more loaded and increases for the second stage that in turn is less loaded, compared to the full admission turbine. As readily noted in Figure 4-4 there are strong local variations in the region of the wake. In the region of rotor entry into the admission jet (~230°) a decrease in flow angle is noticed, which is probably related to the increased mass flow in the nozzle adjacent to the pressure sided sector-end. The mass flow in the nozzle adjacent to the blockage is approximately 15% higher than neighboring open nozzle, which is deduced from area traverse measurements downstream of the stator. Numerically the local increase in mass flow at rotor entry is shown by Wakeley and Potts (1997). In the region where the rotor exits from the admission jet (~100° to 125° the measured exit flow angle increases towards the sector end, probably due to a prompt angle

Doctoral Thesis / Jens Fridh Page 25
deflection at the rotor trailing edge and contributes to the pressure and flow equalization in the pressure wake. However, one important exception is a local decrease of flow angle at a relatively high dynamic pressure (circumferential angle≈130°). This is the result of the increased fluid velocity in the nozzles adjacent to the rotor exit from the admission jet that is, together with a more tangential stator exit angle responsible for the local peak in tangential rotor blade force that has been observed by various researchers, e.g. Boulbin et al. (1992) and He (1997).
0 60 120 180 240 300 3600.6
0.65
0.7
0.75
0.8
0.85
circumferential angle, °
p/p
02
p3,tip
p4,tip
p4,hub
0 60 120 180 240 300 360−60
−40
−20
0
20
40
60
circumferential angle, °
α 4, °
Figure 4-3: Wall pressures, ε = 0.762 Figure 4-4: Absolute flow angle at rotor exit, ε = 0.762
The temperature wake in contrast to the large pressure wake follows a theoretical particle trace (based on velocity triangles) throughout the turbine. Here shown in Figure 4-5 at the axial measurement location 7 where in the trails of rotor entry into the admission jet (where the least work has been extracted) appears as a very distinct rise in temperature. Although the absolute temperature level has attenuated somewhat due to the passage through the second rotor the appearance of the curve clearly indicates that work is extracted from the first rotor downstream of the blockage in conjunction with rotor exit from the admission jet. Due to the large circumferential gradients in partial admission turbines, the circumferential reaction degree is an unveiling indicator of the local off-design conditions around the circumference of the turbine stages (appendix C). Figure 4-6 shows the pressure based reaction degree for the two stages at hub and casing. Due to sparse measurement points at the hub in axial measurement location 3, the hub reaction degree of stage 1 shows some erratic behaviour far from blockage (e.g. 0° to 60°) and cannot be trusted to the same extent as the others. For the first stage the effective admission region is calculated considering the vane exit flow angle, and downstream of the blockage no meaningful reaction can be evaluated. Not surprisingly, there is a negative reaction in conjunction to when the rotor blade exits the admission arc, which locally creates adverse flow in the rotor passage as the passage has completely entered downstream of the blockage and locally experiences a higher pressure downstream of the. This is confirmed in numerical computations presented in paper I and by Hushmandi (2010). Thus, some downstream fluid is sucked into the rotor passage that virtually acts as a poor compressor until the pressure is equalized, which is a rather quick process (about one rotor passage) until the rotor enters the region of pumping. An interesting observation can be made regarding the second stage reaction degree: extending approximately five nozzles away from the sector ends there is no distinction between the hub and tip reactions indicating that either the nozzles and rotor passages are not yet filled and/or fluid near the hub is escaping into the stator-rotor cavity. Either way, a flow equalisation is present downstream of second stage’s
Ω
0°

Page 26 Doctoral Thesis / Jens Fridh
stator trailing edges. Downstream of the admission arc edges there is a significant raise in reaction that signifies a more axial incidence angle to the rotor. The elevated reaction at the hub in the shadow zone may indicate fluid entering from rotor-stator disc cavity and contributes to fill up the fluid deficit downstream of the blockage.
0 60 120 180 240 300 360286
288
290
292
294
296
298
300
302
304
306
circumferential angle, °
T07
, °K
15% span40% span60% span85% span
0 60 120 180 240 300 360−0.4
−0.3
−0.2
−0.1
0
0.1
0.2
0.3
0.4
circumferential angle, °
reac
tio
n d
egre
e, −
Stage1hub
Stage1tip
Stage2hub
Stage2tip
Figure 4-5: Total temperature at turbine exit, ε = 0.762
Figure 4-6: Reaction degree, ε = 0.762
In appendix D a detailed area flow field investigation can be found. As a reference case traverse measurements are performed for full admission of stage 2, operated in a single stage setup at corresponding flow geometry conditions (νss = 0.425) as for the first stage in a two-stage setup at an admission degree of 76.2%. Figure 4-7 shows the absolute flow angle 0.17⋅CS,ax downstream of the stator exit and Figure 4-8 the flow turning in the rotor. Two distinct flow turning peaks around 20 and 85% span are observed which depths compared to midspan are explained by the overturning caused by the major streamwise counter clockwise vortex at the hub and the clockwise at the tip rotating vortex. These vortices, which are influenced by the tangential pressure gradient between the nozzle pressure and suction side interact with the main flow and contribute to the local overturning. Interestingly, the local underturning at the hub (around 10% of span) is clearly observed compared to the barely visible local underturning at the tip (around 92-93% of span). This is believed to be due to the stator casing endwall contour that counteracts the streamwise growth of the passage vortex.
stator pitch, −
rad
ius,
mm
Abs. flow angle, α5 [°], ν
ss=0.427, Π
ss=1.23
hub
tip
−0.6 −0.4 −0.2 0 0.2 0.4 0.6175
180
185
190
195
200
205
55
60
65
70
75
80
105 110 115 120 125 130 135 1400
0.1
0.2
0.3
0.4
0.5
0.6
0.7
0.8
0.9
1Flow turning in rotor
turning γR, °
span
, −
Figure 4-7: absolute flow angle at stator exit Figure 4-8: Area averaged flow turning in rotor
SS PS

Doctoral Thesis / Jens Fridh Page 27
Figure 4-9 shows the mass averaged loss along the normalized span for the stator and rotor, respectively. The stator loss shows a typical trend at the hub where the effect of the endwall contra rotating vortices creates strong local loss gradients. At the casing no such effect is observed due to the affect the endwall contour together with the positive lean has on the flow. The trend of the rotor loss (decreasing) at high span is partly because of the radial extension of the flow channel and the stator endwall contour, thus the radial movement of fluid. High energy tip leakage flow also contributes to a lower rotor loss calculated close to the tip. However, the two dimensional probe calibrations limits the pitch sensitivity (radial flow angle) and close to the casing the flow may still have some pitch angle that would falsify the reconstruction of a correct total pressure, i.e. a too low value might be calculated that leads to an increase in the reconstructed static pressure, and consequently lower local velocities at rotor entry that would decrease the calculated local loss. There is a link between flow turning and ratio of inlet/outlet velocities for a cascade, which largely dictates the size of the endwall loss, according to correlations by Traupel (1977). The impact of this can be observed in the hub region (below 20% span) for the rotor where although the flow turning is reduced the velocity ratio between rotor inlet and exit is approaching unity, i.e. contributing to the increase of loss in that region.
0 0.05 0.1 0.15 0.2 0.25 0.3 0.35 0.40
0.1
0.2
0.3
0.4
0.5
0.6
0.7
0.8
0.9
1
ζN, −
span
, −
Mass averaged nozzle loss, νss
=0.427, Πss
=1.23
0 0.1 0.2 0.3 0.4 0.50
0.1
0.2
0.3
0.4
0.5
0.6
0.7
0.8
0.9
1
ζR, −
span
, −
Mass averaged rotor loss, νss
=0.428, Πss
=1.23
Figure 4-9: Span wise mass averaged loss for stator and rotor rows, respectively (full admission) The calculated stage efficiency from traverse measurements is 1.3% higher than the measured global efficiency (based on torque measurements) from global measurements but within the absolute uncertainty of the global measurements. Furthermore, one should be aware of the fact that the global measurements are between axial measurement location 4 and 7 and not 4 and 6 as in the traverse, which means that the mixing and wall friction losses downstream of the stage between stations 6 and 7 are included in the global stage efficiency. Figure 4-10 depicts the area traverses performed downstream of sector ends at partial admission ε = 0.762 and operating conditions corresponding to νss = 0.425 (appendix D). Although the absolute uncertainty in magnitude is greater for the partial admission case overall trends can be viewed upon in a qualitative sense. Below, in Figure 4-11 the circumferential stator loss is plotted at three radii (20, 50 and 80% span) for the suction sided and pressure sided sector end, on the left-hand and on the right-hand side respectively. It is compared with the measured loss for the reference case that here is from full admission trials with anticipatively similar flow geometry as for an undisturbed part, far from sector ends.

Page 28 Doctoral Thesis / Jens Fridh
Figure 4-10: Top view, measurement stations 4 to 7. Area traverses regions - thick dashed lines. A firm observation is the increased loss in the pressure sided sector end for 20 and 80% span at vane 3 (see right-hand sketch in Figure 4-10), not only in peak magnitude but also in width of the stator wake. Only the first open nozzle on the pressure side of the sector show noticeably deviating flow angles and mass flow compared to the reference case. Also on the suction side of the admission sector there are no signs that more than one nozzle contributes to the filling of the void immediately downstream of the blockage. Hence, a considerable amount of the redistribution of flow takes place downstream of the rotor row.
−18 −16 −14 −12 −10 −8 −6 −4 −2 00
0.1
0.2
0.3Cicumferential stator row loss − suction sided
−18 −16 −14 −12 −10 −8 −6 −4 −2 00
0.1
0.2
−18 −16 −14 −12 −10 −8 −6 −4 −2 00
0.1
0.2
cicunferential traverse θ, °
ζ N, −
−18 −16 −14 −12 −10 −8 −6 −4 −2 00
0.1
0.2
0.3Cicumferential stator row loss − pressure sided
−18 −16 −14 −12 −10 −8 −6 −4 −2 00
0.1
0.2
−18 −16 −14 −12 −10 −8 −6 −4 −2 00
0.1
0.2
cicunferential traverse θ, °
ζ N, −
ζN20%
ε = 1
ζN20%
ε = 0.762
ζN80%
ε = 1
ζN80%
ε = 0.762
ζN50%
ε = 1
ζN50%
ε = 0.762
Figure 4-11: Circumferential stator loss at 80, 50 and 20% span, suction and pressure sided sector ends compared with full admission (reference case).
On the contrary and not surprisingly, compared to the stator considerable loss attributes to the rotor at partial admission. Figure 4-12 shows the loss for the rotor at 20, 50 and 80% span. Important to remember here is that the traverse plane downstream of the rotor is in the same tangential location as the upstream traverse plane. Hence, due to fluid motion in the relative frame of reference the grid does not correspond to the fluid that passes through the upstream stator grid. For a pitch wise periodic flow (full admission) it is in general not an issue, however for a non-periodic flow such as partial admission it is indeed an issue. Based upon the averaged local axial velocity and blade speed, the average fluid particle movement is estimated to approximately 12° downstream of the pressure side of the blockage, which means that fluid passing by the major part of the traverse area downstream of the rotor
suction sided sector end, rotor exits admission jet
pressure sided sector end, rotor enters admission jet
blockage
-17° 0° Traverse
-17° 0° Traverse
1 23412 3 4

Doctoral Thesis / Jens Fridh Page 29
originates from the wake of the blockage, i.e. low momentum fluid. Regardless of the above it is logical to address this as a rotor filling loss and it seems to circumferentially stretch well over two stator pitches.
−18 −16 −14 −12 −10 −8 −6 −4 −2 00
0.2
0.4
0.6
Cicumferential rotor row loss − suction sided
−18 −16 −14 −12 −10 −8 −6 −4 −2 00
0.2
0.4
0.6
−18 −16 −14 −12 −10 −8 −6 −4 −2 00
0.2
0.4
0.6
cicunferential traverse θ, °
ζ R, −
−18 −16 −14 −12 −10 −8 −6 −4 −2 00
0.2
0.4
0.6
Cicumferential rotor row loss − pressure sided
−18 −16 −14 −12 −10 −8 −6 −4 −2 00
0.2
0.4
0.6
−18 −16 −14 −12 −10 −8 −6 −4 −2 00
0.2
0.4
0.6
cicunferential traverse θ, °
ζ R, −
ζR20%
ε = 1
ζR20%
ε = 0.762
ζR80%
ε = 1
ζR80%
ε = 0.762
ζR50%
ε = 1
ζR50%
ε = 0.762
Figure 4-12: Circumferential rotor loss at 80, 50 and 20% span, suction and pressure sided sector ends compared with full admission (reference case).
4.2 Unsteady measurements (Paper II to IV)
A redundant system for rotating measurements is designed and commissioned for the test turbine. Figure 4-13 shows the ensemble average value (>300 cycles) of the relative total pressure and the unsteadiness as a normal distribution with a 95% confidence interval around the circumference. The ensemble averaging of the relative unsteady total pressure with respect to the cycle period is given by Eq. 6 starting at a specified time point t0 and where N is the number of cycles and tΩ is the cycle time for one revolution. The circumferential casing static pressure deduced from steady measurements is also shown in Figure 4-13. The pressures are normalized with the inlet total pressure. The unsteadiness in the measured relative total pressure at midspan (0.06⋅CR,ax upstream of leading edge of the rotor) is observed to be largest downstream of the partial admission blockage on the border between emptying and pumping regions. However, the dynamic pressure is higher when the rotor enters the admission arc which makes pressure fluctuations more likely to increase the mixing losses.
∑=
Ω+=N
nrel nttxp
Ntxp
0003 ),(1),(~ (6)
Strain gauge results, on the right-hand side in Figure 4-13 show a high strain peak downstream of the suction side of the blockage, which is in line with findings in open literature regarding the tangential force. When reducing the shaft speed at constant pressure ratio, the dip in relative total pressure and the peak in tensile strain, that occur when a blade enters the blocked region, are shifted in the counter rotational direction. This is believed to reflect earlier emptying of the rotor blade channel. Furthermore, an increase of the flow capacity coefficient with a decrease of admission degree is observed in the trials (about 2% increase going from ε = 1 to ε = 0.286)

Page 30 Doctoral Thesis / Jens Fridh
p/p
0in
0 60 120 180 240 300 3600.6
0.65
0.7
0.75
0.8
0.85
0 60 120 180 240 300 360
0
2
4
circumferential angle, °
± Δp
03re
l, %
Figure 4-13: Left-hand: ensemble average of relative total pressure at rotor entry. Right-hand: Strain gauge signals (ε = 0.762)
Wildheim (1979) developed a resonance prediction and design tool for rotationally periodic structures, ZZENF diagram, which is demonstrated for the test turbine in Figure 4-14 with natural frequencies for the four lowest eigenmode families and 0 29 (N/2) nodal diameters. The crossings between the excitation lines and any eigenfrequency bare a potential resonance situation. It is observed that the first two harmonics of the periodic nozzle excitation are far away from any excitation lines, which is in line with current design practice for full admission turbines. In order to be able to evaluate forced response on the first rotor in the test turbine the forcing function needs to be determined. It is experimentally and qualitatively estimated for the tangential blade force based on relative dynamic pressure head at the rotor inlet (QEXP) that in Figure 4-15 is compared with numerical outcome (QNUM) by Hushmandi (2010) as a normalized force. See paper IV for details and the definition of Q. Worth noting is that the normalized force ratio is approximately redoubled when the rotor is leaving the admission jet, which confirms estimation by Traupel (1977). Furthermore, the trend resembles the description of Pigott, 1980 (compare with Figure 1-14). The individual and detailed force content from upstream nozzles is impossible to determine by this approach. However, a “global” picture of the excitations due to blockage and stator wakes is captured.
0 2 4 6 8 10 12 14 16 18 20 22 24 26 280
2
4
6
8
10
12
14
16
18
20
Fre
quen
cy, k
Hz
Nodal diameters, ND
EO
EO
EO
EO42
EO84
EO126
1st mode family
2nd3rd4th
0 pi/2 pi 3pi/2 2pi−0.5
0
0.5
1
1.5
2
2.5
3
Nor
mal
ized
forc
e ra
tio Q
, −
circumferential angle, rad
QEXP
QNUM
Figure 4-14: ZZENF diagram - test turbine (Natural frequencies courtesy of Siemens Industrial
Turbomachinery AB).Zig-zag lines at design speed
Figure 4-15: Qualitative forcing function at admission 76.2% (design speed 4450 rpm). Numerical results adapted from Hushmandi (2010)
0 60 120 180 240 300 360−0.5
−0.4
−0.3
−0.2
−0.1
0
0.1
0.2
0.3
0.4
0.5
circumferential angle, °
ac−s
ign
al, m
ystr
Gauge on the rotor bulb (tensile strain)Gauge on the rotor bulb (compressive strain)Gauge on the inner shroud surface
0203~ pp rel
023 pp
rotation
Admission sector

Doctoral Thesis / Jens Fridh Page 31
Thus, Fourier analysis of the relative total pressure at rotor inlet is used as an aerodynamic forcing indicator and is shown in the two left-hand Campbell diagrams in Figure 4-16, for full admission and for ε = 0.762. The two right-hand diagrams in Figure 4-16 show the response signal from the shroud strain gauge. The Campbell diagrams are composed by FFT results (absolute part – amplitude) from each cycle from the performed sweep tests (50 to 105% of design rotational speed).
a) ε = 100%, pressure transducer (kPa) b) ε = 100%, shroud strain gauge (μm/m)⋅10-1
c) ε = 76.2%, pressure transducer (kPa) d) ε = 76.2%, shroud strain gauge (μm/m)⋅10-1 Figure 4-16: Campbell diagrams at two admission degrees (full & partial admission)
One apparent observation from Figure 4-16 is the distinct captures of 1st and 2nd harmonic of the nozzle count (NS) for full admission, diagram a). The 1st harmonic of NS is also captured (off-resonance) in the strain response, b), but in contrary to the pressure signal it is high signal response at high speeds, which is because the tangential mechanical contact between adjacent blade shrouds is relieved at high centrifugal loads. 12th engine order (EO) shows a high response in b) that is due to the effect from the water brake which has 12 buckets and together with a certain water inflow it gives a resonance that is more pronounced at high speeds when the brake torque is lower and the damping provided by the surrounding water decreases. There are several low EO that are excited, seen in b). Significant are EO 1, 4 and 8 that respond at full admission. No completely trustworthy explanations have been found for these, however one source that may play a role is the tooth wheel located on the downstream the coupling flange. The tooth wheel has a once per revolution groove and is designed in two halves for easy assemblage, which may contribute to EO 1. One explanation for EO 4 and 8
Stator wakes

Page 32 Doctoral Thesis / Jens Fridh
may be the design of the water inflow to the water brake, which has not been possible to verify completely but seems reasonable since the response diminish with reduced speed, in line with the explanation of EO 12. Diagrams c) and d) are for 76.2% admission in one arc. The 42nd EO response in c) is of the same order of magnitude as in diagram a). The pressure induced engine orders are naturally and drastically changed where the most dominating ones are 1, 2, 3, 5, 6, 7, 11, 16 with decreasing magnitude and where EO 16 has about the same magnitude as the 42nd (NS). The excitation of natural frequencies for partial (0.762) compared to full admission are mostly recognized in ωn8 – resonance order (RO) 53, ωn7 – RO47, 57 & 59, ωn6 - RO54, ωn9 - RO58 and ωn4 – RO55 & 61, and are all combinations of number of rotor blades NR and low EO excitations. Here, the denomination resonance order (RO) is used to distinguish resonance from off-resonance excitation. ωn8 - RO53 is close to the design operating point. Table 4-1 is a summary of observations for full admission and additional observations for partial admission cases for the performed tests. Table 4-1: Summary of observations of forcing and vibration response
admission degree, ε
admissionarcs, z
admitted nozzles
aerodynamic forcing, EO
magn. ratios @ design speed,
02ˆ pp ⋅103 Resonance situations
1.000 1 42 NS multiples, i.e. 42, 84…
1, 0.3
ωn7 excited by RO59, 53, 47 ωn5 excited by RO38
additional observations for partial admission
0.762 1 32 1, 2, 3, 5, 6, 7, 11, 16
60, 29, 11, 6 6, 5, 2, 1
ωn7 (1ND of 2nd mode) excited by RO57, 59 and 47 (58±1 and 58-11) ωn8 (5ND of 1st mode) excited by RO53 (58-5) ωn9 (0ND of 3rd mode) excited by RO58 (42+16)
0.524 1 22 1, 3, 5, 7, 10, 12, 16
100, 26, 10, 6 3, 3, 1
ωn7 (1ND of 2nd mode) excited by RO57, 59 (58±1) ωn8 (5ND of 1st mode) excited by RO53 (58-5) ωn9 (0ND of 3rd mode) excited by RO58 (42+16)
0.286 1 12 1, 2, 3, 5, 6, 8, 9, 11, 12, 15, 16
79, 49, 16, 13 9, 7, 6, 4 4, 3, 2
ωn7 (1ND of 2nd mode) excited by RO57, 59 (58±1) ωn8 (5ND of 1st mode) excited by RO53 (58-5) ωn9 (0ND of 3rd mode) excited by RO58 (42+16)
0.524 2 10 + 12 1, 2, 6, 8, 10, 12, 16
7, 84, 13, 4 4, 4, 3
ωn7 (1ND of 2nd mode) excited by RO57, 59 (58±1) ωn8 (5ND of 1st mode) excited by RO53 (58-5)
0.524 2 6 + 16 1, 2, 3, 5, 6, 11, 16, 19, 21, 24, 29, 37
43, 48, 25, 18, 12, 7, 4, 2 2, 3, 2, 2
ωn7 (1ND of 2nd mode) excited by RO57, 59 (58±1) ωn8 (5ND of 1st mode) excited by RO53 (58-5) ωn9 (0ND of 3rd mode) excited by RO58 (42+16)

Doctoral Thesis / Jens Fridh Page 33
5. SUMMARY AND CONCLUSIONS
The employed test rig, test objects, its instrumentation and performed steady and unsteady measurements of partial admission have been presented. Data reduction, evaluation procedures and uncertainty analysis have been described and results and observations put forward and discussed. The main conclusions regarding the steady flow investigations are summarized as follows:
• Performance measurements concerning the efficiency trends and general circumferential and axial pressure distortions confirm results found in open literature and demonstrate the applicability of the partial admission setup employed in the test turbine and relevance of outcomes.
• The total-to-static turbine efficiency drops and the efficiency peak appears at lower velocity ratios for lower degrees of admission. This is because the pumping losses at increased velocity ratios become a larger part of the gross aerodynamic loss as the admission arc decreases.
• The circumferential pressure distortion (pressure wake) has an almost axial imprint downstream of the blockage that simulates the partial admission. And, it is almost completely leveled out at the exit of the second stage.
• Circumferential temperature distortion caused by partial admission blockage follows a particle trace streamwise throughout the turbine, and is still very pronounced at the turbine exit, especially in the trace of rotor entry into admission arc. Very little work is extracted from the fluid in that local region, which is associated with intense mixing and high loss production instead.
• A considerable amount of the flow redistribution takes place downstream of the control stage rotor row before the downstream stage.
• It has been shown in this investigation that partial admission is detrimental for the downstream stage efficiency. According to the second law of classical thermodynamics it is more beneficial to encounter the losses as early as possible in a process, assumed constant loss coefficient and velocity. The entropy production will be less at a high compared to a low temperature.
• The efficiency deficit of downstream stages is important to consider when evaluating the overall efficiency of a multistage turbine. By use of several admission arcs a greater part of the inevitable mixing can be located further upstream, which decrease the partial admission stage efficiency but promptly increase the efficiency of downstream stages. By going from one to two arcs at 52.4% admission nearly a 10% reduction in the second stage partial admission loss, at design operating point, was deduced from measurements on the test turbine in this study.
• Locally the circumferential reaction degree of the control stage is negative adjacent to the rotor exit from the admission jet that causes locally adverse flow.
• In the pressure wake from the control stage blockage the downstream stage in the test turbine experiences an increased circumferential reaction degree which indicates that the stage operates in off-design mode. This is mostly pronounced at the hub where the influence from disc cavity flow ejection upstream of stator disc is substantial.

Page 34 Doctoral Thesis / Jens Fridh
• The flow capacity coefficient increases with reduced admission degree. For the test turbine a 2% increase in flow capacity coefficient was measured going from full admission to 28.6%.
• The rotor filling loss stretches circumferentially well over 2 stator pitches and reaches roughly a value three times higher than a reference value representative for an undisturbed part of the admission sector.
The main conclusions regarding the unsteady measurements are summarized as follows:
• The unsteadiness in the measured relative total pressure is largest in conjunction with rotor exit from the admission jet, about 4% of absolute pressure compared to 0.5% far away from sector ends. However, at rotor entry the pressure is high and the unsteadiness more detrimental for the efficiency.
• Because of coupled blades, strain gauge data can only be interpreted as general trends at the sensor location for the bladed disc. Despite this, strain gauge results show a high tensile strain peak downstream of the suction side of the blockage.
• The relative dynamic pressure gradually increases as the rotor moves towards the blockage and contributes to an increase of the tangential blade load.
• Time of unloading is of great importance for the pressure and strain amplitudes of the emptying transients, where an increased unloading time decreases the amplitudes. However, it promotes an earlier emptying that is detrimental to the overall efficiency.
• A general forced response analysis reveals a large number of low engine order force impulses added or highly amplified due to partial admission because of the blockage, pumping, loading and unloading processes.
• For the test turbine investigated herein it is entirely a combination of number of rotor blades and low engine order excitations that cause forced response vibrations because of the proximity between excitation points on the excitation lines and the eigenmodes. Vibration response of the 5th ND excited by RO53 and 47 (derived from the aerodynamic stimuli EO5 and 11, respectively) are located rather close to the design operating speed of 4450 rpm.
• One possible design feature in order to change the force spectrum is to alter the number of arcs for a given admission degree but also the relationship between admitted and non-admitted arc lengths influence. For the test turbine the excited 53rd resonance order for configuration ε = 0.524 with 10+12 open nozzles shows considerably lower amplitude than for any other configuration.

Doctoral Thesis / Jens Fridh Page 35
6. FUTURE WORK
There are changed prerequisites for the choice of optimum pitch to chord for partial admission turbines due to the circumferential variations in flow angle, velocity and mass flow that leads to a large circumferential variation in the blade loading. Such a suggested study requires also result from control stages with zero reaction and various setups with different axial distance between stator and rotor, in order to be generally applicable. The findings in this research imply that a decreased pitch to chord ratio may be beneficial (compared to full admission) and where a decrease in pitch is a viable design parameter considering the aim to keep the axial blade chord small to maintain low partial admission loss. For the stator a differentiated pitch or adjustable guide vanes close to admission jet side walls can be looked into, which also will be related to the filling and emptying force transients. The mixing loss when the rotor enters the admission jet (filling) has shown to be a large part of the partial admission loss compared to the emptying loss. Due to limited instrumentation and thereby a lack of experimental validation data for numerical computations it is still not clear how much impact the unsteady phenomena has on the filling loss. With this in mind, further investigations should be performed. From literature it is known that large differences in stagnation temperature and/or pressure between mixing streams increases the mixing loss. From a design point of view it may be argued whether to circumferentially distribute the mixing or not in order to change the gradient between the mixing flows. Through this study it has been found that design aspects of partial admission so far have mainly been focused towards achieving high thermodynamic stage efficiency. However, the aeromechanical aspect of partial admission has to a large extent been an unexplored field where more research effort is needed to increase future reliability and cost effectiveness of partial admission turbines. In order to draw more distinct conclusions a modified setup is suggested where one blade is decoupled from adjacent blades at the shroud and the number of rotating measurement points increased before performing new forced response tests. In this way strain gauge response at the blade root can be isolated to one blade, and it also increases the signal-to-noise ratio (SNR) and facilitates a more distinct determination of amplitudes. As a complement a detailed FEM analysis is suggested to thoroughly calculate the eigenmodes. It is suggested to perform extended tests with two, three and four admission arcs of varying circumferential lengths. This in order to provide additional validation data and draw further conclusions regarding partial admission excitations contra admission arc configurations, and how it in detail can be applied in the design process.

Page 36 Doctoral Thesis / Jens Fridh

Doctoral Thesis / Jens Fridh Page 37
7. BIBLIOGRAPHY
Ainsworth, R.W., Miller, R.J., Moss, R.W., Thorpe, S.J., 2000 “Unsteady Pressure Measurements”, Meas. Sci. Technol. 11 (2000), pp.1055-1076 Baljé, O.E. and Binsley, R.L., 1968 “Axial Turbine Performance Evaluation. Part A – Loss-Geometry Relationship”, ASME transactions, Series A, Journal of Engineering for Power, 90, pp. 341-348 Bohn, D. and Funke, H., 2003 “Experimental investigations into the nonuniform flow in a 4-stage turbine with special focus on the flow equalization in the first turbine stage”, Proceedings of ASME Turbo Expo 2003 conf., paper No. GT 2003-38547 Boulbin, F. et al., 1992 “Turbine Blade Forces due to Partial Admission”, Revue Francaise de Mecanique, No.1992-3, pp. 203-208, ISSN 0373-6601 B+V Industrietechnik, 2001 “MARC® Steam Turbines”, Manufacturer brochure, B+V Industrietechnik GmbH, P.O.Box 11 22 89, D-20422 Hamburg, Germany Dénos, R., 2002 “Influence of Temperature Transients and Centrifugal Force on Fast-response Transducers”, Experiments in Fluids 33 (2002), pp. 256-264 Denton, J.D., 1993 “Loss Mechanisms in Turbomachines”, ASME Journal of Turbomachinery, 115, pp. 621-656 Denton, J.D., 2001 “Loss Mechanisms in Turbomachines – Part 2: Loss Generation in Turbomachines”, Lecture notes, Cambridge Turbomachinery Course, Madingley Hall, Madingley, Cambridge, 25-29 June 2001, University of Cambridge, UK Dixon, S.L., 1998 “Fluid Mechanics and Termodynamics of Turbomachinery”,4th Edition, ISBN 0-7506-7059-2 Dorney, D., Griffin, L., Sondak, D., 2004 “Full- and Partial-Admission Performance of the Simplex Turbine”, Journal of Propulsion and Power, Vol. 20, No. 3 Fahlén, P., 1994 “Performance tests of air source heat pumps under frosting conditions - Quality of Results”, Swedish National Testing and Research Institute, SP REPORT 1994:01, ISBN 91-7848-454-5/ISSN 0284-517, Boras, Sweden Figliola, R. and Beasley, D., 2000 “Theory and Design for Mechanical Measurements”, 3rd Ed., John Wiley & Sons, Inc., 2000, ISBN 0-471-35083-4

Page 38 Doctoral Thesis / Jens Fridh
He, L., 1997 “Computation of unsteady flow through steam turbine blade rows at partial admission”, Proc. of ImechE Journal of Power and Energy, 211, pp. 297-305 Horlock, J.H., 1966 “Axial-Flow Turbines”, Butterworths, (1973 reprint with supplemental material, Huntington, New York: Krieger) Hushmandi, B.N., 2010 “Numerical Analysis of Partial Admission in Axial Turbines”, PhD thesis, KTH, Stockholm, Sweden, ISBN 978-91-7415-390-3, ISSN 1100-7990, ISRN KTH-KRV-R-10-02-SE Hållberg, H., 2003 “Utveckling av modeller för dynamiska svarsfunktioner i turbinrotorer”, MSc. Thesis, ISRN LUTVDG/TVSM--03/5123--SE (1-105), ISSN 0281-6679, Lund University, Sweden, 2003, in Swedish Imregun, M., 1999 “Advanced topics in bladed disk vibration & basics of rotor vibration”, Lecture notes, VKI Lecture series – Aeroelasticity in Axial Flow Turbines, Rhode-Saint-Genése, Belgium, May 1999 Isakson, G. & Eisley, J.G., 1964 “Natural frequencies in Coupled Bending and Torsion of Twisted Rotating and Non-Rotating Blades”, NASA CR-65, USA ISO 5167-1, 1991 “Measurements of fluid flow by means of pressure differential devices”, Part 1: Orifice plates, nozzles and Venturi tubes inserted in circular cross-section conduits running full ISO 5167-1, Amd. 1, 1998 “Measurements of fluid flow by means of pressure differential devices”, Part 1: Orifice plates, nozzles and Venturi tubes inserted in circular cross-section conduits running full, Amendment 1 ISO/TR 5168, 1998 “Measurement of Fluid Flow – Evaluation of Uncertainties”, Annex E Klassen, H.A., 1968 “Cold-Air Investigation of Effects of Partial Admission on Performance of 3.75-inch Mean-Diameter Single-Stage Axial-Flow Turbine”, NASA TN D-4700 Kurtz, A.D., Ainsworth, R.W., Thorpe, S.J., Ned, A., 2000 “Acceleration Insensitive Semiconductor Pressure Sensors for High Bandwidth Measurements on Rotating Turbine Blades”, Proc. of the 15th Symp. on Measuring Techniques for Transonic and Supersonic Flow in Cascade and Turbomachines, Florence, Sep. 2000

Doctoral Thesis / Jens Fridh Page 39
Kåberger, T., 2008 “Energy in Sweden 2008”, Annual report from the Swedish National Energy Agency, Energimyndigheten, Box 310, 631 04 Eskilstuna, Sweden, ER 2008:16, ISSN 1403-1892, 2008 Lakshminarayana, B., 1996 “Fluid Dynamics and Heat Transfer of Turbomachinery”, ISBN 0-471-85546-4 Lampart, P., Szymaniak, M., Kwidziński, R., 2005 “Numerical Investigation of Unsteady Flow in a Partial Admission Control Stage of a 200 MW Turbine”, Proc. of 6th European Conference on Turbomachinery, Fluid and Thermodynamics, Lille, France, March 7-11, 2005, pp. 376-389 Langston, L.S., 1980 “Crossflows in a Turbine Cascade Passage”, ASME Journal of Engineering for Power, Vol. 102: 866-874 Langston, L.S., 2001 “Secondary Flows in Axial Turbines – A Review”, Annals of the New York Academy of Sciences, Vol. 934:11-26 Lewis, K.L., 1993a “The influence of partial admission of a multistage turbine”, Internal report, Whittle Laboratory, Cambridge University Lindqvist, L., 2000 “Endwall Cavity Flow Effect on the Temperature Attenuation in the Main Flow Path in a Gas Turbine”, Licentiate thesis, TRITA/KRV-2000-6, ISSN 1100-7990, ISRN KTH/KRV/R-00/6-SE Linnecken, H., 1957 “Der Radreibungsverlust, Insbesondere bei Turbomashinen”, Magazine, AEG Mitteilungen 47 (1957) 1/2, DK 532.58:621 – 135, in German Macchi, E. and Lozza, G., 1985 “Comparison of Partial vs Full Admission for Small Turbines at Low Specific Speeds”, Conference paper, ASME 85-GT-220, 1985, ISSN 0402-1215 Mathias, G., 1995 “Zum spezifischen Wärmeverbrauch un den Verlustmechanismen bei der Düsengruppenregelung von Dampfturbinen”, Magazine BWK, No. 7/8 – July/August, pp. 321-325, in German Mathias, G., 1997 “Der Einfluβ des Auslegungs-Einströmdruckverlustes auf die regelstatischen Eigenschaften von Dampfturbinen”, Magazine BWK, No. 6 – June, pp. 46-53, in German Ohlsson, G.O., 1956 “Partial Admission, Low Aspect Ratios and Supersonic Speeds in Small Turbines”, Sc.D. Thesis, M.I.T., Jan 1956

Page 40 Doctoral Thesis / Jens Fridh
Ohlsson, G.O., 1962 “Partial-Admission Turbines” Journal of the Aerospace Sciences, 29, No. 9, pp. 1017-1028 Pfefferle, D., 2004 “Investigation of Efficiency Measurements at HPT Test Turbine – Development of an alternative Evaluation Method”, IStudienarbeit, 2004, Dept. of Energy Technology, Royal Institute of Technology (KTH), Stockholm, Sweden Pigott, R., 1980 “Turbine blade vibration due to partial admission”, Int. J. Mech. Sci. Vol. 22, pp. 247-264, Pergamont Press Ltd., 1980, Great Britain Roelke, R.J., 1973 “Turbine Design and Application”, NASA SP-290, A.J. Glassman, Vol.2, Chap. 8 Schumacher, V., 1973 “Untersuchung der instationären Strömungsvorgänge bei Teilbeafschlagung einer Turbinenstufe”, VDI-Berichte No. 193, VDI-Verlag, Dusseldorf, pp. 175-185, in German Sharma, O.P. and Butler, T.L., 1987 “Predictions of Endwall Losses and Secondary Flows in Axial Flow Turbine Cascade Passage”, ASME Journal of Turbomachinery. Vol. 109: 229-236 Sieverding, C.H., 1985 “Recent Progress in the Understanding of Basic Aspects of Secondary Flows in Turbine Blade Passage”, ASME Journal of Turbomachinery. Vol. 107: 248-257 Sieverding, C.H. and Dénos, R., 1992 “Relative Total Pressure Measurements Downstream of a Transonic Annular Cascade”, Proc. of the 11th Symp. on Measuring Techniques for Transonic and Supersonic Flow in Cascade and Turbomachines, Munich, Sep. 1992 Skopek, J. et al., 1999 ”Partial steam admission in an axial turbine stage”, IMechE conference transcriptions 1999, paper C557/077/99 Srinivasan, A. V., 1997 “Flutter and resonant vibration characteristics of engine blades – An IGTI Scholar Paper”, Proc. of ASME Turbo Expo, June 2-June 5 1997, conf., paper No. 97-GT-533 Stenning, A.H., 1953 “Design of Turbines for High-Energy-Fuel Low-Power-Output Applications”, Rep. 79, Dynamic Analysis and Control Lab., Massachusetts Inst. Tech., Sept. 30, 1953 Stodola, A., Louis C. Loewenstein Trans., 1927 “Steam and Gas Turbines Vol. I”, McGraw-Hill Book Co., Inc., Reprinted by Peter Smith, 1945

Doctoral Thesis / Jens Fridh Page 41
Svensk Fjärrvärme, 2008 “Swedish District Heating in Sweden 2007”, Statistics obtained from Svensk Fjärrvärme, 101 53 Stockholm, Sweden, 2008 (in Swedish) Södergård, B., Henriksson, K., Kjellström, B. and Söderberg, O., 1989 “Turbine testing facility”, Technical report, TRITA-KRV-1989-03 Traupel, W., 1966 “Thermische Turbomaschinen”, Vol. 1, 2nd Ed., Springer-Verlag, Berlin, in German Traupel, W., 1977 “Thermische Turbomaschinen”, Vol. 1, 3rd Ed., ISBN 3-540-07939-4, in German Vogt, D., 2001 “A New Pressure Pulse Generator for Dynamic Calibration”, HPT internal report KTH/HPT-01-10, Stockholm, 2001 Vogt, D. and Fransson, T., 2004 “A Technique for Using Recessed-Mounted Pressure Transducers to Measure Unsteady Pressure”, Proc. of the 16th Symp. on Measuring Techniques for Transonic and Supersonic Flow in Cascade and Turbomachines, Stockholm, Sep. 2004 Wakeley, G.R. and Potts, I., 1997 “Origins of Loss within a multistage Turbine Environment under Conditions of Partial Admission”, Proc. of ASME conference, paper 97-GT-96, Orlando, Florida Wei, N., 2000 “Significance of loss models in aerothermodynamic simulation for axial turbines”, Doctoral thesis, Department of Energy Technology, Royal Institute of Technology, ISBN 91-7170-540-6, TRITA-KRV-2000-3, pp. 72-109 Wei, N. and Svensdotter, S., 1995 “Investigations of the Flow through an Axial Turbine Stage”, Licentiate thesis, TRITA/KRV-1995-1, ISSN 1100-7990, ISRN KTH/KRV/R-95/1-SE Wildheim, S. J., 1979 “Excitation of Rotationally Periodic Structures”, J. of Appl. Mechanics, Vol. 46, No. 4, December 1979 Wildheim, S. J., 1980 “Natural frequencies of rotating bladed discs using clamped-free blade modes”, Internal report, LiTH-IKP-R-169, The Institute of Technology at Linköping University, Sweden Yahya, S.M. and Doyle, M.D.C., 1969 “Aerodynamic losses in Partial Admission Turbines”, Int. Journal of Mech. Sciences, Pergamon Press, 11, pp. 417-431

Page 42 Doctoral Thesis / Jens Fridh
Zweifel, O., 1945 “Die Frage der optimalen Schaufeteilung bei Beschaufelungen von Turbomaschinen, insbesondere bei grosser Umlenkung in der Schaufelreihen”, Brown Boveri Mitteilungen Dec. 1945, in German

Doctoral Thesis / Jens Fridh Page 43
APPENDIX A Uncertainty Analysis of Performance Measurements
The overall turbine performance is determined mechanically by measuring the torque and calculating the total to static efficiency according to Eq. A1,
2
22ch
h
s
ts
+Δ
Δ=η
(A1)
, where the actual enthalpy drop Δh is
30⋅⋅⋅
=Δm
nMh&
π (A2)
, and where the torque, M, consists of the axis, bearing friction and disc friction torque. The axis and bearing friction torque are measured experimentally with torque meter and strain gauge, respectively. The disc friction torque, which one should bear in mind is very small compared to the measured torques, is estimated by employing the correlation for windage power, Pw, presented by Linnecken (1957),
53hMw rCP ⋅⋅⋅= ωρ (A3)
, where the coefficient for smooth discs, CM, is by Linnecken suggested to:
⎟⎟⎟⎟⎟
⎠
⎞
⎜⎜⎜⎜⎜
⎝
⎛
+
++=
h
h
h
h
h
hM
r
r
r
Cδ
δ
δπ
2
1
Re04.0
Re
5.02.0 (A4)
, and where
μρω ⋅⋅
=2
Re hr (A5)
, and where the dynamic viscosity is based on a polynomial approximation of tabulated values,
( )15.273310.000000040.00001748 −⋅+= Tμ (A6) , and the density calculated with the ideal gas law with pressures determined from radial averaged values in the disc gap, total temperature and a gas constant estimated as:
⎟⎠⎞
⎜⎝⎛ +⋅
+=
016.1897.281
14.8314 X
XR (A7)

Page 44 Doctoral Thesis / Jens Fridh
, where the absolute water content, X, is based on measurements of the relative humidity before the turbine. The mass flow, m& , in Eq. A2 is the result of measurements with standard orifice plate, and is iteratively calculated according to ISO 5167-1 (1991), with the discharge coefficient according to ISO 5167-1,Amd.1 (1998). The isentropic enthalpy drop, Δhs, for the turbine is:
⎟⎟⎟
⎠
⎞
⎜⎜⎜
⎝
⎛
⎟⎟⎠
⎞⎜⎜⎝
⎛−⋅⋅=Δ
⎟⎠⎞
⎜⎝⎛ −
κκ 1
2
72 1
pp
Tch ps (A8)
, where the average specific heat capacity at constant pressure is calculated as:
XcXc
c OHpairdrypp +
⋅+=
12,, (A9)
, with polynomial approximations of:
( )2, 273.15-T0.0001351005.5 ⋅+=airdrypc
(A10)
( ) 2
2, 10015.27373.3
100273.15-T9.4041858.4 ⎟
⎠⎞
⎜⎝⎛ −
++=Tc OHp (A11)
, and where, in this case, T is the mean value of the inlet and exit static temperatures, and 2T is the inlet static temperature. The static temperature is derived from the averaged total temperature measured at respective measurement section where the dynamic part is subtracted, which in turn is determined from geometrical parameters and mass flow measurements. The inlet absolute velocity, c2, is assumed axial and calculated according to the continuity equation. The static-to-static isentropic velocity ratio, ν, is defined according to Eq. A12.
shuΔ
=2
ν (A12)
where u is the mean blade speed. During the tests, the static pressure ratio is kept constant and the rotational speed changed by means of controlling the brake power. A mean value of u for the first and second rotor is employed for the two-stage test object, as well as a mean value of the isentropic enthalpy drop for the two stages to be able to compare full admission with partial admission runs where the load is quite different for the two stages.

Doctoral Thesis / Jens Fridh Page 45
Data acquisition and averaging The pressures are measured with a set of PSI 9010 modules in appropriate ranges, which are re-zeroed before the measurement, as well as afterwards in order to check for drift. When no other reference pressure is required the atmospheric pressure is used, which is measured continuously. Each data point is time-averaged from 60 sequentially acquisitioned samples, with a sample frequency of approximately 1 Hz. Furthermore, there is a geometrical averaging for the temperatures and pressures. The total temperatures in measurement sections 1 and 8 are measured with type-K thermocouples in two radial positions at four circumferential evenly distributed positions, i.e. the total temperature at one section is an average of 8 simultaneous measurements. The static pressure, in section 2p , is averaged out of 8 pressure taps, 4 positioned at the hub and 4 at the casing, circumferentially spread. For partial admission, the pressure taps only located in the admission arc is employed. One should be aware of the simplification this implies during partial admission, where the local tangential pressure gradient may be considerable close to sector ends due to local mass flow variations, something that Wakeley and Potts (1996), Bohn and Funke (2003) among others point out. The static pressure in section 7p is averaged identically as 2p is at full admission, regardless of the degree of admission. Uncertainties A discussion of the uncertainties present is appropriate in order to accurately comprehend the presented experimental result. Unfortunately, the only certain thing about uncertainties is that they are uncertain and merely an estimate of the inaccuracy, however, an estimate is far better than no estimate. Uncertainties contain systematic and random uncertainties, though the distinction between them may be difficult to uphold in practice. The random uncertainties can be estimated for large enough samples of experimental data (>30) with standard statistical approach such as the standard deviation, Eq. A13, suggested in ISO/TR 5168 (1998), for data that is scattered as a normal frequency distribution. Moreover, careful consideration of, and possible exclusion of spurious data (outliners) should be taken, which for extensive monitoring ensures the result presented herein.
( )
NN
xx
s
N
ii
x1
1
2
−
−
=
∑=
(A13)
The systematic uncertainties are much harder to predict and estimate. Initially, the primary task is trying to eliminate the unnecessary systematic uncertainties, and one way to ensure that is to measure the right properties in an appropriate way with calibrated and correctly installed instruments/transducers/etc., as described exemplifying by Fahlén (1994). Here, appropriate regards suitable instruments and properly designed probes/transducers/etc. for whatever property is measured, e.g. pressures are measured with instruments that are calibrated and designed for the relevant pressure range, and not oversized for instance. To

Page 46 Doctoral Thesis / Jens Fridh
some extent the systematic uncertainties can be estimated via statistical methods when a sufficiently good physical model is available but far from every systematic error can be derived this way and when it is not possible, more subjective, qualified guesses are the only measure that can be taken. Often manufacturers state the systematic uncertainties of calibrated instruments, which may be based on a statistical evaluation of a large number of units. Total uncertainty An uncertainty analysis is performed for the indirect efficiency measurements starting from Eq. A14 and moving down through the ladder of abstraction. For each individual parameter is also calculated a sensitivity coefficient by evaluating its partial derivate, which indicates the propagation of the uncertainty of the derived value. All uncertainties, except for the pressures, were considered independent (the barometric pressure affects all the pressure simultaneously and was therefore linked to the uncertainty of each pressure). The total uncertainty of the efficiency is calculated according to Fahlén (1994) and ISO/TR 5168 (1998). For the datum case (full admission, ν = 0.47) the absolute total uncertainty is estimated to 1.4% of the derived efficiency. Figure A-1 shows the efficiency curves with uncertainty illustrated as error bars.
0.50
0.60
0.70
0.80
0.90
1.00
0.15 0.25 0.35 0.45 0.55 0.65 0.75
η to
t-sta
t / η
max
Velocity ratio, νstat-stat [-]
4b, 100%
4ab, 100%
4a, 100%
4b, 76.2%
4ab, 76.2%
4b, 54.2%
4ab, 54.2%
4b, 54.2% 2 arcs
4ab, 54.2% 2 arcs
4b, 28.6%
4ab, 28.6%
Figure A-1: Efficiency trends, solid lines: two-stage efficiency, dashed lines: single stage efficiency. Error bars represent the combined absolute uncertainty with a 68% confidence interval. Table A-1 shows an uncertainty budget (for the datum case) of the mass flow-, torque-, temperature- and velocity uncertainties, which procedures will be discussed separately in subparagraphs due to the particular important and influencing role they play on the derived result. Besides the discussed uncertainty on the efficiency, there is also an uncertainty of the velocity ratio although it is not as great as for the efficiency. It is estimated to 0.6% on the knowledge based on the uncertainty analysis for the efficiency. The most striking appearance from Table A-1 is the paramount significance the mass flow measurement has. For the

Doctoral Thesis / Jens Fridh Page 47
performance measurements herein, the inlet velocity and static temperature are both deduced with use of the mass flow.
Table A-1: Uncertainty budget at design point for the two-stage test turbine
Uncertainty Absolute uncertainty (%)Mass flow 0.6 Torque 0.2 Static temperature 0.6 Absolute inlet velocity 0.6 Total-to-static efficiency 1.4
2
22
2/2
2/
2
⎟⎟⎠
⎞⎜⎜⎝
⎛
+Δ+⎟
⎠
⎞⎜⎝
⎛Δ
= +ΔΔ
ch
U
hUU
s
chh
ts
sts
ηη (A14)
, where
222/ 2
22
chchUUU
ss+= Δ+Δ
(A15) , and where
22
⎟⎠
⎞⎜⎝
⎛+⎟
⎠
⎞⎜⎝
⎛=
ΔΔ
mU
MnU
hU mMnh
&& (A16)
, which consists of following uncertainties:
22
⎟⎠
⎞⎜⎝
⎛+⎟
⎠
⎞⎜⎝
⎛=n
UM
UMn
U nMMn (A17)
In Eq. A15:
constant) andknown assumed(
1
p
2
1
2
7
12
2
1
2
7
c
pp
U
TU
hU p
p
T
s
hs
⎟⎟⎟⎟⎟⎟
⎠
⎞
⎜⎜⎜⎜⎜⎜
⎝
⎛
⎟⎟⎠
⎞⎜⎜⎝
⎛+
+⎟⎟⎠
⎞⎜⎜⎝
⎛=
Δ −
⎟⎟⎠
⎞⎜⎜⎝
⎛+
Δ
−
κκ
κκ
(A18)
, where

Page 48 Doctoral Thesis / Jens Fridh
constant) andknown assumed (1
1 2
71
2
7
12
7
1
2
7
κκ
κ
κκ
κκ
pp
U
pp
U
pp
pp
−=
⎟⎟⎠
⎞⎜⎜⎝
⎛+
−
⎟⎟⎠
⎞⎜⎜⎝
⎛+
−
(A19)
, and where
2
2
2
7
2
7
272
7
⎟⎟⎠
⎞⎜⎜⎝
⎛+⎟⎟
⎠
⎞⎜⎜⎝
⎛=
pU
pU
pp
Uppp
p
(A20)
Torque measurements Only the uncertainties of the axis torque (torque meter) and the bearing friction torque (strain gauges) are considered while the uncertainty of the disc friction torque is neglected with respect to its minimal impact on the total torque (the disc friction torque is about 1/15 of the bearing friction toque that in turns is about 1/50 of the axis torque, at design point). The absolute uncertainty of the torque measurements is estimated according to Eq. A21. The systematic uncertainty (w) of the torque meter is derived to calibration result and relative uncertainty given by the manufacturer. Figure A-2 shows the systematic uncertainty of the torque meter where the uncertainty high for low torques, i.e. low phase displacement that has some impact for uncertainties at high velocity ratios. The random uncertainty (s) is experimental and derived directly from the standard deviation of individual measurements.
M
UU
MU torqueshafttorquebearingM
22 += (A21)
, where the individual uncertainties is determined according to
22iii wsU += (A22)

Doctoral Thesis / Jens Fridh Page 49
0.00
0.05
0.10
0.15
0.20
0.25
0.30
0.35
0.40
0 20 40 60 80 100 120 140 160 180 200
% a
bs. u
ncer
tain
ty
Nm Figure A-2: Systematic uncertainty of the torque meter.
Mass flow The mass flow measurements are performed with a standard orifice plate and calculated according to Eq. A23, where the discharge coefficient, C, and the expansion coefficient, ε, are calculated according to ISO 5167-1,Amd.1 (1998).
pdCm Δ⋅−
⋅= ρπ
βε 2
41
1 2
4& (A23)
The calculation of the uncertainty of the mass flow is according to ISO/TR 5168, Annex E (1998), where partial differentiations for the parameters in Eq. A23 yield the sensitivity coefficients as follows:
( )
( )
⎪⎪⎪⎪⎪⎪⎪⎪
⎩
⎪⎪⎪⎪⎪⎪⎪⎪
⎨
⎧
Δ=
Δ∂∂
=∂∂
−=
∂∂
−=
∂∂
=∂∂
=∂∂
pm
pm
mmdm
dm
mm
mmCm
Cm
2
2
112
12
4
4
4
&&
&&
&&
&&
&&
&&
ρρ
β
ββ
ββ
εε
(A24)

Page 50 Doctoral Thesis / Jens Fridh
The sources of systematic uncertainty are C, ε, β, d, ρ, Δp and D, ps, t indirectly through β and ρ. And, for the random uncertainties Δp, ρ are considered and indirectly ps and t, through ρ. The systematic (w) and random (s) uncertainties are calculated, given in percentages, as follows:
22
10041100
41
⎟⎟⎠
⎞⎜⎜⎝
⎛⋅+⎟⎟
⎠
⎞⎜⎜⎝
⎛Δ
⋅= Δ
ρρs
ps
ms pm
&& (A25)
222
4
2
2
4
4222
10041100
41
111004
...1
1004100100
⎟⎟⎠
⎞⎜⎜⎝
⎛⋅+⎟⎟
⎠
⎞⎜⎜⎝
⎛Δ
⋅+⎟⎟⎠
⎞⎜⎜⎝
⎛−
⎟⎠
⎞⎜⎝
⎛+
+⎟⎟⎠
⎞⎜⎜⎝
⎛−⎟⎟
⎠
⎞⎜⎜⎝
⎛+⎟
⎠
⎞⎜⎝
⎛+⎟⎠
⎞⎜⎝
⎛
=Δ
ρβ
ββ
βε
ρ
βε
wp
wd
w
wwCw
mw
pd
C
m
&& (A26)
And, the total uncertainty (U) for the mass flow,
22
⎟⎠
⎞⎜⎝
⎛+⎟⎠
⎞⎜⎝
⎛=m
wms
mU mmm
&&&&&& (A27)
Isentropic enthalpy drop Since the total to static efficiency is sought, the isentropic total-to-static enthalpy difference is needed. In the data evaluation this is calculated as static-to-static enthalpy difference with the velocity term c2/2 added, which in turn is derived from the continuity equation and mass flow measurements.
21
2
22
1
2
72
22
,,c
pp
Tcc
hh pssssts +⎟⎟⎟
⎠
⎞
⎜⎜⎜
⎝
⎛
⎟⎟⎠
⎞⎜⎜⎝
⎛−⋅⋅=+Δ=Δ
⎟⎠⎞
⎜⎝⎛ −
−−
κκ
(A28)
2,
220202,
2
5.0
p
p
ccTc
T−
= (A29)
222 ρA
mc&
= (A30)
2
22 RT
p=ρ (A31)
An alternative way is to derive the total-to-static enthalpy difference directly from total-to-static measurements, which reduces the number of influencing uncertainties but on the other hand includes one new for p02. Furthermore, the total pressure profile is unknown without traverse measurements and the reading from the total pressure taps may not be representative,

Doctoral Thesis / Jens Fridh Page 51
although the radial total pressure gradient should be close to zero or at least linear. A closer investigation of the static wall pressures at measurement section 2 shows that a small radial static pressure gradient exists with larger static wall pressure at the casing than at the hub, about 35-40 Pa for the same object regardless if it is operated in a one-stage or two-stage configuration. When the second stage of the two-stage configuration is operated in single-stage runs, the gradient increases to about 60-65 Pa, due to a larger casing diameter at section 2 (the hub is constant). If homogenous flow is assumed at the entrance of the convergent inlet cone and the radial reduction (which accounts for the majority of the fluid acceleration) is the same for both the outer and inner cone, the gradient can be explained by the circumferential reduction of an imagined stream tube at the outer cone endwall due to area changes, i.e. if a zero pressure gradient is strived for in section 2, the entrance diameter of the outer cone should be increased. However, a remark should be made about the turbulence grid, which may also influence the gradient, although it introduces a pressure loss and thereby a change in density the effect should be similar both at inner- and outer radius. Pfefferle (2004) performed an analysis based on inlet total pressure measurements where normalized pressure coefficients where used and radial gradient from traverse was used. According to the aforementioned uncertainty analysis the uncertainty is lower for such an approach the evaluated stage efficiency did not differ more than 0.15% compared to the approach with static to static enthalpy drop plus inlet velocity term.
⎟⎟⎟
⎠
⎞
⎜⎜⎜
⎝
⎛
⎟⎟⎠
⎞⎜⎜⎝
⎛−⋅⋅=Δ
⎟⎠⎞
⎜⎝⎛ −
−
κκ 1
02
702, 1
pp
Tch psts (A32)
However, since the static-to-static enthalpy difference is employed in the evaluation of the efficiency, uncertainty analysis is performed for the static pressures and the static temperature where the uncertainty for the velocity (c2) is incorporated as well. Static temperature – velocity The static temperature is calculated according to Eq. A29 to A31 where the uncertainty of the mass flow measurements has a decisive role indirectly through the calculation of the absolute velocity that has an influence on the static temperature which is proportional to the power of two. The uncertainty of the absolute velocity has a strikingly apparent impact also on the uncertainty of the denominator in Eq. A1. The influence on the uncertainty of the total temperature and static pressure measurements is marginalized due to the large effect that the uncertainty of the mass flow measurements has on the static temperature, utterly.

Page 52 Doctoral Thesis / Jens Fridh

Doctoral Thesis / Jens Fridh Page 53
APPENDIX B Second Stage Performance Penalty
Partial admission does not only penalize the control stage efficiency. Equally important is that the downstream stages may suffer severely by the effects from partial admission, which has been shown by numerous authors: He (1997) and Bohn and Funke (2003) amongst others. There exist many investigations and correlations for the control stage losses from partial admission where most of them are described in the literature study by the author, Fridh (2003). The test turbine described herein has a setup with two subsonic stages of repetitive design with almost identical efficiencies for full admission. Although, there is no goose neck between the control stage and the downstream stage it has been shown to reflect the main partial admission effects fairly well, Fridh et al. (2004). One drawback though, in the measurement point of view, is that it is a single shaft machine hence the stage torque is not measured individually in case of a two-stage configuration. The global approach undertaken here is that from steady performance data of both single stage and dual stage trials an attempt to derive a relationship for the second stage performance penalty is made. A first approximation of the control stage losses due to partial admission at an arbitrary but constant isentropic velocity ratio is given in Eq. B1 and applied on data from single stage performance measurements. The sum of the control stage and downstream stage partial admission loss is stated in Eq. B2 and taken from the two-stage setup. Eq. B1 into Eq. B2 and rearrange yields Eq. B3, which is the second stage penalty loss. Here, the term loss is used in a global sense.
( )*
b4b41 εηηεξ −= (B1)
( )εηηεξεξ ab4ab421 −=+ (B2)
( ) ( )*b4b4ab4ab42 εηηεηηεξ −−−= (B3)
The single stage setup is here run at constant pressure ratio and therefore the single stage isentropic velocity ratio is corrected according to Eq. B5 such that it shifts the efficiency curve (η4bε) horizontally to the right in Figure B-1. This is performed so that the efficiency for a certain value of velocity ratio is representative for an upstream stage in a two-stage configuration where the isentropic stage velocity ratio changes depending on admission degree, i.e. this yields the corrected efficiency *
b4 εη in Eq. B3. The isentropic velocity ratio (static-to-static) for the two-stage configuration is here defined as the Parson number (νPss) according to Eq. B4. The definition of the two-stage isentropic velocity ratio in paper I and in appendix A (Eq. A1 to A12) is based on averaged values for the stages’ blade speeds and isentropic enthalpy drops. In practice, for a turbine like the test turbine where the midspan blade speed is almost the same for both rotors the difference compared to the Parson number is neglectable (±0.0025 in ν-value within the operating range) and the conclusions still valid, however strictly speaking the Parson number is the correct isentropic velocity ratio to be used for a multistage turbine and for a single stage turbine it is identical to νss. The isentropic enthalpy drop for the second stage is defined with the assumption that the isobars in the expansion chart are parallel between the inlet and exit of the

Page 54 Doctoral Thesis / Jens Fridh
second stage, which enables to calculate the second stage isentropic enthalpy drop simply by subtracting the isentropic enthalpy drop for the first stage from the total isentropic enthalpy drop across the two stages. This procedure is necessary for the test turbine since there are no total temperature measurements upstream of the second stage and hence no static temperature can be calculated there.
sPss h
u
Δ⋅=
∑2
2
ν (B4)
The relationship between the isentropic velocity ratio of the first stage (νss ≡ *
b4 εν as an upstream stage in Eq. B5) and the Parson number (νPss in Eq. B5) is linear for a given admission across the operating range, which is shown in Figure B-2. There is a non-linear dependency of the admission degree that is attributed to the change of individual stage pressure ratio and flow capacity across the operating range and across the admission range.
)-(1Pss
ss*
b4 εεν
νεν⋅−
== g (B5)
In Eq. B5 g is approximated (via a curve fit) with the polynomial in Eq. B6 that is valid only for the test turbine and 0.286 ≤ ε ≤ 1.000. No distinction between one or two arcs is considered due to coinciding curves (see Figure B-2).
3
32
21 εεε cccg ++=
coefficients in Eq. B6 with rms error (95% confidence interval) c1 = 2.06±0.02 c2 = -5.34±0.08 c3 = 8.01±0.07
(B6)
0.15 0.25 0.35 0.45 0.55 0.65 0.750.55
0.65
0.75
0.85
0.95
1.05
isentropic velocity ratio νstat−stat
no
rmal
ised
eff
icie
ncy
η/η
max
Figure B-1: Efficiency trends, solid lines: two-stage efficiency (4ab), dashed lines: single stage efficiency (4b). Markers according to legend in Fig. B-2. Error bars represent the combined absolute
uncertainty with a 68% confidence interval.
ε = 0.286
ε = 0.524, 2 arcs
ε = 0.524
ε = 0.762
ε = 1.000

Doctoral Thesis / Jens Fridh Page 55
Figure B-2 can be explained as the divergence of isentropic velocity ratio for the
individual stages due to changes in admission degree and turbine speed. For the test turbine that has a repeating stage design and operates at a constant overall turbine pressure ratio this means that at full admission the Parson number (two-stage velocity ratio) is similar to the individual stage velocity ratios (depicted as solid lines without marker), which can be observed in Figure B2. At partial admission, e.g. 0.762 the individual stage velocity ratios separates where the first stage becomes more loaded (higher stage pressure ratio) thus decreased velocity ratio, and the second stage less loaded thus increased velocity ratio.
0.2 0.3 0.4 0.5 0.6 0.7 0.80
0.2
0.4
0.6
0.8
1
1.2
1.4
1.6
νPss
(Parson number)
ν ss
4a−ε=0.7624b−ε=0.7624a−ε=0.5244b−ε=0.5244a−ε=0.524x24b−ε=0.524x24a−ε=0.2864b−ε=0.2864a−ε=1.0004b−ε=1.0004ab−ε=1.000
Figure B-2: Individual stage velocity ratios (νss) for the two stage turbine (4ab) velocity ratio expressed as Parson number (νPss). Static-to-static conditions. 0.524x2 denotes 0.524 admission
with tw� arcs
No correction is applied to the efficiency magnitude. At least for a moderate increase in stage pressure ratio there is little effect on the stage efficiency if the Reynolds number is sufficiently high, which is discussed further by Wei and Svensdotter (1995). Increased Reynolds number may be beneficial for subsonic turbines, in terms of an earlier laminar boundary layer separation and fully developed turbulent boundary layer in the uncovered trailing edge part on the suction side which is associated with high losses. Due to the low reaction in this case that possible gain will mostly accrue to the stator, which already has a relatively high efficiency. However, the increase in pressure ratio will also result in an increase of stator exit velocities, which render in an increased flow turning for the rotor at a given speed, which actually may increase the endwall losses in the rotor. The resulting second stage penalty loss due to partial admission is shown in Figure B-3 as a percentage of the total partial admission loss for the two-stage test turbine investigated herein, and for a limited operating range. For the point of clarity, the upstream stage loss is shown in Figure B-4. It should be stressed that the calculations performed here are approximate and based on discrete and for ε = 0.286 sparse measurement points. The purpose is to highlight the partial admission losses and trends from a global point of view. It is noted in Figure B-3 that the second stage penalty generally decreases with decreased (two stage) isentropic velocity ratio due to increased pressure ratio for the upstream stage and decreased for the downstream stage. The benefit for the downstream stage using two arcs (ε = 0.524) is clearly shown. The

Page 56 Doctoral Thesis / Jens Fridh
reaction of the second stage is increased during partial admission, i.e. in general the flow angles in the second stage change and here the optimum design for the rotor geometry is at a single stage isentropic velocity ratio of 0.55. For example, if the test turbine is operated at an admission degree of 76.2% and two-stage velocity ratio of about 0.45 the second stage will lie around optimum rotor incidence angles (compare with Figure B-2). This is also a reason that the second stage penalty loss is marginalized at low velocity ratios in the investigation above.
0.3 0.35 0.4 0.45 0.5 0.55 0.6 0.65 0.70
5
10
15
20
25
30
35
νtwo stage
(stat−stat)
pen
alty
loss
in d
ow
nst
ream
sta
ge,
as
% o
f to
tal ε−l
oss
ε=0.762ε=0.524ε=0.524x2ε=0.286
0.3 0.35 0.4 0.45 0.5 0.55 0.6 0.65 0.70
0.05
0.1
0.15
0.2
0.25
0.3
νtwo stage
(stat−stat)
up
stre
am s
tag
e lo
ss (
no
rmal
ized
)
ε=1.000ε=0.762ε=0.524ε=0.524x2ε=0.286
Figure B-3: Second stage penalty loss due to partial admission
Figure B-4: Upstream stage loss

Doctoral Thesis / Jens Fridh Page 57
APPENDIX C Circumferential Reaction Degree
The reaction degree is a well established turbine parameter that describes important one-dimensional design aspects of a turbine stage such as: average flow angles and velocities, and is coupled to the loading and flow coefficient. Equation C1 is an adoption of Horlock’s eq. 2.18 [Horlock(1966)], rewritten so it will correspond to the nomenclature for stage 1 in this study that is assumed to be a normal repetition stage, i.e. c2 = c4, cax2 = cax3 = cax4 = const. and u2=u3=u4. Now, if relevant parameters at ν=0.55 are put in the equation and all values are held constant except β4, which is increased 0.5° it would increase the reaction with approximately 0.015 in absolute value. The same change, but at ν=0.25 would increase the reaction degree with about 0.05. Thus, a small change of 0.5° in the β4, angle will have big consequences for the reaction degree, especially at low velocity ratios.
( ) ( )3434 tan)tan(
22tan)tan(
ββϕββ−−=
⋅−−
=u
cR ax (C1)
νμμψμϕ =
Δ⋅=⋅==
uh
uc sax 2
(C2)
SR
Rp pp
pRΔ+Δ
Δ= (C3)
Therefore, due to the large circumferential gradients in partial admission turbines, the circumferential reaction degree is an indicator of the local off-design conditions along the circumference for the turbine stages. The relation to other turbine design parameters such as flow coefficient (ϕ), stage loading (ψ), isentropic velocity ratio (ν) and flow capacity coefficient (μ) are shown in Eq. C2. Figure C-1 shows the pressure based reaction degree for the two stages at hub and casing, which is defined according to equation C3. Due to sparse measurement points at the hub in the axial measurement location 3, the hub reaction degree (4a-hub) shows some erratic behaviour even far from blockage, e.g. between 0 and 60°, and cannot be trusted to the same extent as the others. For stage 4a the effective admission region is calculated considering the vane exit flow angle and downstream of blockage no meaningful reaction can be evaluated. Not surprisingly there is a negative reaction just when the rotor blade exits the admission arc, i.e. high momentum fluid that exits the nozzle closest to the suction side of the admission sector resembles an ejector pump and fluid may be sucked from adjacent rotor passages creating adverse flow, locally.

Page 58 Doctoral Thesis / Jens Fridh
0 60 120 180 240 300 360−0.4
−0.3
−0.2
−0.1
0
0.1
0.2
0.3
0.4
circumferential angle θ, °
reac
tio
n d
egre
e, −
4a−hub4a−tip4b−hub4b−tip
Figure C-1: Pressure based reaction degree at the hub and casing.
An interesting observation can be made regarding the second stage; approximately 5 nozzles away from sector ends there is no distinction between hub and tip reaction indicating either that the nozzles and rotor passages are not yet filled and/or fluid near the hub is escaping into the stator-rotor cavity. Either way, a flow equalisation is present downstream of second stage’s stator trailing edges. Downstream of the admission arc edges there is a significant rise in reaction that signifies a more axial incidence angle to the rotor. The elevated reaction at the hub in the shadow zone may indicate fluid entering from rotor-stator disc cavity and contributes to fill up the pressure void downstream of the blockage. According to the second law of thermodynamics it is more efficient for the total turbine efficiency to have the losses as early as possible in a multistage environment. If the pressure deficit downstream of the blockage can be concentrated to the first stage without losing inlet pressure head it would decrease the control stage efficiency but increase the downstream stages efficiencies by rapid pressure build up, thus decrease the mixing losses in downstream stages.

Doctoral Thesis / Jens Fridh Page 59
APPENDIX D Area Traverse Measurements
In order to establish a solid background of the investigated test turbine area traverse measurements (steady) have been performed with pneumatic probes upstream of the nozzle row, downstream of the nozzle row and downstream of the rotor row in a single stage setup. The test object is seen in Figure D-1 with axial measurement stations 4 to 7. The probes are depicted in the right hand of Figure D-1 and are calibrated in a semi open calibration nozzle at relevant Mach numbers for each degree of flow angle between ±20°, which generates typical calibration coefficients, here exemplified in Figure D-2 for two Mach numbers (0.2 and 0.6).
Probe 101, upstream stator and downstream rotor (4 and 6)
Probe 61, downstream stator (5)
Figure D-1: Turbine, single stage setup and on the right-hand side the probes used
−20 −15 −10 −5 0 5 10 15 20−0.35
−0.3
−0.25
−0.2
−0.15
−0.1
−0.05
0
yaw angle, °
tota
l pre
ssu
re c
oef
fici
ent
Ct
Ct=(P1−PT)/(P1−1/2*(S2+S3))
0.20.6
−20 −15 −10 −5 0 5 10 15 20−2
−1.5
−1
−0.5
0
0.5
1
1.5
2
2.5
yaw angle, °
yaw
co
effi
cien
t C
y
Cy=(S2−S3)/(P1−1/2*(S2+S3))
0.20.6
−20 −15 −10 −5 0 5 10 15 200.2
0.3
0.4
0.5
0.6
0.7
0.8
0.9
yaw angle, °
stat
ic p
ress
ure
co
effi
cien
t C
s
Cs=(1/2*(S2+S3)−PS)/(P1−1/2*(S2+S3))
0.20.6
Figure D-2: Typical calibration coefficients at two Mach numbers (probe 61) For test turbine measurements, the tangential flow angle, total-, static pressure and Mach number are reconstructed at each traverse point iteratively. The probes have two total pressure taps and an average value is used here. For more detailed loss measurements care should be taken close to the hub endwall (<2Dprobe) due to the wall proximity effect and where the upper total pressure tap only shows trustworthy results. The flow angle denominations used here are depicted in Figure D-3. A useful way to describe losses in a rotating cascade is to use

Page 60 Doctoral Thesis / Jens Fridh
enthalpy losses. Here the row loss is calculated with Eq. D1 for the nozzle and Eq. D2 for the rotor where the enthalpy differences are expressed with velocity terms and static isentropic enthalpy drop, schematically depicted in the enthalpy-entropy chart in Figure D-3. Subscripts denote the axial traverse stations shown in Figure D-1. The velocities are calculated with velocity triangle theory from measured Mach number, yaw angle and blade speed in each traverse point. For the rotor row, consideration is taken for change in centripetal work due to radius change. Although the aspect ratios are very low and the main flow is considered two-dimensional, the flow downstream of the rotor can locally contain high radial flow angles especially in the shroud region due to tip leakage and the shroud angle. The specific heat capacity is an average between inlet and exit of respective row. The static temperature is calculated via the isentropic relation between total and static conditions using traversed static pressures and averaged total temperature measured at the inlet for the stator. Downstream of the rotor there are no measurements of total temperature at specific traverse point, instead an averaged total temperature in section 7 is used (the impact of this simplification is discussed further on adjacent to the loss plots). The specific heat capacity ratio κ is assumed constant during the area traverse and is derived from humidity measurements at the mass flow meter. Finite measurement points are integrated over one stator pitch for each radius according to Eq. D-3 for full admission (reference case) for calculation of mass averaged parameters ( f ), such as the loss coefficient ( ζ=f ),.
Figure D-3: h-s diagram and flow denominations
242
1
1
4
54
252
1
242
1
252
1
1
11
cpp
Tc
cch
c
p
sNN
+⎟⎟⎟
⎠
⎞
⎜⎜⎜
⎝
⎛
⎟⎟⎠
⎞⎜⎜⎝
⎛−
−=+Δ
−=−κ
κζ
(D1)
252
1262
1252
1
1
5
65
262
1
252
1262
1252
1
262
1
1
11
uuwpp
Tc
wuuwh
w
p
sRR
−++⎟⎟⎟
⎠
⎞
⎜⎜⎜
⎝
⎛
⎟⎟⎠
⎞⎜⎜⎝
⎛−
−=−++Δ
−=−κ
κζ
(D2)
p06
½·c62
5
h
s
p4
p5
p6
p04
p05rel p06rel
p05
4
6
½·c42
½·w62½·w5
2
½·c52
ΔhsN
ΔhsR
0.47⋅Cax,S
0.24⋅Cax,R
0.41⋅Cax,R
0.17⋅Cax,S

Doctoral Thesis / Jens Fridh Page 61
∑
∑
=
=
⋅⋅
⋅⋅⋅= k
iririaxri
ri
k
iririaxri
Ac
fAcrf
1,,,,
,1
,,,,
)(ρ
ρ (D3)
Full admission (reference case) The full admission traverse grids downstream of the stator and rotor, are overlaid on the total pressure contour plot in Figure D-4. Because of constraints and limitations in the measurement system each measurement point consists only of two steady data samples, e.g. downstream of the rotor where relatively large fluctuations are present and dynamic pressure in general is small there may be a greater uncertainty in the result. Global data such as velocity ratio and pressure ratio is averaged for the entire traverse. The total pressure downstream of the stator shows a typical pattern with stator wakes and the endwall flow structure penetrating about 15-20% of span from the endwall.
stator pitch, −
rad
ius,
mm
p05
[kPa], νss
=0.427, Πss
=1.23
hub
−0.6 −0.4 −0.2 0 0.2 0.4 0.6175
180
185
190
195
200
205
112
114
116
118
120
122
124
stator pitch, −
rad
ius,
mm
p06
[kPa], νss
=0.428, Πss
=1.23
hub
tip
−0.6 −0.4 −0.2 0 0.2 0.4 0.6175
180
185
190
195
200
205
210
215
100.8
100.9
101
101.1
101.2
101.3
101.4
101.5
101.6
101.7
Figure D-4: Absolute total pressure contours downstream of stator and rotor, respectively
It should be mentioned here that it is an off-design operating point for the geometry, chosen because its similar flow geometry compared to an undisturbed part of the admission case (ε = 0.762) shown further on. Figure D-5 shows the absolute tangential flow angles α downstream of the stator and rotor, respectively. Locally the flow downstream of the stator trailing edge (17% of Cax,S downstream of stator TE) is more axial near end walls where endwall vortex flow from pressure side (PS) mix with suction side (SS) corner flows. It is precisely in this region where PS and SS secondary flows interact that has the largest total pressure deficit, i.e. loss. The stator TE thickness is 0.25 mm and at measurement plane 5 a large part of the stator wake has mixed out at midspan (Figure D-4) and consequently major flow angle deviations are attenuated. Hence, almost constant flow angle for the greater part of the span of the stator. In order to get a qualitatively improved picture downstream of the rotor row and to capture the diverse flow angles the calibration coefficients have been extrapolated ±10° after checking consistency with the calibration curves. There is a considerable difference in the trailing edge heights between the stator and the rotor due to the shroud angle (15° shroud angle) and the aforementioned tip endwall contour in the stator channel.
SS PS

Page 62 Doctoral Thesis / Jens Fridh
stator pitch, −
rad
ius,
mm
Abs. flow angle, α5 [°], ν
ss=0.427, Π
ss=1.23
hub
tip
−0.6 −0.4 −0.2 0 0.2 0.4 0.6175
180
185
190
195
200
205
55
60
65
70
75
80
stator pitch, −
rad
ius,
mm
Abs. flow angle, α6 [°], ν
ss=0.428, Π
ss=1.23
hub
tip
−0.6 −0.4 −0.2 0 0.2 0.4 0.6175
180
185
190
195
200
205
210
215
−60
−50
−40
−30
−20
−10
0
10
20
30
40
Figure D-5: Absolute tangential flow angle downstream of stator and rotor, respectively
Figure D-6 shows the relative flow angles upstream and downstream of the rotor and with the rotor flow turning on the right hand side. Two distinct flow turning peaks around 20 and 85% span are observed which depths compared to midspan are explained by the overturning caused by the major streamwise counter clockwise vortex at the hub and the clockwise at the tip rotating vortices (manifested as more tangential and more axial flow angle in contour plot, respectively). These vortices interact with the main flow and contribute to the locally increased turning. Interestingly, the local underturning at the hub (around 10% of span) is much stronger than the barely visible local underturning at the tip (around 92-93% of span). This is believed to be due to the tip endwall contour that counteracts the streamwise growth of passage vortex.
−80 −60 −40 −20 0 20 40 600
0.1
0.2
0.3
0.4
0.5
0.6
0.7
0.8
0.9
1
flow angle, °
span
, −
Relative flow angles for rotor
β5
β6
105 110 115 120 125 130 135 1400
0.1
0.2
0.3
0.4
0.5
0.6
0.7
0.8
0.9
1Flow turning in rotor
turning γR, °
span
, −
Figure D-6: Area averaged relative flow angles (β5 and β6) and flow turning in rotor, respectively
The left-hand graph in Figure D-7 shows the radial pressure distributions from stator inlet to rotor exit, expressed as pressure coefficients. Here, the traverse points closest to end walls are only connected linearly with the wall pressures. It should be mentioned here that the probe used is not primarily designed to measure static pressure and hence side (directional) taps are influenced by the dynamic pressure. Nevertheless, calibration curves to reconstruct the static pressure are employed. However, one vital constraint is the two-dimensional calibration and uncertain local pressure reconstruction near the hub and casing in regions of endwall flow and where the radial flow angle is high. Hence, uncertainty in local pressures close to end walls is
SS PS

Doctoral Thesis / Jens Fridh Page 63
also reflected in the computation of the local losses (see Eq. D1), e.g. if the local static pressure downstream of the nozzle is overestimated the local nozzle loss is underestimated. Furthermore, due to the use of an average value from the total pressure taps of the probe there is a risk to “smear” out the calculated parameters and risk missing locally high radial gradients less than the radial distance between the total pressure taps. This has been checked by studying the results from individual total pressure taps and concluded that it is not a major concern in the present case mainly due to the relatively dense near wall grid used. The right-hand graph in Figure D-7 shows the inlet-exit velocity ratios for the stator and rotor rows. There is a link between flow turning and ratio of velocities for a cascade, which largely dictates the size of the endwall loss, according to correlations by Traupel (1977). The impact of this can be observed in the hub region (below 15% span) where although the flow turning is reduced the velocity ratio between rotor inlet and exit is approaching unity, i.e. contributing to the increase of loss in that region.
−0.2 0 0.2 0.4 0.6 0.8 1 1.20
0.1
0.2
0.3
0.4
0.5
0.6
0.7
0.8
0.9
1
pressure coefficient, CP=(p
measured−p
06,ref)/(p
04,ref−p
06,ref)
span
, −
CPt4
CPt5
CPs5
CPt6
CPs6
0 0.2 0.4 0.6 0.8 1 1.2 1.40
0.1
0.2
0.3
0.4
0.5
0.6
0.7
0.8
0.9
1
velocity ratio, −
span
, −
c4/c
5
w5/w
6
Figure D-7: Circularly mass averaged pressure coefficients and row velocity ratios
Figure D-8 shows the mass averaged loss for the stator and rotor, respectively. One important constraint in the measurement plane downstream of the rotor (station 6) is the total temperature measurements, which cannot with existing equipment be measured in each individual traverse point. Instead an average of 12 circumferentially and spatially distributed thermocouples in station 7 is used, see Figure D-1. This will have an impact on the relative rotor exit velocity, which is derived via velocity triangles from the probe measurements. A decrease of 5°C in local static temperature at midspan would increase the loss with approximately 0.005 points at midspan (right-hand curve in Figure D-8).
0 0.05 0.1 0.15 0.2 0.25 0.3 0.35 0.40
0.1
0.2
0.3
0.4
0.5
0.6
0.7
0.8
0.9
1
ζN, −
span
, −
Mass averaged nozzle loss, νss
=0.427, Πss
=1.23
0 0.1 0.2 0.3 0.4 0.50
0.1
0.2
0.3
0.4
0.5
0.6
0.7
0.8
0.9
1
ζR, −
span
, −
Mass averaged rotor loss, νss
=0.428, Πss
=1.23
Figure D-8: Span wise mass averaged loss for stator and rotor rows, respectively

Page 64 Doctoral Thesis / Jens Fridh
After integrating the flow parameters along the radius (for stator and rotor) and calculating the total to static stage efficiency according to Eq. D4 yields a 1.3% higher value than the measured global efficiency (based on torque measurements) from global measurements, however within the absolute uncertainty of global measurements. Furthermore, one should be aware of the fact that the global measurements are between axial stations 4 and 7 and not 4 and 6 as in the traverse, which means that the mixing and wall friction losses downstream of the stage between station 6 and 7 are included in the global stage efficiency.
( )242
1
1
4
64
26
26
25
252
1
1 cpp
Tc
cwwc
p
ts
+⎟⎟⎟
⎠
⎞
⎜⎜⎜
⎝
⎛
⎟⎟⎠
⎞⎜⎜⎝
⎛−
−+−⋅=
−κ
κη
(D4)
In large, the ratio of inlet/exit velocities is decisive for the cascade efficiency, which can be observed by comparing loss curves and velocities, right-hand plots in Figure D-7 and Figure D-8. The low rotor loss in the tip region relate to the radial redistribution of fluid and the tip leakage. The loss contours are depicted in Figure D-9 mainly for comparison purpose when partial admission losses are discussed further on.
stator pitch, −
span
, −
Stator loss ζN, ν
ss=0.427, Π
ss=1.23
hub
tip
−0.6 −0.4 −0.2 0 0.2 0.4 0.6−0.2
0
0.2
0.4
0.6
0.8
1
0
0.1
0.2
0.3
0.4
0.5
stator pitch, −
span
, −
Rotor loss ζR, ν
ss=0.428, Π
ss=1.23
hub
tip
−0.6 −0.4 −0.2 0 0.2 0.4 0.6−0.2
0
0.2
0.4
0.6
0.8
1
0
0.1
0.2
0.3
0.4
0.5
Figure D-9: Contours of cascade loss for stator and rotor rows, respectively
Partial admission For comparison reasons the single stage traverse measurements discussed below have been performed at a pressure and velocity ratio which are representative for the upstream stage in the two-stage turbine acting under identical admission degree ε = 0.762 (Πss = 1.30 and νss = 0.425). Area traverses have been performed downstream of the nozzle row and downstream of the rotor row, two stator pitches on the suction and pressure sided sector ends, respectively, depicted in Figure D-10. Due to mechanical constraints the radial traverse performed in the reference case is used for the inlet conditions (station 4). In order to traverse downstream of both sector ends the blockage has to be physically moved, i.e. a shutdown of the turbine is necessary. However, traverses in sections 5 and 6, for each side has been performed during the same trial. Circumferential loss coefficients are calculated at 20, 50 and 80% span and

Doctoral Thesis / Jens Fridh Page 65
compared with losses from the reference case (full admission) with anticipatively similar flow geometry as for an undisturbed part, far from the sector ends.
Figure D-10: Top view, measurement stations 4 to 7. Area traverses regions - thick dashed lines.
Although the absolute uncertainty in magnitude is greater for the partial admission case overall trends can be viewed upon in a qualitative sense. Below, in Figure D-11 the circumferential stator loss is plotted for the suction sided and pressure sided sector ends, on the left-hand and on the right-hand side respectively. A firm observation is the increased loss on the pressure sided sector end for 20 and 80% span at vane 3 (see right-hand sketch in Figure D-10), not only in peak magnitude but also in width of stator wake trace.
−18 −16 −14 −12 −10 −8 −6 −4 −2 00
0.1
0.2
0.3Cicumferential stator row loss − suction sided
−18 −16 −14 −12 −10 −8 −6 −4 −2 00
0.1
0.2
−18 −16 −14 −12 −10 −8 −6 −4 −2 00
0.1
0.2
cicunferential traverse θ, °
ζ N, −
−18 −16 −14 −12 −10 −8 −6 −4 −2 00
0.1
0.2
0.3Cicumferential stator row loss − pressure sided
−18 −16 −14 −12 −10 −8 −6 −4 −2 00
0.1
0.2
−18 −16 −14 −12 −10 −8 −6 −4 −2 00
0.1
0.2
cicunferential traverse θ, °
ζ N, −
ζN20%
ε = 1
ζN20%
ε = 0.762
ζN80%
ε = 1
ζN80%
ε = 0.762
ζN50%
ε = 1
ζN50%
ε = 0.762
Figure D-11: Circumferential stator loss at 80, 50 and 20% span, suction and pressure sided sector ends compared with full admission (reference case).
Furthermore, the increased flow angle (more tangential) on the suction sided sector end, confirmed in Figure D-12 is here seen as loss peak shift of approximately 0.5°. The large change in flow angle, on the pressure sided sector end between the flow passage nearest to the blockage and the adjacent one is interesting. Only the first open nozzle on the pressure side of the sector shows noticeably different exit angles downstream of the stator compared to the reference case. Hence, a considerable amount of the redistribution of flow takes place downstream of the rotor row. Unfortunately the traverse due to mechanical constraints does not cover the entire nozzle adjacent to the blockage.
suction sided sector end, rotor exits arc
pressure sided sector end, rotor enters arc
blockage
-17° 0° Traverse
-17° 0° Traverse
1 23412 3 4

Page 66 Doctoral Thesis / Jens Fridh
stator pitch, −
rad
ius,
mm
Abs. flow angle, α5 [°], ν
ss=0.425, Π
ss=1.30
hub
tip
−1 −0.8 −0.6 −0.4 −0.2 0 0.2 0.4 0.6 0.8 1175
180
185
190
195
200
205
55
60
65
70
75
80
stator pitch, −
rad
ius,
mm
Abs. flow angle, α5 [°], ν
ss=0.426, Π
ss=1.30
hub
tip
−1 −0.8 −0.6 −0.4 −0.2 0 0.2 0.4 0.6 0.8 1175
180
185
190
195
200
205
55
60
65
70
75
80
Figure D-12: Tangential flow angle α5 downstream of stator row (station 5), suction and pressure sided sector ends, respectively
On the contrary and not surprisingly, compared to the stator considerable loss attributes to the rotor at partial admission. Figure D-13 shows the loss for the rotor at 20, 50 and 80% span. Important to remember here is that the traverse grid downstream of the rotor is in the same tangential location as the upstream traverse grid. Here chosen by a trade-off between practical limitations, i.e. either shut down the turbine and move the blockage to traverse or perform the traverses in station 5 and 6 in one trial, the latter was chosen. Hence, due to fluid motion in the relative frame of reference the measurement grid does not correspond to the fluid that passes through the upstream stator grid. For a pitch wise periodic flow (full admission) it is in general not an issue, however for a non-periodic flow such as partial admission it is indeed an issue. A particle trace through the rotational frame of reference can be estimated with geometrical and measured parameters (axial blade chord, tangential flow angles, average axial velocity and blade speed). From this a tangential shift at midspan (in the rotational direction) between the measurement grids is estimated to approximately 12° downstream of the pressure side of the blockage. Thus, this means that fluid passing by the major part of the traverse area downstream of the rotor originates from the wake of the blockage, i.e. low momentum fluid. This is clearly shown in the flow angle contour plot in Figure D-14 (right-hand plot) where the low dynamic pressure and undefined or fluctuating flow direction in the wake of the blockage makes it impossible to reconstruct the flow angle in the left part of the plot.
−18 −16 −14 −12 −10 −8 −6 −4 −2 00
0.2
0.4
0.6
Cicumferential rotor row loss − suction sided
−18 −16 −14 −12 −10 −8 −6 −4 −2 00
0.2
0.4
0.6
−18 −16 −14 −12 −10 −8 −6 −4 −2 00
0.2
0.4
0.6
cicunferential traverse θ, °
ζ R, −
−18 −16 −14 −12 −10 −8 −6 −4 −2 00
0.2
0.4
0.6
Cicumferential rotor row loss − pressure sided
−18 −16 −14 −12 −10 −8 −6 −4 −2 00
0.2
0.4
0.6
−18 −16 −14 −12 −10 −8 −6 −4 −2 00
0.2
0.4
0.6
cicunferential traverse θ, °
ζ R, −
ζR20%
ε = 1
ζR20%
ε = 0.762
ζR80%
ε = 1
ζR80%
ε = 0.762
ζR50%
ε = 1
ζR50%
ε = 0.762
Figure D-13: Circumferential rotor loss at 80, 50 and 20% span, suction and pressure sided sector ends compared with full admission (reference case).
On the suction sided sector end there is a similar shift due to relative rotor motion although not as great due to higher velocities overall. Thus the result that is seen on the left-hand side in Figure D-14 originates from nozzles farther away from the sector end and has roughly the same level of flow angle values as in the reference case (full admission), except the region

Doctoral Thesis / Jens Fridh Page 67
between 0 to 10% span that is influenced by the cavity flow. The cavity flow takes an active part in the flow redistribution to fill up the pressure void immediately downstream of the blockage. The results confirm similar findings by Hushmandi (2010).
stator pitch, −
rad
ius,
mm
Abs. flow angle, α6 [°], ν
ss=0.426, Π
ss=1.30
hub
tip
−1 −0.8 −0.6 −0.4 −0.2 0 0.2 0.4 0.6 0.8 1175
180
185
190
195
200
205
210
215
−60
−50
−40
−30
−20
−10
0
10
20
30
40
stator pitch, −
rad
ius,
mm
Abs. flow angle, α6 [°], ν
ss=0.426, Π
ss=1.30
hub
tip
−1 −0.8 −0.6 −0.4 −0.2 0 0.2 0.4 0.6 0.8 1175
180
185
190
195
200
205
210
215
−60
−50
−40
−30
−20
−10
0
10
20
30
40
Figure D-14: Absolute tangential flow angle α6 downstream of rotor row (station 6), suction and pressure sided sector ends, respectively
The total pressure contour downstream of the nozzle plotted in Figure D-15 basically reflects the loss pattern and for the suction sided sector end is comparable to the reference case. On the pressure side of the sector end an increased pressure deficit in the stator wake tails close to the sector end is recognized. The absolute total pressure downstream of the rotor in Figure D-16 show a reasonable trend mainly due to the bevelled total pressure taps and because of the low dynamic pressure and the small effect in general due to a flow angle change. The high pressure in the right-hand plot in Figure D-16 reflects the filling process where the rotor channel experiences high pressure at the entry into the admission arc as it fights to fill up the almost stagnant rotor channel entering into the admission arc.
stator pitch, −
rad
ius,
mm
p05
[kPa], νss
=0.425, Πss
=1.30
hub
−1 −0.8 −0.6 −0.4 −0.2 0 0.2 0.4 0.6 0.8 1175
180
185
190
195
200
205
110
115
120
125
130
stator pitch, −
rad
ius,
mm
p05
[kPa], νss
=0.426, Πss
=1.30
hub
−1 −0.8 −0.6 −0.4 −0.2 0 0.2 0.4 0.6 0.8 1175
180
185
190
195
200
205
110
115
120
125
130
Figure D-15: Total pressure downstream of stator row (station 5), suction and pressure sided sector ends, respectively. Points in plot indicate traverse points
stator pitch, −
rad
ius,
mm
p06
[kPa], νss
=0.426, Πss
=1.30
hub
tip
−1 −0.8 −0.6 −0.4 −0.2 0 0.2 0.4 0.6 0.8 1175
180
185
190
195
200
205
210
215
99
99.5
100
100.5
101
101.5
102
102.5
103
stator pitch, −
rad
ius,
mm
p06
[kPa], νss
=0.426, Πss
=1.30
hub
tip
−1 −0.8 −0.6 −0.4 −0.2 0 0.2 0.4 0.6 0.8 1175
180
185
190
195
200
205
210
215
99
99.5
100
100.5
101
101.5
102
102.5
103
Figure D-16: Absolute total pressure downstream of rotor row (station 6), suction and pressure sided sector ends, respectively
SS PS

Page 68 Doctoral Thesis / Jens Fridh
The absolute Mach number downstream of the nozzles shows high velocities close to the sector ends as expected. When the rotor exits (left-hand plot in Figure D-17) the admission arc it experiences high velocity, compared to the reference case, for more nozzles than when it enters (right-hand plot). Furthermore, the flow angle is locally more axial when the rotor enters the admission arc which implies higher axial blade force compared to when the rotor exits where the strong tangential flow angle in turn implies an increased tangential blade force.
stator pitch, −
rad
ius,
mm
Abs. Ma5 , ν
ss=0.425, Π
ss=1.30
hub
−1 −0.8 −0.6 −0.4 −0.2 0 0.2 0.4 0.6 0.8 1175
180
185
190
195
200
205
0.25
0.3
0.35
0.4
0.45
0.5
0.55
stator pitch, −
rad
ius,
mm
Abs. Ma5 , ν
ss=0.426, Π
ss=1.30
hub
−1 −0.8 −0.6 −0.4 −0.2 0 0.2 0.4 0.6 0.8 1175
180
185
190
195
200
205
0.25
0.3
0.35
0.4
0.45
0.5
0.55
Figure D-17: Absolute Mach number downstream of stator row (station 5), suction and pressure sided sector ends, respectively
In Figure D-18 the relative Mach number at rotor exit is plotted. In the left-hand figure the effect of the decreased circumferential reaction degree close to the suction sided sector end starts to appear in terms of a velocity decrease. On the other side, rotor entry into the admission arc, the values on the far right can only be trusted due to the aforementioned reconstruction issue.
stator pitch, −
span
, −
Rel. Ma6, ν
ss=0.426, Π
ss=1.30
hub
tip
−1 −0.8 −0.6 −0.4 −0.2 0 0.2 0.4 0.6 0.8 1−0.2
0
0.2
0.4
0.6
0.8
1
0.05
0.1
0.15
0.2
0.25
0.3
0.35
0.4
0.45
stator pitch, −
span
, −
Rel. Ma6, ν
ss=0.426, Π
ss=1.30
hub
tip
−1 −0.8 −0.6 −0.4 −0.2 0 0.2 0.4 0.6 0.8 1−0.2
0
0.2
0.4
0.6
0.8
1
0.05
0.1
0.15
0.2
0.25
0.3
0.35
0.4
0.45
Figure D-18: Relative Mach number downstream of rotor row (station 6), suction and pressure sided sector ends, respectively
The stator loss contour in Figure D-19 coincides with the appearance of the total pressure contours. Here it must be mentioned that the normalized radial pressure gradient from the reference case is used as inlet total pressure (due to mechanical constraints). This is a simplification, however considered to be acceptable.

Doctoral Thesis / Jens Fridh Page 69
stator pitch, −
span
, −Stator loss ζ
N, ν
ss=0.425, Π
ss=1.30
hub
tip
−1 −0.8 −0.6 −0.4 −0.2 0 0.2 0.4 0.6 0.8 1−0.2
0
0.2
0.4
0.6
0.8
1
0
0.1
0.2
0.3
0.4
0.5
stator pitch, −
span
, −
Stator loss ζN, ν
ss=0.426, Π
ss=1.30
hub
tip
−1 −0.8 −0.6 −0.4 −0.2 0 0.2 0.4 0.6 0.8 1−0.2
0
0.2
0.4
0.6
0.8
1
0
0.1
0.2
0.3
0.4
0.5
Figure D-19: Contours of stator loss ζN, suction and pressure sided sector ends, respectively Circumferentially mass averaged values from measurements downstream the stator row are used as upstream reference for the calculation of the rotor loss shown in Figure D-20.
stator pitch, −
span
, −
Rotor loss, νss
=0.426, Πss
=1.30
hub
tip
−1 −0.8 −0.6 −0.4 −0.2 0 0.2 0.4 0.6 0.8 1−0.2
0
0.2
0.4
0.6
0.8
1
0.1
0.2
0.3
0.4
0.5
0.6
stator pitch, −
span
, −
Rotor loss, νss
=0.426, Πss
=1.30
hub
tip
−1 −0.8 −0.6 −0.4 −0.2 0 0.2 0.4 0.6 0.8 1−0.2
0
0.2
0.4
0.6
0.8
1
0.1
0.2
0.3
0.4
0.5
0.6
Figure D-20: Contours of rotor loss ζR, suction and pressure sided sector ends, respectively