Experimental Investigation of Laser Surface Transformation ...
16
Manufacturing and Materials Processing Journal of Article Experimental Investigation of Laser Surface Transformation Hardening of 4340 Steel Spur Gears Al Khader Borki, Abderrazak El Ouafi * and Ahmed Chebak PARL Research Team, Department of Engineering, University of Quebec at Rimouski, Rimouski, QC G5L 3A1, Canada * Correspondence: Abderrazak_elouafi@uqar.ca; Tel.: +1-(418)-723-1986 Received: 29 June 2019; Accepted: 13 August 2019; Published: 15 August 2019 Abstract: This paper presents an experimental investigation of laser surface transformation hardening (LSTH) of 4340 steel spur gears using regression analysis. The experimental work is focused on the effects of various LSTH parameters on the hardness profile shape and the hardened depth variation. The investigations are based on a structured design of experiments and improved statistical analysis tools. The experimentations are carried out on AISI 4340 steel spur gears using a commercial 3 kW Nd:YAG laser system. Laser power, scanning speed, and rotation speed are used as process parameters to evaluate the variation of the hardened depth and to identify the possible relationship between the process parameters and the hardened zone physical and geometrical characteristics. Based on the experimental data and analysis of variance, the direct and interactive contributions of the process parameters on the variation of the hardness profile shape and the hardened depth are analyzed. The main effects and the interaction effects are also evaluated. The results reveal that all the process parameters are relevant. The cumulative contribution of the three parameters in the hardened depth variation represents more than 80% with a clear predominance of laser power. The contribution of the interactions between the parameters represents 12% to 16%. The resulting hardness values are relatively similar for all the experimental tests with about 60 HRC. The evaluation of the produced regression models for hardened depth prediction shows limited performance suggesting that the predictive modeling process can be improved. Keywords: laser surface transformation hardening; AISI 4340 alloy steel; spur gears; hardness profile; hardened depth; design of experiments; analysis of variance 1. Introduction Surface transformation hardening processes are designed to produce wear-, corrosion-, and fatigue-resistant surfaces with increased lifetime for various industrial applications by hardening the superficial critical areas using localized heat gains. Among these processes, laser surface transformation hardening process (LSTH) is considered as an interesting alternative process to the traditional methods due to several advantages such as high-power density, rapidity, flexibility, full process control, minimized total energy, reduced distortion, and reduced thermal affected zone. LSTH of steels is a potentially promising industrial application considering the broad employment of steels in a variety of industries. Many different types of alloy steel mechanical components such as bearing, cams, gears, shafts, pistons, and rings, that need to have a very hard surface, can be hardened using LSTH [1–3]. The ability to deliver a controlled rate of heat energy to the expected surface area of the part is one of the most significant advantages of using laser as a heating source. The absorbed energy is dependent on the absorptivity of the part surface, which depends on the wavelength of the laser beam. For steels, the absorptivity increases when the wavelength is short. The Nd:YAG laser system with short wavelength at 1064 nm is suggested for surface hardening of steel [4]. In LSTH, J. Manuf. Mater. Process. 2019, 3, 72; doi:10.3390/jmmp3030072 www.mdpi.com/journal/jmmp
Transcript of Experimental Investigation of Laser Surface Transformation ...

Manufacturing andMaterials Processing
Journal of
Article
Experimental Investigation of Laser SurfaceTransformation Hardening of 4340 Steel Spur Gears
Al Khader Borki, Abderrazak El Ouafi * and Ahmed Chebak
PARL Research Team, Department of Engineering, University of Quebec at Rimouski,Rimouski, QC G5L 3A1, Canada* Correspondence: [email protected]; Tel.: +1-(418)-723-1986
Received: 29 June 2019; Accepted: 13 August 2019; Published: 15 August 2019�����������������
Abstract: This paper presents an experimental investigation of laser surface transformation hardening(LSTH) of 4340 steel spur gears using regression analysis. The experimental work is focused onthe effects of various LSTH parameters on the hardness profile shape and the hardened depthvariation. The investigations are based on a structured design of experiments and improved statisticalanalysis tools. The experimentations are carried out on AISI 4340 steel spur gears using a commercial3 kW Nd:YAG laser system. Laser power, scanning speed, and rotation speed are used as processparameters to evaluate the variation of the hardened depth and to identify the possible relationshipbetween the process parameters and the hardened zone physical and geometrical characteristics.Based on the experimental data and analysis of variance, the direct and interactive contributions ofthe process parameters on the variation of the hardness profile shape and the hardened depth areanalyzed. The main effects and the interaction effects are also evaluated. The results reveal that all theprocess parameters are relevant. The cumulative contribution of the three parameters in the hardeneddepth variation represents more than 80% with a clear predominance of laser power. The contributionof the interactions between the parameters represents 12% to 16%. The resulting hardness values arerelatively similar for all the experimental tests with about 60 HRC. The evaluation of the producedregression models for hardened depth prediction shows limited performance suggesting that thepredictive modeling process can be improved.
Keywords: laser surface transformation hardening; AISI 4340 alloy steel; spur gears; hardness profile;hardened depth; design of experiments; analysis of variance
1. Introduction
Surface transformation hardening processes are designed to produce wear-, corrosion-, andfatigue-resistant surfaces with increased lifetime for various industrial applications by hardening thesuperficial critical areas using localized heat gains. Among these processes, laser surface transformationhardening process (LSTH) is considered as an interesting alternative process to the traditional methodsdue to several advantages such as high-power density, rapidity, flexibility, full process control,minimized total energy, reduced distortion, and reduced thermal affected zone.
LSTH of steels is a potentially promising industrial application considering the broad employmentof steels in a variety of industries. Many different types of alloy steel mechanical components such asbearing, cams, gears, shafts, pistons, and rings, that need to have a very hard surface, can be hardenedusing LSTH [1–3]. The ability to deliver a controlled rate of heat energy to the expected surface area ofthe part is one of the most significant advantages of using laser as a heating source. The absorbedenergy is dependent on the absorptivity of the part surface, which depends on the wavelength of thelaser beam. For steels, the absorptivity increases when the wavelength is short. The Nd:YAG lasersystem with short wavelength at 1064 nm is suggested for surface hardening of steel [4]. In LSTH,
J. Manuf. Mater. Process. 2019, 3, 72; doi:10.3390/jmmp3030072 www.mdpi.com/journal/jmmp

J. Manuf. Mater. Process. 2019, 3, 72 2 of 16
the laser sources provide a controllable heat in the selected area to produce thin hardened surfacelayers. When a region of the part surface is exposed to the laser beam, the temperature increasesrapidly, resulting in a thin layer converted into austenite, while the temperature of the rest of partremains unaffected. When the laser beam moves with respect to the part, the part areas in the beamtrack are rapidly heated and cooled because the self-quenching caused conduction into the relativelycool bulk of the material. In LSTH, the control of rapid heating and cooling is the basic ingredient totransform the austenite into hard martensite structure at the surface [5–11].
To exploit appropriately the benefits presented by LSTH, it is necessary to develop a comprehensivestrategy to control the heating process in order to produce the appropriate martensite structure, andthen the desired hardened surface characteristics without being forced to use the traditional andfastidious trial and error procedures. In this process, the thermo-physical properties of the material andthe heating system parameters have significant effects [12]. To address this problem, several researchersproposed various experimental and modeling approaches as attempts to establish the relationshipsbetween laser processing parameters and hardness profile. In the majority of the proposed approaches,laser power, scanning speed, beam spot size, focal length, and rotation speed are considered asprocess parameters to evaluate hardness profile attributes, such as hardened depth, hardened width,or hardened area. In the LSTH process, the key objective is to achieve a hardened surface withminimum hardened depth and maximum hardened width. The traditional procedure used to selectthe appropriate combination of parameters to reach these objectives consists of setting the parametersby conducting a number of experiments by varying one parameter at a time in order to evaluatethe parameter’s effects. As the process parameters are interrelated by nonlinear relationships, thisprocedure cannot lead to convincing results despite the prohibitive number of experiments, whichleads to more time and costs. These problems can be avoided if appropriate prediction models aredesigned. These models can not only predict the most suitable process parameters for the desiredhardness profiles but also help to a better understanding of their relative influence on the treatedmaterial properties.
Several modeling approaches to LSTH are available [11–16]. In LSTH, two modeling approachescan be proposed: Numerical modeling and empirical modeling. The first case refers essentially to thecombination of material non-linear properties, laser sport form and motion and heat-flow equationsolved using the finite element method (FEM) in order to define the temperature distribution duringthe heating process [15–17]. The hardness is then approximated by the equations of Ashby andEasterling [18]. The obtained model can be validated using experimental data and then used forsimulation, prediction, and optimization. In the second case, data collected using a structured designof experiments are processed using analysis techniques such as analysis of variance, regression analysisand response surface methodology to establish the relationships between the process parameters andthe hardness profile attributes [19,20]. Other modeling approaches use expert system [21] and neuralnetworks [22,23].
Interesting results are established using different modeling approaches on several types ofmaterials and different part geometries. However, some laser surface hardening issues are far fromcomplete and many research works are needed. When LSTH is applied to relatively complex surfaces,such as gears and spline shafts, particular attention must be focused on the desired hardness profile fordifferent regions of the gear tooth. Indeed, gears are often surface hardened to increase their resistanceto wear and fatigue. The thickness of the hardened layer must be deep enough to endure the maximumstress on the gear without affecting the rest of the tooth. However, an excessive hardened depth leavesthe tooth too brittle to withstand tensile stresses.
The type of gear, tooth geometry, and hardness profile, as well as the operating load conditions tobe tolerated, are important factors to consider when looking for the ideal thickness of the hardenedlayer [24,25]. Usually, a uniform hardened layer is considered to be the best profile for hardening gear.This is not necessarily always the case. In many applications, some variety of non-uniform profiles canprovide gears with better performance. Uniform hardness profile is popular for medium-size gears.
J. Manuf. Mater. Process. 2019, 3, 72 3 of 16
As the gear teeth are not completely hardened, a relatively ductile core (35 to 45 HRC) combined witha hard surface (55 to 65 HRC) offer very remarkable gear properties, such as excellent wear resistance,toughness, and bending strength, and allows greater gear durability. However, it is essential to hardenall parts of the gear surface, including flanks and roots zones. An uninterrupted hardened patternon all contact areas of the tooth indicates good wear properties of the gear and ensures a relativelycontinuous distribution of desirable compressive stresses at the gear surface.
An ideal hardness pattern consists of uniform thickness along the flank of the tooth and betweenthe fillets. This implies that the energy must be applied in a non-uniform manner to generate a uniformhardened depth, which is not easy to achieve in practice. However, it is possible to approach it byjudiciously controlling the process parameters that have an influence on heat transfer and energyabsorption [25]. Laser power, scanning speed and rotation speed can then play a major role in the casedepth control.
The objective of this work is to conduct an experimental investigation of the process parametereffects on the hardness profile of 4340 steel spur gears. The used methodology is based on threesteps. First, a preliminary exploration is conducted to determine the appropriate range of the processparameters and evaluate their main effects on the hardness profile in order to develop a structuredstrategy for an efficient design of experiments. The second step consists of developing and performinga systematic experimental investigation using Taguchi method. Finally, the third step consists ofanalyzing the experimental data in order to evaluate direct and interactions effects of the processparameters on the hardened depth. The experimentations are performed on a commercial 3 kWNd:YAG laser system using laser power, scanning speed, and rotation speed as principal factors.
2. Experimental Investigation
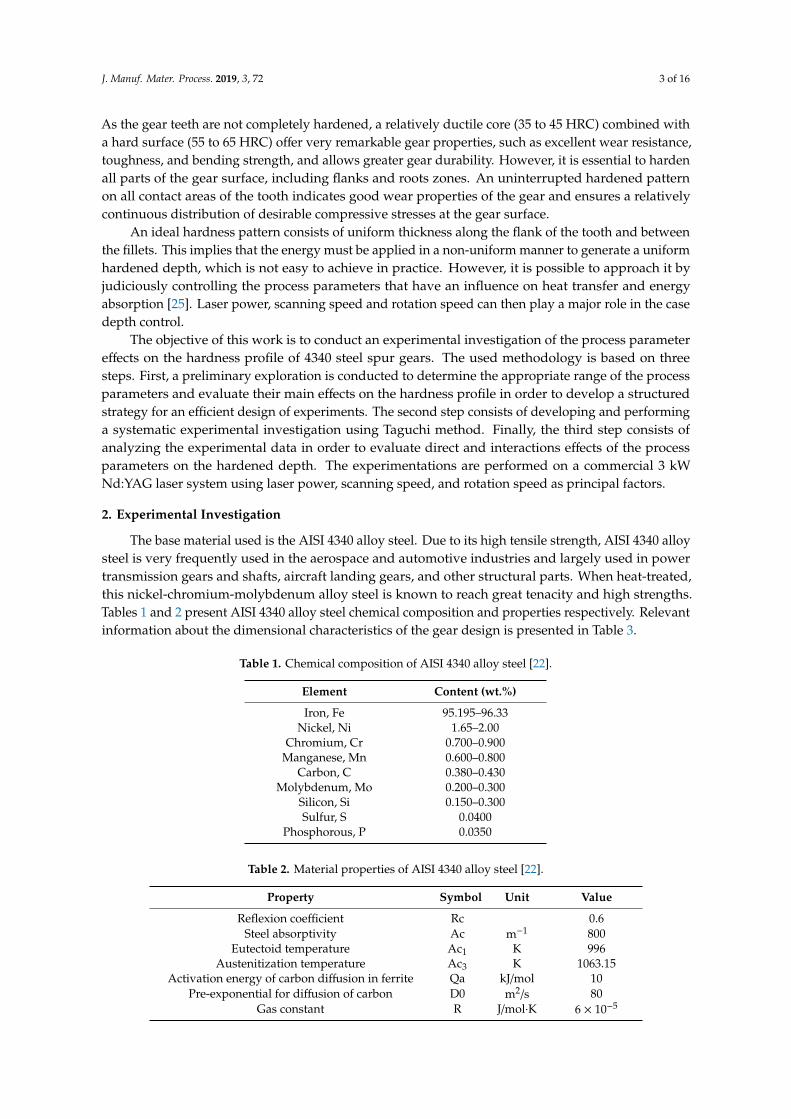
The base material used is the AISI 4340 alloy steel. Due to its high tensile strength, AISI 4340 alloysteel is very frequently used in the aerospace and automotive industries and largely used in powertransmission gears and shafts, aircraft landing gears, and other structural parts. When heat-treated,this nickel-chromium-molybdenum alloy steel is known to reach great tenacity and high strengths.Tables 1 and 2 present AISI 4340 alloy steel chemical composition and properties respectively. Relevantinformation about the dimensional characteristics of the gear design is presented in Table 3.
Table 1. Chemical composition of AISI 4340 alloy steel [22].
Element Content (wt.%)
Iron, Fe 95.195–96.33Nickel, Ni 1.65–2.00
Chromium, Cr 0.700–0.900Manganese, Mn 0.600–0.800
Carbon, C 0.380–0.430Molybdenum, Mo 0.200–0.300
Silicon, Si 0.150–0.300Sulfur, S 0.0400
Phosphorous, P 0.0350
Table 2. Material properties of AISI 4340 alloy steel [22].
Property Symbol Unit Value
Reflexion coefficient Rc 0.6Steel absorptivity Ac m−1 800
Eutectoid temperature Ac1 K 996Austenitization temperature Ac3 K 1063.15
Activation energy of carbon diffusion in ferrite Qa kJ/mol 10Pre-exponential for diffusion of carbon D0 m2/s 80
Gas constant R J/mol·K 6 × 10⁻⁵

J. Manuf. Mater. Process. 2019, 3, 72 4 of 16
Table 2. Cont.
Property Symbol Unit Value
Steel carbon content C 0.34%Austenite carbon content Ce 0.8%
Ferrite carbon content Cf 0.01%Critical value of carbon content Cc 0.05%
Volume fraction of pearlite colonies fi 0.5375
Table 3. Dimensional characteristics of the gear.
Characteristics Symbols Values (in) Characteristics Symbols Values (in)
Pitch diameter D 4 Circular pitch CP 0.262Number of teeth N 48 Circular thickness T 0.131Diametral pitch Dp 12 Working depth WD 0.167Pressure angle α 20 Internal diameter ID 1.181
Addendum A 0.083 Face width FW 0.256Dedendum B 0.096 Surface roughness Ra 6.3
Outside diameter OD 4.167 Material Mat SAE 4340Root diameter RD 3.833 Hardness core HRC 40 HRC
2.1. Process Parameters Identification
The variables that have a significant influence on the hardness profile are clearly identified in theliterature [26]. Several studies on LSTH of various grades of steel identified laser power (P), scanningspeed (SS) and rotational speed (RS) as the factors that most affect the hardness profile and produceimportant effects on the hardened depth [25–27]. Therefore, these three parameters are selected for thepresent study.
2.2. Experimental Setup
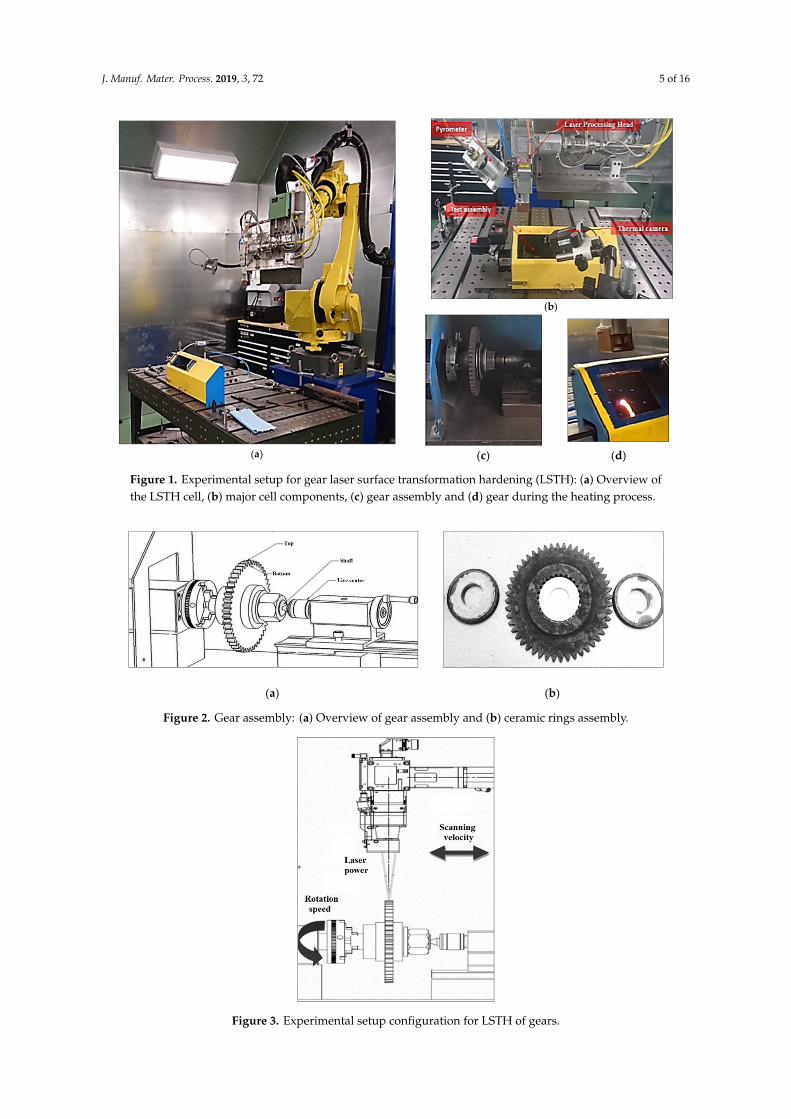
An overview of the laser cell used as an experimental setup for the gear’s laser hardening ispresented in Figure 1. The laser cell consisted of an articulated robot with six degrees of freedom,an Nd:YAG high-power laser system, a mini lathe, an infrared imaging device, a data acquisitionsystem, and safety systems. The Fanuc M-710iC robot was used to handle the Highyag Bimo laserprocessing head.
The laser heat source was an IPG YLS-3000-ST2 generating a power output up to 3.2 kW at1064 nm wavelength. The mini lathe was equipped with a variable-speed drive capable of speeds up to9500 rpm. The mini lathe was fixed to ensure that the spot could translate along the axis of the rotatingpart. An accurate thermographic imaging method using a FLIR A325 infrared camera was adoptedfor the surface temperature measurements. The FLIR was located close to the part at the adequatefocal distance for better spatial resolution needed to understand the physical phenomena and later tocontrol the process parameters. To protect the mini-lathe components, it was necessary to avoid thethermal transfer from the gear assembly to the mini-lathe components (live center, chucks...). To do so,alumina ceramic rings were inserted between the shaft and the gear as illustrated in Figure 2. The lasersetup configuration is illustrated in Figure 3. The temperatures in selected points of the assembly wereconstantly monitored, as shown in Figure 4. Figure 5 presents an illustration of typical temperaturedistribution during the heating process. Note that the temperature was not uniform throughout thegear. However, since the gear was rotating, it was possible to assume that different portions of theexposed surface would receive the same quality of heat.
J. Manuf. Mater. Process. 2019, 3, 72 5 of 16J. Manuf. Mater. Process. 2019, 3, x FOR PEER REVIEW 5 of 16
(a)
(b)
(c) (d)
Figure 1. Experimental setup for gear laser surface transformation hardening (LSTH): (a) Overview of the LSTH cell, (b) major cell components, (c) gear assembly and (d) gear during the heating process.
(a) (b)
Figure 2. Gear assembly: (a) Overview of gear assembly and (b) ceramic rings assembly.
Figure 3. Experimental setup configuration for LSTH of gears.
Figure 1. Experimental setup for gear laser surface transformation hardening (LSTH): (a) Overview ofthe LSTH cell, (b) major cell components, (c) gear assembly and (d) gear during the heating process.
J. Manuf. Mater. Process. 2019, 3, x FOR PEER REVIEW 5 of 16
(a)
(b)
(c) (d)
Figure 1. Experimental setup for gear laser surface transformation hardening (LSTH): (a) Overview of the LSTH cell, (b) major cell components, (c) gear assembly and (d) gear during the heating process.
(a) (b)
Figure 2. Gear assembly: (a) Overview of gear assembly and (b) ceramic rings assembly.
Figure 3. Experimental setup configuration for LSTH of gears.
Figure 2. Gear assembly: (a) Overview of gear assembly and (b) ceramic rings assembly.
J. Manuf. Mater. Process. 2019, 3, x FOR PEER REVIEW 5 of 16
(a)
(b)
(c) (d)
Figure 1. Experimental setup for gear laser surface transformation hardening (LSTH): (a) Overview of the LSTH cell, (b) major cell components, (c) gear assembly and (d) gear during the heating process.
(a) (b)
Figure 2. Gear assembly: (a) Overview of gear assembly and (b) ceramic rings assembly.
Figure 3. Experimental setup configuration for LSTH of gears. Figure 3. Experimental setup configuration for LSTH of gears.

J. Manuf. Mater. Process. 2019, 3, 72 6 of 16J. Manuf. Mater. Process. 2019, 3, x FOR PEER REVIEW 6 of 16
Figure 4. Typical variation of the measured temperatures during the heating process.
Figure 5. Typical temperature distribution during the heating process.
Before the laser surface transformation hardening, the parts were machined, hardened, and tempered to reach an initial core hardness of about 45 HRC. Following the heat treatment, the specimens were cautiously prepared, polished, and etched using Nital chemical solution (95% of ethanol and 5% of nitric acid). The hardness profiles construction was based on programmed micro-hardness measurements using a Clemex machine. The temperature of the preheating was set at 480 °C in the gear bottom. Particular attention was paid when measuring the micro-hardness at the bottom of the spur gear teeth where there is normally less hardening. As illustrated in Figure 6, a visible crack appeared in the hardened gear bottom, suggesting that the bottom is the most fragile location.
Figure 6. Fatigue test on hardened gear.
0
200
400
600
800
1000
1200
0 40 80 120 160 200
Tem
pera
ture
(Deg
. C)
Time (s)
Live centerShaftBottom
Figure 4. Typical variation of the measured temperatures during the heating process.
J. Manuf. Mater. Process. 2019, 3, x FOR PEER REVIEW 6 of 16
Figure 4. Typical variation of the measured temperatures during the heating process.
Figure 5. Typical temperature distribution during the heating process.
Before the laser surface transformation hardening, the parts were machined, hardened, and tempered to reach an initial core hardness of about 45 HRC. Following the heat treatment, the specimens were cautiously prepared, polished, and etched using Nital chemical solution (95% of ethanol and 5% of nitric acid). The hardness profiles construction was based on programmed micro-hardness measurements using a Clemex machine. The temperature of the preheating was set at 480 °C in the gear bottom. Particular attention was paid when measuring the micro-hardness at the bottom of the spur gear teeth where there is normally less hardening. As illustrated in Figure 6, a visible crack appeared in the hardened gear bottom, suggesting that the bottom is the most fragile location.
Figure 6. Fatigue test on hardened gear.
0
200
400
600
800
1000
1200
0 40 80 120 160 200
Tem
pera
ture
(Deg
. C)
Time (s)
Live centerShaftBottom
Figure 5. Typical temperature distribution during the heating process.
Before the laser surface transformation hardening, the parts were machined, hardened, andtempered to reach an initial core hardness of about 45 HRC. Following the heat treatment, thespecimens were cautiously prepared, polished, and etched using Nital chemical solution (95% ofethanol and 5% of nitric acid). The hardness profiles construction was based on programmedmicro-hardness measurements using a Clemex machine. The temperature of the preheating was set at480 ◦C in the gear bottom. Particular attention was paid when measuring the micro-hardness at thebottom of the spur gear teeth where there is normally less hardening. As illustrated in Figure 6, a visiblecrack appeared in the hardened gear bottom, suggesting that the bottom is the most fragile location.
J. Manuf. Mater. Process. 2019, 3, x FOR PEER REVIEW 6 of 16
Figure 4. Typical variation of the measured temperatures during the heating process.
Figure 5. Typical temperature distribution during the heating process.
Before the laser surface transformation hardening, the parts were machined, hardened, and tempered to reach an initial core hardness of about 45 HRC. Following the heat treatment, the specimens were cautiously prepared, polished, and etched using Nital chemical solution (95% of ethanol and 5% of nitric acid). The hardness profiles construction was based on programmed micro-hardness measurements using a Clemex machine. The temperature of the preheating was set at 480 °C in the gear bottom. Particular attention was paid when measuring the micro-hardness at the bottom of the spur gear teeth where there is normally less hardening. As illustrated in Figure 6, a visible crack appeared in the hardened gear bottom, suggesting that the bottom is the most fragile location.
Figure 6. Fatigue test on hardened gear.
0
200
400
600
800
1000
1200
0 40 80 120 160 200
Tem
pera
ture
(Deg
. C)
Time (s)
Live centerShaftBottom
Figure 6. Fatigue test on hardened gear.

J. Manuf. Mater. Process. 2019, 3, 72 7 of 16
2.3. Preliminary Tests and Results
In order to determine the appropriate range of the process parameters and to approximatetheir main effects on the hardness profile, a preliminary experimental exploration was performed.The experimentation tests were done on spur gears made of AISI 4340 steel using laser P, SS, and RS asexperimental factors. During this stage, these factors were varied in specific ranges. The hardnessprofile evaluation started by examining visually the cross-section of the specimen, and then bymeasuring the micro-hardness as a function of the depth from the surface to the end of the transformedzone. The case depth was defined by the depth depicting the hardened area. The hardness wasmeasured on the hardened gear cross-section at 18 points at a separation distance of 250 µm along twoparallel lines passing through the middle of the tooth tip and the middle of the tooth root. When onefactor was varied, the others were set to their average values. P is varied from 1800 W to 2500 W,SS from 0.15 to 0.45 mm/s and RS from 3000 to 4000 rpm. The hardened depth and the smoothness ofthe transition between hardened zone and base material with negligible heat-affected zone were themajor criteria used for the identification of the working ranges.
Figures 7 and 8 represent the hardness curves for typical preliminary tests representing thevariation effects of SS, RS, and P, respectively. These hardness curves can be divided typically intothree regions. Recognized by its high hardness compared to the part core, the first region was totallyaustenitized and transformed to martensite upon rapid cooling. The second region was identified bya radical decreasing in hardness before reaching the core hardness. This region was characterizedby the hardness loss caused by a severe drop in hardness to reach initial hardness. This zone wasconsidered as a mixture of hard and over-tempered martensite when the temperature was between Ac1and Ac3. Finally, the third region corresponded to the zone not affected by the thermal flow. The casedepth was then characterized by the first zone, called the hard zone [27].
J. Manuf. Mater. Process. 2019, 3, x FOR PEER REVIEW 7 of 16
2.3. Preliminary Tests and Results
In order to determine the appropriate range of the process parameters and to approximate their main effects on the hardness profile, a preliminary experimental exploration was performed. The experimentation tests were done on spur gears made of AISI 4340 steel using laser P, SS, and RS as experimental factors. During this stage, these factors were varied in specific ranges. The hardness profile evaluation started by examining visually the cross-section of the specimen, and then by measuring the micro-hardness as a function of the depth from the surface to the end of the transformed zone. The case depth was defined by the depth depicting the hardened area. The hardness was measured on the hardened gear cross-section at 18 points at a separation distance of 250 µm along two parallel lines passing through the middle of the tooth tip and the middle of the tooth root. When one factor was varied, the others were set to their average values. P is varied from 1800 W to 2500 W, SS from 0.15 to 0.45 mm/s and RS from 3000 to 4000 rpm. The hardened depth and the smoothness of the transition between hardened zone and base material with negligible heat-affected zone were the major criteria used for the identification of the working ranges.
Figure 7 and Figure 8 represent the hardness curves for typical preliminary tests representing the variation effects of SS, RS, and P, respectively. These hardness curves can be divided typically into three regions. Recognized by its high hardness compared to the part core, the first region was totally austenitized and transformed to martensite upon rapid cooling. The second region was identified by a radical decreasing in hardness before reaching the core hardness. This region was characterized by the hardness loss caused by a severe drop in hardness to reach initial hardness. This zone was considered as a mixture of hard and over-tempered martensite when the temperature was between Ac1 and Ac3. Finally, the third region corresponded to the zone not affected by the thermal flow. The case depth was then characterized by the first zone, called the hard zone [27].
Figure 7. Typical hardness curves for gear teeth top versus process parameters.
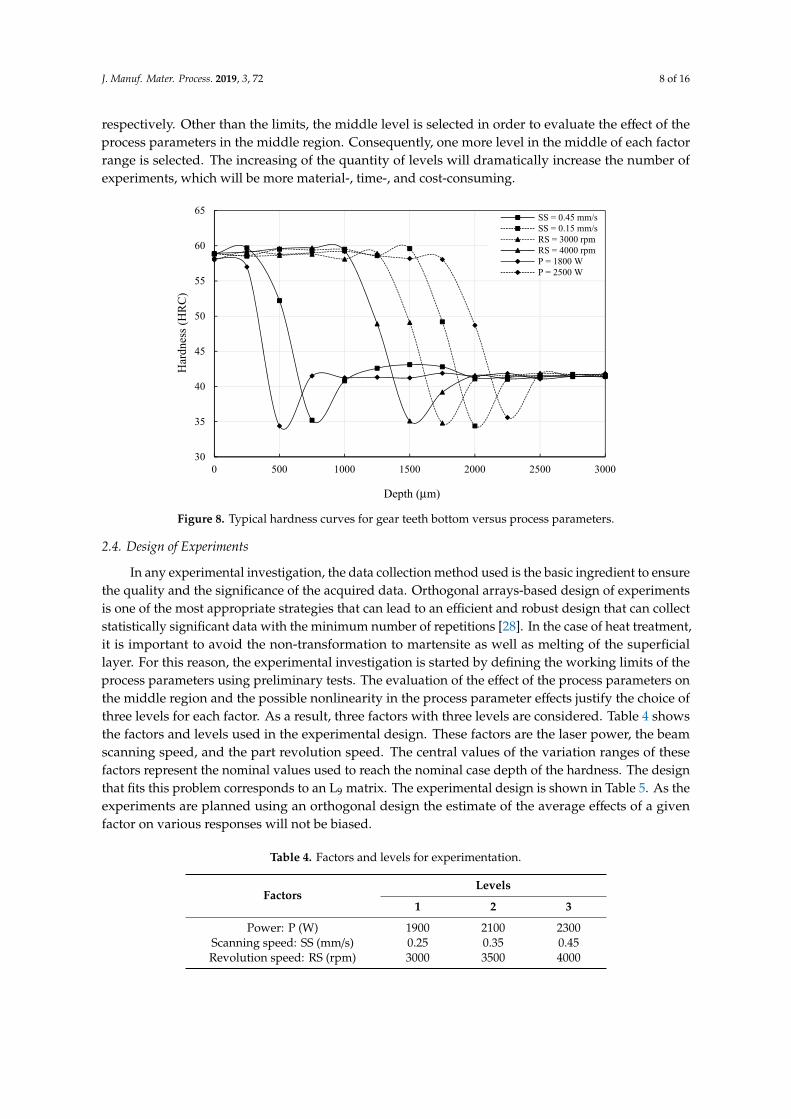
The experimental results show that the hardness remains relatively constant within the hardened depth before dropping off to reach the initial hardness value despite the variation of the process parameters. From these preliminary results, several observations can be made. The surface hardness value is similar in all cases through the preheating stage. As expected, decreasing the SS or the revolution speed results in increasing the hardened depth. However, increasing the power results in increasing the hardened depth. Using these preliminary experimental observations, the working limits of the process parameters to achieve the desired hardening conditions are selected. The selected (lower–upper) ranges for P, SS, and RS are (1900–2300 W), (0.25–0.45 mm/s), and (3000–4000 rpm), respectively. Other than the limits, the middle level is selected in order to evaluate the effect of the
30
35
40
45
50
55
60
65
0 500 1000 1500 2000 2500 3000 3500 4000
Har
dnes
s (H
RC)
Depth (μm)
SS = 0.45 mm/sSS = 0.15 mm/sRS = 3000 rpmRS = 4000 rpmP = 1800 WP = 2500 W
Figure 7. Typical hardness curves for gear teeth top versus process parameters.
The experimental results show that the hardness remains relatively constant within the hardeneddepth before dropping off to reach the initial hardness value despite the variation of the processparameters. From these preliminary results, several observations can be made. The surface hardnessvalue is similar in all cases through the preheating stage. As expected, decreasing the SS or therevolution speed results in increasing the hardened depth. However, increasing the power resultsin increasing the hardened depth. Using these preliminary experimental observations, the workinglimits of the process parameters to achieve the desired hardening conditions are selected. The selected(lower–upper) ranges for P, SS, and RS are (1900–2300 W), (0.25–0.45 mm/s), and (3000–4000 rpm),
J. Manuf. Mater. Process. 2019, 3, 72 8 of 16
respectively. Other than the limits, the middle level is selected in order to evaluate the effect of theprocess parameters in the middle region. Consequently, one more level in the middle of each factorrange is selected. The increasing of the quantity of levels will dramatically increase the number ofexperiments, which will be more material-, time-, and cost-consuming.
J. Manuf. Mater. Process. 2019, 3, x FOR PEER REVIEW 8 of 16
process parameters in the middle region. Consequently, one more level in the middle of each factor range is selected. The increasing of the quantity of levels will dramatically increase the number of experiments, which will be more material-, time-, and cost-consuming.
Figure 8. Typical hardness curves for gear teeth bottom versus process parameters.
2.4. Design of Experiments
In any experimental investigation, the data collection method used is the basic ingredient to ensure the quality and the significance of the acquired data. Orthogonal arrays-based design of experiments is one of the most appropriate strategies that can lead to an efficient and robust design that can collect statistically significant data with the minimum number of repetitions [28]. In the case of heat treatment, it is important to avoid the non-transformation to martensite as well as melting of the superficial layer. For this reason, the experimental investigation is started by defining the working limits of the process parameters using preliminary tests. The evaluation of the effect of the process parameters on the middle region and the possible nonlinearity in the process parameter effects justify the choice of three levels for each factor. As a result, three factors with three levels are considered. Table 4 shows the factors and levels used in the experimental design. These factors are the laser power, the beam scanning speed, and the part revolution speed. The central values of the variation ranges of these factors represent the nominal values used to reach the nominal case depth of the hardness. The design that fits this problem corresponds to an L9 matrix. The experimental design is shown in Table 5. As the experiments are planned using an orthogonal design the estimate of the average effects of a given factor on various responses will not be biased.
Table 4. Factors and levels for experimentation.
Factors Levels
1 2 3 Power: P (W) 1900 2100 2300
Scanning speed: SS (mm/s) 0.25 0.35 0.45 Revolution speed: RS (rpm) 3000 3500 4000
Table 5. Experimental design using L9.
Tests P (W) SS (mm/s) RS (rpm) T1 1900 0.25 3000 T2 1900 0.35 3500
30
35
40
45
50
55
60
65
0 500 1000 1500 2000 2500 3000
Har
dnes
s (H
RC)
Depth (μm)
SS = 0.45 mm/sSS = 0.15 mm/sRS = 3000 rpmRS = 4000 rpmP = 1800 WP = 2500 W
Figure 8. Typical hardness curves for gear teeth bottom versus process parameters.
2.4. Design of Experiments
In any experimental investigation, the data collection method used is the basic ingredient to ensurethe quality and the significance of the acquired data. Orthogonal arrays-based design of experimentsis one of the most appropriate strategies that can lead to an efficient and robust design that can collectstatistically significant data with the minimum number of repetitions [28]. In the case of heat treatment,it is important to avoid the non-transformation to martensite as well as melting of the superficiallayer. For this reason, the experimental investigation is started by defining the working limits of theprocess parameters using preliminary tests. The evaluation of the effect of the process parameters onthe middle region and the possible nonlinearity in the process parameter effects justify the choice ofthree levels for each factor. As a result, three factors with three levels are considered. Table 4 showsthe factors and levels used in the experimental design. These factors are the laser power, the beamscanning speed, and the part revolution speed. The central values of the variation ranges of thesefactors represent the nominal values used to reach the nominal case depth of the hardness. The designthat fits this problem corresponds to an L9 matrix. The experimental design is shown in Table 5. As theexperiments are planned using an orthogonal design the estimate of the average effects of a givenfactor on various responses will not be biased.
Table 4. Factors and levels for experimentation.
FactorsLevels
1 2 3
Power: P (W) 1900 2100 2300Scanning speed: SS (mm/s) 0.25 0.35 0.45Revolution speed: RS (rpm) 3000 3500 4000

J. Manuf. Mater. Process. 2019, 3, 72 9 of 16
Table 5. Experimental design using L9.
Tests P (W) SS (mm/s) RS (rpm)
T1 1900 0.25 3000T2 1900 0.35 3500T3 1900 0.45 4000T4 2100 0.25 3500T5 2100 0.35 4000T6 2100 0.45 3000T7 2300 0.25 4000T8 2300 0.35 3000T9 2300 0.45 3500
3. Experimental Data Analysis
Three major statistical tools are used to analyze the produced experimental data: The graph ofthe average effects of each factor level on the mean hardened depth (bottom and top), the percentcontribution of factors in the mean hardened depth variation extracted from the analysis of variance(ANOVA), and the correlation between the mean hardened depth and various factors. The percentcontribution of an experimental factor represents the portion of the variation observed in theexperimental data that is attributed to that specific factor. Typically, the total percent contributionof all considered experimental factors must add up to 100. The difference from 100 is credited tothe contribution of other uncontrolled factors as well to experimental errors. Using these results,it is possible to extract some accurate and useful indicators on the best combination of the processparameters to consider for eventual predictive modeling.
As the first observation of data indicates that the minimum values of the hardened depth (top andbottom) are obtained in test 3 using 1900 W, 0.45 mm/s and 4000 rpm for P, SS, and RS, respectively.The maximal values of the hardened depth (top and bottom) are obtained in test 8 using 2300 W,0.35 mm/s and 3000 rpm for P, SS, and RS, respectively. The second observation indicates, as illustratedin Figure 9, that T1, T4, and T9 produce the same result in terms of hardness profile and hardened depthdemonstrating that different process parameter combinations can lead to identical gear teeth top andbottom hardened depths, suggesting multiple options for an eventual cost and production optimizationprocess. Finally, a strong correlation is observed between top and bottom hardened depths.
J. Manuf. Mater. Process. 2019, 3, x FOR PEER REVIEW 9 of 16
T3 1900 0.45 4000 T4 2100 0.25 3500 T5 2100 0.35 4000 T6 2100 0.45 3000 T7 2300 0.25 4000 T8 2300 0.35 3000 T9 2300 0.45 3500
3. Experimental Data Analysis
Three major statistical tools are used to analyze the produced experimental data: The graph of the average effects of each factor level on the mean hardened depth (bottom and top), the percent contribution of factors in the mean hardened depth variation extracted from the analysis of variance (ANOVA), and the correlation between the mean hardened depth and various factors. The percent contribution of an experimental factor represents the portion of the variation observed in the experimental data that is attributed to that specific factor. Typically, the total percent contribution of all considered experimental factors must add up to 100. The difference from 100 is credited to the contribution of other uncontrolled factors as well to experimental errors. Using these results, it is possible to extract some accurate and useful indicators on the best combination of the process parameters to consider for eventual predictive modeling.
As the first observation of data indicates that the minimum values of the hardened depth (top and bottom) are obtained in test 3 using 1900 W, 0.45 mm/s and 4000 rpm for P, SS, and RS, respectively. The maximal values of the hardened depth (top and bottom) are obtained in test 8 using 2300 W, 0.35 mm/s and 3000 rpm for P, SS, and RS, respectively. The second observation indicates, as illustrated in Figure 9, that T1, T4, and T9 produce the same result in terms of hardness profile and hardened depth demonstrating that different process parameter combinations can lead to identical gear teeth top and bottom hardened depths, suggesting multiple options for an eventual cost and production optimization process. Finally, a strong correlation is observed between top and bottom hardened depths.
Figure 9. Typical hardness curves at gear teeth top and bottom vs. depth for tests T1, T4, and T9.
As indicated, the objective of ANOVA is to investigate whether the parameters and the interactions present significant effects on the hardened depth in order to identify the variables to be included in the prediction model. Extracted from ANOVA, Figure 10 shows that the top hardened depth is affected at different degrees by the process parameters. The direction and the slope of each graph determine the effect of each of the three parameters. The factor most affecting the hardened
30
35
40
45
50
55
60
65
0 500 1000 1500 2000 2500 3000 3500 4000
Har
dnes
s (H
RC)
Depth (μm)
T1_TopT4_TopT9_TopT1_BottomT4_BottomT9_Bottom
Figure 9. Typical hardness curves at gear teeth top and bottom vs. depth for tests T1, T4, and T9.

J. Manuf. Mater. Process. 2019, 3, 72 10 of 16
As indicated, the objective of ANOVA is to investigate whether the parameters and the interactionspresent significant effects on the hardened depth in order to identify the variables to be includedin the prediction model. Extracted from ANOVA, Figure 10 shows that the top hardened depth isaffected at different degrees by the process parameters. The direction and the slope of each graphdetermine the effect of each of the three parameters. The factor most affecting the hardened depthis P. SS and RS have a lower impact. The results are in concordance with the observations made inthe preliminary experimental results. It can be observed that the top hardened depth increases asP increases. However, the hardened depth decreases when the SS and RS increase. These resultsare anticipated, since increasing SS and RS reduces the heat transmitted from the laser beam to thepart surface.
Figure 10. Main effects of the process parameters on the tooth top hardened depth.
These results are confirmed by the average effect of each parameter in terms of percent contributionin the top hardened depth variation. Table 6 reveals that the cumulative contributions of P, SS, andSR in the hardened depth variations represent more than 84%. P is the most significant parameterhaving the greatest effect (52.92%). The SS is the second most significant parameter with 20.04%, andRS is the least significant parameter with the smallest effect (11.27%). These results are confirmedby the correlation analysis between process parameters and hardened depths presented in Table 7.The contribution of the interactions between the three parameters is less important, representing about12.5%. However, it is surprising that P and SS interaction have a less significant effect with about 0.2%,which is less than the error contribution. Given the impact of the increasing SS on the power effect,SS interaction is assumed to be at the same level as RS.
Table 6. ANOVA analysis for the tooth top hardened depth.
Characteristic Sum of Squares Contribution F-Value p-Value
Regression 12.89 96.85% 10.26 0.091P 7.04 52.92% 2.90 0.231SS 2.67 20.04% 0.54 0.539RS 1.50 11.27% 0.11 0.767
P·SS 0.02 0.19% 0.71 0.488P·RS 0.93 7.01% 0.11 0.768SS·RS 0.72 5.41% 3.44 0.205Error 0.42 3.15%Total 13.3 100%

J. Manuf. Mater. Process. 2019, 3, 72 11 of 16
Table 7. Correlations between process parameters and hardened depth.
P SS RS
Tooth top hardened depth 72.17% 43.30% 31.75%Tooth bottom hardened depth 72.75% 44.77% 33.58%
Globally, the total contributions of the parameters and the interactions exceed 96.5%, suggestinggood experimental planning. The error remains within an acceptable level (3.15%), signifying that themost important process parameters influencing the hardened depth are all included in the experiments.These results suggest that there are many options to consider in building an efficient hardened depth(HD) estimation model. As an example, all the process parameters and the interactions are included ina regression model derived from ANOVA and proposed in Equation (1). The relationship betweenpredicted and measured tooth top hardened depth is represented in Figure 11.
HDTop = −3262 + 8.30·P − 11,088·SS − 1.72·RS − 7.96·P·SS − 0.00064·P·RS + 7.00·SS·RS (1)
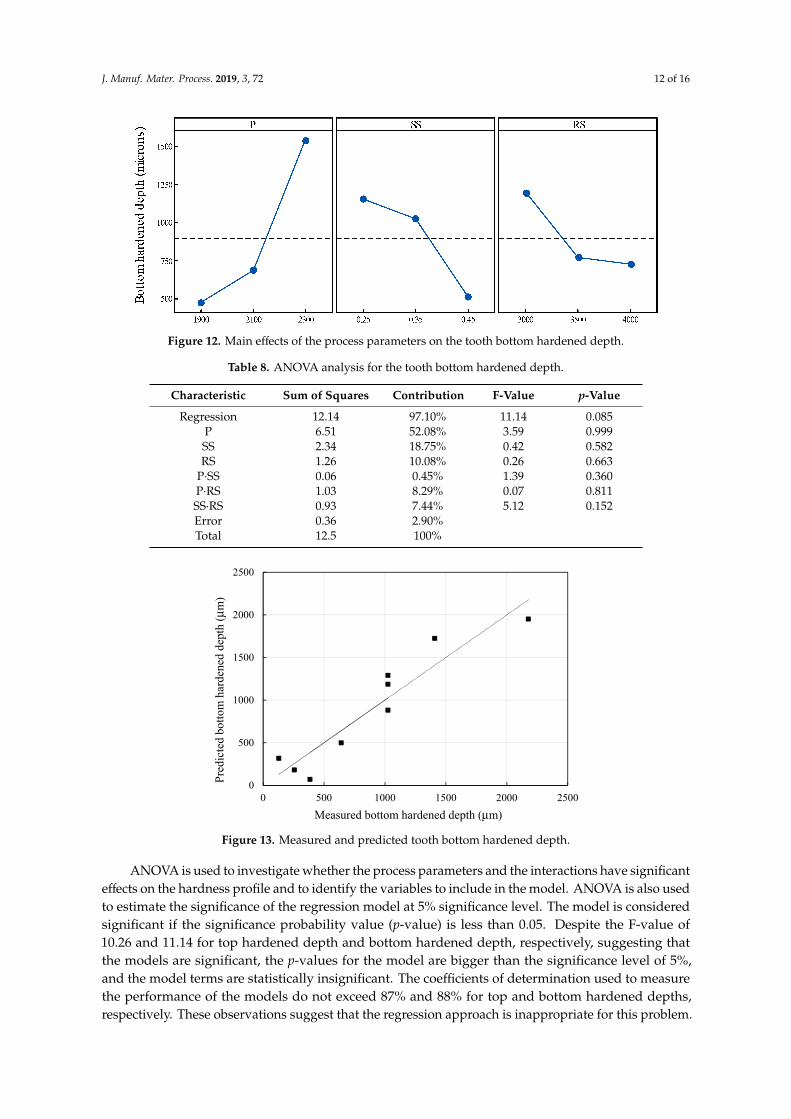
Given the strong correlation between top and bottom hardened depths, ANOVA led to thesame types of results. Figure 12 shows the average effects of the process parameters on the bottomhardened depth. Again, P is the most dominant factor. This observation is confirmed by the percentcontribution. Table 8 presents a detailed ANOVA. P has the greatest effect (52.08%). The SS is thesecond most significant parameter with 18.75% and RS is the least significant parameter with thesmallest effect (10.08%). These results are confirmed by the correlation analysis between the processparameters and the hardened depths presented in Table 7. The contribution of the interaction betweenthe three parameters is less important, representing about 16%. Here again, P and SS interaction hasa less significant contribution. The error remains within acceptable levels (2.90%) suggesting a goodexperimental design and planning. Accordingly, all the process parameters and the interactions areincluded in a regression model proposed in Equation (2). The relationship between predicted andmeasured tooth bottom hardened depth is represented in Figure 13.
HDBottom = −4982 + 9.89·P − 10,515·SS − 2.76·RS − 11.90·P·SS − 0.00055·P·RS + 9.14·SS·RS (2)
J. Manuf. Mater. Process. 2019, 3, x FOR PEER REVIEW 11 of 16
the most important process parameters influencing the hardened depth are all included in the experiments. These results suggest that there are many options to consider in building an efficient hardened depth (HD) estimation model. As an example, all the process parameters and the interactions are included in a regression model derived from ANOVA and proposed in Equation (1). The relationship between predicted and measured tooth top hardened depth is represented in Figure 11.
HDTop = −3262 + 8.30·P − 11088·SS − 1.72·RS − 7.96·P·SS − 0.00064·P·RS + 7.00·SS·RS (1)
Given the strong correlation between top and bottom hardened depths, ANOVA led to the same types of results. Figure 12 shows the average effects of the process parameters on the bottom hardened depth. Again, P is the most dominant factor. This observation is confirmed by the percent contribution. Table 8 presents a detailed ANOVA. P has the greatest effect (52.08%). The SS is the second most significant parameter with 18.75% and RS is the least significant parameter with the smallest effect (10.08%). These results are confirmed by the correlation analysis between the process parameters and the hardened depths presented in Table 7. The contribution of the interaction between the three parameters is less important, representing about 16%. Here again, P and SS interaction has a less significant contribution. The error remains within acceptable levels (2.90%) suggesting a good experimental design and planning. Accordingly, all the process parameters and the interactions are included in a regression model proposed in Equation (2). The relationship between predicted and measured tooth bottom hardened depth is represented in Figure 13.
HDBottom = −4982 + 9.89·P − 10515·SS − 2.76·RS − 11.90·P·SS − 0.00055·P·RS + 9.14·SS·RS (2)
Figure 11. Measured and predicted tooth top hardened depth.
1500
2000
2500
3000
3500
1500 2000 2500 3000 3500
Pred
icte
d to
p ha
rden
ed d
epth
(μm
)
Measured top hardened depth (μm)
Figure 11. Measured and predicted tooth top hardened depth.
J. Manuf. Mater. Process. 2019, 3, 72 12 of 16
Figure 12. Main effects of the process parameters on the tooth bottom hardened depth.
Table 8. ANOVA analysis for the tooth bottom hardened depth.
Characteristic Sum of Squares Contribution F-Value p-Value
Regression 12.14 97.10% 11.14 0.085P 6.51 52.08% 3.59 0.999SS 2.34 18.75% 0.42 0.582RS 1.26 10.08% 0.26 0.663
P·SS 0.06 0.45% 1.39 0.360P·RS 1.03 8.29% 0.07 0.811SS·RS 0.93 7.44% 5.12 0.152Error 0.36 2.90%Total 12.5 100%
J. Manuf. Mater. Process. 2019, 3, x FOR PEER REVIEW 12 of 16
Figure 12. Main effects of the process parameters on the tooth bottom hardened depth.
Table 8. ANOVA analysis for the tooth bottom hardened depth.
Characteristic Sum of Squares Contribution F-Value p-Value Regression 12.14 97.10% 11.14 0.085
P 6.51 52.08% 3.59 0.999 SS 2.34 18.75% 0.42 0.582 RS 1.26 10.08% 0.26 0.663
P·SS 0.06 0.45% 1.39 0.360 P·RS 1.03 8.29% 0.07 0.811 SS·RS 0.93 7.44% 5.12 0.152 Error 0.36 2.90% Total 12.5 100%
Figure 13. Measured and predicted tooth bottom hardened depth.
ANOVA is used to investigate whether the process parameters and the interactions have significant effects on the hardness profile and to identify the variables to include in the model. ANOVA is also used to estimate the significance of the regression model at 5% significance level. The model is considered significant if the significance probability value (p-value) is less than 0.05. Despite the F-value of 10.26 and 11.14 for top hardened depth and bottom hardened depth, respectively, suggesting that the models are significant, the p-values for the model are bigger than the significance level of 5%, and the model terms are statistically insignificant. The coefficients of determination used to measure the performance of the models do not exceed 87% and 88% for top and bottom hardened
230021001900
1500
1250
1000
750
500
0,450,350,25 400035003000
P
Botto
m h
arde
ned
dept
h (m
icro
ns) SS RS
0
500
1000
1500
2000
2500
0 500 1000 1500 2000 2500
Pred
icte
d bo
ttom
har
dene
d de
pth
(μm
)
Measured bottom hardened depth (μm)
Figure 13. Measured and predicted tooth bottom hardened depth.
ANOVA is used to investigate whether the process parameters and the interactions have significanteffects on the hardness profile and to identify the variables to include in the model. ANOVA is also usedto estimate the significance of the regression model at 5% significance level. The model is consideredsignificant if the significance probability value (p-value) is less than 0.05. Despite the F-value of10.26 and 11.14 for top hardened depth and bottom hardened depth, respectively, suggesting thatthe models are significant, the p-values for the model are bigger than the significance level of 5%,and the model terms are statistically insignificant. The coefficients of determination used to measurethe performance of the models do not exceed 87% and 88% for top and bottom hardened depths,respectively. These observations suggest that the regression approach is inappropriate for this problem.

J. Manuf. Mater. Process. 2019, 3, 72 13 of 16
In order to produce accurate and efficient models for hardened depth prediction, an alternativemodeling approach able to handle variables exhibiting complex and nonlinear relationships is needed.Although several modeling techniques can be used to produce such a model, artificial neural networks(ANN) is an effective tool for this type of applications [29,30], thus ANN is proposed as an illustrativeexample for the hardened depth prediction model. Although many ANN models can be used inthis application, the multilayer feedforward network seems to be one of the most convenient forits suppleness and simplicity. Before starting to train the ANN model, it is important to establishthe number and the size of the hidden layers and adjust the training performance. The idea is toidentify the relationship between the number of inputs, the hidden layer size, and the parameters toestimate. For this reason, several ANN architectures are studied. The best results are achieved usingan architecture combining three inputs, one hidden layer with 10 neurons, and three outputs.
The experimental data from the L9 design is used to train the ANN-based prediction model.The experimentation results suggest that the three process parameters have significant effects on thehardened depth. Consequently, P, SS, and RS are used as input to the ANN model. Moreover, to testthe ANN-based prediction model, additional experimental data are produced for the model validationphase. The experimentation is built using an L8 and the middle values of the factors considered in theL9. Table 9 shows the factors and levels used in the experimental design for the model validation.
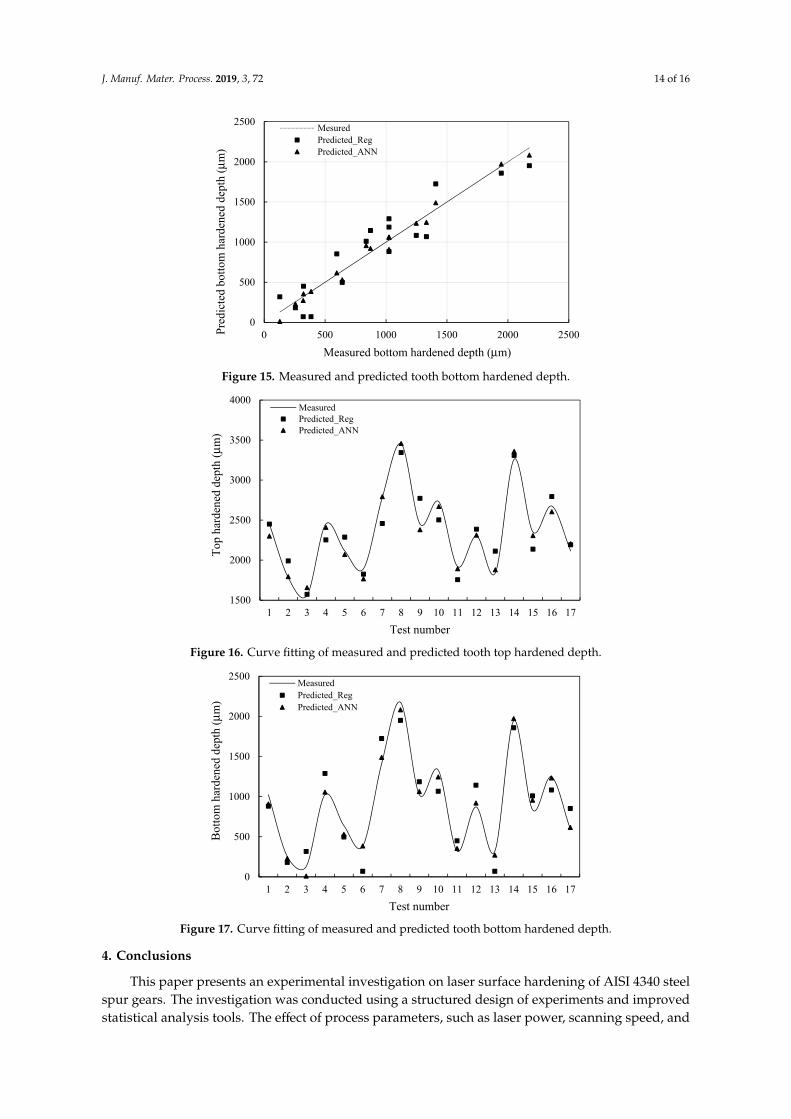
The measured and predicted hardened depths are shown in Figures 14 and 15 for the regression andthe ANN-based prediction models. Figures 16 and 17 present the measured and the predicted curvesfitting for tooth top and bottom hardened depth, respectively. These results demonstrate that the ANNpresents more enhanced modeling performance than the regression. With a coefficient of determinationat more than 98%, the modeling approach can be very effective in this case. Experimentation coveringmore factors and more levels for more training and validation data, as well as an improvement of themodeling conditions, can lead to more accurate and efficient prediction models.
Table 9. Factors and levels for validation.
Factors Level 1 Level 2
Power (W) 2000 2200Scanning speed (mm/s) 0.3 0.4Revolution speed (rpm) 3250 3750
J. Manuf. Mater. Process. 2019, 3, x FOR PEER REVIEW 13 of 16
depths, respectively. These observations suggest that the regression approach is inappropriate for this problem.
In order to produce accurate and efficient models for hardened depth prediction, an alternative modeling approach able to handle variables exhibiting complex and nonlinear relationships is needed. Although several modeling techniques can be used to produce such a model, artificial neural networks (ANN) is an effective tool for this type of applications [29,30], thus ANN is proposed as an illustrative example for the hardened depth prediction model. Although many ANN models can be used in this application, the multilayer feedforward network seems to be one of the most convenient for its suppleness and simplicity. Before starting to train the ANN model, it is important to establish the number and the size of the hidden layers and adjust the training performance. The idea is to identify the relationship between the number of inputs, the hidden layer size, and the parameters to estimate. For this reason, several ANN architectures are studied. The best results are achieved using an architecture combining three inputs, one hidden layer with 10 neurons, and three outputs.
The experimental data from the L9 design is used to train the ANN-based prediction model. The experimentation results suggest that the three process parameters have significant effects on the hardened depth. Consequently, P, SS, and RS are used as input to the ANN model. Moreover, to test the ANN-based prediction model, additional experimental data are produced for the model validation phase. The experimentation is built using an L8 and the middle values of the factors considered in the L9. Table 9 shows the factors and levels used in the experimental design for the model validation.
The measured and predicted hardened depths are shown in Figure 14 and Figure 15 for the regression and the ANN-based prediction models. Figure 16 and Figure 17 present the measured and the predicted curves fitting for tooth top and bottom hardened depth, respectively. These results demonstrate that the ANN presents more enhanced modeling performance than the regression. With a coefficient of determination at more than 98%, the modeling approach can be very effective in this case. Experimentation covering more factors and more levels for more training and validation data, as well as an improvement of the modeling conditions, can lead to more accurate and efficient prediction models.
Table 9. Factors and levels for validation.
Factors Level 1 Level 2 Power (W) 2000 2200
Scanning speed mm/s) 0.3 0.4 Revolution speed (rpm) 3250 3750
Figure 14. Measured and predicted tooth top hardened depth.
1500
2000
2500
3000
3500
1500 2000 2500 3000 3500
Pred
icte
d to
p ha
rden
ed d
epth
(μm
)
Measured top hardened depth (μm)
MesuredPredicted_RegPredicted_ANN
Figure 14. Measured and predicted tooth top hardened depth.
J. Manuf. Mater. Process. 2019, 3, 72 14 of 16J. Manuf. Mater. Process. 2019, 3, x FOR PEER REVIEW 14 of 16
Figure 15. Measured and predicted tooth bottom hardened depth.
Figure 16. Curve fitting of measured and predicted tooth top hardened depth.
Figure 17. Curve fitting of measured and predicted tooth bottom hardened depth.
4. Conclusions
This paper presents an experimental investigation on laser surface hardening of AISI 4340 steel spur gears. The investigation was conducted using a structured design of experiments and improved statistical analysis tools. The effect of process parameters, such as laser power, scanning speed, and
0
500
1000
1500
2000
2500
0 500 1000 1500 2000 2500Pred
icte
d bo
ttom
har
dene
d de
pth
(μm
)
Measured bottom hardened depth (μm)
MesuredPredicted_RegPredicted_ANN
1500
2000
2500
3000
3500
4000
1 2 3 4 5 6 7 8 9 10 11 12 13 14 15 16 17
Top
hard
ened
dep
th (μ
m)
Test number
MeasuredPredicted_RegPredicted_ANN
0
500
1000
1500
2000
2500
1 2 3 4 5 6 7 8 9 10 11 12 13 14 15 16 17
Botto
m h
arde
ned
dept
h (μ
m)
Test number
MeasuredPredicted_RegPredicted_ANN
Figure 15. Measured and predicted tooth bottom hardened depth.
J. Manuf. Mater. Process. 2019, 3, x FOR PEER REVIEW 14 of 16
Figure 15. Measured and predicted tooth bottom hardened depth.
Figure 16. Curve fitting of measured and predicted tooth top hardened depth.
Figure 17. Curve fitting of measured and predicted tooth bottom hardened depth.
4. Conclusions
This paper presents an experimental investigation on laser surface hardening of AISI 4340 steel spur gears. The investigation was conducted using a structured design of experiments and improved statistical analysis tools. The effect of process parameters, such as laser power, scanning speed, and
0
500
1000
1500
2000
2500
0 500 1000 1500 2000 2500Pred
icte
d bo
ttom
har
dene
d de
pth
(μm
)
Measured bottom hardened depth (μm)
MesuredPredicted_RegPredicted_ANN
1500
2000
2500
3000
3500
4000
1 2 3 4 5 6 7 8 9 10 11 12 13 14 15 16 17
Top
hard
ened
dep
th (μ
m)
Test number
MeasuredPredicted_RegPredicted_ANN
0
500
1000
1500
2000
2500
1 2 3 4 5 6 7 8 9 10 11 12 13 14 15 16 17
Botto
m h
arde
ned
dept
h (μ
m)
Test number
MeasuredPredicted_RegPredicted_ANN
Figure 16. Curve fitting of measured and predicted tooth top hardened depth.
J. Manuf. Mater. Process. 2019, 3, x FOR PEER REVIEW 14 of 16
Figure 15. Measured and predicted tooth bottom hardened depth.
Figure 16. Curve fitting of measured and predicted tooth top hardened depth.
Figure 17. Curve fitting of measured and predicted tooth bottom hardened depth.
4. Conclusions
This paper presents an experimental investigation on laser surface hardening of AISI 4340 steel spur gears. The investigation was conducted using a structured design of experiments and improved statistical analysis tools. The effect of process parameters, such as laser power, scanning speed, and
0
500
1000
1500
2000
2500
0 500 1000 1500 2000 2500Pred
icte
d bo
ttom
har
dene
d de
pth
(μm
)
Measured bottom hardened depth (μm)
MesuredPredicted_RegPredicted_ANN
1500
2000
2500
3000
3500
4000
1 2 3 4 5 6 7 8 9 10 11 12 13 14 15 16 17
Top
hard
ened
dep
th (μ
m)
Test number
MeasuredPredicted_RegPredicted_ANN
0
500
1000
1500
2000
2500
1 2 3 4 5 6 7 8 9 10 11 12 13 14 15 16 17
Botto
m h
arde
ned
dept
h (μ
m)
Test number
MeasuredPredicted_RegPredicted_ANN
Figure 17. Curve fitting of measured and predicted tooth bottom hardened depth.
4. Conclusions
This paper presents an experimental investigation on laser surface hardening of AISI 4340 steelspur gears. The investigation was conducted using a structured design of experiments and improvedstatistical analysis tools. The effect of process parameters, such as laser power, scanning speed, and

J. Manuf. Mater. Process. 2019, 3, 72 15 of 16
revolution speed, and their interactions on tooth top hardened depth and tooth bottom hardeneddepth were evaluated and their variations were analyzed. The experimentations were performed usinga 3 kW Nd:YAG laser system. Based on the experimental results, regression models for predicting thehardened depth for the top and the bottom of the tooth were developed and evaluated. The direct andthe interactive effects of the process parameters on the hardened depth were investigated. The resultsconfirm a significant similarity between the top and bottom hardness profiles, as anticipated. Accordingto the results of ANOVA, laser power is the factor with greater influence on the hardness profile followedby scanning speed and revolution speed. The cumulative contribution of the three parameters in thehardened depth variation represents more than 80% with a predominance of laser power with more than50%. The effects of scanning speed and rotation speed are limited to less than 20%. The contribution ofthe interactions between the parameters represents 12% to 16%. The resulting hardness values arerelatively similar for all the experimental tests with about 60 HRC. The evaluation of the performanceof the regression prediction models reveals a significant lack of precision, suggesting that the regressionapproach is inappropriate for the studied problem. An alternative modeling approach handlingvariables exhibiting complex and nonlinear relationships is proposed to produce accurate and efficientmodels for hardened depth prediction. A simplified artificial neural network-based perdition model ispresented as an explanatory example.
Author Contributions: A.K.B., A.E.O. and A.C. developed the experimental design and the experimentationstrategy; A.K.B. performed the experiments, the characterization tests, and the statistical analysis of the results;A.K.B. wrote the manuscript; A.E.O. and A.C. supervised the experiments and the analysis; A.E.O. and A.C.revised the manuscript.
Funding: This research has been supported by PARL team funds.
Acknowledgments: The authors would like to thanks the PARL team members who made this research possible.
Conflicts of Interest: The authors declare no conflict of interest.
References
1. Mazumder, J. Laser heat treatment: The state of the art. J. Mater. 1983, 35, 18–26. [CrossRef]2. Kennedy, E.; Byrne, G.; Collins, D.N. A review of the use of high power diode lasers in surface hardening.
J. Mater. Process. Technol. 2004, 155, 1855–1860. [CrossRef]3. Mackwood, A.P.; Crafer, R.C. Thermal modelling of laser welding and related processes: A literature review.
Opt. Laser Technol. 2005, 37, 99–115. [CrossRef]4. Grum, J.; Sturm, R. Laser surface melt-hardening of gray and nodular irons. Appl. Surf. Sci. 1997, 109,
128–132. [CrossRef]5. Sandven, O.A. Laser surface transformation hardening. In Metals Handbook; ASM Press: Washington, DC,
USA, 1997; Volume 4, pp. 507–517.6. Colombo, V.; Mentrelli, A.; Trombetti, T. Time-dependent 3-D modelling of laser surface heating for the
hardening of metallic materials. Eur. Phys. J. D Atomic Mol. Opt. Plasma Phys. 2003, 27, 239–246. [CrossRef]7. Kannatey-Asibu, E., Jr. Principles of Laser Materials Processing; John Wiley & Sons: New York, NY, USA, 2009.8. Steen, W.; Watkins, K.G.; Mazumder, J. Laser Material Processing; Springer Science & Business Media:
New York, NY, USA, 2010.9. Chattopadhyay, R. Laser assisted surface engineering processes. In Advanced Thermally Assisted Surface
Engineering Processes; Springer: Boston, MA, USA, 2004; pp. 157–192.10. Goia, F.; De Lima, M. Surface hardening of an AISI D6 cold work steel using a fiber laser. J. ASTM Int. 2011,
8, 315–318. [CrossRef]11. Tobar, M.J.; Álvarez, C.; Amado, J.M.; Ramil, A.; Saavedra, E.; Yáñez, A. Laser transformation hardening of
a tool steel: Simulation-based parameter optimization and experimental results. Surf. Coat. Technol. 2006,200, 6362–6367. [CrossRef]
12. Shercliff, A.M.F. The prediction of case depth in laser transformation hardening. Metal. Trans. A 1991, 22,2459–2466. [CrossRef]

J. Manuf. Mater. Process. 2019, 3, 72 16 of 16
13. Cheung, N.; Pinto, M.A.; Ierardi, M.C.F.; Garcia, A. Mathematical modeling and experimental analysis of thehardened zone in laser treatment of a 1045 AISI steel. Mater. Res. 2004, 7, 349–354. [CrossRef]
14. Komanduri, R.; Hou, Z.B. Thermal analysis of laser surface transformation hardening-optimization of processparameters. Int. J. Mach. Tools Manuf. 2004, 44, 991–1008. [CrossRef]
15. Patwa, R.; Shin, Y.C. Predictive modeling of laser hardening of AISI5150H steels. Int. J. Mach. Tools Manuf.2007, 47, 307–320. [CrossRef]
16. Yilbas, B.S.; Shuja, S.Z.; Khan, S.M.A.; Aleem, A. Laser melting of carbide tool surface: Model andexperimental studies. Appl. Surf. Sci. 2009, 255, 9396–9403. [CrossRef]
17. Miokovic, T.; Schulze, V.; Vöhringer, O.; Löhe, D. Prediction of phase transformations during laser surfacehardening of AISI 4140 including the effects of inhomogeneous austenite formation. Mater. Sci. Eng. A 2006,435, 547–555. [CrossRef]
18. Ashby, M.F.; Easterling, K.E. The transformation hardening of steel surfaces by laser beams—I. Hypo-Eutectoid steels. Acta Metal. 1984, 32, 935–948. [CrossRef]
19. Benyounis, K.Y.; Olabi, A.G.; Hashmi, M.S.J. Multi response optimization of CO2 laser welding process ofaustenitic stainless steel. Opt. Laser Technol. 2008, 40, 76–87. [CrossRef]
20. An, T.J.S. DOE based statistical approaches in modeling of laser processing—Review & suggestion. Int. J.Eng. Technol. 2010, 10, 1–7.
21. Lambiase, F.; Di Ilio, A.M.; Paoletti, A. Prediction of laser hardening by means of neural network. ProcediaCIRP 2013, 12, 181–186. [CrossRef]
22. Hadhri, M.; El Ouafi, A.; Barka, N. Prediction of the hardness profile of an AISI 4340 steel cylinder heat-treatedby laser-3D and artificial neural networks modelling and experimental validation. J. Mech. Sci. Technol. 2017,31, 615–623. [CrossRef]
23. Jerniti, A.G.; El Ouafi, A.; Barka, N. A predictive modeling based on regression and artificial neural networkanalysis of laser transformation hardening for cylindrical steel workpieces. J. Surf. Eng. Mater. Adv. Technol.2016, 6, 149–163. [CrossRef]
24. Ion, J.C. Laser transformation hardening. Surf. Eng. 2002, 18, 14–31. [CrossRef]25. Zhang, H.; Shi, Y.; Xu, C.Y.; Kutsuna, M. Surface hardening of gears by laser beam processing. Surf. Eng.
2003, 19, 134–136. [CrossRef]26. Dinesh Babu, P.; Balasubramanian, K.R.; Buvanashekaran, G. Laser surface hardening: A review. Int. J. Surf.
Sci. Eng. 2011, 5, 131–151. [CrossRef]27. Barka, N.; El Ouafi, A. Effects of laser hardening process parameters on case depth of 4340 steel cylindrical
specimen—A statistical analysis. J. Surf. Eng. Mater. Adv. Technol. 2015, 5, 124–135. [CrossRef]28. Ross, P.J. Taguchi Techniques for Quality Engineering: Loss Function, Orthogonal Experiments, Parameter and
Tolerance Design, 2nd ed.; McGraw-Hill: New York, NY, USA, 1996; pp. 23–40.29. Huang, S.H.; Zhang, H.C. Artificial neural networks in manufacturing: Concepts, applications, and
perspectives. IEEE Trans. Comp. Pack. Manuf. Technol. 1994, 17, 212–228. [CrossRef]30. Meireles, M.R.; Almeida, P.E.; Simoes, M.G. A comprehensive review for industrial applicability of artificial
neural networks. IEEE Trans. Ind. Electron. 2003, 50, 585–601. [CrossRef]
© 2019 by the authors. Licensee MDPI, Basel, Switzerland. This article is an open accessarticle distributed under the terms and conditions of the Creative Commons Attribution(CC BY) license (http://creativecommons.org/licenses/by/4.0/).