Experimental investigation of gas kick effects on dynamic ...
12
Vol.:(0123456789) 1 3 Journal of Petroleum Exploration and Production Technology (2019) 9:605–616 https://doi.org/10.1007/s13202-018-0510-z ORIGINAL PAPER - EXPLORATION ENGINEERING Experimental investigation of gas kick effects on dynamic drilling parameters Idris O. Sule 1,2 · Faisal Khan 1 · Stephen Butt 2 Received: 26 September 2017 / Accepted: 17 June 2018 / Published online: 25 June 2018 © The Author(s) 2018 Abstract Blowout incidents not only lead to fatalities but also cause loss of assets, expensive clean-up, costly incident investigations and reports, and negative impact on the environment. The 2010 Macondo blowout accident in the Gulf of Mexico was an eye-opener for many oil and gas operators and oilfield service companies; thus, making early kick detection technology research one of the top industry agendas. However, only limited progress has been made in detection technologies that focus on downhole parameters due to the complexity of offshore drilling operations that is increasingly shifting towards the deep- water. Therefore, the current paper experimentally explores downhole drilling parameters for kick indication during drilling. The study utilizes a fully instrumented laboratory scale drilling rig coupled with an air injection and surface monitoring systems. This study observed a sudden jump in bottomhole pressure, increased volume of the return fluid, decreased density of the return fluid, reduced rate of penetration, and increased rotary speed as indicators of kick. The most significant new finding, which is also validated with field reports, is the dampening effects of the drilling vibrations due to kick. Frequency analysis of the axial bit–rock displacements/vibrations confirms the changes of frequencies due to kick induction during drilling. Coupling this important finding with dynamic drilling models, the response of the drilling system at surface (e.g. standpipe, choke pressures, etc.) indicating this change can be predicted. Keywords Kick indicators · Drilling · Axial bit vibrations · Early kick detection Introduction Early kick detection (EKD) is a vital component of well control system. The prevention or management of kicks and/ or fluid loss occurrence during drilling operations is crucial, particularly in deepwater drilling activities due to the com- plexity of equipment and operations. Well control failure occurrences could typically cost the oil and gas industry bil- lions of dollars in a year due to non-productive time (NPT) and/or blowout incident, and affect the safety of drilling personnel. In addition to the complex operation involved with deepwater drilling, many deepwater wells have greater depths and narrow pressure margins between pore pressure and fracture gradient, which heighten the risk of unexpected events such as kick or fluid loss. Given the extent of these challenging drilling operations coupled with today’s low oil and gas prices, oil and gas operators are continually striving to improve not only the drilling efficiency but also to under- stand the behaviour of downhole fluid to survive and grow. Blowouts can be disastrous, expensive, and cause fatali- ties; a good example was the dramatic BP Deepwater Hori- zon blowout in 2010. Several investigative reports indicate a need for more sophisticated EKD technologies among other root causes (Graham et al. 2011). Unfortunately, limited progress has been made due to more reliance on surface detection technologies which are challenged by response time. There is a widely accepted consensus in the industry to explore a bottom-up approach whereby kicks are detected early and can be tracked at multiple points along the wellbore. However, only limited progress has been made on this approach due to the complexity of offshore drilling operations. Velmurugan et al. (2015) presented an automated * Idris O. Sule [email protected] 1 Centre for Risk, Integrity and Safety Engineering (C-RISE), Process Engineering Department, Faculty of Engineering and Applied Science, Memorial University, St. John’s, NL, Canada 2 Drilling Technology Laboratory (DTL), Process Engineering Department, Faculty of Engineering and Applied Science, Memorial University, St. John’s, NL, Canada
Transcript of Experimental investigation of gas kick effects on dynamic ...

Vol.:(0123456789)1 3
Journal of Petroleum Exploration and Production Technology (2019) 9:605–616 https://doi.org/10.1007/s13202-018-0510-z
ORIGINAL PAPER - EXPLORATION ENGINEERING
Experimental investigation of gas kick effects on dynamic drilling parameters
Idris O. Sule1,2 · Faisal Khan1 · Stephen Butt2
Received: 26 September 2017 / Accepted: 17 June 2018 / Published online: 25 June 2018 © The Author(s) 2018
AbstractBlowout incidents not only lead to fatalities but also cause loss of assets, expensive clean-up, costly incident investigations and reports, and negative impact on the environment. The 2010 Macondo blowout accident in the Gulf of Mexico was an eye-opener for many oil and gas operators and oilfield service companies; thus, making early kick detection technology research one of the top industry agendas. However, only limited progress has been made in detection technologies that focus on downhole parameters due to the complexity of offshore drilling operations that is increasingly shifting towards the deep-water. Therefore, the current paper experimentally explores downhole drilling parameters for kick indication during drilling. The study utilizes a fully instrumented laboratory scale drilling rig coupled with an air injection and surface monitoring systems. This study observed a sudden jump in bottomhole pressure, increased volume of the return fluid, decreased density of the return fluid, reduced rate of penetration, and increased rotary speed as indicators of kick. The most significant new finding, which is also validated with field reports, is the dampening effects of the drilling vibrations due to kick. Frequency analysis of the axial bit–rock displacements/vibrations confirms the changes of frequencies due to kick induction during drilling. Coupling this important finding with dynamic drilling models, the response of the drilling system at surface (e.g. standpipe, choke pressures, etc.) indicating this change can be predicted.
Keywords Kick indicators · Drilling · Axial bit vibrations · Early kick detection
Introduction
Early kick detection (EKD) is a vital component of well control system. The prevention or management of kicks and/or fluid loss occurrence during drilling operations is crucial, particularly in deepwater drilling activities due to the com-plexity of equipment and operations. Well control failure occurrences could typically cost the oil and gas industry bil-lions of dollars in a year due to non-productive time (NPT) and/or blowout incident, and affect the safety of drilling personnel. In addition to the complex operation involved
with deepwater drilling, many deepwater wells have greater depths and narrow pressure margins between pore pressure and fracture gradient, which heighten the risk of unexpected events such as kick or fluid loss. Given the extent of these challenging drilling operations coupled with today’s low oil and gas prices, oil and gas operators are continually striving to improve not only the drilling efficiency but also to under-stand the behaviour of downhole fluid to survive and grow.
Blowouts can be disastrous, expensive, and cause fatali-ties; a good example was the dramatic BP Deepwater Hori-zon blowout in 2010. Several investigative reports indicate a need for more sophisticated EKD technologies among other root causes (Graham et al. 2011). Unfortunately, limited progress has been made due to more reliance on surface detection technologies which are challenged by response time. There is a widely accepted consensus in the industry to explore a bottom-up approach whereby kicks are detected early and can be tracked at multiple points along the wellbore. However, only limited progress has been made on this approach due to the complexity of offshore drilling operations. Velmurugan et al. (2015) presented an automated
* Idris O. Sule [email protected]
1 Centre for Risk, Integrity and Safety Engineering (C-RISE), Process Engineering Department, Faculty of Engineering and Applied Science, Memorial University, St. John’s, NL, Canada
2 Drilling Technology Laboratory (DTL), Process Engineering Department, Faculty of Engineering and Applied Science, Memorial University, St. John’s, NL, Canada
606 Journal of Petroleum Exploration and Production Technology (2019) 9:605–616
1 3
system for EKD and a control system that monitors and reports the physical conditions inside wellbore annulus instantaneously through time measurements of p-waves’ propagation in the annulus. Its performance is questionable for field applications. Nayeem et al. (2016) experimentally investigated kick occurrence based on the changes in mass flow rate, pressure, density and conductivity of fluid down-hole and concluded that the parameters have the potential to improve the kick detection system with higher precision than the surface detection system.
Vajargah and van Oort (2015) developed an algorithm that automatically selects a best well control response to influx in a drilling operation running a constant Bottom-hole pressure (CBHP) managed pressure drilling (MPD); however, the paper did not clarify how this method will be implemented while running CBHP MPD operation in the field. Trivedi (2014) proposed an innovative kick detection system that uses a small mud rerouting section consisting of two plates and located just above the BHA. When there is an entrained formation fluid bubbles/droplet in the flow, the medium between the two plates will undergo alteration and form a magnetic impulse registering as abnormality in fluid flow, hence detecting kick. However, this technology has many limitations, including cuttings intrusion and capaci-tance limitations due to plate spacing. Ahmed et al. (2016) proposed a new advanced early kick detection method that uses seven parameters data (classified as instantaneous drill-ing parameters, e.g. pit gain, flow rate, ROP, etc., and lag-ging parameters, e.g. total gas connection gas, etc.) from mud logging while drilling; however, this method was field specific (Offshore Nile Delta field). Schubert and Wright (1998) proposed the use of an acoustic device installed on the casing valve to continuously monitor the liquid level in the annulus of wells experiencing complete loss of returns; thus, a rise in the liquid level is interpreted as early kick indication; however, this method has a limitation of lagging time that was not addressed by the authors.
DiFoggio and Duncan (2012) presented, in a patent, a tool and method that measure the acoustic velocity and tem-perature of a borehole fluid from an acoustic sensor and temperature sensor placed in a borehole to detect a gas influx in real time due to lower bulk modulus and density of the fluid and temperature drop. This is the closest and tested downhole detection methods but it is only limited to and/or relied on borehole density and temperature parameters. Involving more downhole parameters in early kick detection indicators not only improve the reliability of kick detection but also provides the capability to validate kick occurrence when there are deviations in these parameters.
Thus, this paper experimentally monitors dynamic drill-ing parameters, including WOB, rotary speed, drilling vibra-tions during drilling that give an indication of gas kick. Many studies on kick detection rely on a flow-loop setup
including flow valves, choke valve, and pressure sensors to simulate kick experiments. Therefore, the uniqueness of the current study lies in the utilization of a fully instrumented laboratory scale drilling rig to simulate drilling as the kick is being induced, controlled and monitored.
Materials and methods
Experimental setup
The setup consists of two integrated platforms: a fully instru-mented laboratory scale drilling rig platform and a surface monitoring equipment and gas injection system platform. The drilling rig is equipped with a rotary head, fluid circula-tion system and a data acquisition system.
Laboratory scale drilling rig
The schematic diagram of the laboratory scale (scaled-down) drilling simulator is shown in Fig. 1a. The rig is powered by an electric drill motor with two rotational speed configurations (300 and 600 rpm) to provide adequate rotary speed and torque to the bit via the drillstring. The loading system consists of a rack-pinion arrangement through which a suspended weight, in addition to a constant weight, can be applied to the bit. The rotary head accounts for the constant weight on bit (WOB) and consists of the drill motor and the drillstring. The drillstring components include a cradle, a swivel, a compliant tool, and a drill pipe. The swivel allows the injection of fluid into the drill pipe down to the drill bit nozzles and the complaint tool, which is configured rig-idly for the current experiment, provides a relative motion between the top system and the drill pipe using a set of coned-disc springs and rubber-damping elements. The drill pipe connects the drill bit with the top system (i.e. swivel, motor, etc.)
A 35-mm OD polycrystalline diamond cutter (PDC) bit with a two-cutter configuration is used as the drill bit in the current experiment. The mud circulation system is equipped with a 1000-L capacity water tank installed over a triplex pump powered by a 20-kW motor with a flow rate and pres-sure capacities of 150 L/min and 6900 kPa, respectively. The pump system also includes a variable frequency drive (VFD) to control the flow rate by adjusting the rotary speed of the motor. The circulation system includes a flow sensor, pressure transducer and water tank level meter to monitor and record the circulation conditions Khorshidan (2012). The water-based mud (WBM) is injected into the rig swivel assembly via a hose and then into an enclosed drilling/pres-sure cell.
The pressure cell, shown in Fig. 2, is located at the bot-tom of the rig system to serve as a wellbore and allow
607Journal of Petroleum Exploration and Production Technology (2019) 9:605–616
1 3
application of required bottomhole pressure during drill-ing. The pressure cell includes a clamping assembly to hold the rock specimen in place during drilling. In other words,
the pressure cell serves as a closed wellbore through which confining pressure is applied to the rock specimen during drilling. The drillstring with attached PDC bit is inserted into the pressure cell through a top cap of the cell and rotary seals are placed within the cap to prevent leaks and keep the drillstring centered. The designed pressure of the cell is 2500 kPa with a safety factor of 1.5 (Khorshidan 2012).
Integrated surface monitoring equipment and kick injection system
Surface monitoring equipment The surface equipment for monitoring surface parameters consists of a Coriolis flow meter, pressure transducer, P2, a flow in the choke manifold, and a conductivity sensor. A pressure transducer (P2) located downstream of the pressure cell and upstream of the Corio-lis flow meter, as shown in Fig. 1b, is used to measure the pressure in the return mud entering the surface monitoring equipment. The Coriolis flow meter is equipped with Elite flow sensor to provide good measurement sensitivity and stability when measuring multi-phase flow and it has toler-ance for drill cuttings. The Coriolis flow meter is installed such that the tube is in the up orientation or flag up position to allow an effective drainage of cuttings and mud from the sensor. The choke manifold consists of three valves: a pres-sure relief valve installed on the pressure relief loop (line), a needle (or backpressure) valve to adjust backpressure in
Fig. 1 Equipment setup for gas kick simulation experiment
Fig. 2 Sectional view of a schematic drawing of a pressure cell (Source: Khorshidan 2012)

608 Journal of Petroleum Exploration and Production Technology (2019) 9:605–616
1 3
the downhole pressure in the pressure cell and a manual pressure control valve. In the event of a surge in the pres-sure cell, a pressure relief valve (PRV), installed upstream of the Coriolis flow meter, diverts flow to the pressure relief (bypass) line. The pressure control and needle valves are mainly used to control the downhole pressure. The conduc-tivity sensor measures the electrolytic conductivity changes in the drilling mud return; however, was not monitored t due the sensor’s incompatibility with drill cuttings.
Kick injection system The kick injection system is made up of an air compressor supply, a gas flow meter, a pressure sen-sor, a solenoid valve, and a check valve. The air compressor compresses air into an air pressure vessel and automatically shuts off at a pre-programmed pressure. The pressure vessel is equipped with a valve and a pressure gauge to discharge the pressured air and monitor the pressure in the vessel respec-tively during the experiment. The air pressure in the vessel is maintained between 120 and 150 psi.
A gas flow meter is used to measure, with accuracies of ± 5% in volume flow rate, the air pressure discharged into the pressure cell. The pressure sensor (P3) on the air line meas-ures the dynamic pressure injected into the downhole pressure cell. A solenoid valve, which is installed just downstream of the compressed air supply, is used to inject compressed air into the downhole pressure cell to simulate gas kick and the check valve installed close to the injection point to throttle any fluid attempting to flow in the reverse direction (Nayeem et al. 2016).
Data acquisition system
Two data acquisition (DAQ) systems are used to measure and acquire data for the experiments: a fixed DAQ system termed as DAQ #1 and a portable DAQ system termed as DAQ #2. The DAQ #1 is interfaced with the drilling system to measure and acquire drilling-related parameters, including WOB, axial displacement, motor current. All data measured are recorded with a sampling rate of 1000 Hz, which is the required minimum sampling rate to capture the axial displace-ment signals from the high precision laser sensor. The DAQ #2 system measures and captures data from the integrated surface monitoring equipment and kick injection system, including downhole pressure in the pressure cell, gas pressure, mass and density flow. Because the DAQ #2 has a 10-Hz sampling rate capacity, the data from the two DAQ systems are compared using a clock synchronization technique.
Rock specimens’ preparation
Specimen properties
The current experiment is performed on synthetic rock materials modelled by pouring a specified recipe of con-crete slurry in 4 × 4-inch empty cylinders and left to set and harden. The concrete slurry mixture includes sand aggre-gates, water, cement, and superplasticizer. More information on concrete preparation can be found in Zhang (2017). The physical properties of the rock specimen used in the current study are shown in Table 1. The rock specimens are then stored in a controlled-moist environment to maintain their physical properties.
Test specimen preparation
The rock specimens are prepared so that gas injected from the base of the rock can interact with the rotating bit as it cuts through the rock. To accomplish this objective, a hole is drilled through the center of the rock. As shown in Fig. 3a–d, the test specimen preparation is completed through the fol-lowing steps:
a. Step 0 Showing the test specimen in its original state, Fig. 3a
b. Step 1 The center of the rock is laid out and located as shown in Fig. 3b.
c. Step 2 A ¼ inch Masonry bit is used in a drill press to drill a hole through the rock center of the rock as shown in Fig. 3c.
d. Step 3 The top and bottom surfaces of the rocks are sanded to smoothly fit into the pressure cell base that will house the specimens during drilling shown in Fig. 3d.
Bit operation analysis
The bit operation analysis is conducted to ensure that the input parameters set for the experiment are within the opera-tional requirements of the drilling rig simulator. For this
Table 1 Physical properties of the synthetic rock specimen (source: Zhang 2017)
Rock property Value Units
Unconfined compressive strength (Ucs)
51 Mpa
Mohr friction angle 40 °Tensile strength 5.4 MpaYoung modulus 29 GpaPoisson ratio 0.15

609Journal of Petroleum Exploration and Production Technology (2019) 9:605–616
1 3
experiment, a PDC bit with an outer diameter of 35 mm and two nozzle configurations with a diameter of 5.7/32-in (or 0.178125-in) each is used. The dynamic weight on bit (WOB) is measured directly from the load cell. The WOB measured by DAQ #1 during the experiment is not an effec-tive WOB due to pump-off pressure and force underneath the bit. Hence, the effective WOB can be determined by the following equation:
Hydraulic pump-off force (HPO) can either be measured during a drill-off test or estimated by the following equation:
where ΔPbit [Pa] is the pressure drop across the bit and dbit [m] is the nozzle diameter in the bit.
The pressure drop across the bit can be calculated using the following equation:
where ρ is the density (kgm3); q is the pump flowrate (m3/s); Cd is the jet nozzle discharge coefficient = 0.95; and At is the total nozzle area (m2). The hydraulic pump-off force obtained using the above equations is − 166.8N. The nega-tive sign shows that HPO is a negative weight on bit. There-fore, the effective weight on bit, WOBeff, can be calculated using Eq. (1). Additionally, nozzle jet force Fj, which is the impact force developed by the bit, can be calculated using the following equation:
Thus, the nozzle jet force calculated, Fj = 19.35 N. Another important parameter to be considered is the hydrau-lic square inch (HSI) which is a function of pump hydraulic
(1)WOBeff = (WOBmeasure) − (pump-off force).
(2)HPO = 4.1902ΔPbit(dbit − 1) [N],
(3)ΔPbit =9.523 × 10⁻⁵q2
C2dA2t
[Pa],
(4)Fj = 1.0588 × 10⁻³ Cdq
√
ΔPbit
[N].
horsepower (Php) and bit area and can be determined using the following equations, respectively,
Php= 0.353 hp and HSI = 0.238 hp/in2 (or 2.75 kW/m2) are obtained. Therefore, the bit size and the hydraulic horse-power requirement for this experiment are well within the specifications for the drilling simulator and Table 2 provides the summary of the input parameters used in the experiment.
Experimental procedure
The drilling of the test specimens is planned and conducted such that the depth of specimen drilled experiences three consecutive stages of drilling simulation: no-kick region 1 (NKR-1), kick region (KR), and no-kick region 2 (NKR-2) respectively. Approximately 80% of the test specimen with 4-in total depth is drilled for each run to ensure the test specimen fully interacts with the two PDC cutters and
(5)Php =ΔPbitq
1714(hp),
(6)HSI =Php
Abit
(
hp∕in2)
,
Fig. 3 Test specimen prepara-tion: steps 0–3
Table 2 Summary of input simulation parameters
Parameters Description Values Units
WOB Applied weight on bit 54.3 kgq Mud pump input flow rate 47.3 L/minPi Initial downhole pressure 30–35 psiPg Compressed gas input pressure 170–180 psiQ Compressed air input flow rate 8–9 SCFMN Drilling motor speed 292–300 Rpmρmud Water base mud density 1000 kg/m3

610 Journal of Petroleum Exploration and Production Technology (2019) 9:605–616
1 3
remains intact after drilling simulation. The air is injected into the test specimen via the filtration exhaust of the down-hole pressure cell, as shown in Fig. 4. The test procedure is conducted as follows:
a) The drilling procedure begins by installing the test speci-men in the downhole pressure cell, which becomes a closed wellbore.
b) The experiment commences after the test specimen secured in the pressure cell and simulation equipment has been fully set up as shown in Fig. 4.
c) After drilling about one-third of the test specimen depth (NKR-1), compressed air is injected into the pressure cell at a fixed rate of 8–9 SCFM and the pressured air travels from the bottom of the test specimen to the top via the hole through the centre of the specimen. This enables the bit–rock–air interactions and simulates the kick region (KR).
d) After drilling approximately another one-third or more of the test specimen during kick, the air injec-tion is stopped as the drilling continues with no kick (NKR-2). During this operation, downhole parametric data, including rotary angular speed, rate of penetra-tion (ROP), average depth of cut, axial displacement of the bits, motor current and WOB are logged by DAQ #1, while the downhole pressure, inlet pressure into the return line, return mud mass flow and density flow rates are logged by DAQ #2.
Results and discussion
Six downhole dynamic drilling parameters that are meas-ured and calculated during experimental simulations are weight on bit (WOB), torque on bit (TOB), downhole pres-sure, rate of penetration (ROP), rotary speed and bit axial displacement (vibrations). In addition to these parameters, four surface parameters are monitored and these include choke pressure, return fluid mass flow rates, volume flow rates, and density. Two experimental runs are conducted to ensure repeatable and consistent results. The results from these experiments have been compared and found con-sistent with Aldred et al. (1998) field reports on drilling parameters’ response to kick.
Aldred et al. (1998) reports focused on the performance of annular pressure while drilling tools, along with other BHA tools, for monitoring drilling performance and mak-ing proactive decisions during drilling operations. These tools were utilized in the Eugene Island field in the Gulf of Mexico where the formation consisted of sequences of shales and target sands that were likely depleted by previ-ous production. The drilling contractor, anadrill, utilized series of downhole tools, including the compensated dual resistivity, multi-axis vibrational cartridge, integrated weight on bit, and annular pressure while drilling for this well. Thus, drilling parameters including downhole torque and weight on bit, axial and torsional vibrations, ROP, annulus pressure, equivalent circulating density (ECD) were being measured. When kick was taken in a 12¼-in hole section, their measurements started to drop
5P
Suspended Weight
PumpPump Control
FlowDisplay
1000 L Water Tank
Sheave Wheel
Cable Wire
Rack-pinion
LVDT
Drill motor
Laser sensor
SwivelRotating flat disc
Drillpipe
55PT
Upstream pressure transducer
Valve
Flow meter
Pressure cell
ClamRock sample
Hole through rockLoad cell
Downhole pressure transducer
Downhole Pressure gauge
Drill bit
Data Acquisition System Control
(DAQ 1)
S
55PT
Surface pressure
Coriolisflow
Pressure relief valve
Pressure control valve
Backpressure valve
Pressure relief line
Conductivity sensor
Air compressorSolenoid
valveGas flow meter
Gas pressure transducer
Check valve
Steel frame support
Steel frame support Data
Acquisition control system (DAQ2)
Gas injection
55PT
Fig. 4 Kick experiment process flow diagram

611Journal of Petroleum Exploration and Production Technology (2019) 9:605–616
1 3
in response to kick. These deviations can be observed in Fig. 5, i.e. ROP, WOB, annulus pressure, torques, vibra-tions, and ECD dropped due to kick. These responses in drilling parameters indicating kick occurrence are found to have consistent responses with the experimental results that are being presented in this section.
Kick effects on downhole WOB and pressures
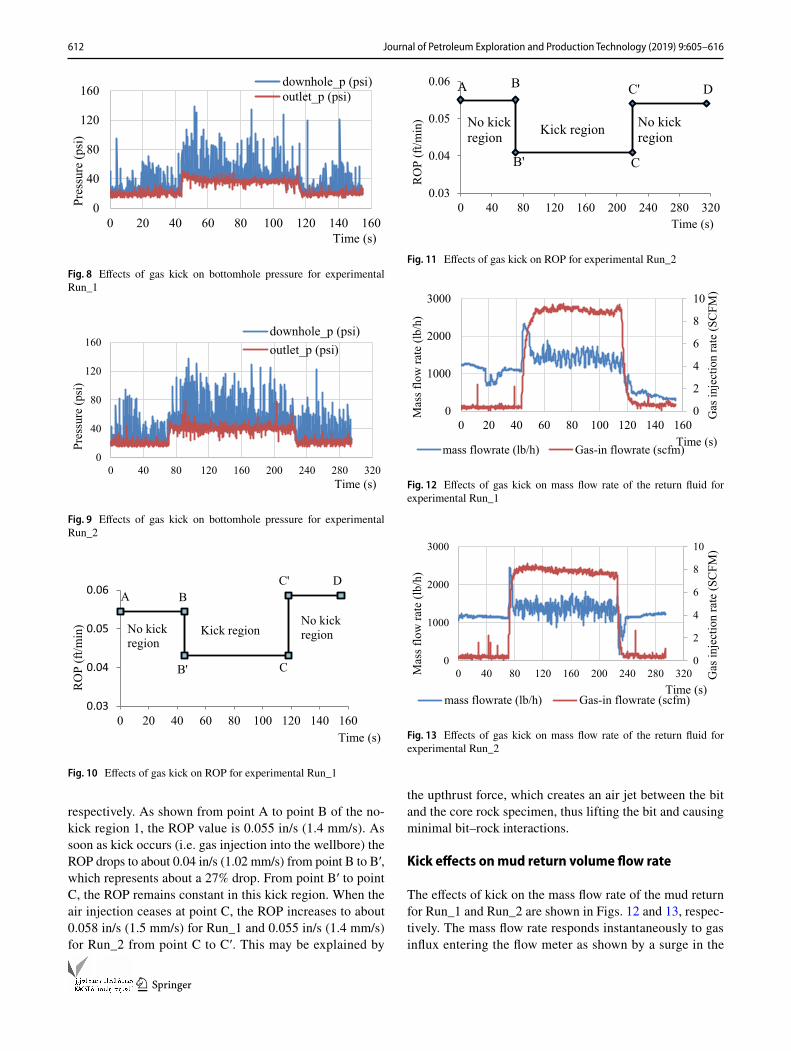
The effects of kick on drilling parameters, such as WOB and bottomhole pressures for both experimental runs are shown in Figs. 6, 7, 8 and 9. Figures 6 and 7 show the effects of
kicks on WOB for both Run_1 and Run_2, respectively. It is observed from both curves that the WOB decreases in magnitude after the kick is initiated. The moment when the kick is injected into the drilling system is consistent with the moment when the downhole and output pressures surge by an average of 25–45 psi above the initial downhole pressure, as shown in Figs. 8 and 9 of Run_1 and Run_2, respectively.
Kick effects on ROP
The kick effects on the rate of penetration (ROP) can be observed in Figs. 10 and 11 of Run_1 and Run_2,
Fig. 5 Reproduced well log with respect to time showing the kick alert in the GOM well (Source: Aldred et al. 1998)
Fig. 6 Effects of gas kick on WOB for experimental Run_1Fig. 7 Effects of gas kick on WOB for experimental Run_2
612 Journal of Petroleum Exploration and Production Technology (2019) 9:605–616
1 3
respectively. As shown from point A to point B of the no-kick region 1, the ROP value is 0.055 in/s (1.4 mm/s). As soon as kick occurs (i.e. gas injection into the wellbore) the ROP drops to about 0.04 in/s (1.02 mm/s) from point B to B′, which represents about a 27% drop. From point B′ to point C, the ROP remains constant in this kick region. When the air injection ceases at point C, the ROP increases to about 0.058 in/s (1.5 mm/s) for Run_1 and 0.055 in/s (1.4 mm/s) for Run_2 from point C to C′. This may be explained by
the upthrust force, which creates an air jet between the bit and the core rock specimen, thus lifting the bit and causing minimal bit–rock interactions.
Kick effects on mud return volume flow rate
The effects of kick on the mass flow rate of the mud return for Run_1 and Run_2 are shown in Figs. 12 and 13, respec-tively. The mass flow rate responds instantaneously to gas influx entering the flow meter as shown by a surge in the
0
40
80
120
160
0 20 40 60 80 100 120 140 160
downhole_p (psi)outlet_p (psi)
Pres
sure
(psi
)
Time (s)
Fig. 8 Effects of gas kick on bottomhole pressure for experimental Run_1
0
40
80
120
160
0 40 80 120 160 200 240 280 320
downhole_p (psi)outlet_p (psi)
Pres
sure
(psi
)
Time (s)
Fig. 9 Effects of gas kick on bottomhole pressure for experimental Run_2
0.03
0.04
0.05
0.06
0 20 40 60 80 100 120 140 160
RO
P (f
t/min
)
Time (s)
No kick region
B
C
DA
Kick regionNo kick region
B'
C'
Fig. 10 Effects of gas kick on ROP for experimental Run_1
0.03
0.04
0.05
0.06
0 40 80 120 160 200 240 280 320
RO
P (f
t/min
)
Time (s)
A B
C
D
No kick region Kick region No kick
region
B'
C'
Fig. 11 Effects of gas kick on ROP for experimental Run_2
0
2
4
6
8
10
0
1000
2000
3000
0 20 40 60 80 100 120 140 160
Gas
inje
ctio
n ra
te (S
CFM
)
mass flowrate (lb/h) Gas-in flowrate (scfm)
Mas
s flo
w ra
te (l
b/h)
Time (s)
Fig. 12 Effects of gas kick on mass flow rate of the return fluid for experimental Run_1
0
2
4
6
8
10
0
1000
2000
3000
0 40 80 120 160 200 240 280 320 Gas
inje
ctio
n ra
te (S
CFM
)
Mas
s flo
w ra
te (l
b/h)
Time (s)mass flowrate (lb/h) Gas-in flowrate (scfm)
Fig. 13 Effects of gas kick on mass flow rate of the return fluid for experimental Run_2

613Journal of Petroleum Exploration and Production Technology (2019) 9:605–616
1 3
mass flow rate of the return mud. The continuous injection of compressed air (influx) into the wellbore then causes erratic readings of the mass flow rate that, by observation, is on average higher in magnitude than the pre- and post-gas kick readings. The observed increase in the mass flow rate may be due to the increased mass velocity of the fluid caused by gas influx.
Additionally, the effects of kick on fluid density are shown in Fig. 14. The fluid density is observed to drop in magnitude due to the gas influx. This can be explained by the low-density fluid (air) injected into the wellbore mud decreasing the bulk density of the return mud. Since the volume flow rate is determined by dividing the mass rate by the combined fluid density, the volume flow rate increases due to gas kick; this effect is shown in Fig. 15.
Kick effects on rotary speed
The minimal bit–rock interactions created by the upthrust jet during air injection into the wellbore for Run_1 and Run_2 may also explain the reason for the increase in rotary speed. The rotary speed is calculated from the relative displacement data acquired from the laser sensor projection on a rotating disc by means of counting the number of spikes created by the three grooves located on
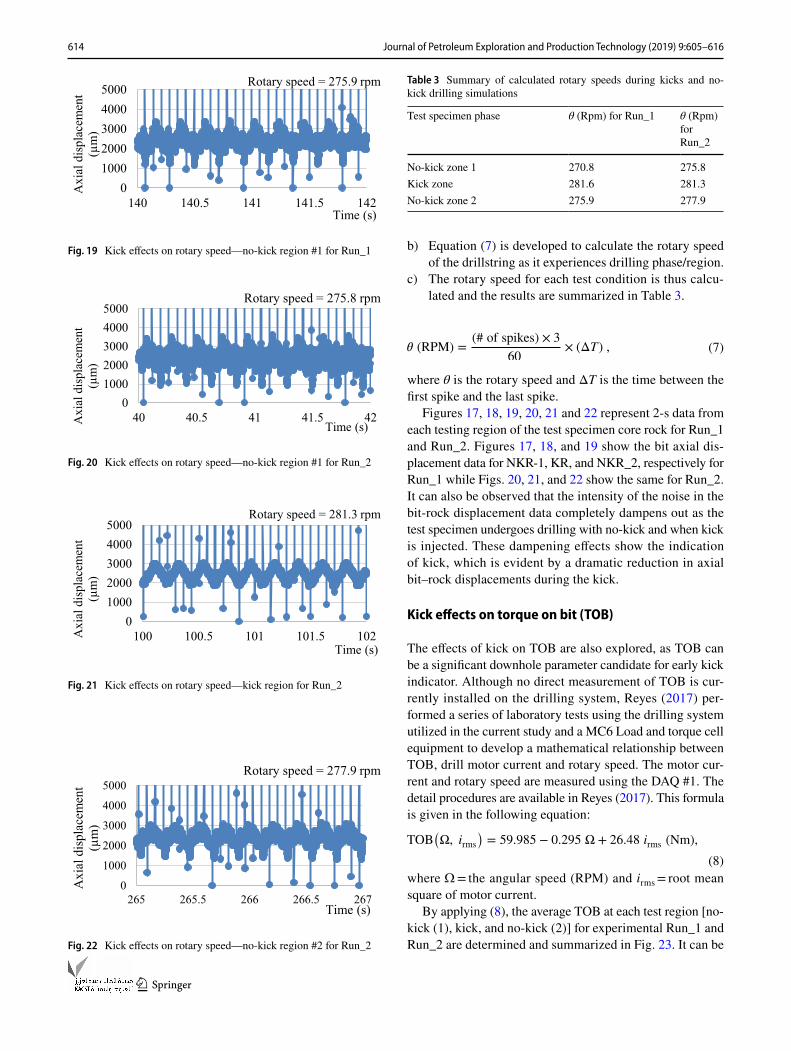
the plate 120° apart, as shown in Fig. 16. These grooves are recorded as spikes in the bit–rock axial displacement data as the tool rotates during drilling. These spikes can be noted in Figs. 17, 18 and 19 for Run_1 and Figs. 20, 21 and 22 for Run_2 of the axial bit displacements versus time graphs. The rotary speed for each test condition, is thus calculated by the following procedures a) to c) and the results are summarized in Table 3:
a) The rotary speed (RPM) calculation can be determined by counting the number of spikes between the 2-s period and then calculate the average of spikes per 1-min revo-lution.
010203040506070
0 40 80 120 160 200 240 280 320Flow
den
sity
(lb/
ft3 )
Time (s)Flow density (lb/cf)
Fig. 14 Effects of gas kick on mud density of the return fluid for experimental Run_2
02468
1012
0 40 80 120 160 200 240 280 320Vol
. flo
w ra
te (g
pm)
Time (s)volume flow rate (gpm)
Fig. 15 Effects of gas kick on volume flow rate of the return fluid for experimental Run_2
Laser Triangulation sensor (LTS)
Rotating flat disc with three grooves that record as spikes and aid in determining the rotary speed
Fig. 16 An image of a rotating flat disc with three grooves for meas-uring relative displacement between the motor head and the drill pipe
010002000300040005000
40 40.5 41 41.5 42A
xial
dis
plac
emen
t (µ
m)
Time (s)
Rotary speed = 270.8 rpm
Fig. 17 Kick effects on rotary speed—no-kick region #1 for Run_1
0
1000
2000
3000
4000
5000
90 90.5 91 91.5 92
Axi
al d
ispl
acem
ent
(µm
)
Time (s)
Rotary speed = 281.6 rpm
Fig. 18 Kick effects on rotary speed—kick region for Run_1
614 Journal of Petroleum Exploration and Production Technology (2019) 9:605–616
1 3
b) Equation (7) is developed to calculate the rotary speed of the drillstring as it experiences drilling phase/region.
c) The rotary speed for each test condition is thus calcu-lated and the results are summarized in Table 3.
where θ is the rotary speed and ΔT is the time between the first spike and the last spike.
Figures 17, 18, 19, 20, 21 and 22 represent 2-s data from each testing region of the test specimen core rock for Run_1 and Run_2. Figures 17, 18, and 19 show the bit axial dis-placement data for NKR-1, KR, and NKR_2, respectively for Run_1 while Figs. 20, 21, and 22 show the same for Run_2. It can also be observed that the intensity of the noise in the bit-rock displacement data completely dampens out as the test specimen undergoes drilling with no-kick and when kick is injected. These dampening effects show the indication of kick, which is evident by a dramatic reduction in axial bit–rock displacements during the kick.
Kick effects on torque on bit (TOB)
The effects of kick on TOB are also explored, as TOB can be a significant downhole parameter candidate for early kick indicator. Although no direct measurement of TOB is cur-rently installed on the drilling system, Reyes (2017) per-formed a series of laboratory tests using the drilling system utilized in the current study and a MC6 Load and torque cell equipment to develop a mathematical relationship between TOB, drill motor current and rotary speed. The motor cur-rent and rotary speed are measured using the DAQ #1. The detail procedures are available in Reyes (2017). This formula is given in the following equation:
where Ω = the angular speed (RPM) and irms = root mean square of motor current.
By applying (8), the average TOB at each test region [no-kick (1), kick, and no-kick (2)] for experimental Run_1 and Run_2 are determined and summarized in Fig. 23. It can be
(7) (RPM) =(# of spikes) × 3
60× (ΔT) ,
(8)TOB
(
Ω, irms
)
= 59.985 − 0.295 Ω + 26.48 irms (Nm),
010002000300040005000
140 140.5 141 141.5 142
Axi
al d
ispl
acem
ent
(µm
)
Time (s)
Rotary speed = 275.9 rpm
Fig. 19 Kick effects on rotary speed—no-kick region #1 for Run_1
010002000300040005000
40 40.5 41 41.5 42Axi
al d
ispl
acem
ent
(µm
)
Time (s)
Rotary speed = 275.8 rpm
Fig. 20 Kick effects on rotary speed—no-kick region #1 for Run_2
010002000300040005000
100 100.5 101 101.5 102Axi
al d
ispl
acem
ent
(µm
)
Time (s)
Rotary speed = 281.3 rpm
Fig. 21 Kick effects on rotary speed—kick region for Run_2
0
1000
2000
3000
4000
5000
265 265.5 266 266.5 267
Axi
al d
ispl
acem
ent
(µm
)
Time (s)
Rotary speed = 277.9 rpm
Fig. 22 Kick effects on rotary speed—no-kick region #2 for Run_2
Table 3 Summary of calculated rotary speeds during kicks and no-kick drilling simulations
Test specimen phase θ (Rpm) for Run_1 θ (Rpm) for Run_2
No-kick zone 1 270.8 275.8Kick zone 281.6 281.3No-kick zone 2 275.9 277.9

615Journal of Petroleum Exploration and Production Technology (2019) 9:605–616
1 3
observed that the average TOB drops when kick is experi-enced in the wellbore (pressure cell). This may be conse-quential to the lift force exerted by the air jet underneath the bit reducing the interactions between the bit and the core specimen. This reduction in interactions will lower the driv-ing force (or TOB) required to drill the core specimen com-pared to the higher driving force required when the wellbore is not experiencing kick, which will thus increase the TOB.
These results are consistent with behaviour of all other drilling/downhole parameters that are explored in this work. For example, the kick region experiences a higher rotary speed, lower TOB and lower ROP compared to a lower rotary speed, higher TOB, and higher ROP for a no-kick region. These results are also consistent with the field data reported in Aldred et al. (1998). It can be concluded that a dramatic drop in TOB during drilling can be an indication of kick occurrence downhole.
Bit–rock interaction and analysis
The most significant new finding of this work is the dampen-ing effect of drilling vibrations due to kick. These are cap-tured in Figs. 17, 18 and 19 of Run_1 and 20–22 of Run_2. By using a time-scale analysis, 2-s (precisely 2.048 s) data are extracting from Run_1 plots in Fig. 16, 17, and 18 and plotted them to place the data response of each test region sequentially for visualization. The result, as illustrated in Fig. 24, shows significant changes in the axial displacement and vibration as the core specimen experiences the no-kick region (1) → kick region → no-kick region (2) sequence.
This behaviour may constitute an indication of influx into the wellbore.
Additionally, a frequency analysis is performed using fast Fourier transform (FFT) as a data processing method, which converts the data from time-scale domain into frequency domain. The purpose for performing frequency analysis is to identify different frequencies in the data. By default, the overall bit axial displacement also consists of axial vibration, which is of interest to this analysis. The current work adopts Reyes (2017) methodology to perform the data processing for the overall bit axial vibration frequency analysis using the following equation:
where Uvib is the axial vibration; T is the time; ROPavgis the Average ROP; Uis the axial displacement.
By applying this methodology and process, the axial displacement frequencies obtained are signals as shown in Fig. 25. It can be noted that there is a significant drop in the bit axial vibration during kick as compared to no-kick conditions.
Conclusions
The current study monitored nine parameters, including dynamic WOB, downhole pressure, ROP, rotary speed, TOB, axial bit–rock interaction vibration, mud density, return mass flow rate, and return volume flow rate. These parameters are measured during lab-scale drilling simula-tions of synthetic core specimens with a hole drilled through the center to aid bit–rock–gas influx interactions. Each core specimen undergoes three consecutive test stages during drilling: no-kick region (1), kick region (KR), and no-kick region (2). The results from all monitored parameters show that influx indications are consistent with case studies and field reports and are summarized as follows:
a) WOB The magnitude of WOB decreases in response to gas influx.
(9)Uvib =(
T × ROPAvg)
− U,
8.17.3
5 4.5
7.76.7
0
2
4
6
8
10
Run_1 Run_2
TOB
(N.m
)
1 No-kick region #1 (NKR-1) 2 Kick region (KR) 3 No-kick region #2 (NKR-2)
Fig. 23 Kick effects on TOB for experimental Run_1 and Run_2
500
1500
2500
3500
4500
0 2 4 6 8
Axi
al d
ispl
acem
ent (
µm)
Time (s)
kickNo kick (1)No kick (2)
Fig. 24 Kick effects on axial bit–rock displacement (time domain)—Run_1
14.2
4.9 Hz
9.30
50
100
150
200
250
300
0 5 10 15 20 25 30 35 40 45 50 55 60
edutilpma
noitarbivlaixA
(µm
)
Frequency (Hz)
no kick (1)kick
Ω0 = 30.8 rad/s (4.9 Hz)
Fig. 25 Kick effects on axial bit–rock vibration frequency—Run_1

616 Journal of Petroleum Exploration and Production Technology (2019) 9:605–616
1 3
b) Downhole pressure There is an immediate surge in downhole pressure in response to kick.
c) Mud return flow rate Mud density drops in response to kick and the volume flow rate increases in response to kick.
d) ROP The rate of penetration drops during gas influx and this may be explained by less bit–rock interaction due to the air jet exerted below the bit.
e) Rotary speed and TOB The rotary speed increases when kick is experienced in the wellbore while the TOB decreases. These behaviours may be explained due to less bit–rock interactions causing the drillstring to rotate faster and with less driving force.
f) Axial bit vibration The amplitude of axial bit vibration significantly decreases as the kick is taking in the well-bore.
The most significant new finding of the study is the damp-ening behaviour of drilling vibrations due to gas influx. This is evidenced by a dramatic reduction in axial bit–rock dis-placement/vibration during the kick and the behaviour are illustrated in both time and frequency scales analyses. The dampening effects of drilling vibrations during kick can potentially serve as a new influx indicator during drilling with more large-scale/field investigations. Thus, for most drilling scenarios where temperature and pressure are higher, the kick size, rate, and rising time are expected to be higher; however, these conditions will not change how the drilling parameters will respond to the kick occurrence and detection given that appropriate downhole and surface-sensing devices are used. Therefore, the drilling parameters measured and studied in the current paper are expected to respond consistently to gas kick in all practices as indicated and concluded.
Acknowledgements The authors acknowledge the financial support from the Natural Sciences and Engineering Research Council (NSERC) of Canada, Vale Research Chair Grant, National Research Council Canada (NRC), and Research and Development Corporation of New-foundland and Labrador (RDC).
Open Access This article is distributed under the terms of the Crea-tive Commons Attribution 4.0 International License (http://creat iveco mmons .org/licen ses/by/4.0/), which permits unrestricted use, distribu-tion, and reproduction in any medium, provided you give appropriate credit to the original author(s) and the source, provide a link to the Creative Commons license, and indicate if changes were made.
References
Ahmed MA, Hegab OA, Sabry A (2016) Early detection enhancement of the kick and near-balance drilling using mud logging warning
sign. Egypt J Basic Appl Sci 3(1):85–93. https ://doi.org/10.1016/j.ejbas .2015.09.006
Aldred W, Cook J, Bern P, Carpenter B, Hutchinson M, Lovell J, Rezmer-Cooper I, Leder PC (1998) Using downhole annular pressure measurements to improve drilling performance. Oilfield review. http://www.slb.com/~/media /Files /resou rces/oilfi eld_revie w/ors98 /win98 /using .pdf. Accessed 12 Nov 2016
DiFoggio R, Blue DD (2012) Early kick detection in an oil and gas well. US Patent 2012/0170406 A1, published July 5. http://www.googl e.com/paten ts/US201 20170 406. Accessed 16 Nov 2016
Graham B, Reilly WK, Beinecke F, Boesch DF, Garcia TD, Murray CA, Ulmer F (2011) Deep water, the Gulf oil disaster and the future of offshore drilling. National commission on the BP deep-water horizon oil spill and offshore drilling. https ://www.gpo.gov/fdsys /pkg/GPO-OILCO MMISS ION/pdf/GPO-OILCO MMISS ION.pdf. Accessed 21 Dec 2016
Khorshidan H (2012) Phenomena affecting penetration mechanisms of polycrystalline diamond compact bits. Master thesis, Faculty of Engineering and Applied Science, Memorial University of New-foundland, St. John’s, NL. http://resea rch.libra ry.mun.ca/id/eprin t/2357. Accessed 25 Aug 2016
Nayeem AA, Ramachandran V, Khan F (2016) Monitoring of down-hole parameters for early kick detection. J Loss Prev Process Ind 40:43–54. https ://doi.org/10.1016/j.jlp.2015.11.025
Reyes NR (2017) Bit–rock interaction in rotary drilling: numerical and experimental study. Master thesis, Faculty of Engineering and Applied Science, Memorial University of Newfoundland, St. John’s, NL
Schubert JJ, Wright JC (1998) early kick detection through liquid level monitoring in the wellbore. Presented at IADC/SPE drill-ing conference held in Dallas, Texas. 3–6 March. https ://doi.org/10.2118/39400 -MS
Trivedi PP (2014) Innovative kick detection system for HP/HT ultradeepwater wells using a section of the BHA. Paper presented at the Offshore technology conference held in Houston, Texas, USA. 5–8 May. https ://doi.org/10.4043/25074 -MS
Vajargah AK, van Oort E (2015) Early kick detection and well con-trol decision-making for managed pressure drilling automation. J Nat Gas Sci Eng 7(1):354–366. https ://doi.org/10.1016/j.jngse .2015.08.067
Velmurugan N, Bansal G, Sharma T, Gandhi R (2015) WellCON: an early kick detection system. SPE. Paper presented at Abu Dhabi international petroleum exhibition and conference held in Abu Dhabi, UAE, 9–12 November. https ://doi.org/10.2118/17767 0-MS
Zhang Z (2017) Development and characterization of synthetic rock-like materials for drilling and geomechanics experiments. Master thesis, Faculty of Engineering and Applied Science, Memorial University of Newfoundland, St. John’s, NL
Publisher’s Note Springer Nature remains neutral with regard to jurisdictional claims in published maps and institutional affiliations.