
EXPERIMENTAL INVESTIGATION OF FLAME AND PRESSURE …
12
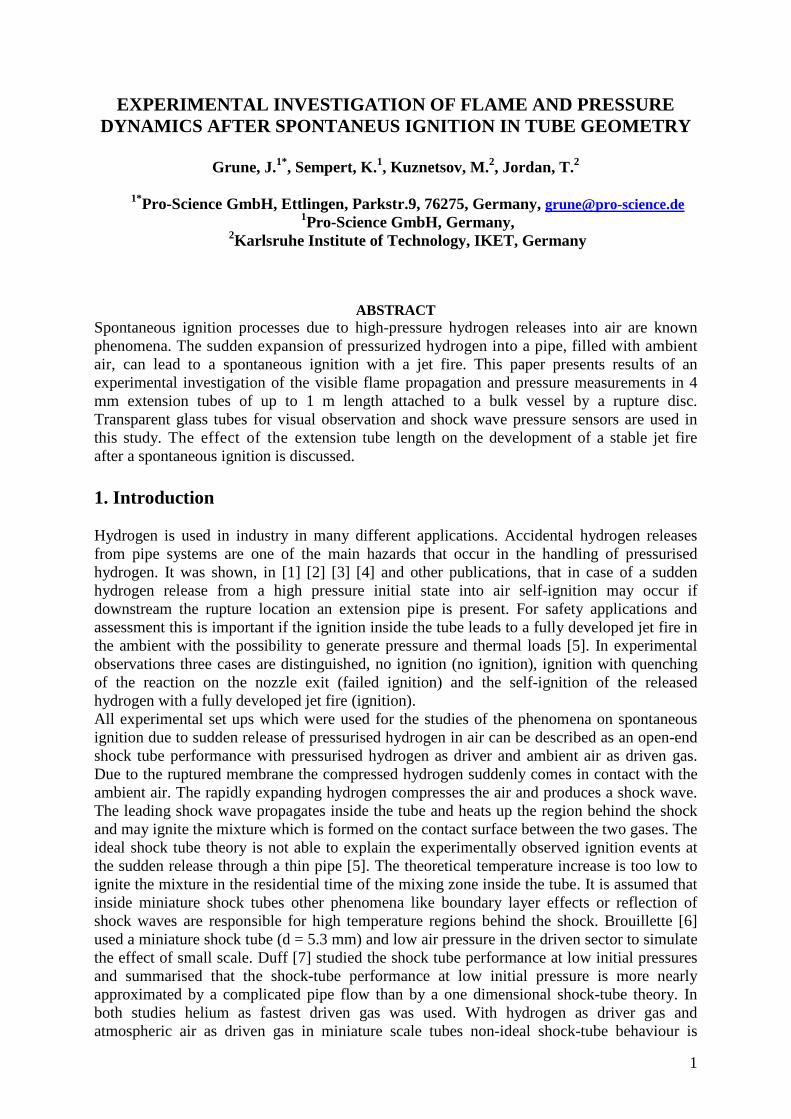
1 EXPERIMENTAL INVESTIGATION OF FLAME AND PRESSURE DYNAMICS AFTER SPONTANEUS IGNITION IN TUBE GEOMETRY Grune, J. 1* , Sempert, K. 1 , Kuznetsov, M. 2 , Jordan, T. 2 1* Pro-Science GmbH, Ettlingen, Parkstr.9, 76275, Germany, [email protected] 1 Pro-Science GmbH, Germany, 2 Karlsruhe Institute of Technology, IKET, Germany ABSTRACT Spontaneous ignition processes due to high-pressure hydrogen releases into air are known phenomena. The sudden expansion of pressurized hydrogen into a pipe, filled with ambient air, can lead to a spontaneous ignition with a jet fire. This paper presents results of an experimental investigation of the visible flame propagation and pressure measurements in 4 mm extension tubes of up to 1 m length attached to a bulk vessel by a rupture disc. Transparent glass tubes for visual observation and shock wave pressure sensors are used in this study. The effect of the extension tube length on the development of a stable jet fire after a spontaneous ignition is discussed. 1. Introduction Hydrogen is used in industry in many different applications. Accidental hydrogen releases from pipe systems are one of the main hazards that occur in the handling of pressurised hydrogen. It was shown, in [1] [2] [3] [4] and other publications, that in case of a sudden hydrogen release from a high pressure initial state into air self-ignition may occur if downstream the rupture location an extension pipe is present. For safety applications and assessment this is important if the ignition inside the tube leads to a fully developed jet fire in the ambient with the possibility to generate pressure and thermal loads [5]. In experimental observations three cases are distinguished, no ignition (no ignition), ignition with quenching of the reaction on the nozzle exit (failed ignition) and the self-ignition of the released hydrogen with a fully developed jet fire (ignition). All experimental set ups which were used for the studies of the phenomena on spontaneous ignition due to sudden release of pressurised hydrogen in air can be described as an open-end shock tube performance with pressurised hydrogen as driver and ambient air as driven gas. Due to the ruptured membrane the compressed hydrogen suddenly comes in contact with the ambient air. The rapidly expanding hydrogen compresses the air and produces a shock wave. The leading shock wave propagates inside the tube and heats up the region behind the shock and may ignite the mixture which is formed on the contact surface between the two gases. The ideal shock tube theory is not able to explain the experimentally observed ignition events at the sudden release through a thin pipe [5]. The theoretical temperature increase is too low to ignite the mixture in the residential time of the mixing zone inside the tube. It is assumed that inside miniature shock tubes other phenomena like boundary layer effects or reflection of shock waves are responsible for high temperature regions behind the shock. Brouillette [6] used a miniature shock tube (d = 5.3 mm) and low air pressure in the driven sector to simulate the effect of small scale. Duff [7] studied the shock tube performance at low initial pressures and summarised that the shock-tube performance at low initial pressure is more nearly approximated by a complicated pipe flow than by a one dimensional shock-tube theory. In both studies helium as fastest driven gas was used. With hydrogen as driver gas and atmospheric air as driven gas in miniature scale tubes non-ideal shock-tube behaviour is
Transcript of EXPERIMENTAL INVESTIGATION OF FLAME AND PRESSURE …
1
EXPERIMENTAL INVESTIGATION OF FLAME AND PRESSUREDYNAMICS AFTER SPONTANEUS IGNITION IN TUBE GEOMETRY
Grune, J.1*, Sempert, K.1, Kuznetsov, M.2, Jordan, T.2
1*Pro-Science GmbH, Ettlingen, Parkstr.9, 76275, Germany, [email protected] GmbH, Germany,
2Karlsruhe Institute of Technology, IKET, Germany
ABSTRACTSpontaneous ignition processes due to high-pressure hydrogen releases into air are knownphenomena. The sudden expansion of pressurized hydrogen into a pipe, filled with ambientair, can lead to a spontaneous ignition with a jet fire. This paper presents results of anexperimental investigation of the visible flame propagation and pressure measurements in 4mm extension tubes of up to 1 m length attached to a bulk vessel by a rupture disc.Transparent glass tubes for visual observation and shock wave pressure sensors are used inthis study. The effect of the extension tube length on the development of a stable jet fireafter a spontaneous ignition is discussed.
1. Introduction
Hydrogen is used in industry in many different applications. Accidental hydrogen releasesfrom pipe systems are one of the main hazards that occur in the handling of pressurisedhydrogen. It was shown, in [1] [2] [3] [4] and other publications, that in case of a suddenhydrogen release from a high pressure initial state into air self-ignition may occur ifdownstream the rupture location an extension pipe is present. For safety applications andassessment this is important if the ignition inside the tube leads to a fully developed jet fire inthe ambient with the possibility to generate pressure and thermal loads [5]. In experimentalobservations three cases are distinguished, no ignition (no ignition), ignition with quenchingof the reaction on the nozzle exit (failed ignition) and the self-ignition of the releasedhydrogen with a fully developed jet fire (ignition).All experimental set ups which were used for the studies of the phenomena on spontaneousignition due to sudden release of pressurised hydrogen in air can be described as an open-endshock tube performance with pressurised hydrogen as driver and ambient air as driven gas.Due to the ruptured membrane the compressed hydrogen suddenly comes in contact with theambient air. The rapidly expanding hydrogen compresses the air and produces a shock wave.The leading shock wave propagates inside the tube and heats up the region behind the shockand may ignite the mixture which is formed on the contact surface between the two gases. Theideal shock tube theory is not able to explain the experimentally observed ignition events atthe sudden release through a thin pipe [5]. The theoretical temperature increase is too low toignite the mixture in the residential time of the mixing zone inside the tube. It is assumed thatinside miniature shock tubes other phenomena like boundary layer effects or reflection ofshock waves are responsible for high temperature regions behind the shock. Brouillette [6]used a miniature shock tube (d = 5.3 mm) and low air pressure in the driven sector to simulatethe effect of small scale. Duff [7] studied the shock tube performance at low initial pressuresand summarised that the shock-tube performance at low initial pressure is more nearlyapproximated by a complicated pipe flow than by a one dimensional shock-tube theory. Inboth studies helium as fastest driven gas was used. With hydrogen as driver gas andatmospheric air as driven gas in miniature scale tubes non-ideal shock-tube behaviour is

expected. Pressure measurements combined with light sensor signals from miniature shock-tube tests were presented in [3] [4] [8] and in combination with optical high speed techniquein [9]. However there is a lack of highly resolved pressure measurements in miniature shocktubes with spontaneous ignition due to the sudden discharge of pressurised hydrogen into air.The goal of this work is to measure the pressure dynamic in 4 mm circular extension tubesdownstream a rupture disc in combination with a visualisation of the radiating (reacting) zonein case of a spontaneous ignition due to the sudden release of pressurized hydrogen intoatmospheric air.
2. Experimental set-up
The miniature open end shock tube facility is sketched in Fig. 1 top left. Via a feed line valve(a) the cylindrical storage vessel (b) with a volume of 0.37 dm3 is filled with pressurized highpurity H2 (99.999 vol. %). A helium driven needle valve DN 4 mm (c) with a valve openingtime < 2 ms is installed between the high pressure vessel and a 4 mm release nozzle (d). Therelease nozzle is equipped with a rupture disc holder build from 4 mm tubes, see insertedpicture. The extension pipe downstream of the rupture disc is open to the atmosphere. In thepresented study different 4 mm cylindrical extension tubes are used in the experiments. TheFig. 1 (bottom) shows an exemplary extension tube configuration. The total extension tubelength in this example is 630 mm, three pressure sensor ports (e) are connected via industrialfittings with glass tubes (f). The pressure sensor ports are equipped with dynamic tourmalinegauges (PCB Type 134A24). The active planar sensor surface is integrated in the 4 mm pipeon the inner tangential position in the best way to avoid disturbances of the shock wave or thehigh speed flow. The sensor signals are monitored with a sample rate of 1 µs. This value isfive times higher than the sensors rise time of 0.2 µs. Aluminum rupture discs from 0.06 mmup to 0.3 mm were used in the experiments. Fig 1 right shows the burst pressure range of theused aluminum membranes and the initial release pressures P0 in the vessel used in this study.
Fig.1: Schematmembranes vs.from three pres
2
ic of the experimental set-up (top left). Burst pressure range of the aluminuminitial bulk pressure (top right). Photograph of a 4 mm extension tube built
sure gauges in metal tubes and transparent glass sections (bottom).
b

3
In most cases the rupture pressure of the installed aluminum rupture discs was significantlylower than the bulk pressures P0 in the 0.37 dm3 vessel. In all experiments the small volumeof 2.2 cm3 between the rupture disc and the fast bulk release valve (c) was filled with H2 atatmospheric pressure.
In Table 1 the main experimental variables: extension tube configuration, release pressure inthe 0.37 dm3 vessel and the rupture disc properties are listed. Ignition events and flamepropagation inside the extension tube were captured via high speed cinematography along thetransparent tube parts. A resulting fully developed jet fire was observed by direct opticalobservation.
Table 1: Overview of the main experimental variables.Range of bulk
pressureP0 / bar
Range ofrupture disc
thicknesss / mm
Total tubelengths
L total / mm
Positionpressuregauge P1LP1 / mm
Positionpressuregauge P2LP2 / mm
Positionpressuregauge P3LP3 / mm
Transparenttube parts
0 to 200 0.0 to 0.3 132 80 122 - -
50 and 200 0.0 and 0.1 1145 1093 1135 - yes25 to 200 0.06 to 0.3 645 593 635 - yes
200 0.0 to 0.3 230 68 133 202 -30 to 200 0.0 to 0.2 630 133 309 490 yes
50 and 120 0.06 to 0.2 720 52 581 - yes120 to 240 0.1 1040 52 - - yes24 to 160 0.06 to 0.3 210 122 70 yes
120 0.06 633 52 133 494 yes
3. Experimental observations
3.1 Flow visualisation in rectangular tubes
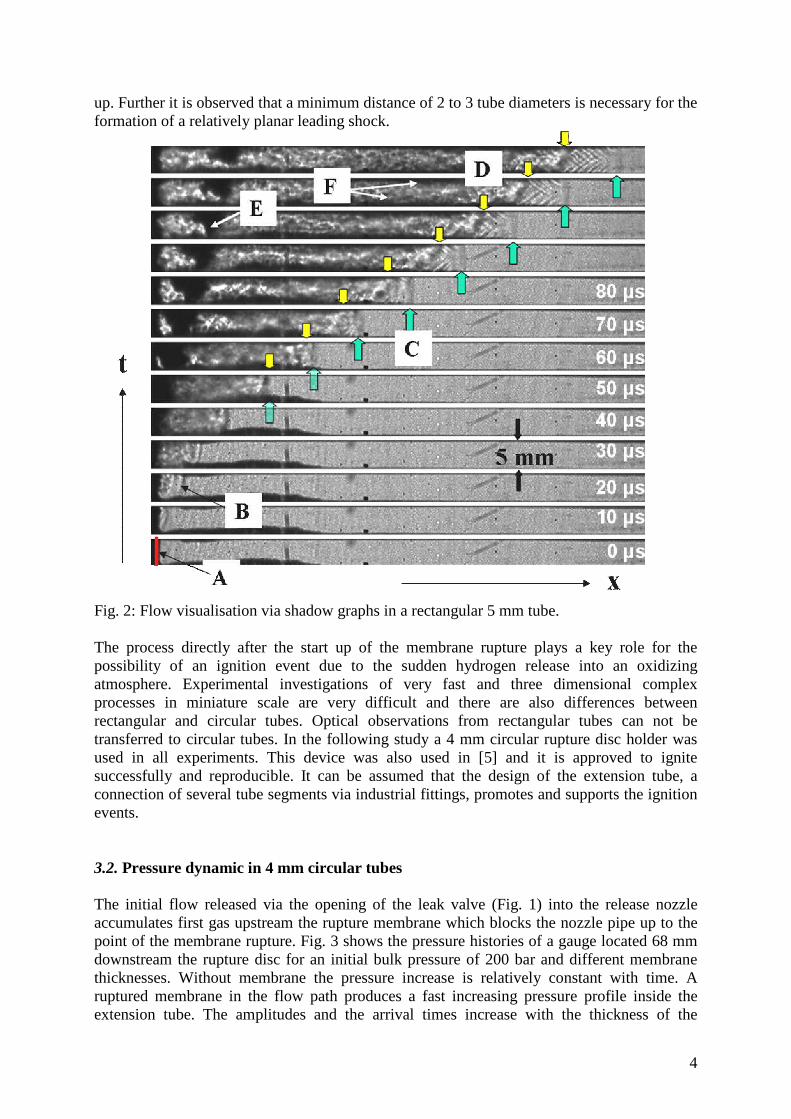
The shadow pictures taken from a high speed movie (100000 f/s) in Fig. 2 illustratequalitatively the release of pressurised hydrogen (60 bar) into a rectangular 5 mm tube filledwith ambient air via rupture of an aluminium membrane (0.1 mm). In this example the visiblezone starts from the position of the burst membrane (A). The burst membrane ruptures withinthe first 10 µs and at first a relatively slow wave with the velocity of the sound speed in airpropagates inside the tube. But later in time, 40 to 50 µs after the membrane was completelyruptured, it is not possible to separate a leading shock from the expanding hydrogen. After 60µs a leading shock front (C) followed by a contact surface (D) can be identified. The distancebetween the leading shock front (C) and contact surface (D) increases with the distance. Theleading shock front is not captured as a sharp line in this shadow graph because the structureof the shock wave is not ideal planar it is in a three-dimensional form. Between the leadingshock front and the contact face multiple reflecting shock waves are visible. Due to the highspeed flow (~ 1000 m/s) in the relatively narrow tube boundary layers (F) are visible near thetube walls. Some particles (E) from the destroyed aluminium membrane travel with the flowlater in time. Similar flow visualisation pictures captured in 10 mm rectangular tubes arepresented in [9] were the first 37 mm downstream the membranes were blocked by thewindow frame. The region in a short distance downstream the membrane, where the mainshock wave is formed by the complex start-up of the hydrogen expansion synchronic withruptured membrane, was investigated experimentally via pressure measurements in a 18 mmtube in [8]. It can be assumed that the three-dimensional rupture of the membrane and thecomplex formation of the high speed H2-flow are responsible for a fast gas mixing in the start
4
up. Further it is observed that a minimum distance of 2 to 3 tube diameters is necessary for theformation of a relatively planar leading shock.
Fig. 2: Flow visualisation via shadow graphs in a rectangular 5 mm tube.
The process directly after the start up of the membrane rupture plays a key role for thepossibility of an ignition event due to the sudden hydrogen release into an oxidizingatmosphere. Experimental investigations of very fast and three dimensional complexprocesses in miniature scale are very difficult and there are also differences betweenrectangular and circular tubes. Optical observations from rectangular tubes can not betransferred to circular tubes. In the following study a 4 mm circular rupture disc holder wasused in all experiments. This device was also used in [5] and it is approved to ignitesuccessfully and reproducible. It can be assumed that the design of the extension tube, aconnection of several tube segments via industrial fittings, promotes and supports the ignitionevents.
3.2. Pressure dynamic in 4 mm circular tubes
The initial flow released via the opening of the leak valve (Fig. 1) into the release nozzleaccumulates first gas upstream the rupture membrane which blocks the nozzle pipe up to thepoint of the membrane rupture. Fig. 3 shows the pressure histories of a gauge located 68 mmdownstream the rupture disc for an initial bulk pressure of 200 bar and different membranethicknesses. Without membrane the pressure increase is relatively constant with time. Aruptured membrane in the flow path produces a fast increasing pressure profile inside theextension tube. The amplitudes and the arrival times increase with the thickness of the

5
membrane. But later in time the maximum pressure level (~ 60 bar) becomes equal for allexamples.
Pressure history: P1 (68 mm downstream the rupture disc);
bulk pressure P0 = 200 bar
0
10
20
30
40
50
60
0,015 0,016 0,017 0,018 0,019 0,02
t / s
P/b
ar
no membraneburst pressure 35 bar ( s = 0,1mm)burst pressure 92 bar ( s = 0,2mm)burst pressure 160 bar ( s = 0,3mm)
Fig. 3: Pressure histories in a position 68 mm downstream the rupture disc for 200 bar initialbulk pressure.
In Fig. 3 the original time scale is used which includes the pre-activation time of the fastvalve. Fig. 4 shows pressure histories of a gauge located 133 mm downstream the rupture discfor an initial release pressure of 120 bar and membranes with a burst pressure of ~ 35 bar.
0
5
10
15
20
25
30
35
40
45
50
0,0165 0,0175 0,0185 0,0195 0,0205 0,0215
t / s
P/b
ar
Test 1 (ignition)Test 2 (ignition)Test 3 (ignition)Test 4 (no ignition)Test 5 (ignition)
0
2
4
6
8
10
12
0 20 40 60 80 100 120 140
t / µs
P/
ba
r
Test 1 (ignition)Test 2 (ignition)Test 3 (ignition)Test 4 (no ignition)Test 5 (ignition)
0
1
2
3
4
8 10 12 14 16 18 20 22 24
t / µs
P/
ba
r
Test 1 (ignition)Test 2 (ignition)Test 3 (ignition)Test 4 (no ignition)Test 5 (ignition)
Zoomed pressure history P1 (133 mm downstream rupture disc):bulk pressure P0 = 120 bar, disc rupture pressure Prupture = 35 bar
A B
C
0
5
10
15
20
25
30
35
40
45
50
0,0165 0,0175 0,0185 0,0195 0,0205 0,0215
t / s
P/b
ar
Test 1 (ignition)Test 2 (ignition)Test 3 (ignition)Test 4 (no ignition)Test 5 (ignition)
0
2
4
6
8
10
12
0 20 40 60 80 100 120 140
t / µs
P/
ba
r
Test 1 (ignition)Test 2 (ignition)Test 3 (ignition)Test 4 (no ignition)Test 5 (ignition)
0
1
2
3
4
8 10 12 14 16 18 20 22 24
t / µs
P/
ba
r
Test 1 (ignition)Test 2 (ignition)Test 3 (ignition)Test 4 (no ignition)Test 5 (ignition)
Zoomed pressure history P1 (133 mm downstream rupture disc):bulk pressure P0 = 120 bar, disc rupture pressure Prupture = 35 bar
A B
C
Fig. 4: Pressure histories in a position 133 mm downstream the rupture disc for 120 bar initialrelease pressure.

6
The experiments were performed five times with the same initial conditions. The plot Fig. 4(A) shows the pressure histories of the five tests (no. 1 to no. 5) in a coarse rough time scaleup to the maximum pressure. At first the pressure rise is relative sharp to a level of ~ 10 barand later in time continually to the maximum of ~ 40 bar. All five pressure histories look verysimilar. Only in the test no. 4 no ignition event was observed. In Fig. 4 (B) the regions of thefirst sharp pressure rise are zoomed out, the first pressure jump of the sensor is set to t = 10 µsfor all experiments. This graph resolves a relative weak shock wave with amplitudes of lessthan 4 bar and a constant increase of the pressure to a level of 10 bar within a time of ~ 100µs. In this plot the pressure level of the test no. 4, which leads not to an ignition event, liesclearly below the four others. In the Fig. 4 (C) the leading shock wave is zoomed out tomicrosecond range for the five tests. As rise time of the shock wave a value of less than 2 µsis visible for all tests and the reached pressure level is more or less constant for more than14 µs. The pressure level measured in test 4 lies below the values measured in the other tests,so it can be assumed that a bad membrane is responsible for the non-ignition event in test 4.The measured shock wave velocities in these experiments lie between 814 m/s (test 4) and920 m/s (test 5) so that a flight time of 14 µs corresponds to roughly 12 mm in distance,which is three times the tube diameter.Fig. 5 shows the pressure histories for an experiment with an initial bulk pressure of 200 barand a membrane rupture pressure of 90 bar for three different locations along the 630 mmlong extension tube. The pressure history P1, measured in a distance of 129 mm downstreamthe membrane, shows qualitatively the same behaviour as the curves in Fig. 4 B. After a shockwave a pressure plateau for a short time is reached before the pressure increases again. Thepressure history P2 in a distance of 349 mm downstream the membrane shows a 1ongerduration time of the pressure plateau, which was reached after the first shock, and afterwardsthe increase of the pressure is almost linear with time. The pressure signal recorded in adistance of 590 mm downstream the membrane shows a distinct pressure plateau with aduration of more than 80 µs after the first shock. The shock wave velocities measured in thisexperiment lie at 1630 m/s between gauge P1 and P2 and at 1560 m/s between gauge P2 andP3 and the experiment lead to a jet fire. With increasing distance from the source of the shockwave the amplitude of the shock wave decreases as well, remarkable is that the secondmaximum in Fig. 5 reaches the same level independent of the location of the sensor.
Pressure histories: xtotal = 630 mm; P0 = 200 bar, Prupture ~ 90 bar; ignition
0
5
10
15
20
25
30
-10 0 10 20 30 40 50 60 70 80 90 100 110 120 130 140 150t / µs
P/b
ar
P1 (x = 129mm)
P2 (x = 349mm)
P3 (x = 590mm)
second
maximum
first shock

7
Fig. 5: Pressure histories for 200 bar initial bulk pressure in different positions downstreamthe rupture disc.
In all pressure histories measured in this study two prominent points were identified, the levelof the leading shock wave (first shock) and the level of the second compression afterwards(second maximum), as marked in Fig 5. These two characteristic pressure levels are plotted inFig. 6 left over the shock wave velocity for all experiments in this study. The shock wavevelocities correspond to the flight time of the shock wave between two gauges. The measuredfirst shock wave value increases only slowly with the increase of its velocity. The secondmaxima increase faster with the increase of the velocity. On the right side of Fig. 6 the ratiobetween the second maximum and the first shock is plotted over the shock wave velocities. Itcan be seen that with increasing shock wave velocity in the range from 400 m/s to 1000 m/sthe ratio of the prominent pressure levels decreases linearly from 12 to less than 4. For shockwave velocities above 1000 m/s the ratio is constant. This break of the slope separates theexperiments with ignition events from experiments without ignition only in one direction.Ignition events and no ignition events were observed in case of shock wave velocities below1000 m/s, but for shock wave velocities above 1000 m/s only ignition events are present.
0
5
10
15
20
25
30
35
40
45
400 600 800 1000 1200 1400 1600 1800
V (first shock) [m/s]
P/
bar
second maximum
first shock
0
2
4
6
8
10
12
400 600 800 1000 1200 1400 1600 1800
V (first shock) [m/s]
P(s
ec
on
d)/
P(f
irst)
ignition
no ignition
0
0
5
10
15
20
25
30
35
40
45
400 600 800 1000 1200 1400 1600 1800
V (first shock) [m/s]
P/
bar
second maximum
first shock
0
2
4
6
8
10
12
400 600 800 1000 1200 1400 1600 1800
V (first shock) [m/s]
P(s
ec
on
d)/
P(f
irst)
ignition
no ignition
0
Fig.6: Left, summary of the two characteristic pressure levels (first shock and secondmaximum) and shock wave velocity. Right, ratio of the two characteristic pressure levelsversus shock wave velocity.
The reason for the relative wide scattering of the data points in Fig. 6 is the wide range of tubelengths and the different sensor positions which were used in this study. A plot of the initialbulk pressure P0 or the rupture pressure P(rupture) of the membrane and the two derivedprominent points from the measured pressure histories leads to wide scattering pointdiagrams. A relative simple and reasonable correlation between the initial bulk pressure P0
and the rupture pressure P(rupture) of the membrane was found analytically by the use of theproduct of its roots. Fig. 7 shows the correlations of the amplitudes of the first shock and thesecond pressure maximum to the product of the square roots of the initial release pressure P0
and the rupture pressure P(rupture) of the membrane.

8
0
5
10
15
20
25
30
35
40
8 13 18 23 28
P0^0.5 + P(rupture)^0.5 / [bar^0.5]
P/b
ar
first shock
second maximum
Fig. 7: Correlation of the amplitudes of the first shock and the second pressure maximum tothe initial bulk pressure P0 and the rupture pressure P(rupture) of the membrane.
3.3. Flame propagation after spontaneous ignition in 4 mm circular tubes
Due to the design of the membrane holder the transparent range downstream the rupture discstarts in a distance of minimum 52 mm in all configurations. In the experiments in whichglass tubes were installed all observed ignition events took place in the first 52 mmdownstream the membrane. The picture series in Fig. 8 shows the visible flame propagation inthe extension tube (configuration as presented in Fig. 1). The bulk pressure P0 was 50 bar andthe burst pressure of the 0.1 mm membrane was ~35 bar.
0
5
10
15
20
17,97 18,07 18,17 18,27 18,37 18,47 18,57 18,67 18,77 18,87
P/b
ar
0
5
10
15
20
17,97 18,07 18,17 18,27 18,37 18,47 18,57 18,67 18,77 18,87
P/b
ar
05
101520
17,97 18,07 18,17 18,27 18,37 18,47 18,57 18,67 18,77 18,87
t / ms
P/
bar
Dis
tan
cex
=630
mm
SW
0
5
10
15
20
17,97 18,07 18,17 18,27 18,37 18,47 18,57 18,67 18,77 18,87
P/b
ar
0
5
10
15
20
17,97 18,07 18,17 18,27 18,37 18,47 18,57 18,67 18,77 18,87
P/b
ar
05
101520
17,97 18,07 18,17 18,27 18,37 18,47 18,57 18,67 18,77 18,87
t / ms
P/
bar
Dis
tan
cex
=630
mm
SW
Fig. 8: Flame propagation and pressure history (P0 = 50 bar; P(rupture) = 35 bar).
9
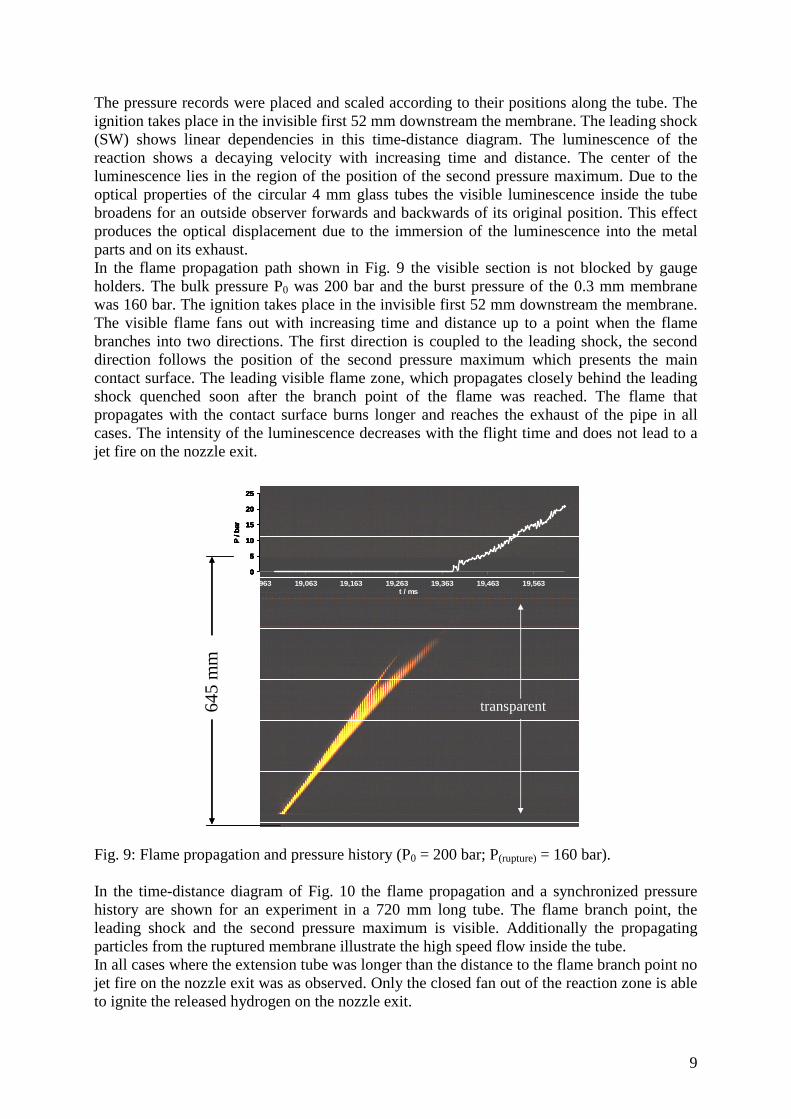
The pressure records were placed and scaled according to their positions along the tube. Theignition takes place in the invisible first 52 mm downstream the membrane. The leading shock(SW) shows linear dependencies in this time-distance diagram. The luminescence of thereaction shows a decaying velocity with increasing time and distance. The center of theluminescence lies in the region of the position of the second pressure maximum. Due to theoptical properties of the circular 4 mm glass tubes the visible luminescence inside the tubebroadens for an outside observer forwards and backwards of its original position. This effectproduces the optical displacement due to the immersion of the luminescence into the metalparts and on its exhaust.In the flame propagation path shown in Fig. 9 the visible section is not blocked by gaugeholders. The bulk pressure P0 was 200 bar and the burst pressure of the 0.3 mm membranewas 160 bar. The ignition takes place in the invisible first 52 mm downstream the membrane.The visible flame fans out with increasing time and distance up to a point when the flamebranches into two directions. The first direction is coupled to the leading shock, the seconddirection follows the position of the second pressure maximum which presents the maincontact surface. The leading visible flame zone, which propagates closely behind the leadingshock quenched soon after the branch point of the flame was reached. The flame thatpropagates with the contact surface burns longer and reaches the exhaust of the pipe in allcases. The intensity of the luminescence decreases with the flight time and does not lead to ajet fire on the nozzle exit.
0
5
10
15
20
25
18,963 19,063 19,163 19,263 19,363 19,463 19,563t / ms
P/b
ar
64
5m
m
transparent
0
5
10
15
20
25
18,963 19,063 19,163 19,263 19,363 19,463 19,563t / ms
P/b
ar
64
5m
m
transparent
0
5
10
15
20
25
18,963 19,063 19,163 19,263 19,363 19,463 19,563t / ms
P/b
ar
0
5
10
15
20
25
18,963 19,063 19,163 19,263 19,363 19,463 19,563t / ms
P/b
ar
64
5m
m
transparent
Fig. 9: Flame propagation and pressure history (P0 = 200 bar; P(rupture) = 160 bar).
In the time-distance diagram of Fig. 10 the flame propagation and a synchronized pressurehistory are shown for an experiment in a 720 mm long tube. The flame branch point, theleading shock and the second pressure maximum is visible. Additionally the propagatingparticles from the ruptured membrane illustrate the high speed flow inside the tube.In all cases where the extension tube was longer than the distance to the flame branch point nojet fire on the nozzle exit was as observed. Only the closed fan out of the reaction zone is ableto ignite the released hydrogen on the nozzle exit.

10
0
5
10
15
20
16,8 17 17,2 17,4 17,6 17,8 18 18,2 18,4 18,6 18,8
t / ms
P/
bar
720
mm
Flamebranchpoint
Membrane particles
0
5
10
15
20
16,8 17 17,2 17,4 17,6 17,8 18 18,2 18,4 18,6 18,8
t / ms
P/
bar
0
5
10
15
20
16,8 17 17,2 17,4 17,6 17,8 18 18,2 18,4 18,6 18,8
t / ms
P/
bar
720
mm
Flamebranchpoint
Membrane particles
Fig. 10: Flame propagation and pressure history (P0 = 120 bar; P(rupture) = 35 bar).
4. Discussion
The results of the pressure measurements inside the 4 mm extension tubes downstream therupture disc show non ideal shock tube behaviour. The measured pressure histories show acertain similarity with the densitometer traces presented in [7] and the pressure histories in [6]where the driver gas flow has an influence on the shock wave amplitude value. Also thepressure histories captured in a 5 mm cylindrical tube presented in [3] indicate a non idealshock tube behaviour. The circumstances that in the present study the H2 release pressure(bulk pressure) was mostly higher than the rupture resistance of the membranes supportstogether with the relatively large driver gas volume the competition of the high speed flow(contact surface) and the leading shock front. Especially in the start up phase of the membranerupture where the source of an effective gas mixing and the formation of a hot spot isexpected. For a successful self-ignition event during the sudden hydrogen release from a highpressure initial state into air the presence of a hot spot with a sufficient high temperature in anignitable mixture cloud is necessary. When a hot spot is present, it propagates fast with thehigh speed flow to the exhaust, the ignition time is limited to the residential time of the hotspot inside the extension tube downstream the rupture disc.Based on the results of the dynamic pressure measurements, with a leading shock wavefollowed by a second compression, the temperature increase in the mixing zone can beformulated as a two step procedure. At first the leading shock wave heats up the gastemperature from TU to Tsw (Eq. 1 (normal shock wave)). In the second step an adiabaticcompression from the pressure level P first shock to P second maximum increases the temperature fromTSW to the maximum temperature T max (Eq. 2).
22
22
)1(
))2)1(()2(
M
MMTT U
SW
(Eq. 1)
1
maxsecmax
firstshock
imumondSW
P
PTT (Eq. 2)

11
Where γ is the ratio of specific heat; M is the Mach number (air); TU is the ambienttemperature; Tsw is the temperature reached behind the first shock; T max is the maximumtemperature; P first shock is the pressure level of the first shock and P second maximum is the pressurelevel of the second maximum.In Fig. 11 the calculated maximum temperatures T max using Eq. 1 and Eq. 2 are plotted overthe residential time of the shock wave in the extension tube for the experiments in this workand previous measurement data [5]. To derive the necessary data from [5] the correlations inFig. 6 and Fig. 7 were used. Additionally calculated values of ignition delay times vs.temperatures for H2/air-mixtures are plotted with a time shift of 10 µs in the diagram. Theinitial conditions for the calculations using Cantera code [10] with Lutz mechanism [11] were1 bar and 20 ° C.
0
500
1000
1500
2000
2500
10 100 1000 10000
residential time of the shock wave in the tube / µs
T/
°C
ignition (this work)
failed ignition (this work)
no ignition (this work)
ignition: [5] (Grune et al 2011)
no ignition: [5] (Grune et al 2011)
flame branch point
Ignition delay time (calculated [10])
Fig. 11: Summarized mapping of the experimental results from different tube lengths,membrane thicknesses and initial bulk pressures and calculated ignition delay time.
Fig. 11 summarizes the experimental results from different tube lengths, membranethicknesses and initial bulk pressures. All ignition events are located above the calculated andtime shifted (+ 10 µs) ignition delay time. A minimum residential time of ~ 18 µs for theshock wave in the extension tube is necessary to ignite the mixture, for a wave velocity of1500 m/s a tube length of 27 mm is necessary to form the conditions for an ignition event. Forlonger tubes (longer residential times of the shock wave) the possibility for a failed ignitionon the nozzle exhaust is present. The time when the flame branch point inside the extensiontube is reached (black points) separates the ignition events with resulting jet fire from thecases without a resulting jet fire (failed ignition).The summarized mapping of the experimental results shows all important boundaries for theself-ignition in the studied case. Minimum lengths of the extension tube to form the importantconditions (gas mixing and formation of the shock wave) for an ignition are required as wellas a minimum temperature increases to ignite the mixture. Additionally a separation line ofself-ignition events with jet fire (ignition) or no jet fire (failed ignition) on the nozzle exhaustis plotted.

12
5. Conclusions
This work presents an experimental investigation of the pressure dynamic in 4 mm circularextension tubes downstream a rupture disc in combination with the visualisation of thereacting zone in case of a spontaneous ignition due to the sudden release of pressurisedhydrogen into atmospheric air.A spontaneous ignition due to the sudden release of pressurized hydrogen into atmospheric airwas observed for a H2 release overpressure of 30 bar in combination with a membrane(rupture pressure of 24 bar) inside a 645 mm long extension tube. In a shorter extension tube(42 mm) the limit for an ignition was found to be 25 bar [5]. All ignition events observed inthe present study were initiated in the first 52 mm downstream the rupture membrane. Theflame fans out with increasing distance of the flow in the nozzle exhaust direction. In longtubes a branching of the flame fan out in two directions was observed, the first direction iscoupled to the leading shock, the second direction follows the position of the main contactsurface. If the extension tube is longer than the position where the point of the flamebranching takes place no jet fire on the nozzle exit was observed.The pressure histories measured inside the extension tubes downstream of the rupturemembrane show non ideal shock tube characteristics. Two prominent points were identified,the level of the leading shock wave (first shock) and the level of the second compressionafterwards (second maximum). Temperature increase by the first shock wave followed byadiabatic compression, demonstrates the possibility for a successful self-ignition event duringthe sudden hydrogen release from a high pressure initial state into air for the describedminiature open end shock tube.
References
[1] Wolanski P, Wojcicki S. Investigation into the mechanism of the diffusion ignitron of acombustible gas flowing into an oxidizing atmosphere. In: Proc 14th Comb Symp; 1973. pp.1217-1223.
[2] Dryer FL, Chaos M, Zhao Z, Stein JN, Alpert JY, Homer CJ. Spontaneous ignition ofpressurized releases of hydrogen and natural gas into air. Comb Sci Techn 2007;179:663-694.
[3] Golub VV., Baklanov DI., Golovastov SV., Ivanov MF., Laskin .IN, Saveliev AS., et al.Mechanisms of high-pressure hydrogen gas self-ignition in tubes. Journal of Loss Prevention inthe Process Industries 2008; 21(2):185-198.
[4] Mogi T., Kim D., Shiina H., Horiguchi S., Self-ignition and explosion during discharge of high-pressure hydrogen. Journa lof Loss Prevention in the Process Industries2008;21 (2):199-204.
[5] J. Grune, M. Kuznetsov, K. Sempert, T. Jordan, Experimental study of ignited unsteadyhydrogen releases from a high pressure reservoir. Proceedings to the 4th InternationalConference of Hydrogen Safety, San Francisco, USA, 2011, pp. 132–7A3.
[6] M. Brouillette, Shock waves at microscales, Shock Waves (2003) 13: 3–12.[7] Russell E. Duff, ShockTube Performance at Low Initial Pressure, Phys. Fluids 2, 207
(1959).[8] S. Golovastov, V. Bocharnikov, The influence of diaphragm rupture rate on
spontaneous selfignition of pressurized hydrogen: Experimental investigation.International journal of hydrogen energy 37 (2012) 10956-10962
[9] Y.R. Kim, H.J. Lee, S. Kim, I.S. Jeung A flow visualization study on self-ignition of highpressure hydrogen gas released into a tube Proc Combust Inst (2012)
[10]Goodwin, D.G., Cantera User’s Guide, California Institute of Technology, Pasadena, CA,November, 2001
[11]Lutz, A.E., Sandia Report SAND88-8228 (1988).
K.A. Bhaskaran, M.C. Gupta, T. Just, Combust. Flame 21 (1973) 45–48.