Experimental investigation and performance analysis of a mini-type solar absorption cooling system
11
Experimental investigation and performance analysis of a mini-type solar absorption cooling system Y.L. Yin, X.Q. Zhai * , R.Z. Wang Institute of Refrigeration and Cryogenics, Shanghai Jiao Tong University, 1954 Huashan Road, Shanghai 200240, China highlights The energy step utilization improved the performance of a solar cooling system. Thermal environment of Class A was achieved by using radiant cooling. Solar radiation intensity has prominent impact on the solar cooling system. article info Article history: Received 31 October 2012 Accepted 24 May 2013 Available online 3 June 2013 Keywords: Solar energy Absorption cooling Performance analysis Energy stepped utilization abstract A mini-type solar-powered absorption cooling system with a cooling capacity of 8 kW was designed. Lithium bromide-water was used as the working pairs of the chiller. Solar collectors with an area of 96 m 2 were installed. A water storage tank with a volume of 3 m 3 was used to store the hot water from the solar collectors. The experimental results showed that the average values of PMV (Predicted Mean Vote) and PPD (Predicted Percentage of Dissatisfied) of the test room were 0.22 and 5.89, respectively. Taking the average value of PMV and PPD into consideration, the solar cooling system could meet the indoor thermal comfort demand with the comfort level of A. The power consumption was reduced by 43.5% after introducing the stepped utilization of energy into the air handling unit. Meanwhile, a theoretical model was established based on Matlab to predict the variations of the system performance with ambient parameters. It is shown that the solar radiation intensity has a greater impact on the performance of the solar powered absorption cooling system compared with the ambient temperature. It is also shown that the indoor air temperature goes down with the increase of the solar radiation intensity as well as the decrease of the ambient temperature. Ó 2013 Elsevier Ltd. All rights reserved. 1. Introduction There is a rapid increase in the electricity consumption around the world. The global environment has been deteriorating due to the utilization of fossil fuel and the employment of CFCs fluid in conventional refrigeration systems. The use of solar energy in buildings greatly reduces the consumption of fossil fuel and harmful emissions to the environment [1]. As a promising tech- nology, solar cooling systems have been paid more and more attention to. Lithium bromide-water absorption chillers are most commonly used in solar cooling systems, because they are readily available commercial equipments [2]. In recent years, different strategies of cooling technologies powered by renewable energy have been widely presented, particularly in Europe, USA and China [3e5]. Malkamäki et al. [3] analyzed a hybrid solar and hydro (SHE) system that provided continuous electric power and energy supply to its consumers. Besides, the possibility of its implementation in Europe and other areas with the similar climate was also analyzed. The results clearly showed a wide range of implementation of the SHE sys- tem. Otanicar et al. [4] described a technical and economic comparison of existing solar cooling approaches including both thermal driven and electrical driven systems. The initial costs of these technologies, including the projections of the future cost of solar electric and solar thermal systems, were compared. The results showed that the cost of the solar electric cooling system was highly dependent on the system COP. The cost of the solar collection only accounted for a small part in the total cost of the solar thermal cooling system, however, the cost of the refriger- ation unit often bulked up into a considerable sum if the PV price remained at current level. It could be expected that the solar thermal cooling would be competitive with the solar electric * Corresponding author. Tel./fax: þ86 21 34206296. E-mail address: [email protected] (X.Q. Zhai). Contents lists available at SciVerse ScienceDirect Applied Thermal Engineering journal homepage: www.elsevier.com/locate/apthermeng 1359-4311/$ e see front matter Ó 2013 Elsevier Ltd. All rights reserved. http://dx.doi.org/10.1016/j.applthermaleng.2013.05.040 Applied Thermal Engineering 59 (2013) 267e277
Transcript of Experimental investigation and performance analysis of a mini-type solar absorption cooling system
at SciVerse ScienceDirect
Applied Thermal Engineering 59 (2013) 267e277
Contents lists available
Applied Thermal Engineering
journal homepage: www.elsevier .com/locate/apthermeng
Experimental investigation and performance analysis of a mini-typesolar absorption cooling system
Y.L. Yin, X.Q. Zhai*, R.Z. WangInstitute of Refrigeration and Cryogenics, Shanghai Jiao Tong University, 1954 Huashan Road, Shanghai 200240, China
h i g h l i g h t s
� The energy step utilization improved the performance of a solar cooling system.� Thermal environment of Class A was achieved by using radiant cooling.� Solar radiation intensity has prominent impact on the solar cooling system.
a r t i c l e i n f o
Article history:Received 31 October 2012Accepted 24 May 2013Available online 3 June 2013
Keywords:Solar energyAbsorption coolingPerformance analysisEnergy stepped utilization
* Corresponding author. Tel./fax: þ86 21 34206296E-mail address: [email protected] (X.Q. Zhai).
1359-4311/$ e see front matter � 2013 Elsevier Ltd.http://dx.doi.org/10.1016/j.applthermaleng.2013.05.04
a b s t r a c t
A mini-type solar-powered absorption cooling system with a cooling capacity of 8 kW was designed.Lithium bromide-water was used as the working pairs of the chiller. Solar collectors with an area of96 m2 were installed. A water storage tank with a volume of 3 m3 was used to store the hot water fromthe solar collectors. The experimental results showed that the average values of PMV (Predicted MeanVote) and PPD (Predicted Percentage of Dissatisfied) of the test room were 0.22 and 5.89, respectively.Taking the average value of PMV and PPD into consideration, the solar cooling system could meet theindoor thermal comfort demand with the comfort level of A. The power consumption was reduced by43.5% after introducing the stepped utilization of energy into the air handling unit. Meanwhile, atheoretical model was established based on Matlab to predict the variations of the system performancewith ambient parameters. It is shown that the solar radiation intensity has a greater impact on theperformance of the solar powered absorption cooling system compared with the ambient temperature. Itis also shown that the indoor air temperature goes downwith the increase of the solar radiation intensityas well as the decrease of the ambient temperature.
� 2013 Elsevier Ltd. All rights reserved.
1. Introduction
There is a rapid increase in the electricity consumption aroundthe world. The global environment has been deteriorating due tothe utilization of fossil fuel and the employment of CFCs fluid inconventional refrigeration systems. The use of solar energy inbuildings greatly reduces the consumption of fossil fuel andharmful emissions to the environment [1]. As a promising tech-nology, solar cooling systems have been paid more and moreattention to. Lithium bromide-water absorption chillers are mostcommonly used in solar cooling systems, because they are readilyavailable commercial equipments [2].
In recent years, different strategies of cooling technologiespowered by renewable energy have been widely presented,
.
All rights reserved.0
particularly in Europe, USA and China [3e5]. Malkamäki et al. [3]analyzed a hybrid solar and hydro (SHE) system that providedcontinuous electric power and energy supply to its consumers.Besides, the possibility of its implementation in Europe and otherareas with the similar climate was also analyzed. The resultsclearly showed a wide range of implementation of the SHE sys-tem. Otanicar et al. [4] described a technical and economiccomparison of existing solar cooling approaches including boththermal driven and electrical driven systems. The initial costs ofthese technologies, including the projections of the future cost ofsolar electric and solar thermal systems, were compared. Theresults showed that the cost of the solar electric cooling systemwas highly dependent on the system COP. The cost of the solarcollection only accounted for a small part in the total cost of thesolar thermal cooling system, however, the cost of the refriger-ation unit often bulked up into a considerable sum if the PV priceremained at current level. It could be expected that the solarthermal cooling would be competitive with the solar electric
Nomenclature
A area (m2)CL cooling loadCOP coefficient of performanceCOPsystemCOP of the systemCp specific heat (J/(kg K))d humidity (g/kg)D duration of the operation (s)D0 total humidity (g)i enthalpy (kJ/kg)I solar radiation intensity (W/m2)M mass flow rate (kg/s)n number of peoplePPD predicted percentage dissatisfiedPMV predicted mean voteQ energy (kW)T temperature (�C)U thermal conductivity (W/m �C)V volume (m3)r density (kg/m3)
Greek symbolsh efficiencyF ratio of latent to total cooling load
Subscriptsa ambient
c collectorcap cooling capacitycc cooling ceilingch chillerco coolingd devicee envelopeev evaporatorf air infiltrationfa fresh airfad fresh air deviceg generatorhot hot wateri inletl cooling loadL thermal load on the bodylatent latent cooling loadM metabolic rateo outletp peopler rooms systemsensible sensible cooling loadsu supply airsave energy savingta tank
Y.L. Yin et al. / Applied Thermal Engineering 59 (2013) 267e277268
cooling with respect to the cost, if the cost of the refrigerationunit decreased and the thermal refrigeration COP increased. Zhaiet al. [5] reviewed the existing theoretical and experimental in-vestigations of solar single-effect absorption cooling systems aswell as some new design options with regard to solar collectors,auxiliary energy systems and cooling modes. Besides, some re-views were found to demonstrate the feasibility of application ofsolar cooling technologies in buildings [6,7]. There are also somedemonstration projects that have been set up to study theoperation characteristics of solar cooling systems [8,9]. Bermejoet al. [8] tested a solar/gas cooling plant in Spain during theperiod 2008e2009. A LiBr/water absorption chiller with 174 kWcooling capacity was powered by a linear concentrating Fresnelcollector or a direct-fired natural gas burner. The experimentalresults showed that the solar fraction was 0.75. Gebreslassie et al.[9] presented a systematic method for reducing the life cycleimpact of cooling applications. The method relies on formulatinga bi-criteria MINLP (mixed-integer nonlinear programming)problem that accounts for the minimization of the total cost andenvironmental impact of solar assisted absorption cooling cycles.The results showed that the significant reductions in the envi-ronmental impact could be achieved if the decision-maker waswilling to invest on a solar collector subsystem. Besides, the re-ductions could be attained by increasing the number of thecollectors installed, which increased the solar fraction of thecooling system. It was also shown that the type of collectorsshould be selected depended on the particular operating condi-tions and weather data. Al-Alili [10] studied the feasibility of asolar absorption cooling system under Abu Dhabi’s weatherconditions. The results showed that solar cooling was attractivebecause it was capable of saving electricity by 47% comparedwith vapor-compression cooling systems with the same coolingcapacity. Fong [11] showed different styles of solar collectors for
use in sub-tropical regions like Hong Kong, and suggested thatthe use of building-integrated solar collectors in solar coolingsystems should be considered depending on the buildingsituations.
It is found that the efficiency of a solar cooling system isgenerally lower than that of a conventional electric cooling system,which becomes a significant hinder for the popularity of solarcooling systems. Therefore, some new strategies were studied toimprove the system performance. Calise [12] simulated differentsolar cooling systems to seek proper operation parameters for thepurpose of maximizing the COP of solar cooling systems. Venegas[13] presented the influence of operational variables on the systemperformance. The results showed that the most important variablethat influenced the daily solar COP was the amount of the collectedsolar energy.
There are also some researches based on filed investigations[14e18]. Fong [14] reported a solar hybrid cooling system oper-ating in a hot and humid climate. The system consisted of a solarpowered absorption chiller system which was used to handle thesensible load, and a desiccant dehumidification wheel systemwhich was employed to remove the latent load. It was shownthat the annual primary energy consumption of the solar hybridcooling system was lower than that of a conventional vaporcompression refrigeration system by 36.5%. Ali [15] presented theperformance of an integrated cooling plant including both a freecooling system and a solar powered single-effect LiBr/water ab-sorption chiller. The system was in operation during a five years’period from 2002 to 2007 in Germany. It was indicated that thefree cooling system in some cooling months could providecooling consumption up to 70% while it was about 25% during allthe five years operation. Besides, the monthly average value ofsolar heat fraction varied from 31.1% to 100% with the averagevalue during the five years of about 60%. Bermejo [16] tested a
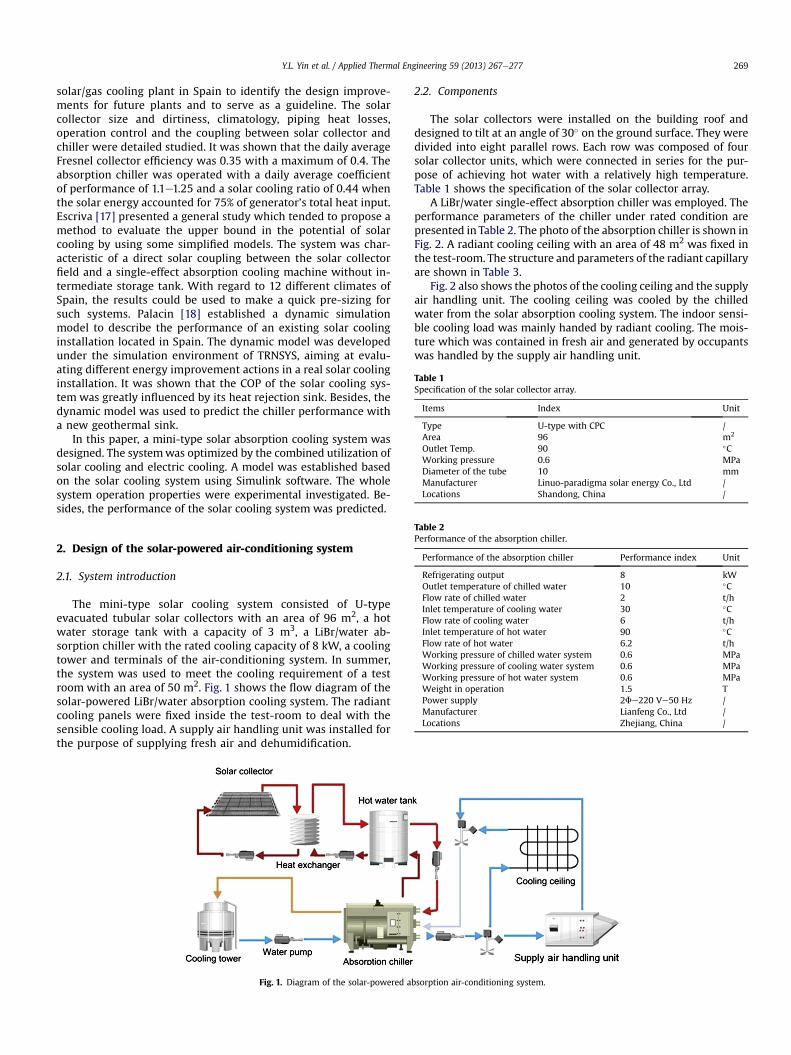
Table 1Specification of the solar collector array.
Items Index Unit
Type U-type with CPC /Area 96 m2
Outlet Temp. 90 �CWorking pressure 0.6 MPaDiameter of the tube 10 mmManufacturer Linuo-paradigma solar energy Co., Ltd /Locations Shandong, China /
Y.L. Yin et al. / Applied Thermal Engineering 59 (2013) 267e277 269
solar/gas cooling plant in Spain to identify the design improve-ments for future plants and to serve as a guideline. The solarcollector size and dirtiness, climatology, piping heat losses,operation control and the coupling between solar collector andchiller were detailed studied. It was shown that the daily averageFresnel collector efficiency was 0.35 with a maximum of 0.4. Theabsorption chiller was operated with a daily average coefficientof performance of 1.1e1.25 and a solar cooling ratio of 0.44 whenthe solar energy accounted for 75% of generator’s total heat input.Escriva [17] presented a general study which tended to propose amethod to evaluate the upper bound in the potential of solarcooling by using some simplified models. The system was char-acteristic of a direct solar coupling between the solar collectorfield and a single-effect absorption cooling machine without in-termediate storage tank. With regard to 12 different climates ofSpain, the results could be used to make a quick pre-sizing forsuch systems. Palacin [18] established a dynamic simulationmodel to describe the performance of an existing solar coolinginstallation located in Spain. The dynamic model was developedunder the simulation environment of TRNSYS, aiming at evalu-ating different energy improvement actions in a real solar coolinginstallation. It was shown that the COP of the solar cooling sys-tem was greatly influenced by its heat rejection sink. Besides, thedynamic model was used to predict the chiller performance witha new geothermal sink.
In this paper, a mini-type solar absorption cooling system wasdesigned. The systemwas optimized by the combined utilization ofsolar cooling and electric cooling. A model was established basedon the solar cooling system using Simulink software. The wholesystem operation properties were experimental investigated. Be-sides, the performance of the solar cooling system was predicted.
Table 2Performance of the absorption chiller.
Performance of the absorption chiller Performance index Unit
Refrigerating output 8 kWOutlet temperature of chilled water 10 �CFlow rate of chilled water 2 t/hInlet temperature of cooling water 30 �CFlow rate of cooling water 6 t/hInlet temperature of hot water 90 �CFlow rate of hot water 6.2 t/hWorking pressure of chilled water system 0.6 MPaWorking pressure of cooling water system 0.6 MPaWorking pressure of hot water system 0.6 MPaWeight in operation 1.5 TPower supply 2Fe220 Ve50 Hz /Manufacturer Lianfeng Co., Ltd /Locations Zhejiang, China /
2. Design of the solar-powered air-conditioning system
2.1. System introduction
The mini-type solar cooling system consisted of U-typeevacuated tubular solar collectors with an area of 96 m2, a hotwater storage tank with a capacity of 3 m3, a LiBr/water ab-sorption chiller with the rated cooling capacity of 8 kW, a coolingtower and terminals of the air-conditioning system. In summer,the system was used to meet the cooling requirement of a testroom with an area of 50 m2. Fig. 1 shows the flow diagram of thesolar-powered LiBr/water absorption cooling system. The radiantcooling panels were fixed inside the test-room to deal with thesensible cooling load. A supply air handling unit was installed forthe purpose of supplying fresh air and dehumidification.
Fig. 1. Diagram of the solar-powered a
2.2. Components
The solar collectors were installed on the building roof anddesigned to tilt at an angle of 30� on the ground surface. They weredivided into eight parallel rows. Each row was composed of foursolar collector units, which were connected in series for the pur-pose of achieving hot water with a relatively high temperature.Table 1 shows the specification of the solar collector array.
A LiBr/water single-effect absorption chiller was employed. Theperformance parameters of the chiller under rated condition arepresented in Table 2. The photo of the absorption chiller is shown inFig. 2. A radiant cooling ceiling with an area of 48 m2 was fixed inthe test-room. The structure and parameters of the radiant capillaryare shown in Table 3.
Fig. 2 also shows the photos of the cooling ceiling and the supplyair handling unit. The cooling ceiling was cooled by the chilledwater from the solar absorption cooling system. The indoor sensi-ble cooling load was mainly handed by radiant cooling. The mois-ture which was contained in fresh air and generated by occupantswas handled by the supply air handling unit.
bsorption air-conditioning system.
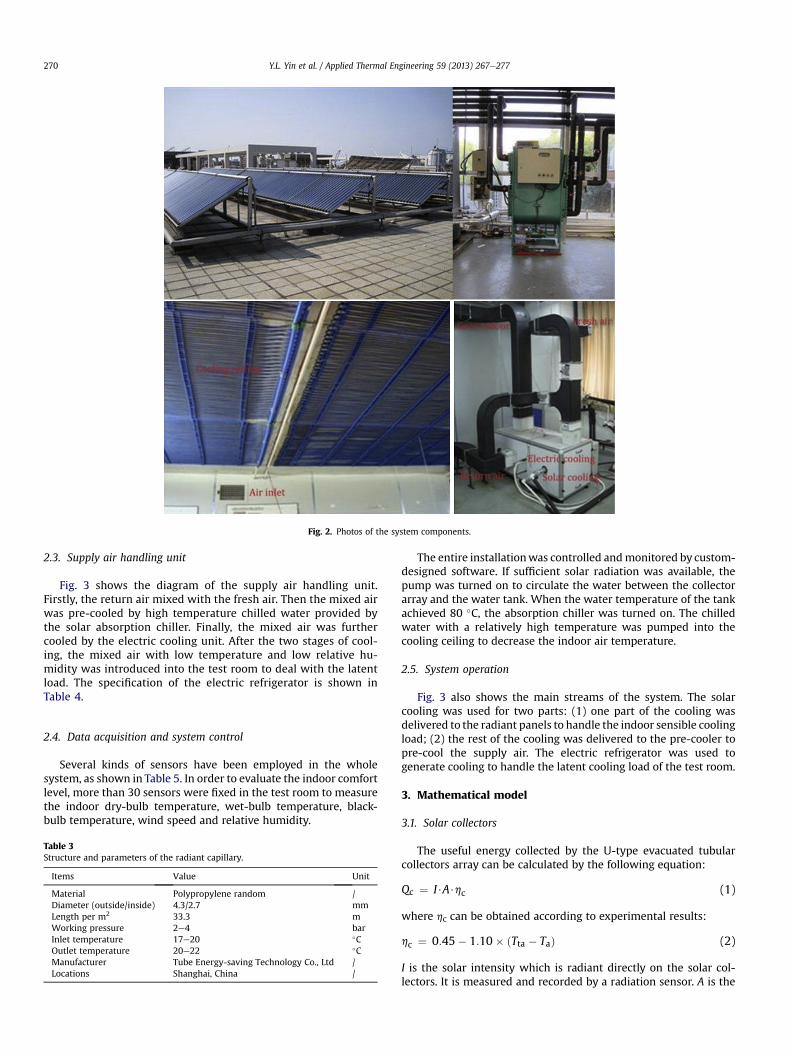
Fig. 2. Photos of the system components.
Y.L. Yin et al. / Applied Thermal Engineering 59 (2013) 267e277270
2.3. Supply air handling unit
Fig. 3 shows the diagram of the supply air handling unit.Firstly, the return air mixed with the fresh air. Then the mixed airwas pre-cooled by high temperature chilled water provided bythe solar absorption chiller. Finally, the mixed air was furthercooled by the electric cooling unit. After the two stages of cool-ing, the mixed air with low temperature and low relative hu-midity was introduced into the test room to deal with the latentload. The specification of the electric refrigerator is shown inTable 4.
2.4. Data acquisition and system control
Several kinds of sensors have been employed in the wholesystem, as shown in Table 5. In order to evaluate the indoor comfortlevel, more than 30 sensors were fixed in the test room to measurethe indoor dry-bulb temperature, wet-bulb temperature, black-bulb temperature, wind speed and relative humidity.
Table 3Structure and parameters of the radiant capillary.
Items Value Unit
Material Polypropylene random /Diameter (outside/inside) 4.3/2.7 mmLength per m2 33.3 mWorking pressure 2e4 barInlet temperature 17e20 �COutlet temperature 20e22 �CManufacturer Tube Energy-saving Technology Co., Ltd /Locations Shanghai, China /
The entire installationwas controlled andmonitored by custom-designed software. If sufficient solar radiation was available, thepump was turned on to circulate the water between the collectorarray and the water tank. When the water temperature of the tankachieved 80 �C, the absorption chiller was turned on. The chilledwater with a relatively high temperature was pumped into thecooling ceiling to decrease the indoor air temperature.
2.5. System operation
Fig. 3 also shows the main streams of the system. The solarcooling was used for two parts: (1) one part of the cooling wasdelivered to the radiant panels to handle the indoor sensible coolingload; (2) the rest of the cooling was delivered to the pre-cooler topre-cool the supply air. The electric refrigerator was used togenerate cooling to handle the latent cooling load of the test room.
3. Mathematical model
3.1. Solar collectors
The useful energy collected by the U-type evacuated tubularcollectors array can be calculated by the following equation:
Qc ¼ I$A$hc (1)
where hc can be obtained according to experimental results:
hc ¼ 0:45� 1:10� ðTta � TaÞ (2)
I is the solar intensity which is radiant directly on the solar col-lectors. It is measured and recorded by a radiation sensor. A is the
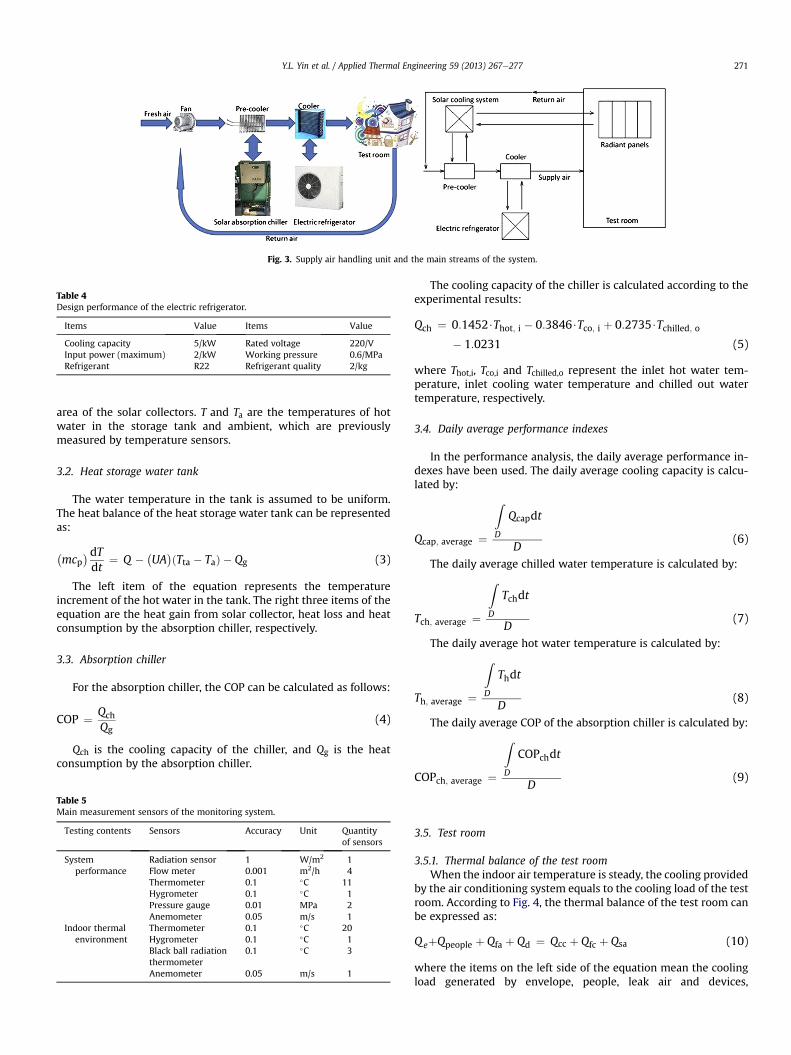
Fig. 3. Supply air handling unit and the main streams of the system.
Table 4Design performance of the electric refrigerator.
Items Value Items Value
Cooling capacity 5/kW Rated voltage 220/VInput power (maximum) 2/kW Working pressure 0.6/MPaRefrigerant R22 Refrigerant quality 2/kg
Y.L. Yin et al. / Applied Thermal Engineering 59 (2013) 267e277 271
area of the solar collectors. T and Ta are the temperatures of hotwater in the storage tank and ambient, which are previouslymeasured by temperature sensors.
3.2. Heat storage water tank
The water temperature in the tank is assumed to be uniform.The heat balance of the heat storage water tank can be representedas:
�mcp
�dTdt
¼ Q � �UA
�ðTta � TaÞ � Qg (3)
The left item of the equation represents the temperatureincrement of the hot water in the tank. The right three items of theequation are the heat gain from solar collector, heat loss and heatconsumption by the absorption chiller, respectively.
3.3. Absorption chiller
For the absorption chiller, the COP can be calculated as follows:
COP ¼ QchQg
(4)
Qch is the cooling capacity of the chiller, and Qg is the heatconsumption by the absorption chiller.
Table 5Main measurement sensors of the monitoring system.
Testing contents Sensors Accuracy Unit Quantityof sensors
Systemperformance
Radiation sensor 1 W/m2 1Flow meter 0.001 m2/h 4Thermometer 0.1 �C 11Hygrometer 0.1 �C 1Pressure gauge 0.01 MPa 2Anemometer 0.05 m/s 1
Indoor thermalenvironment
Thermometer 0.1 �C 20Hygrometer 0.1 �C 1Black ball radiationthermometer
0.1 �C 3
Anemometer 0.05 m/s 1
The cooling capacity of the chiller is calculated according to theexperimental results:
Qch ¼ 0:1452$Thot; i � 0:3846$Tco; i þ 0:2735$Tchilled; o� 1:0231 (5)
where Thot,i, Tco,i and Tchilled,o represent the inlet hot water tem-perature, inlet cooling water temperature and chilled out watertemperature, respectively.
3.4. Daily average performance indexes
In the performance analysis, the daily average performance in-dexes have been used. The daily average cooling capacity is calcu-lated by:
Qcap; average ¼
Z
D
Qcapdt
D(6)
The daily average chilled water temperature is calculated by:
Tch; average ¼
Z
D
Tchdt
D(7)
The daily average hot water temperature is calculated by:
Th; average ¼
Z
D
Thdt
D(8)
The daily average COP of the absorption chiller is calculated by:
COPch; average ¼
Z
D
COPchdt
D(9)
3.5. Test room
3.5.1. Thermal balance of the test roomWhen the indoor air temperature is steady, the cooling provided
by the air conditioning system equals to the cooling load of the testroom. According to Fig. 4, the thermal balance of the test room canbe expressed as:
QeþQpeople þ Qfa þ Qd ¼ Qcc þ Qfc þ Qsa (10)
where the items on the left side of the equation mean the coolingload generated by envelope, people, leak air and devices,
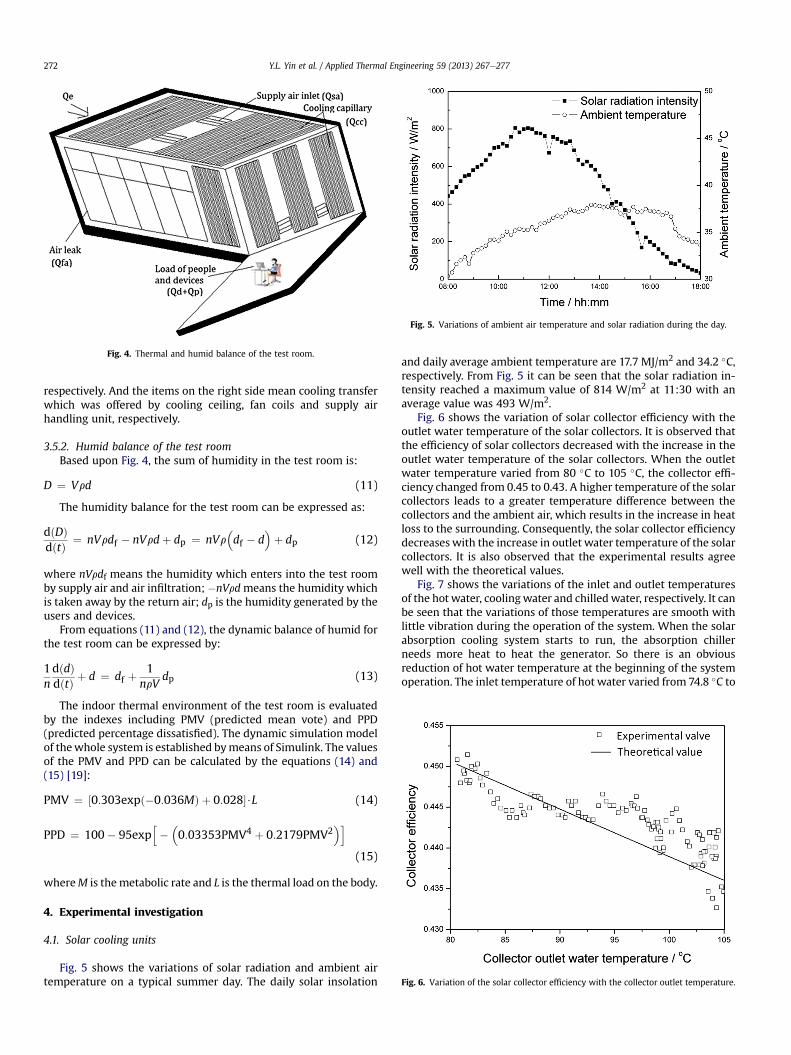
Fig. 4. Thermal and humid balance of the test room.
Fig. 5. Variations of ambient air temperature and solar radiation during the day.
Fig. 6. Variation of the solar collector efficiency with the collector outlet temperature.
Y.L. Yin et al. / Applied Thermal Engineering 59 (2013) 267e277272
respectively. And the items on the right side mean cooling transferwhich was offered by cooling ceiling, fan coils and supply airhandling unit, respectively.
3.5.2. Humid balance of the test roomBased upon Fig. 4, the sum of humidity in the test room is:
D ¼ Vrd (11)
The humidity balance for the test room can be expressed as:
dðDÞdðtÞ ¼ nVrdf � nVrdþ dp ¼ nVr
�df � d
�þ dp (12)
where nVrdf means the humidity which enters into the test roomby supply air and air infiltration; �nVrdmeans the humidity whichis taken away by the return air; dp is the humidity generated by theusers and devices.
From equations (11) and (12), the dynamic balance of humid forthe test room can be expressed by:
1ndðdÞdðtÞ þ d ¼ df þ
1nrV
dp (13)
The indoor thermal environment of the test room is evaluatedby the indexes including PMV (predicted mean vote) and PPD(predicted percentage dissatisfied). The dynamic simulation modelof thewhole system is established bymeans of Simulink. The valuesof the PMV and PPD can be calculated by the equations (14) and(15) [19]:
PMV ¼ ½0:303expð�0:036MÞ þ 0:028�$L (14)
PPD ¼ 100� 95exph��0:03353PMV4 þ 0:2179PMV2
�i
(15)
whereM is the metabolic rate and L is the thermal load on the body.
4. Experimental investigation
4.1. Solar cooling units
Fig. 5 shows the variations of solar radiation and ambient airtemperature on a typical summer day. The daily solar insolation
and daily average ambient temperature are 17.7 MJ/m2 and 34.2 �C,respectively. From Fig. 5 it can be seen that the solar radiation in-tensity reached a maximum value of 814 W/m2 at 11:30 with anaverage value was 493 W/m2.
Fig. 6 shows the variation of solar collector efficiency with theoutlet water temperature of the solar collectors. It is observed thatthe efficiency of solar collectors decreased with the increase in theoutlet water temperature of the solar collectors. When the outletwater temperature varied from 80 �C to 105 �C, the collector effi-ciency changed from 0.45 to 0.43. A higher temperature of the solarcollectors leads to a greater temperature difference between thecollectors and the ambient air, which results in the increase in heatloss to the surrounding. Consequently, the solar collector efficiencydecreases with the increase in outlet water temperature of the solarcollectors. It is also observed that the experimental results agreewell with the theoretical values.
Fig. 7 shows the variations of the inlet and outlet temperaturesof the hot water, coolingwater and chilledwater, respectively. It canbe seen that the variations of those temperatures are smooth withlittle vibration during the operation of the system. When the solarabsorption cooling system starts to run, the absorption chillerneeds more heat to heat the generator. So there is an obviousreduction of hot water temperature at the beginning of the systemoperation. The inlet temperature of hot water varied from 74.8 �C to
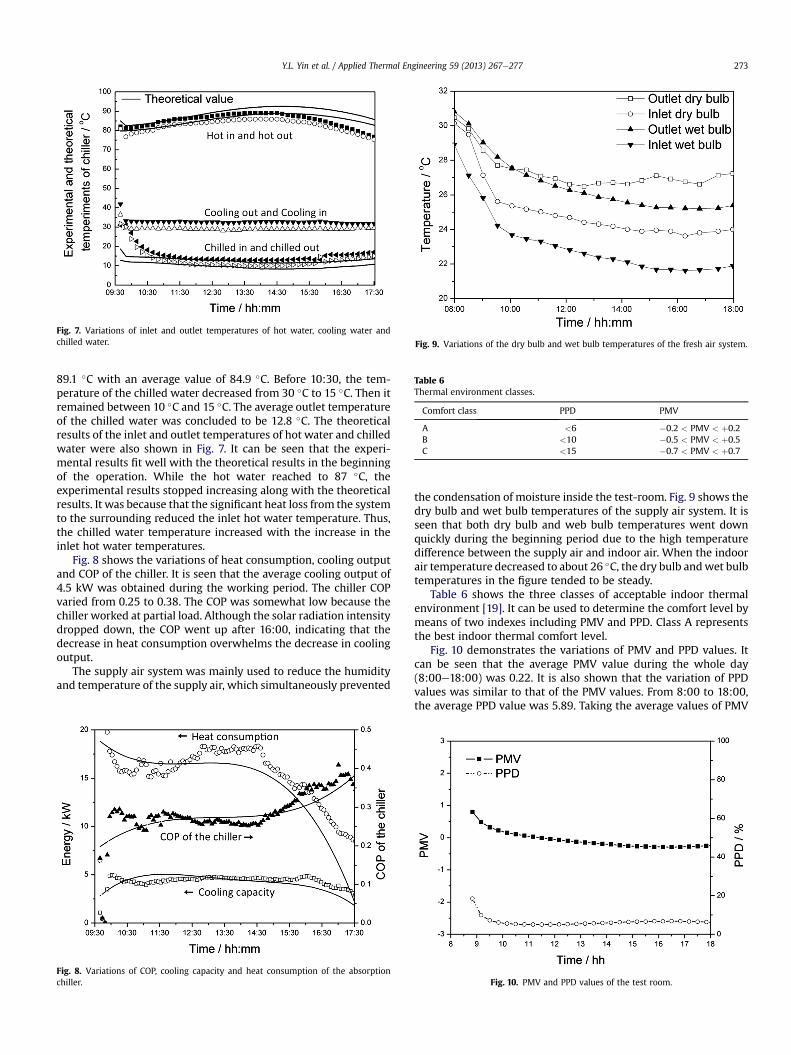
Fig. 7. Variations of inlet and outlet temperatures of hot water, cooling water andchilled water. Fig. 9. Variations of the dry bulb and wet bulb temperatures of the fresh air system.
Table 6Thermal environment classes.
Comfort class PPD PMV
A <6 �0.2 < PMV < þ0.2B <10 �0.5 < PMV < þ0.5C <15 �0.7 < PMV < þ0.7
Y.L. Yin et al. / Applied Thermal Engineering 59 (2013) 267e277 273
89.1 �C with an average value of 84.9 �C. Before 10:30, the tem-perature of the chilled water decreased from 30 �C to 15 �C. Then itremained between 10 �C and 15 �C. The average outlet temperatureof the chilled water was concluded to be 12.8 �C. The theoreticalresults of the inlet and outlet temperatures of hot water and chilledwater were also shown in Fig. 7. It can be seen that the experi-mental results fit well with the theoretical results in the beginningof the operation. While the hot water reached to 87 �C, theexperimental results stopped increasing along with the theoreticalresults. It was because that the significant heat loss from the systemto the surrounding reduced the inlet hot water temperature. Thus,the chilled water temperature increased with the increase in theinlet hot water temperatures.
Fig. 8 shows the variations of heat consumption, cooling outputand COP of the chiller. It is seen that the average cooling output of4.5 kW was obtained during the working period. The chiller COPvaried from 0.25 to 0.38. The COP was somewhat low because thechiller worked at partial load. Although the solar radiation intensitydropped down, the COP went up after 16:00, indicating that thedecrease in heat consumption overwhelms the decrease in coolingoutput.
The supply air system was mainly used to reduce the humidityand temperature of the supply air, which simultaneously prevented
Fig. 8. Variations of COP, cooling capacity and heat consumption of the absorptionchiller.
the condensation of moisture inside the test-room. Fig. 9 shows thedry bulb and wet bulb temperatures of the supply air system. It isseen that both dry bulb and web bulb temperatures went downquickly during the beginning period due to the high temperaturedifference between the supply air and indoor air. When the indoorair temperature decreased to about 26 �C, the dry bulb andwet bulbtemperatures in the figure tended to be steady.
Table 6 shows the three classes of acceptable indoor thermalenvironment [19]. It can be used to determine the comfort level bymeans of two indexes including PMV and PPD. Class A representsthe best indoor thermal comfort level.
Fig. 10 demonstrates the variations of PMV and PPD values. Itcan be seen that the average PMV value during the whole day(8:00e18:00) was 0.22. It is also shown that the variation of PPDvalues was similar to that of the PMV values. From 8:00 to 18:00,the average PPD value was 5.89. Taking the average values of PMV
Fig. 10. PMV and PPD values of the test room.
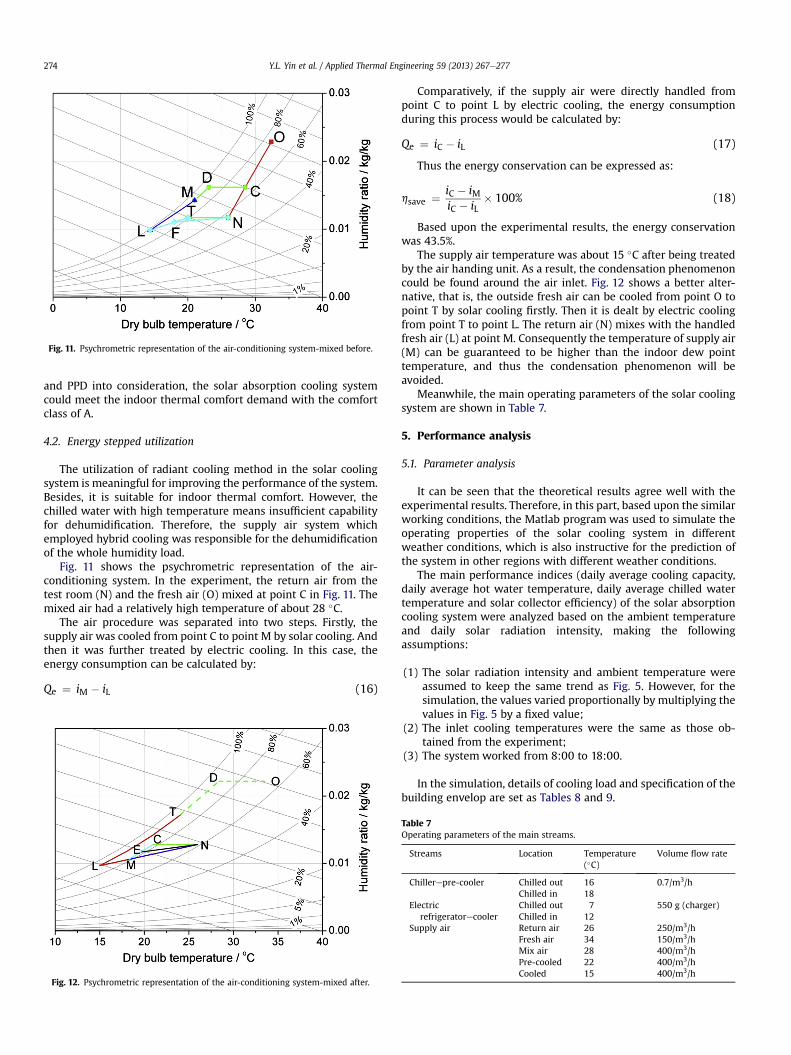
Fig. 11. Psychrometric representation of the air-conditioning system-mixed before.
Y.L. Yin et al. / Applied Thermal Engineering 59 (2013) 267e277274
and PPD into consideration, the solar absorption cooling systemcould meet the indoor thermal comfort demand with the comfortclass of A.
4.2. Energy stepped utilization
The utilization of radiant cooling method in the solar coolingsystem is meaningful for improving the performance of the system.Besides, it is suitable for indoor thermal comfort. However, thechilled water with high temperature means insufficient capabilityfor dehumidification. Therefore, the supply air system whichemployed hybrid cooling was responsible for the dehumidificationof the whole humidity load.
Fig. 11 shows the psychrometric representation of the air-conditioning system. In the experiment, the return air from thetest room (N) and the fresh air (O) mixed at point C in Fig. 11. Themixed air had a relatively high temperature of about 28 �C.
The air procedure was separated into two steps. Firstly, thesupply air was cooled from point C to point M by solar cooling. Andthen it was further treated by electric cooling. In this case, theenergy consumption can be calculated by:
Qe ¼ iM � iL (16)
Fig. 12. Psychrometric representation of the air-conditioning system-mixed after.
Comparatively, if the supply air were directly handled frompoint C to point L by electric cooling, the energy consumptionduring this process would be calculated by:
Qe ¼ iC � iL (17)
Thus the energy conservation can be expressed as:
hsave ¼ iC � iMiC � iL
� 100% (18)
Based upon the experimental results, the energy conservationwas 43.5%.
The supply air temperature was about 15 �C after being treatedby the air handing unit. As a result, the condensation phenomenoncould be found around the air inlet. Fig. 12 shows a better alter-native, that is, the outside fresh air can be cooled from point O topoint T by solar cooling firstly. Then it is dealt by electric coolingfrom point T to point L. The return air (N) mixes with the handledfresh air (L) at point M. Consequently the temperature of supply air(M) can be guaranteed to be higher than the indoor dew pointtemperature, and thus the condensation phenomenon will beavoided.
Meanwhile, the main operating parameters of the solar coolingsystem are shown in Table 7.
5. Performance analysis
5.1. Parameter analysis
It can be seen that the theoretical results agree well with theexperimental results. Therefore, in this part, based upon the similarworking conditions, the Matlab program was used to simulate theoperating properties of the solar cooling system in differentweather conditions, which is also instructive for the prediction ofthe system in other regions with different weather conditions.
The main performance indices (daily average cooling capacity,daily average hot water temperature, daily average chilled watertemperature and solar collector efficiency) of the solar absorptioncooling system were analyzed based on the ambient temperatureand daily solar radiation intensity, making the followingassumptions:
(1) The solar radiation intensity and ambient temperature wereassumed to keep the same trend as Fig. 5. However, for thesimulation, the values varied proportionally by multiplying thevalues in Fig. 5 by a fixed value;
(2) The inlet cooling temperatures were the same as those ob-tained from the experiment;
(3) The system worked from 8:00 to 18:00.
In the simulation, details of cooling load and specification of thebuilding envelop are set as Tables 8 and 9.
Table 7Operating parameters of the main streams.
Streams Location Temperature(�C)
Volume flow rate
Chillerepre-cooler Chilled out 16 0.7/m3/hChilled in 18
Electricrefrigeratorecooler
Chilled out 7 550 g (charger)Chilled in 12
Supply air Return air 26 250/m3/hFresh air 34 150/m3/hMix air 28 400/m3/hPre-cooled 22 400/m3/hCooled 15 400/m3/h
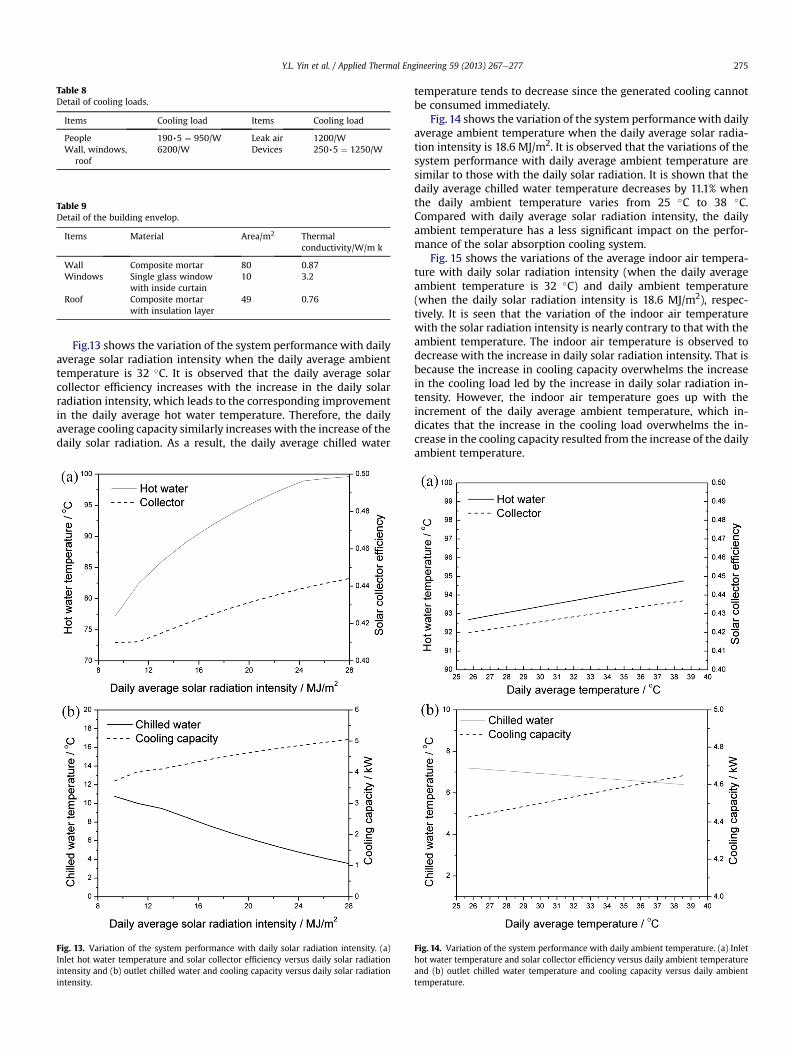
Table 8Detail of cooling loads.
Items Cooling load Items Cooling load
People 190,5 ¼ 950/W Leak air 1200/WWall, windows,
roof6200/W Devices 250,5 ¼ 1250/W
Table 9Detail of the building envelop.
Items Material Area/m2 Thermalconductivity/W/m k
Wall Composite mortar 80 0.87Windows Single glass window
with inside curtain10 3.2
Roof Composite mortarwith insulation layer
49 0.76
Y.L. Yin et al. / Applied Thermal Engineering 59 (2013) 267e277 275
Fig.13 shows the variation of the system performance with dailyaverage solar radiation intensity when the daily average ambienttemperature is 32 �C. It is observed that the daily average solarcollector efficiency increases with the increase in the daily solarradiation intensity, which leads to the corresponding improvementin the daily average hot water temperature. Therefore, the dailyaverage cooling capacity similarly increases with the increase of thedaily solar radiation. As a result, the daily average chilled water
Fig. 13. Variation of the system performance with daily solar radiation intensity. (a)Inlet hot water temperature and solar collector efficiency versus daily solar radiationintensity and (b) outlet chilled water and cooling capacity versus daily solar radiationintensity.
temperature tends to decrease since the generated cooling cannotbe consumed immediately.
Fig.14 shows the variation of the system performancewith dailyaverage ambient temperature when the daily average solar radia-tion intensity is 18.6 MJ/m2. It is observed that the variations of thesystem performance with daily average ambient temperature aresimilar to those with the daily solar radiation. It is shown that thedaily average chilled water temperature decreases by 11.1% whenthe daily ambient temperature varies from 25 �C to 38 �C.Compared with daily average solar radiation intensity, the dailyambient temperature has a less significant impact on the perfor-mance of the solar absorption cooling system.
Fig. 15 shows the variations of the average indoor air tempera-ture with daily solar radiation intensity (when the daily averageambient temperature is 32 �C) and daily ambient temperature(when the daily solar radiation intensity is 18.6 MJ/m2), respec-tively. It is seen that the variation of the indoor air temperaturewith the solar radiation intensity is nearly contrary to that with theambient temperature. The indoor air temperature is observed todecrease with the increase in daily solar radiation intensity. That isbecause the increase in cooling capacity overwhelms the increasein the cooling load led by the increase in daily solar radiation in-tensity. However, the indoor air temperature goes up with theincrement of the daily average ambient temperature, which in-dicates that the increase in the cooling load overwhelms the in-crease in the cooling capacity resulted from the increase of the dailyambient temperature.
Fig. 14. Variation of the system performance with daily ambient temperature. (a) Inlethot water temperature and solar collector efficiency versus daily ambient temperatureand (b) outlet chilled water temperature and cooling capacity versus daily ambienttemperature.
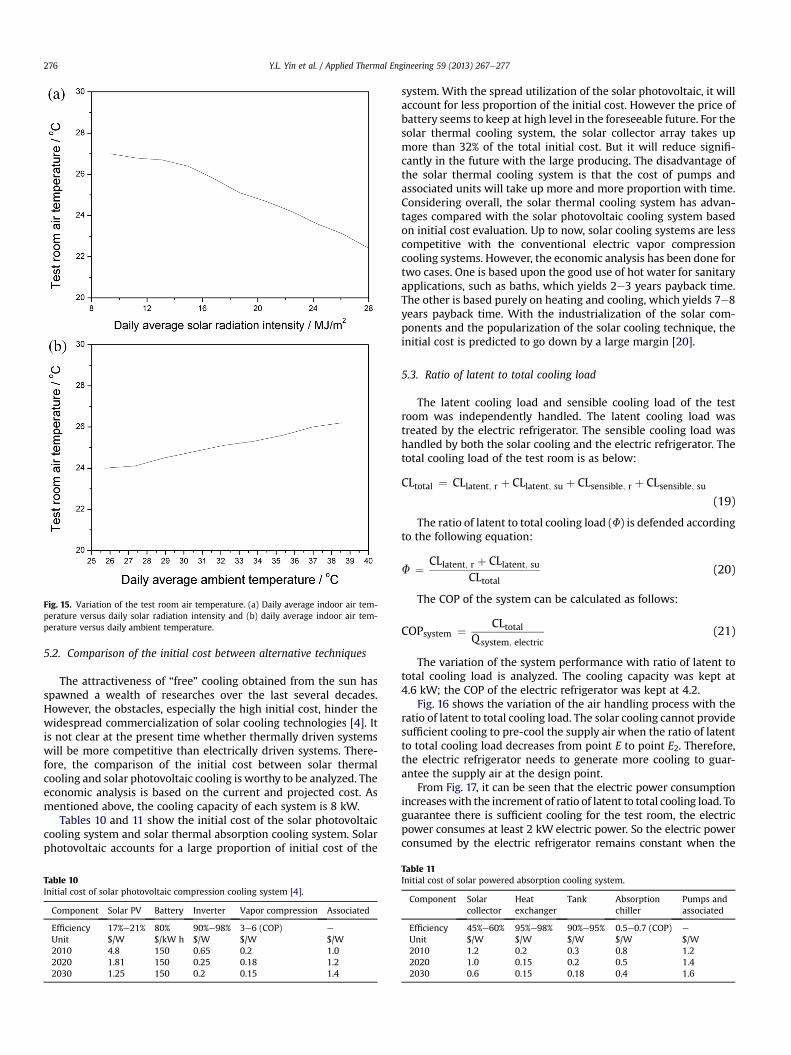
Fig. 15. Variation of the test room air temperature. (a) Daily average indoor air tem-perature versus daily solar radiation intensity and (b) daily average indoor air tem-perature versus daily ambient temperature.
Y.L. Yin et al. / Applied Thermal Engineering 59 (2013) 267e277276
5.2. Comparison of the initial cost between alternative techniques
The attractiveness of “free” cooling obtained from the sun hasspawned a wealth of researches over the last several decades.However, the obstacles, especially the high initial cost, hinder thewidespread commercialization of solar cooling technologies [4]. Itis not clear at the present time whether thermally driven systemswill be more competitive than electrically driven systems. There-fore, the comparison of the initial cost between solar thermalcooling and solar photovoltaic cooling is worthy to be analyzed. Theeconomic analysis is based on the current and projected cost. Asmentioned above, the cooling capacity of each system is 8 kW.
Tables 10 and 11 show the initial cost of the solar photovoltaiccooling system and solar thermal absorption cooling system. Solarphotovoltaic accounts for a large proportion of initial cost of the
Table 10Initial cost of solar photovoltaic compression cooling system [4].
Component Solar PV Battery Inverter Vapor compression Associated
Efficiency 17%e21% 80% 90%e98% 3e6 (COP) e
Unit $/W $/kW h $/W $/W $/W2010 4.8 150 0.65 0.2 1.02020 1.81 150 0.25 0.18 1.22030 1.25 150 0.2 0.15 1.4
system. With the spread utilization of the solar photovoltaic, it willaccount for less proportion of the initial cost. However the price ofbattery seems to keep at high level in the foreseeable future. For thesolar thermal cooling system, the solar collector array takes upmore than 32% of the total initial cost. But it will reduce signifi-cantly in the future with the large producing. The disadvantage ofthe solar thermal cooling system is that the cost of pumps andassociated units will take up more and more proportion with time.Considering overall, the solar thermal cooling system has advan-tages compared with the solar photovoltaic cooling system basedon initial cost evaluation. Up to now, solar cooling systems are lesscompetitive with the conventional electric vapor compressioncooling systems. However, the economic analysis has been done fortwo cases. One is based upon the good use of hot water for sanitaryapplications, such as baths, which yields 2e3 years payback time.The other is based purely on heating and cooling, which yields 7e8years payback time. With the industrialization of the solar com-ponents and the popularization of the solar cooling technique, theinitial cost is predicted to go down by a large margin [20].
5.3. Ratio of latent to total cooling load
The latent cooling load and sensible cooling load of the testroom was independently handled. The latent cooling load wastreated by the electric refrigerator. The sensible cooling load washandled by both the solar cooling and the electric refrigerator. Thetotal cooling load of the test room is as below:
CLtotal ¼ CLlatent; r þ CLlatent; su þ CLsensible; r þ CLsensible; su(19)
The ratio of latent to total cooling load (F) is defended accordingto the following equation:
F ¼ CLlatent; r þ CLlatent; suCLtotal
(20)
The COP of the system can be calculated as follows:
COPsystem ¼ CLtotalQsystem; electric
(21)
The variation of the system performance with ratio of latent tototal cooling load is analyzed. The cooling capacity was kept at4.6 kW; the COP of the electric refrigerator was kept at 4.2.
Fig. 16 shows the variation of the air handling process with theratio of latent to total cooling load. The solar cooling cannot providesufficient cooling to pre-cool the supply air when the ratio of latentto total cooling load decreases from point E to point E2. Therefore,the electric refrigerator needs to generate more cooling to guar-antee the supply air at the design point.
From Fig. 17, it can be seen that the electric power consumptionincreaseswith the increment of ratio of latent to total cooling load. Toguarantee there is sufficient cooling for the test room, the electricpower consumes at least 2 kW electric power. So the electric powerconsumed by the electric refrigerator remains constant when the
Table 11Initial cost of solar powered absorption cooling system.
Component Solarcollector
Heatexchanger
Tank Absorptionchiller
Pumps andassociated
Efficiency 45%e60% 95%e98% 90%e95% 0.5e0.7 (COP) e
Unit $/W $/W $/W $/W $/W2010 1.2 0.2 0.3 0.8 1.22020 1.0 0.15 0.2 0.5 1.42030 0.6 0.15 0.18 0.4 1.6
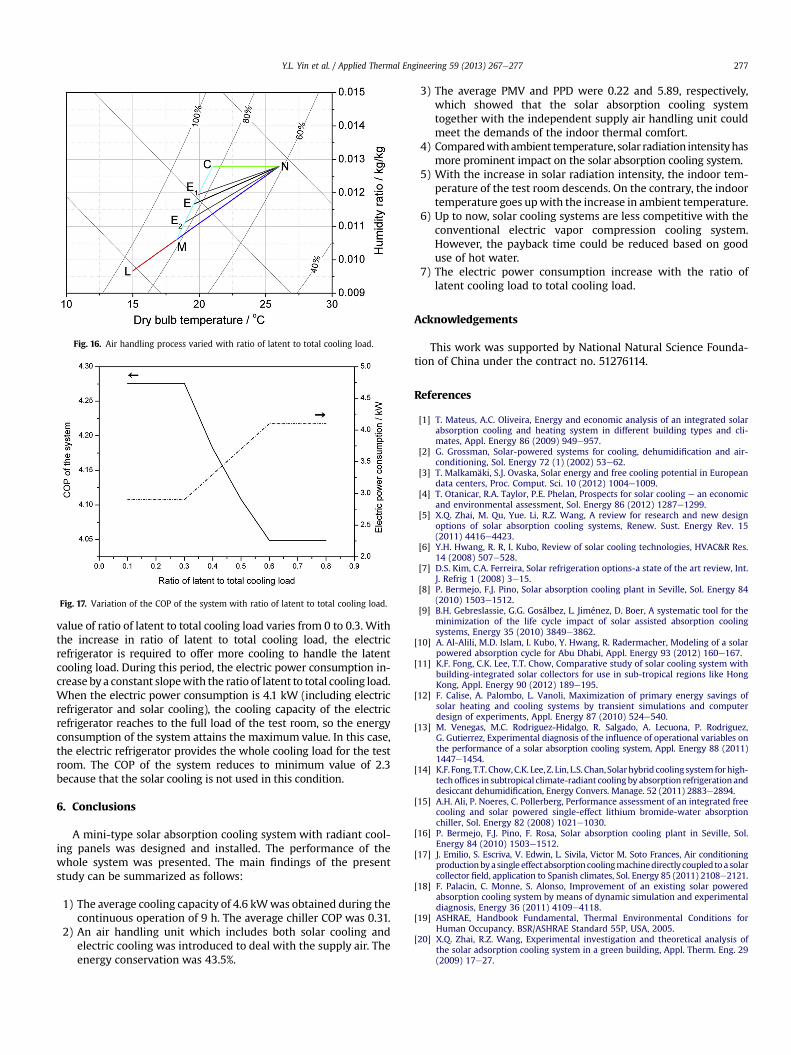
Fig. 16. Air handling process varied with ratio of latent to total cooling load.
Fig. 17. Variation of the COP of the system with ratio of latent to total cooling load.
Y.L. Yin et al. / Applied Thermal Engineering 59 (2013) 267e277 277
value of ratio of latent to total cooling load varies from 0 to 0.3. Withthe increase in ratio of latent to total cooling load, the electricrefrigerator is required to offer more cooling to handle the latentcooling load. During this period, the electric power consumption in-crease bya constant slopewith the ratio of latent to total cooling load.When the electric power consumption is 4.1 kW (including electricrefrigerator and solar cooling), the cooling capacity of the electricrefrigerator reaches to the full load of the test room, so the energyconsumption of the system attains the maximum value. In this case,the electric refrigerator provides the whole cooling load for the testroom. The COP of the system reduces to minimum value of 2.3because that the solar cooling is not used in this condition.
6. Conclusions
A mini-type solar absorption cooling system with radiant cool-ing panels was designed and installed. The performance of thewhole system was presented. The main findings of the presentstudy can be summarized as follows:
1) The average cooling capacity of 4.6 kWwas obtained during thecontinuous operation of 9 h. The average chiller COP was 0.31.
2) An air handling unit which includes both solar cooling andelectric cooling was introduced to deal with the supply air. Theenergy conservation was 43.5%.
3) The average PMV and PPD were 0.22 and 5.89, respectively,which showed that the solar absorption cooling systemtogether with the independent supply air handling unit couldmeet the demands of the indoor thermal comfort.
4) Comparedwithambient temperature, solar radiation intensityhasmore prominent impact on the solar absorption cooling system.
5) With the increase in solar radiation intensity, the indoor tem-perature of the test room descends. On the contrary, the indoortemperature goes upwith the increase in ambient temperature.
6) Up to now, solar cooling systems are less competitive with theconventional electric vapor compression cooling system.However, the payback time could be reduced based on gooduse of hot water.
7) The electric power consumption increase with the ratio oflatent cooling load to total cooling load.
Acknowledgements
This work was supported by National Natural Science Founda-tion of China under the contract no. 51276114.
References
[1] T. Mateus, A.C. Oliveira, Energy and economic analysis of an integrated solarabsorption cooling and heating system in different building types and cli-mates, Appl. Energy 86 (2009) 949e957.
[2] G. Grossman, Solar-powered systems for cooling, dehumidification and air-conditioning, Sol. Energy 72 (1) (2002) 53e62.
[3] T. Malkamäki, S.J. Ovaska, Solar energy and free cooling potential in Europeandata centers, Proc. Comput. Sci. 10 (2012) 1004e1009.
[4] T. Otanicar, R.A. Taylor, P.E. Phelan, Prospects for solar cooling e an economicand environmental assessment, Sol. Energy 86 (2012) 1287e1299.
[5] X.Q. Zhai, M. Qu, Yue. Li, R.Z. Wang, A review for research and new designoptions of solar absorption cooling systems, Renew. Sust. Energy Rev. 15(2011) 4416e4423.
[6] Y.H. Hwang, R. R, I. Kubo, Review of solar cooling technologies, HVAC&R Res.14 (2008) 507e528.
[7] D.S. Kim, C.A. Ferreira, Solar refrigeration options-a state of the art review, Int.J. Refrig 1 (2008) 3e15.
[8] P. Bermejo, F.J. Pino, Solar absorption cooling plant in Seville, Sol. Energy 84(2010) 1503e1512.
[9] B.H. Gebreslassie, G.G. Gosálbez, L. Jiménez, D. Boer, A systematic tool for theminimization of the life cycle impact of solar assisted absorption coolingsystems, Energy 35 (2010) 3849e3862.
[10] A. Al-Alili, M.D. Islam, I. Kubo, Y. Hwang, R. Radermacher, Modeling of a solarpowered absorption cycle for Abu Dhabi, Appl. Energy 93 (2012) 160e167.
[11] K.F. Fong, C.K. Lee, T.T. Chow, Comparative study of solar cooling system withbuilding-integrated solar collectors for use in sub-tropical regions like HongKong, Appl. Energy 90 (2012) 189e195.
[12] F. Calise, A. Palombo, L. Vanoli, Maximization of primary energy savings ofsolar heating and cooling systems by transient simulations and computerdesign of experiments, Appl. Energy 87 (2010) 524e540.
[13] M. Venegas, M.C. Rodriguez-Hidalgo, R. Salgado, A. Lecuona, P. Rodriguez,G. Gutierrez, Experimental diagnosis of the influence of operational variables onthe performance of a solar absorption cooling system, Appl. Energy 88 (2011)1447e1454.
[14] K.F. Fong, T.T. Chow,C.K. Lee, Z. Lin, L.S. Chan,Solarhybrid coolingsystem forhigh-techoffices in subtropical climate-radiant cooling by absorption refrigeration anddesiccant dehumidification, Energy Convers. Manage. 52 (2011) 2883e2894.
[15] A.H. Ali, P. Noeres, C. Pollerberg, Performance assessment of an integrated freecooling and solar powered single-effect lithium bromide-water absorptionchiller, Sol. Energy 82 (2008) 1021e1030.
[16] P. Bermejo, F.J. Pino, F. Rosa, Solar absorption cooling plant in Seville, Sol.Energy 84 (2010) 1503e1512.
[17] J. Emilio, S. Escriva, V. Edwin, L. Sivila, Victor M. Soto Frances, Air conditioningproductionbyasingleeffectabsorptioncoolingmachinedirectly coupledtoasolarcollector field, application to Spanish climates, Sol. Energy 85 (2011) 2108e2121.
[18] F. Palacin, C. Monne, S. Alonso, Improvement of an existing solar poweredabsorption cooling system by means of dynamic simulation and experimentaldiagnosis, Energy 36 (2011) 4109e4118.
[19] ASHRAE, Handbook Fundamental, Thermal Environmental Conditions forHuman Occupancy. BSR/ASHRAE Standard 55P, USA, 2005.
[20] X.Q. Zhai, R.Z. Wang, Experimental investigation and theoretical analysis ofthe solar adsorption cooling system in a green building, Appl. Therm. Eng. 29(2009) 17e27.