Experimental Investigation and Modelling of Flow Boiling ...
10
1 EXPERIMENTAL INVESTIGATION AND MODELLING OF FLOW BOILING HEAT TRANSFER OF C 3 F 8 /C 2 F 6 BLENDS Doubek M. a , Haubner M. a , Houska D. a , Vacek V.* a,f , Battistin M. b , Hallewell G. c , Katunin S. d , and Robinson D. e *Author for correspondence a Czech Technical University in Prague, Department of Physics, Technická 4, 166 07 Prague 6, Czech Republic b CERN, 1211 Geneva 23, Switzerland c Aix Marseille Université, CNRS/IN2P3, CPPM UMR 7346, 13288, Marseille, France d B.P. Konstantinov Petersburg Nuclear Physics Institute (PNPI), 188300 St. Petersburg, Russia e Department of Physics and Astronomy, Cavendish Laboratory, J.J. Thompson Avenue, University of Cambridge, Cambridge, CB3 0HE, U.K. f Unicorn College, V Kapslovně 2767/2 130 00 Praha 3, Czech Republic E-mail : [email protected] ABSTRACT We have obtained an extensive data set of heat transfer coefficient (HTC) measurements in (R-218, C 3 F 8 )/(R-116, C 2 F 6 ) zeotropic refrigerant blends. A horizontal thin-wall tube with a circular cross-section and diameter of 4 mm was used as an evaporator. The data covers heat fluxes from 3.5 to 10 kW . m -2 , mass fluxes from 91 to 264 kg . m -2 s -1 and C 2 F 6 fractions from 0 to 25% molar. Various flow regimes were clearly identified via the HTC measurements on both the top and bottom of the tube. Boiling liquid was observed to pool at the bottom of the tube at low mass fluxes, while an annular flow regime was achieved at higher mass fluxes. The C 3 F 8 /C 2 F 6 saturated fluorocarbon blends are zeotropic, exhibiting the usual behaviour where the HTC of the blend is lower than those of its pure components. A comparison between the data and several models of flow boiling heat transfer is presented. The comparison includes a flow map that predicts various flow boiling regimes inside a horizontal pipe. NOMENCLATURE Δh [kJ/kg] Enthalpy of evaporation x [1] Vapor quality λ [mW/(m·K)] Thermal conductivity d [mm] Evaporator tube diameter h [-] Heat transfer coefficient f [1] Kandlikar’s model fluid parameter ε [1] Void fraction ρ [kg/m 3 ] density pr [1] reduced pressure 1 The number of beam collisions produced per cm 2 of beam cross section and per second. r [1] dimensionless roughness M [g/mol] molar mass Fc [1] Mixture suppression factor Tliq [K] liquid saturation temperature Tvap [K] vapor saturation temperature Bo [1] boiling number Co [1] convective number Pr [1] Prandtl number q [kW/m 2 ] heat flux m [kg.m -2 .s -1 ] mass flux INTRODUCTION All the main experiments at the CERN Large Hadron Collider use radiation-resistant perfluorocarbon refrigerants in their sub-detectors located close to the circulating proton beams. Both mono-phase and two-phase regimes are employed [1]-[7]. The main motivations for use of saturated fluorocarbons are their radiation tolerance, non-flammability, chemical stability and dielectric properties. Silicon-based charged particle detectors are compact devices with high heat dissipation both through Joule heating of on-board readout electronics and by radiation damage-induced leakage currents developed in the silicon detector substrates. While evaporative cooling is mainly employed [1], [3]-[7] only pure substances (C 3 F 8 , C 4 F 10 ) have so far been used in LHC detector evaporative cooling applications. Since silicon detectors need to be maintained at progressively lower temperatures to retard radiation damage- related aging as the luminosity 1 of the LHC proton beams increases with improving accelerator performance, blends of C 3 F 8 and up to 25% molar of C 2 F 6 was proposed for the silicon detector of the ATLAS experiment. Such blends would reduce 13th International Conference on Heat Transfer, Fluid Mechanics and Thermodynamics 355
Transcript of Experimental Investigation and Modelling of Flow Boiling ...
1
EXPERIMENTAL INVESTIGATION AND MODELLING OF FLOW BOILING HEAT TRANSFER OF C3F8/C2F6 BLENDS
Doubek M.a, Haubner M.a, Houska D.a, Vacek V.*a,f, Battistin M.b, Hallewell G.c, Katunin S.d, and Robinson D.e
*Author for correspondence aCzech Technical University in Prague, Department of Physics, Technická 4, 166 07 Prague 6, Czech Republic
bCERN, 1211 Geneva 23, Switzerland
c Aix Marseille Université, CNRS/IN2P3, CPPM UMR 7346, 13288, Marseille, France d B.P. Konstantinov Petersburg Nuclear Physics Institute (PNPI), 188300 St. Petersburg, Russia
e Department of Physics and Astronomy, Cavendish Laboratory, J.J. Thompson Avenue, University of Cambridge, Cambridge, CB3 0HE, U.K.
f Unicorn College, V Kapslovně 2767/2 130 00 Praha 3, Czech Republic E-mail : [email protected]
ABSTRACT
We have obtained an extensive data set of heat transfer coefficient (HTC) measurements in (R-218, C3F8)/(R-116, C2F6) zeotropic refrigerant blends. A horizontal thin-wall tube with a circular cross-section and diameter of 4 mm was used as an evaporator. The data covers heat fluxes from 3.5 to 10 kW.m-2, mass fluxes from 91 to 264 kg.m-2s-1 and C2F6 fractions from 0 to 25% molar. Various flow regimes were clearly identified via the HTC measurements on both the top and bottom of the tube. Boiling liquid was observed to pool at the bottom of the tube at low mass fluxes, while an annular flow regime was achieved at higher mass fluxes. The C3F8/C2F6 saturated fluorocarbon blends are zeotropic, exhibiting the usual behaviour where the HTC of the blend is lower than those of its pure components. A comparison between the data and several models of flow boiling heat transfer is presented. The comparison includes a flow map that predicts various flow boiling regimes inside a horizontal pipe.
NOMENCLATURE
Δh [kJ/kg] Enthalpy of evaporation x [1] Vapor quality λ [mW/(m·K)] Thermal conductivity d [mm] Evaporator tube diameter h [-] Heat transfer coefficient f [1] Kandlikar’s model fluid parameter ε [1] Void fraction ρ [kg/m3] density pr [1] reduced pressure
1 The number of beam collisions produced per cm2 of beam cross section and per second.
r [1] dimensionless roughness M [g/mol] molar mass Fc [1] Mixture suppression factor Tliq [K] liquid saturation temperature Tvap [K] vapor saturation temperature Bo [1] boiling number Co [1] convective number Pr [1] Prandtl number q [kW/m2] heat flux m [kg.m-2.s-1] mass flux
INTRODUCTION
All the main experiments at the CERN Large Hadron Collider use radiation-resistant perfluorocarbon refrigerants in their sub-detectors located close to the circulating proton beams. Both mono-phase and two-phase regimes are employed [1]-[7]. The main motivations for use of saturated fluorocarbons are their radiation tolerance, non-flammability, chemical stability and dielectric properties.
Silicon-based charged particle detectors are compact devices with high heat dissipation both through Joule heating of on-board readout electronics and by radiation damage-induced leakage currents developed in the silicon detector substrates.
While evaporative cooling is mainly employed [1], [3]-[7] only pure substances (C3F8, C4F10) have so far been used in LHC detector evaporative cooling applications.
Since silicon detectors need to be maintained at progressively lower temperatures to retard radiation damage-related aging as the luminosity1 of the LHC proton beams increases with improving accelerator performance, blends of C3F8 and up to 25% molar of C2F6 was proposed for the silicon detector of the ATLAS experiment. Such blends would reduce
13th International Conference on Heat Transfer, Fluid Mechanics and Thermodynamics
355
2
the evaporation temperature while using the existing detector refrigeration infrastructure currently operating with pure C3F8.
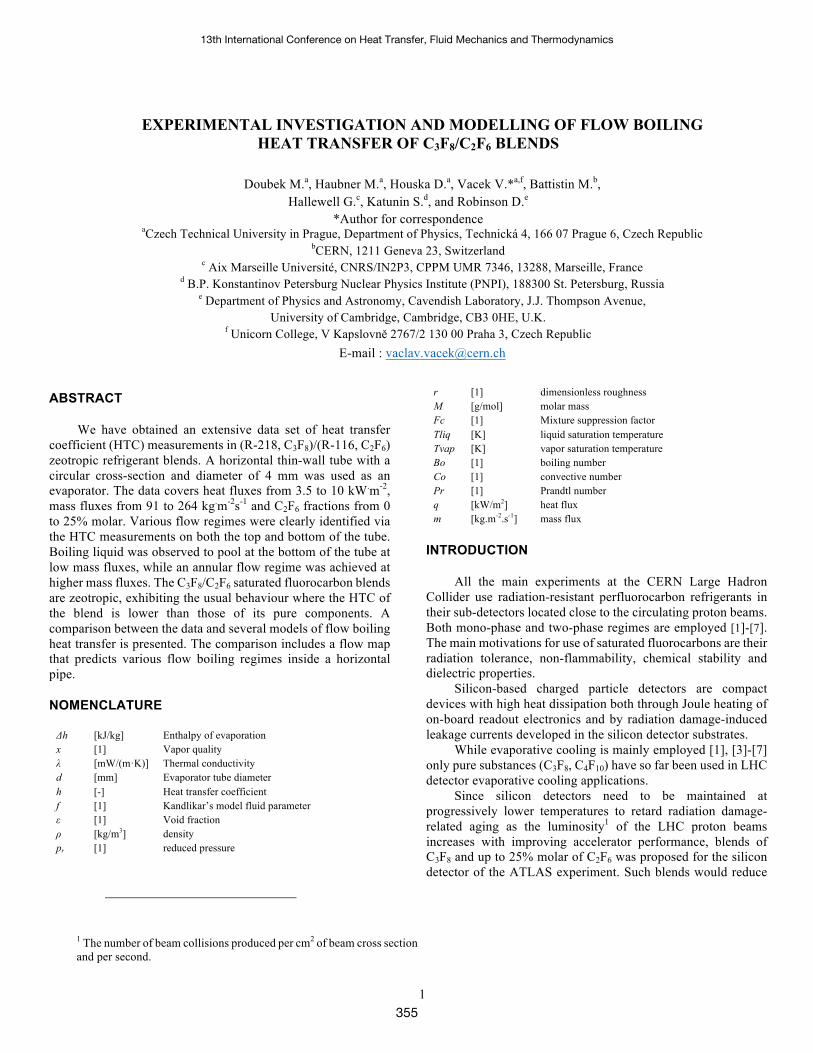
Our previous study [7] demonstrated the possibility of reducing the operating evaporation temperature of the ATLAS Semiconductor Tracker (SCT) 2 by 4°C per 10% (molar) of C2F6 blended with C3F8, as illustrated in Figure 1. In this scenario, there would be no need for modifications to the detector itself or the cooling plant: C3F8/C2F6 blends containing up to 25% (molar) C2F6 would be drop-in replacements for pure C3F8. The upper limit of 25% C2F6 in the blend is determined by temperature and pressure constraints in uninsulated and inaccessible liquid coolant lines distributing refrigerant within the ATLAS detector.
Figure 1 Maximum evaporator tube surface temperature vs. composition at heat fluxes up to 9.9 kW.m-2 measured with a
thermal mock-up of the ATLAS SCT [7].
We developed an experimental setup to investigate the thermodynamic performance (through HTC measurements) of binary zeotropic mixtures of C3F8 and C2F6, since relevant experimental data were not available either for the blends or for the pure fluids. The setup closely resembled the evaporators of the ATLAS SCT. In this paper, we compare the experimental data with three common correlations of flow boiling heat transfer in horizontal circular pipes.
FLUID PROPERTIES R-218 (C3F8) R-116 (C2F6) are saturated fluorocarbons.
They are colourless, odourless and generally inert, both chemically and electrically. The molecules are extremely stable thanks to the strong carbon-fluorine bonds. This stability confers radiation tolerance, which is necessary in our application. This also results in long atmospheric life times and thus the very high GWPs (12010 and 8690 x CO2) of these molecules. Outside of refrigeration applications in particle physics and high-tech
2 ATLAS is the largest detector at the CERN Large Hadron Collider. Its Semiconductor Tracker (SCT) sub-detector is cooled down using C3F8 in an oil-less compression cycle.
electronics R-116 and R-218 are nonetheless used as components in some commercially available refrigerant blends including R-508 and R-403.
Relevant thermodynamic and transport properties of the pure fluids are summarized in Table 1.
Table 1 Thermodynamic properties at 0.1 MPa as generated by the thermodynamic database NIST REFROP v. 9. [8].
C3F8 C2F6
Blend 0% 100% M g/mol 188.02 138.01
Liquid Phase T K 236.1 194.8 ρ kg/m3 1613 1606 h kJ/kg 162 114 Cv J/(kg·K) 686 629 Cp J/(kg·K) 974 941 λ mW/(m·K) 61.9 76.9 µ µPa·s 438 402 α cm2/s 0.00039 0.00051
Vapour Phase T K 236.1 194.8 ρ kg/m3 10.1 8.9 h kJ/kg 267 231 Cv J/(kg·K) 660 538 Cp J/(kg·K) 721 613 λ mW/(m·K) 8.16 5.39 µ µPa·s 9.77 9.01 α cm2/s 0.01120 0.00985
THE EXPERIMENTAL SETUP
The experimental setup closely resembled the evaporators of the ATLAS SCT. Evaporation occurred within a horizontal 1 metre long 70 µm wall copper-nickel tube with an internal diameter of 4 mm. The central section of 820 mm was heated directly by electric current passing through the tube wall (Joule heating).
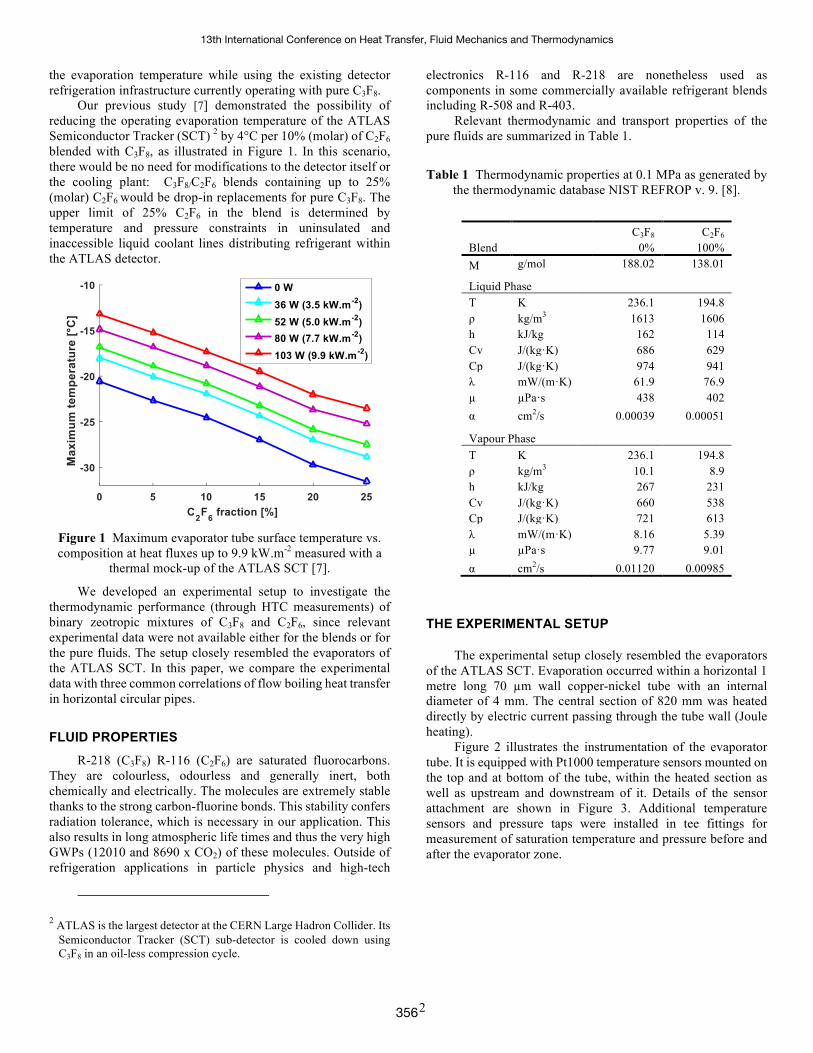
Figure 2 illustrates the instrumentation of the evaporator tube. It is equipped with Pt1000 temperature sensors mounted on the top and at bottom of the tube, within the heated section as well as upstream and downstream of it. Details of the sensor attachment are shown in Figure 3. Additional temperature sensors and pressure taps were installed in tee fittings for measurement of saturation temperature and pressure before and after the evaporator zone.
13th International Conference on Heat Transfer, Fluid Mechanics and Thermodynamics
356
3
Figure 2 Detailed view of the instrumentation, indicating the
heated section and saturation condition measurement at the inlet/outlet of the evaporator tube.
Figure 3 Detailed view of Pt1000 sensor mounting on the evaporator tube top and bottom via thermally conductive
dielectric paste and heat shrinkable sleeves.
The evaporator was mounted, together with its instrumentation in an insulated box flushed with dry air to eliminate condensation and icing and to reduce parasitic heat ingress from free convection.
Figure 4 Inlet manifold and evaporator tube equipped with instrumentation (thermal insulation not yet installed).
A pressure regulator and a pair of capillaries were installed upstream of the evaporator to control the mass flow rate and inlet saturation conditions. A back-pressure regulator was located downstream to maintain a well-defined and stable evaporation pressure during measurements. The coolant was circulated by a custom-built system based on a three-cylindrical oil-free compressor, shown in Figure 5.
The compressor raised the pressure of the returning vapour from 0.1 MPa to 1 MPa. Subcooled liquid from the condenser descended 2 metres and passed through a vane pump to boost its pressure to 1.45 MPa. The pressure regulator and an additional sub-cooling circuit maintained stable liquid conditions at the
capillary inlets. A PID-controlled electric heater was installed in the exhaust to evaporate any liquid remaining at the output of the test tube.
Figure 5 The closed refrigeration circuit used in the measurements. The flow conditions are stabilised by pressure regulators and a sub-cooling heat exchanger upstream of the
test tube.
Typical operating parameters during measurements are shown in Figure 6. The liquid refrigerant was subcooled to 15°C and its pressure was reduced to 1.3 MPa in the pressure regulator. Two parallel capillaries were used as throttling elements. Three different mass flow rates could be selected by opening either or both capillaries.
Figure 6 Typical values of pressure, temperature and flow rate
in the region containing the evaporator tube
13th International Conference on Heat Transfer, Fluid Mechanics and Thermodynamics
357
4
EXPERIMENTAL DATA
The combined uncertainties of the measured quantities are listed in Table 2. The uncertainty of the HTC varies greatly across the measured data set due to variations in the difference between the tube wall temperatures and the saturation temperature of the fluid, with high HTC manifested by small temperature differences. Since the precision of the temperature readout is constant, the evaluation of small temperature differences leads to a larger uncertainty at high values of HTC. Another major source of uncertainty can come from large fluctuations of the measured temperatures during oscillating dry-out conditions.
Table 2 Uncertainties of measured values.
uc Temperature K 0.15 Pressure Pa 301 Mass flow g·s-1 0.054 Molar blend fraction % 0.3
Power W 0.09 The refrigerant blends were mixed by liquid weight
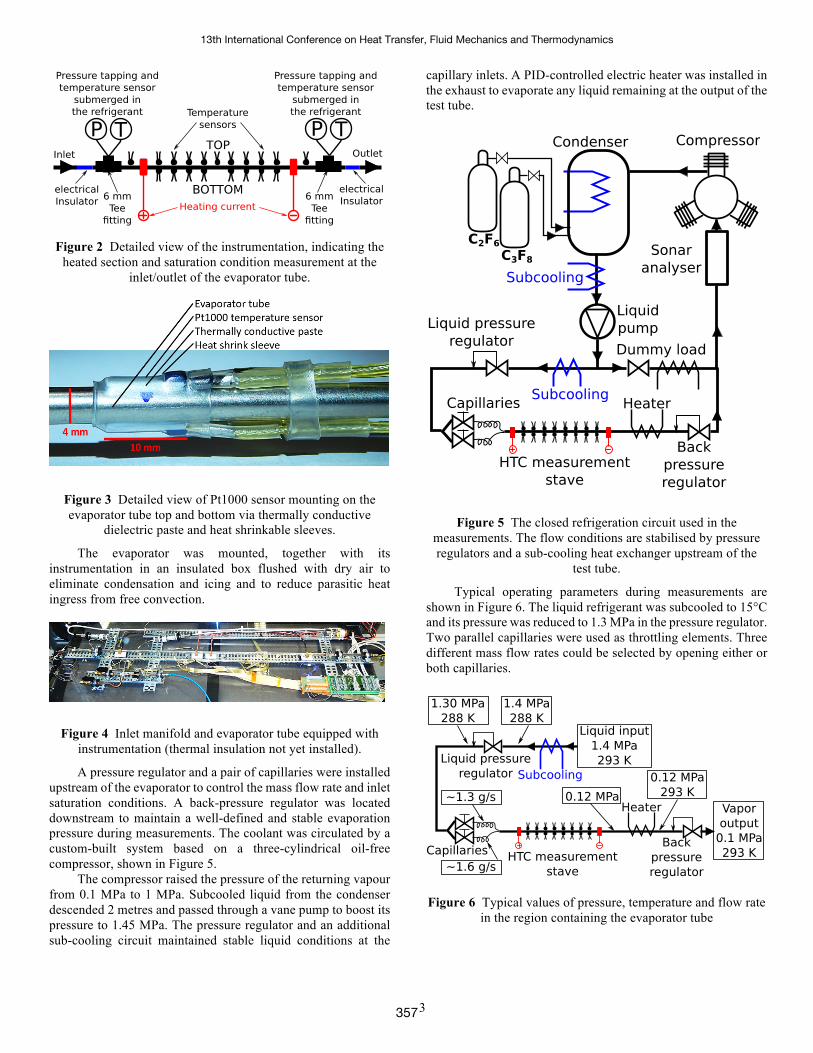
proportions and the final blend composition was verified with a precision of ±0.35% in molar composition by speed of sound measurement in superheated vapour. A sonar-like device was constructed specifically for this purpose [9]. The speed of sound measured at a certain temperature and pressure with precision of 0.05 m.s-1 was compared to speed of sound vs. composition tables to determine the blend composition, Figure 7. The theoretical values in these tables were calculated using NIST REFPROP [8] and verified by our own experimental data [10], [11].
Figure 7 Speed of sound as a function of blend C2F6 fraction for various temperatures at a constant pressure of 0.12 MPa.
The Joule heating applied to the 820 mm long evaporator tube ranged from 36 to 100 W, equivalent to a heat flux from 3.5 to 10 kW.m-2. The mass flow ranged from 1.1 to 3.4 g.s-1, corresponding to a mass flux between 91 and 264 kg.m-2.s-1. The evaporation pressure downstream of the evaporator was
maintained at 0.12 MPa. The evaporation pressure in the evaporator depended on the particular conditions of mass flow and applied heating power. As can be seen from Figure 8, the evaporation took place at pressures between 0.15 and 0.26 MPa.
Figure 8 Visualisation of the measured dataset as a function of
mass and heat flux (upper plot) and as a function of pressure and vapour quality, with a mixture composition as parameter.
Two capillaries of different length and diameter were connected in parallel allowing three mass flow possibilities for a given upstream liquid pressure. The effective mass flow through the capillaries decreased with increasing C2F6 fraction, due to its lower density. We did not attempt to increase the liquid pressure to maintain the same mass flow for all blend compositions since we intended to use the experimental setup to evaluate the thermal behaviour of the mixtures as “drop-in” replacements in the ATLAS detector cooling system where the capillaries cannot be replaced and the liquid pressure cannot be increased.
Figure 9 The observed mass flux decrease with increasing
C2F6 fraction increase, due to density effects.
0 5 10 15 20 25 30112
114
116
118
120
122
C2F6 fraction [%]
Spee
d of
sou
nd m
.s-1
0.12 MPa
288 K293 K298 K
50 100 150 200 250 3000
5
10
15
m [kg.m-2.s-1]
q [k
W.m
-2]
0.2 0.4 0.6 0.8 10.1
0.15
0.2
0.25
x [-]
p [M
Pa]
0%5%10%15%20%25%
0 5 10 15 20 25
100
200
300
C2F6 fraction [%]
m [k
g.m
-2.s
-1]
Capillary 1Capillary 2Capillary 1+2
13th International Conference on Heat Transfer, Fluid Mechanics and Thermodynamics
358
5
The boiling of zeotropic blends is a complex phenomenon, such blends are known to exhibit lower boiling HTC than their pure components. In our data, up to 25% molar C2F6 concentrations this is partly caused by decreasing mass flow and partly by a zeotropic heat transfer suppression.
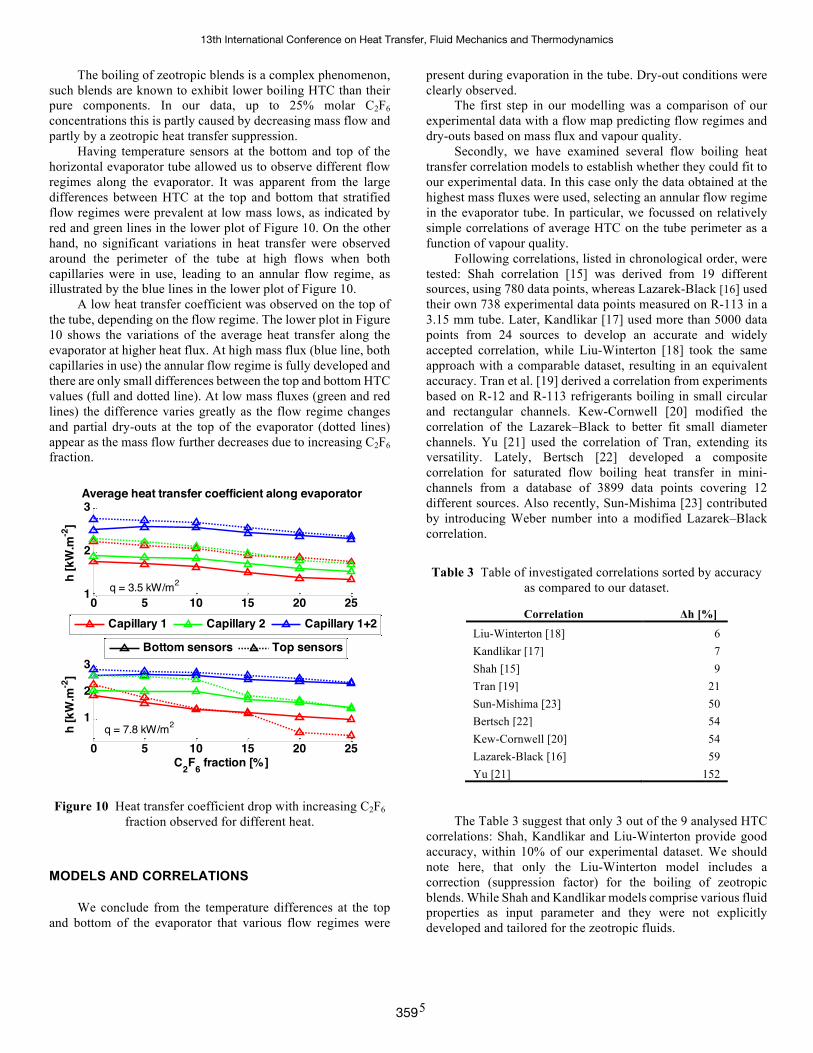
Having temperature sensors at the bottom and top of the horizontal evaporator tube allowed us to observe different flow regimes along the evaporator. It was apparent from the large differences between HTC at the top and bottom that stratified flow regimes were prevalent at low mass lows, as indicated by red and green lines in the lower plot of Figure 10. On the other hand, no significant variations in heat transfer were observed around the perimeter of the tube at high flows when both capillaries were in use, leading to an annular flow regime, as illustrated by the blue lines in the lower plot of Figure 10.
A low heat transfer coefficient was observed on the top of the tube, depending on the flow regime. The lower plot in Figure 10 shows the variations of the average heat transfer along the evaporator at higher heat flux. At high mass flux (blue line, both capillaries in use) the annular flow regime is fully developed and there are only small differences between the top and bottom HTC values (full and dotted line). At low mass fluxes (green and red lines) the difference varies greatly as the flow regime changes and partial dry-outs at the top of the evaporator (dotted lines) appear as the mass flow further decreases due to increasing C2F6 fraction.
Figure 10 Heat transfer coefficient drop with increasing C2F6 fraction observed for different heat.
MODELS AND CORRELATIONS
We conclude from the temperature differences at the top and bottom of the evaporator that various flow regimes were
present during evaporation in the tube. Dry-out conditions were clearly observed.
The first step in our modelling was a comparison of our experimental data with a flow map predicting flow regimes and dry-outs based on mass flux and vapour quality.
Secondly, we have examined several flow boiling heat transfer correlation models to establish whether they could fit to our experimental data. In this case only the data obtained at the highest mass fluxes were used, selecting an annular flow regime in the evaporator tube. In particular, we focussed on relatively simple correlations of average HTC on the tube perimeter as a function of vapour quality.
Following correlations, listed in chronological order, were tested: Shah correlation [15] was derived from 19 different sources, using 780 data points, whereas Lazarek-Black [16] used their own 738 experimental data points measured on R-113 in a 3.15 mm tube. Later, Kandlikar [17] used more than 5000 data points from 24 sources to develop an accurate and widely accepted correlation, while Liu-Winterton [18] took the same approach with a comparable dataset, resulting in an equivalent accuracy. Tran et al. [19] derived a correlation from experiments based on R-12 and R-113 refrigerants boiling in small circular and rectangular channels. Kew-Cornwell [20] modified the correlation of the Lazarek–Black to better fit small diameter channels. Yu [21] used the correlation of Tran, extending its versatility. Lately, Bertsch [22] developed a composite correlation for saturated flow boiling heat transfer in mini-channels from a database of 3899 data points covering 12 different sources. Also recently, Sun-Mishima [23] contributed by introducing Weber number into a modified Lazarek–Black correlation.
Table 3 Table of investigated correlations sorted by accuracy as compared to our dataset.
Correlation Δh [%] Liu-Winterton [18] 6 Kandlikar [17] 7 Shah [15] 9 Tran [19] 21 Sun-Mishima [23] 50 Bertsch [22] 54 Kew-Cornwell [20] 54 Lazarek-Black [16] 59 Yu [21] 152
The Table 3 suggest that only 3 out of the 9 analysed HTC correlations: Shah, Kandlikar and Liu-Winterton provide good accuracy, within 10% of our experimental dataset. We should note here, that only the Liu-Winterton model includes a correction (suppression factor) for the boiling of zeotropic blends. While Shah and Kandlikar models comprise various fluid properties as input parameter and they were not explicitly developed and tailored for the zeotropic fluids.
0 5 10 15 20 251
2
3
h [k
W.m
-2]
Average heat transfer coefficient along evaporator
Capillary 1 Capillary 2 Capillary 1+2
0 5 10 15 20 25
1
2
3
C2F6 fraction [%]
h [k
W.m
-2]
Bottom sensors Top sensors
q = 3.5 kW/m2
q = 7.8 kW/m2
13th International Conference on Heat Transfer, Fluid Mechanics and Thermodynamics
359
6
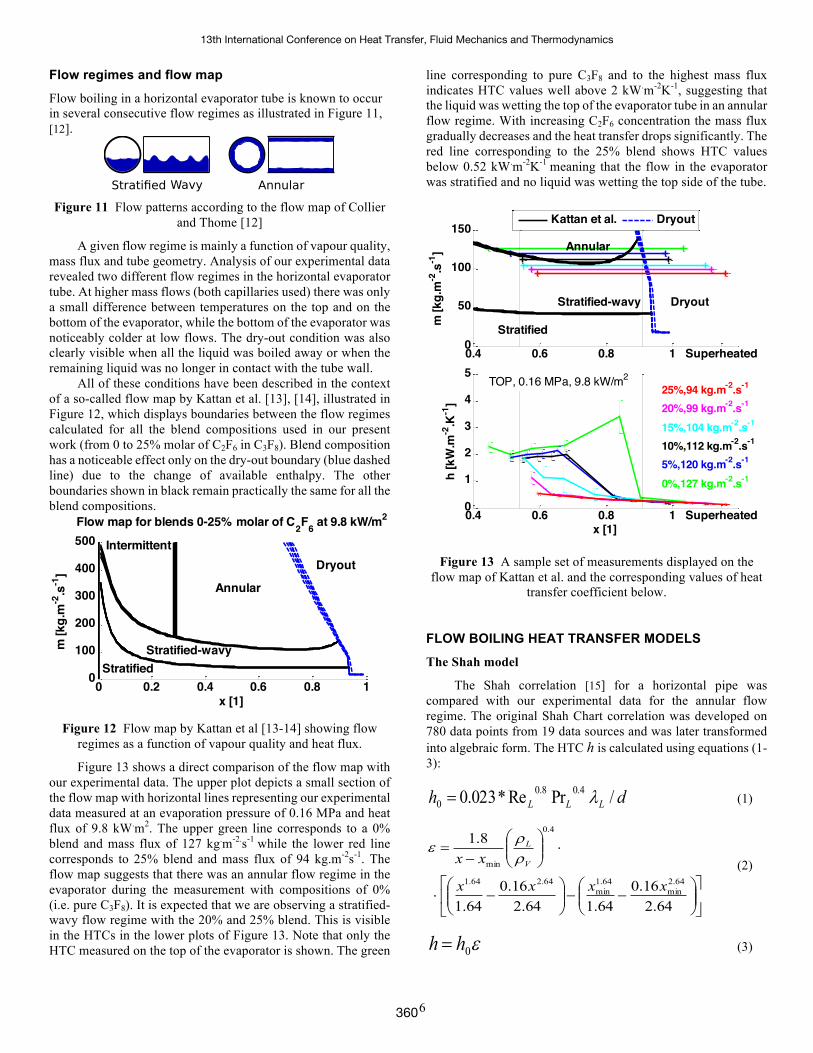
Flow regimes and flow map Flow boiling in a horizontal evaporator tube is known to occur in several consecutive flow regimes as illustrated in Figure 11, [12].
Figure 11 Flow patterns according to the flow map of Collier
and Thome [12]
A given flow regime is mainly a function of vapour quality, mass flux and tube geometry. Analysis of our experimental data revealed two different flow regimes in the horizontal evaporator tube. At higher mass flows (both capillaries used) there was only a small difference between temperatures on the top and on the bottom of the evaporator, while the bottom of the evaporator was noticeably colder at low flows. The dry-out condition was also clearly visible when all the liquid was boiled away or when the remaining liquid was no longer in contact with the tube wall.
All of these conditions have been described in the context of a so-called flow map by Kattan et al. [13], [14], illustrated in Figure 12, which displays boundaries between the flow regimes calculated for all the blend compositions used in our present work (from 0 to 25% molar of C2F6 in C3F8). Blend composition has a noticeable effect only on the dry-out boundary (blue dashed line) due to the change of available enthalpy. The other boundaries shown in black remain practically the same for all the blend compositions.
Figure 12 Flow map by Kattan et al [13-14] showing flow
regimes as a function of vapour quality and heat flux.
Figure 13 shows a direct comparison of the flow map with our experimental data. The upper plot depicts a small section of the flow map with horizontal lines representing our experimental data measured at an evaporation pressure of 0.16 MPa and heat flux of 9.8 kW.m2. The upper green line corresponds to a 0% blend and mass flux of 127 kg.m-2.s-1 while the lower red line corresponds to 25% blend and mass flux of 94 kg.m-2s-1. The flow map suggests that there was an annular flow regime in the evaporator during the measurement with compositions of 0% (i.e. pure C3F8). It is expected that we are observing a stratified-wavy flow regime with the 20% and 25% blend. This is visible in the HTCs in the lower plots of Figure 13. Note that only the HTC measured on the top of the evaporator is shown. The green
line corresponding to pure C3F8 and to the highest mass flux indicates HTC values well above 2 kW.m-2K-1, suggesting that the liquid was wetting the top of the evaporator tube in an annular flow regime. With increasing C2F6 concentration the mass flux gradually decreases and the heat transfer drops significantly. The red line corresponding to the 25% blend shows HTC values below 0.52 kW.m-2K-1 meaning that the flow in the evaporator was stratified and no liquid was wetting the top side of the tube.
Figure 13 A sample set of measurements displayed on the
flow map of Kattan et al. and the corresponding values of heat transfer coefficient below.
FLOW BOILING HEAT TRANSFER MODELS The Shah model
The Shah correlation [15] for a horizontal pipe was compared with our experimental data for the annular flow regime. The original Shah Chart correlation was developed on 780 data points from 19 data sources and was later transformed into algebraic form. The HTC h is calculated using equations (1-3):
dh LLL /PrRe*023.0 4.08.00 l= (1)
úû
ùêë
é÷÷ø
öççè
æ--÷÷
ø
öççè
æ-×
×÷÷ø
öççè
æ-
=
64.216.0
64.164.216.0
64.1
8.1
64.2min
64.1min
64.264.1
4.0
min
xxxx
xx V
L
rre
(2)
e0hh = (3)
0 0.2 0.4 0.6 0.8 10
100
200
300
400
500
m [k
g.m
-2.s
-1]
Flow map for blends 0-25% molar of C2F6 at 9.8 kW/m2
x [1]
Intermittent
Annular
Stratified-wavyStratified
Dryout
0.4 0.6 0.8 1 Superheated0
50
100
150
m [k
g.m
-2.s
-1]
Kattan et al. Dryout
0.4 0.6 0.8 1 Superheated0
1
2
3
4
5
x [1]
h [k
W.m
-2.K
-1]
Annular
Stratified-wavy
Stratified
Dryout
0%,127 kg.m-2.s-15%,120 kg.m-2.s-110%,112 kg.m-2.s-115%,104 kg.m-2.s-120%,99 kg.m-2.s-125%,94 kg.m-2.s-1TOP, 0.16 MPa, 9.8 kW/m2
13th International Conference on Heat Transfer, Fluid Mechanics and Thermodynamics
360
7
The Kandlikar model
The Kandlikar correlation was later refined using 5246 data points from 24 sources [17]. The dataset included the refrigerants R11, R12, R22, R114 and R152a. The model combines contributions from the convective and nucleate boiling heat transfer. The forced convection heat transfer h0 is evaluated from the Dittus-Belter correlation; equation (1).
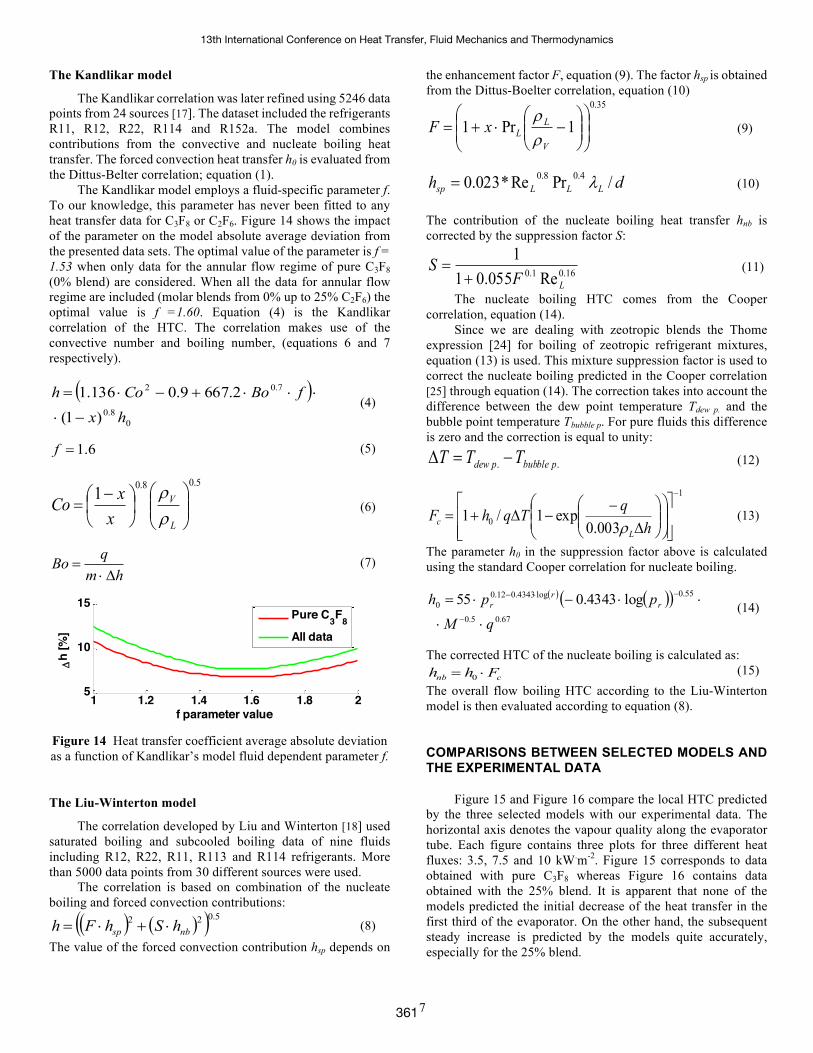
The Kandlikar model employs a fluid-specific parameter f. To our knowledge, this parameter has never been fitted to any heat transfer data for C3F8 or C2F6. Figure 14 shows the impact of the parameter on the model absolute average deviation from the presented data sets. The optimal value of the parameter is f = 1.53 when only data for the annular flow regime of pure C3F8 (0% blend) are considered. When all the data for annular flow regime are included (molar blends from 0% up to 25% C2F6) the optimal value is f =1.60. Equation (4) is the Kandlikar correlation of the HTC. The correlation makes use of the convective number and boiling number, (equations 6 and 7 respectively).
( )
08.0
7.02
)1(2.6679.0136.1
hxfBoCoh
-×
×××+-×= (4)
6.1=f (5)
5.08.01
÷÷ø
öççè
æ÷øö
çèæ -
=L
V
xxCo
rr
(6)
hmqBoD×
= (7)
Figure 14 Heat transfer coefficient average absolute deviation as a function of Kandlikar’s model fluid dependent parameter f.
The Liu-Winterton model
The correlation developed by Liu and Winterton [18] used saturated boiling and subcooled boiling data of nine fluids including R12, R22, R11, R113 and R114 refrigerants. More than 5000 data points from 30 different sources were used.
The correlation is based on combination of the nucleate boiling and forced convection contributions:
( ) ( )( ) 5.022nbsp hShFh ×+×= (8)
The value of the forced convection contribution hsp depends on
the enhancement factor F, equation (9). The factor hsp is obtained from the Dittus-Boelter correlation, equation (10)
35.0
1Pr1 ÷÷ø
öççè
æ÷÷ø
öççè
æ-×+=
V
LLxFrr
(9)
dh LLLsp /PrRe*023.0 4.08.0 l= (10) The contribution of the nucleate boiling heat transfer hnb is corrected by the suppression factor S:
16.01.0 Re055.011
LFS
+= (11)
The nucleate boiling HTC comes from the Cooper correlation, equation (14).
Since we are dealing with zeotropic blends the Thome expression [24] for boiling of zeotropic refrigerant mixtures, equation (13) is used. This mixture suppression factor is used to correct the nucleate boiling predicted in the Cooper correlation [25] through equation (14). The correction takes into account the difference between the dew point temperature Tdew p. and the bubble point temperature Tbubble p. For pure fluids this difference is zero and the correction is equal to unity:
.. pbubblepdew TTT -=D (12)
1
0 003.0exp1/1
-
úúû
ù
êêë
é÷÷ø
öççè
æ÷÷ø
öççè
æD
--D+=
hqTqhFL
c r (13)
The parameter h0 in the suppression factor above is calculated using the standard Cooper correlation for nucleate boiling.
( ) ( )( )67.05.0
55.0log4343.012.00 log4343.055
qMpph r
rr
××
××-×=-
-×-
(14)
The corrected HTC of the nucleate boiling is calculated as:
cnb Fhh ×= 0 (15)
The overall flow boiling HTC according to the Liu-Winterton model is then evaluated according to equation (8).
COMPARISONS BETWEEN SELECTED MODELS AND THE EXPERIMENTAL DATA
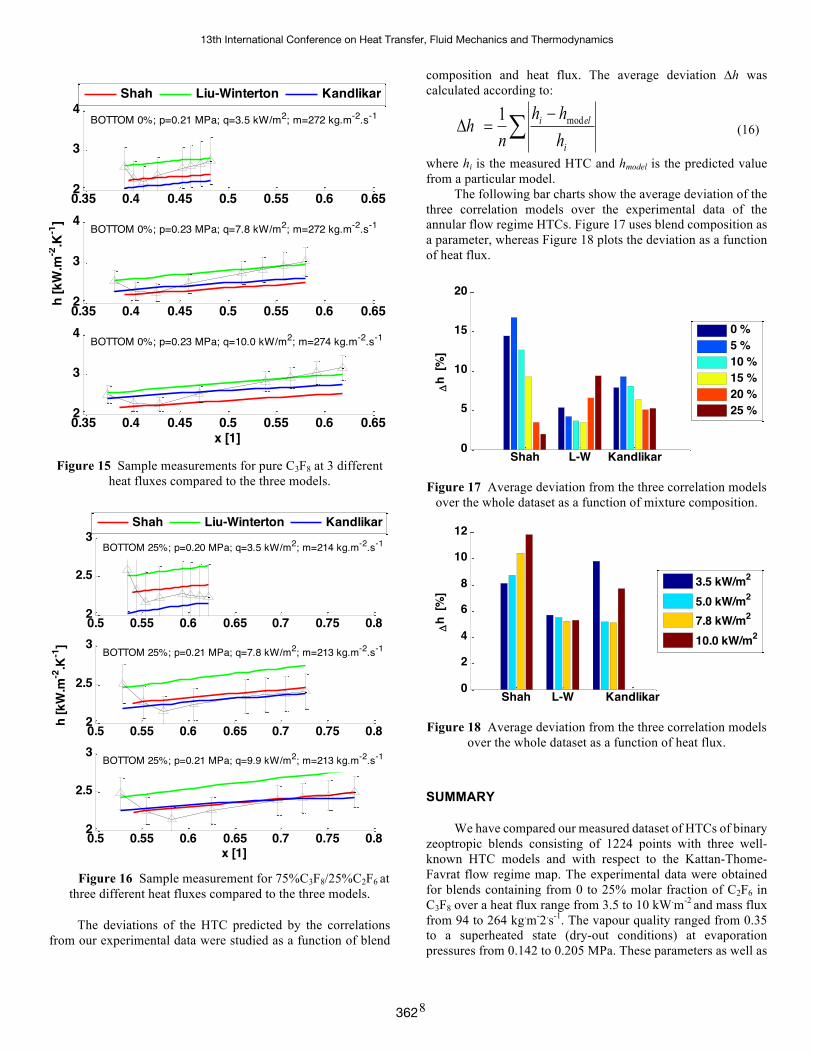
Figure 15 and Figure 16 compare the local HTC predicted by the three selected models with our experimental data. The horizontal axis denotes the vapour quality along the evaporator tube. Each figure contains three plots for three different heat fluxes: 3.5, 7.5 and 10 kW.m-2. Figure 15 corresponds to data obtained with pure C3F8 whereas Figure 16 contains data obtained with the 25% blend. It is apparent that none of the models predicted the initial decrease of the heat transfer in the first third of the evaporator. On the other hand, the subsequent steady increase is predicted by the models quite accurately, especially for the 25% blend.
1 1.2 1.4 1.6 1.8 25
10
15
f parameter value
Dh
[%]
Pure C3F8
All data
13th International Conference on Heat Transfer, Fluid Mechanics and Thermodynamics
361
8
Figure 15 Sample measurements for pure C3F8 at 3 different
heat fluxes compared to the three models.
Figure 16 Sample measurement for 75%C3F8/25%C2F6 at
three different heat fluxes compared to the three models.
The deviations of the HTC predicted by the correlations from our experimental data were studied as a function of blend
composition and heat flux. The average deviation ∆h was calculated according to:
å -=D
i
eli
hhh
nh mod1
(16)
where hi is the measured HTC and hmodel is the predicted value from a particular model.
The following bar charts show the average deviation of the three correlation models over the experimental data of the annular flow regime HTCs. Figure 17 uses blend composition as a parameter, whereas Figure 18 plots the deviation as a function of heat flux.
Figure 17 Average deviation from the three correlation models
over the whole dataset as a function of mixture composition.
Figure 18 Average deviation from the three correlation models
over the whole dataset as a function of heat flux.
SUMMARY
We have compared our measured dataset of HTCs of binary zeoptropic blends consisting of 1224 points with three well-known HTC models and with respect to the Kattan-Thome-Favrat flow regime map. The experimental data were obtained for blends containing from 0 to 25% molar fraction of C2F6 in C3F8 over a heat flux range from 3.5 to 10 kW.m-2
and mass flux from 94 to 264 kg.m-2.s-1. The vapour quality ranged from 0.35 to a superheated state (dry-out conditions) at evaporation pressures from 0.142 to 0.205 MPa. These parameters as well as
0.35 0.4 0.45 0.5 0.55 0.6 0.652
3
4Shah Liu-Winterton Kandlikar
0.35 0.4 0.45 0.5 0.55 0.6 0.652
3
4
h [k
W.m
-2.K
-1]
0.35 0.4 0.45 0.5 0.55 0.6 0.652
3
4
x [1]
BOTTOM 0%; p=0.21 MPa; q=3.5 kW/m2; m=272 kg.m-2.s-1
BOTTOM 0%; p=0.23 MPa; q=7.8 kW/m2; m=272 kg.m-2.s-1
BOTTOM 0%; p=0.23 MPa; q=10.0 kW/m2; m=274 kg.m-2.s-1
0.5 0.55 0.6 0.65 0.7 0.75 0.82
2.5
3Shah Liu-Winterton Kandlikar
0.5 0.55 0.6 0.65 0.7 0.75 0.82
2.5
3
h [k
W.m
-2.K
-1]
0.5 0.55 0.6 0.65 0.7 0.75 0.82
2.5
3
x [1]
BOTTOM 25%; p=0.20 MPa; q=3.5 kW/m2; m=214 kg.m-2.s-1
BOTTOM 25%; p=0.21 MPa; q=7.8 kW/m2; m=213 kg.m-2.s-1
BOTTOM 25%; p=0.21 MPa; q=9.9 kW/m2; m=213 kg.m-2.s-1
Shah L-W Kandlikar0
5
10
15
20
Dh
[%]
0 %5 %10 %15 %20 %25 %
Shah L-W Kandlikar0
2
4
6
8
10
12
Dh
[%]
3.5 kW/m2
5.0 kW/m2
7.8 kW/m2
10.0 kW/m2
13th International Conference on Heat Transfer, Fluid Mechanics and Thermodynamics
362
9
the evaporator geometry (horizontal tube 820 mm long, 4 mm diameter) were chosen to correspond to the real cooling situation inside the ATLAS semiconductor tracker (“SCT”). Large values of heat flux and vapour quality (beyond the normal operating envelope of the detector cooling) were investigated in order to establish the safety margin for SCT operation.
The Kattan-Thome-Favrat flow map shows good conformity with our experimental data. The mass flux range of our experimental data spans the stratified and annular flow regime in the flow map. Fully developed annular flow regime was observed at mass fluxes above 200 kg.m-2s-1.
The flow regimes in our evaporator were determined from the HTC at the top of the horizontal evaporator. We observed high HTCs at the top of the evaporator at the high end of the mass flux range and a gradual decrease with lowering mass flux while the HTC on the lower part of the evaporator tube remained relatively high.
Mass fluxes above 200 kg.m-2.s-1 resulted in the annular flow regimes where we observed moderate values of HTC in the range from 2-3 kW.m-2.K-1 on the whole perimeter of the tube. At lower mass fluxes the liquid tended to pool at the bottom of the horizontal pipe and the flow was stratified with the HTC dropping as low as 0.3 kW.m-2.K-1
on the top of the evaporator while the bottom HTC remain between 1 and 1.5 kW.m-2.K-1.
We compared our data to nine well known correlations, out of which three provided better than 10% accuracy, as compared to our dataset.
The first and simplest (Shah) correlation showed the highest deviation of 15% for pure C3F8 and 5% blend. Even though the deviation decreased sharply with increasing C2F6 composition the average deviation was the worst from the three selected correlations.
The Kandlikar correlation was more precise, provided that the optimal value of the fluid specific parameter f=1.6 was used. However, this fluid-specific parameter had to be fitted to our dataset. The average deviation was around 7%.
The Liu-Winterton correlation with the Thome suppression factor for boiling zeotropic mixtures provided the best agreement with our data covering the annular flow regime. The average deviation was 5%.
The aim of our study was to select relatively simple and easy to use correlations that could provide reliable prediction of HTC of the C3F8/C2F6 blends in the ATLAS cooling structures.
We conclude that the investigated correlation models for local flow boiling HTC can be used with C3F8/C2F6 blends up to and including 25% molar /C2F6 concentration for the annular flow regime under the evaporator geometry and heat and mass fluxes similar to those in our study. These correlations can be used alongside the Kattan-Thome-Favrat flow map, which proved reliable in predicting the transition between annular and stratified flow regime.
ACKNOWLEDGEMENTS
This research was carried out through the participation of the authors in the CERN ATLAS collaboration. M. Doubek, M. Haubner, D. Houska and V. Vacek acknowledge also support from the Department of Physics of the Faculty of Mechanical
Engineering at the Czech Technical University in Prague and through grants MSMT No.:1501601D000 LM2015058 and SGS15/185/OHK2/3T/12.
REFERENCES
[1] D. Attree, et al., The evaporative cooling system for the ATLAS inner detector, Journal of Instrumentation 3 (07), Paper number P07003, 2008.
[2] C. M. S. Collaboration, and R. Adolphi, The CMS experiment at the CERN LHC, Journal of Instrumentation 3 (08), Paper number S08004, 2008.
[3] A. Pepato, et al., The mechanics and cooling system of the ALICE silicon pixel detector, Nuclear Instruments and Methods in Physics Research Section A: Accelerators, Spectrometers, Detectors and Associated Equipment 565 (1), 2006, pp. 6-12
[4] G. Antchev, et al., The TOTEM detector at LHC, Nuclear Instruments and Methods in Physics Research Section A: Accelerators, Spectrometers, Detectors and Associated Equipment 617 (1), 2010, pp. 62-66
[5] ATLAS Collaboration, Operation and performance of the ATLAS semiconductor tracker, Journal of Instrumentation 9 (8), Paper number P08009, 2014.
[6] A. Abdesselam, et al., The integration and engineering of the ATLAS SemiConductor Tracker barrel, Journal of Instrumentation 3 (10), Paper number P10006, 2008.
[7] R. Bates, et al., The cooling capabilities of C2F6/C3F8 saturated fluorocarbon blends for the ATLAS silicon tracker, Journal of Instrumentation 10 (03), Paper number P03027, 2015.
[8] E. Lemmon, M. Huber, M. McLinden, Standard reference database 23 reference fluid thermodynamic and transport properties-REFPROP, software version 9.0, Maryland, United States: National Institute of Standards and Technology, 2010.
[9] R. Bates, et al., A combined ultrasonic flow meter and binary vapour mixture analyzer for the ATLAS silicon tracker, Journal of Instrumentation 8 (02), Paper number P02006, 2013.
[10] V. Vacek, M. Vítek, M. Doubek, Velocity of sound in Perfluoropropane (C3F8), Perfluoroethane (C2F6) and their mixtures, Fluid Phase Equilibria 351, 2013, pp. 53-60
[11] M. Doubek and V. Vacek, Speed of Sound Data in Pure Refrigerants R-116 and R-218 and Their Mixtures: Experiment and Modelling, J. Chem. Eng. Data, 61 (12), pp. 4046–4056, 2016
[12] John G. Collier, John R. Thome, Convective boiling and condensation, 3rd ed., Oxford University Press, New York, ISBN: 0198562829, 1994.
[13] N. Kattan; J. R. Thome; D. Favrat J., Flow Boiling in Horizontal Tubes: Part 2—New Heat Transfer Data for Five Refrigerants, Heat Transfer, 120 (1), 1998, pp. 148-155
[14] N. Kattan; J. R. Thome; D. Favrat J., Flow Boiling in Horizontal Tubes: Part 3—Development of a New Heat Transfer Model Based on Flow Pattern, Heat Transfer, 120 (1), 1998, pp. 156-165
[15] M. M. Shah, Chart correlation for saturated boiling heat transfer: equations and further study, ASHRAE Transactions, 88, 1982, pp. 185-196,
[16] G.M. Lazarek, S.H. Black, Evaporative heat transfer pressure drop and critical heat flux in a small vertical tube with R-113, Int. J. Heat and Mass Transfer, 25, 1982, pp. 945-960
[17] S. G. Kandlikar, General correlation for saturated two-phase flow boiling heat transfer inside horizontal and vertical tubes, Journal of Heat Transfer, vol. 112 (1), 1990, pp. 219–228
[18] Z. Liu and R. H. S. Winterton, A general correlation for saturated and subcooled flow boiling in tubes and annuli, based on a nucleate
13th International Conference on Heat Transfer, Fluid Mechanics and Thermodynamics
363
10
pool boiling equation, International Journal of Heat and Mass Transfer, vol. 34 (11), 1991, pp. 2759–2766
[19] Tran, T., Wambsganss, M.W., France, D.M., Small circular- and rectangular channel boiling with two refrigerants, Int. J. Multiphase Flow, 22, 1996, pp. 485-498
[20] Kew, P.A., Cornwell, K., Correlationvs for prediction of boiling heat transfer in small-diameter channels, Applied Thermal Engineering, 17, 1997, pp. 705-71
[21] Yu, W., France, D.M., Wambsganss, M.W., Hull, J., Two-phase pressure drop, boiling heat transfer and critical heat flux to water in a small-diameter horizontal tube, Int. J. Multiphase Flow, 28, 2002, pp. 927-941
[22] Bertsch, S.S., Groll, E.A., Garimella, S.V., A composite heat transfer correlation for saturated flow boiling in small channels, Int. J. Heat and Mass Transfer, 52, 2009, pp. 2110-2118
[23] Sun, L, Mishima, K., An evaluation of prediction methods for saturated flow boiling heat transfer in mini-channels, Int. J. Heat and Mass Transfer, 52, 2009, pp. 5323-5329
[24] N. Kattan; J. R. Thome, D. Favrat J., [III] Flow Boiling in Horizontal Tubes: Part 3—Development of a New Heat Transfer Model Based on Flow Pattern, Heat Transfer, 120 (1), 1998, pp. 156-165
[25] M. G. Cooper, Saturation Nucleate Pool Boiling, In the 1st U.K. National Conference on Heat Transfer (Industrial and Chemical Engineering Symposium Series No. 86), 2, 1984, pp. 785-793
13th International Conference on Heat Transfer, Fluid Mechanics and Thermodynamics
364