EXPERIMENTAL EXAMINATION OF THE THERMOACOUSTIC INSTABILITY OF A LOW SWIRL FLAME WITH PLANAR LASER...
19
EXPERIMENTAL EXAMINATION OF THE THERMOACOUSTIC INSTABILITY OF A LOW SWIRL FLAME WITH PLANAR LASER INDUCED FLUORESCENCE OF OH Jianan Zhang, Kelsey Kaufman, and Albert Ratner Department of Mechanical and Industrial Engineering The University of Iowa June 2014
-
Upload
flora-powers -
Category
Documents
-
view
214 -
download
1
Transcript of EXPERIMENTAL EXAMINATION OF THE THERMOACOUSTIC INSTABILITY OF A LOW SWIRL FLAME WITH PLANAR LASER...
EXPERIMENTAL EXAMINATION OF THE THERMOACOUSTIC INSTABILITY OF A
LOW SWIRL FLAME WITH PLANAR LASER INDUCED FLUORESCENCE OF OH
Jianan Zhang, Kelsey Kaufman, and
Albert Ratner
Department of Mechanical and Industrial Engineering
The University of Iowa
June 2014

Outline
Motivation
Combustion Heat Release Measurement
Methods
Experimental System
Results and Discussion
Acknowledgements
Outline
Motivation
Combustion Heat Release Measurement
Methods
Experimental System
Results and Discussion
Acknowledgements
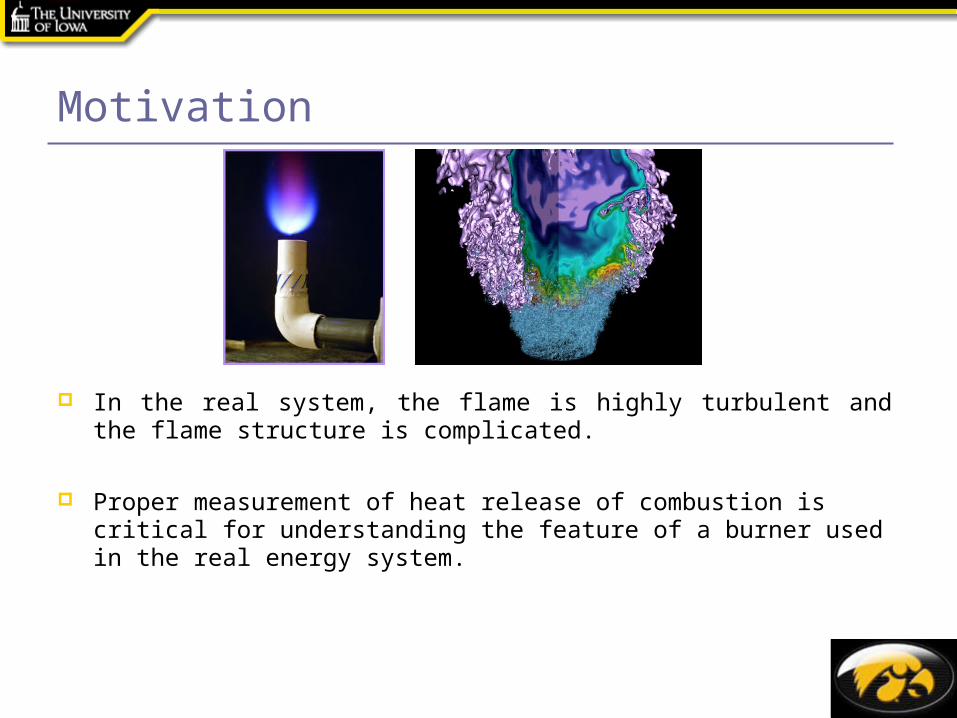
Motivation
In the real system, the flame is highly turbulent and the flame structure is complicated.
Proper measurement of heat release of combustion is critical for understanding the feature of a burner used in the real energy system.
Motivation
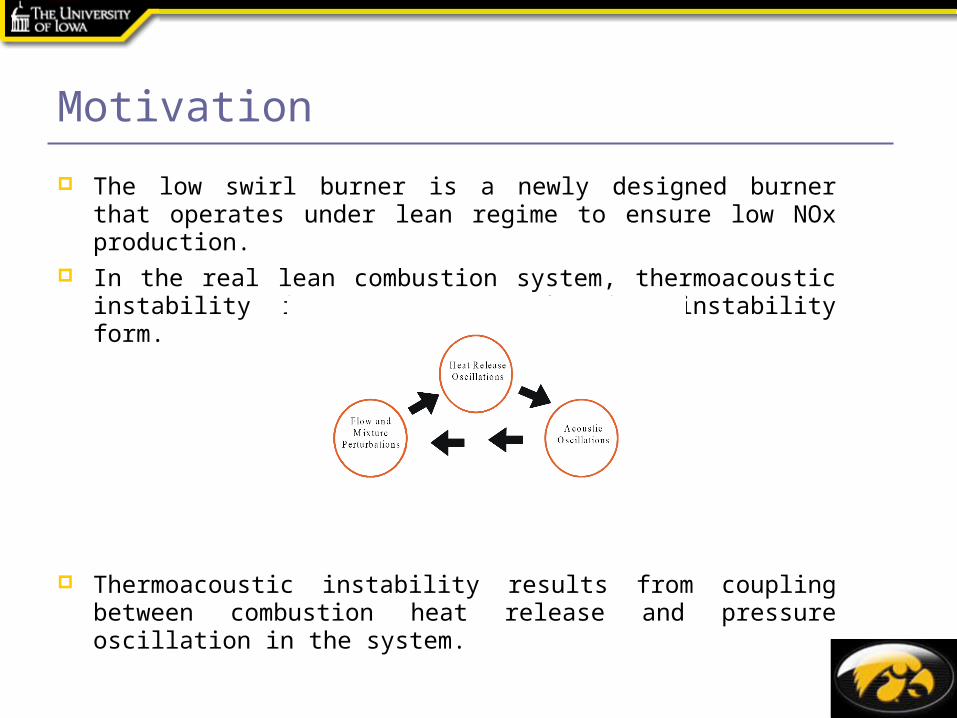
The low swirl burner is a newly designed burner that operates under lean regime to ensure low NOx production.
In the real lean combustion system, thermoacoustic instability is a common combustion instability form.
Thermoacoustic instability results from coupling between combustion heat release and pressure oscillation in the system.
Outline
Motivation
Combustion Heat Release Measurement
Methods
Experimental System
Results and Discussion
Acknowledgements
Chemiluminescence Measurement
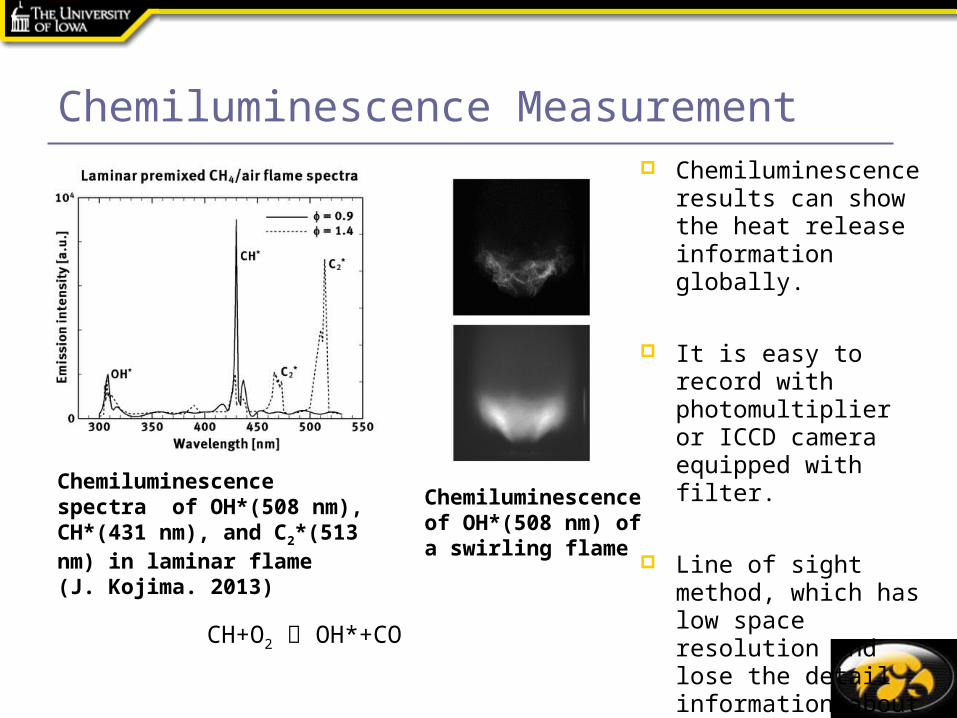
Chemiluminescence spectra of OH*(508 nm), CH*(431 nm), and C2*(513 nm) in laminar flame (J. Kojima. 2013)
CH+O2 OH*+CO
Chemiluminescence of OH*(508 nm) of a swirling flame
Chemiluminescence results can show the heat release information globally.
It is easy to record with photomultiplier or ICCD camera equipped with filter.
Line of sight method, which has low space resolution and lose the detail information about the flame structure
Planar Laser Induced Fluorescence of OH
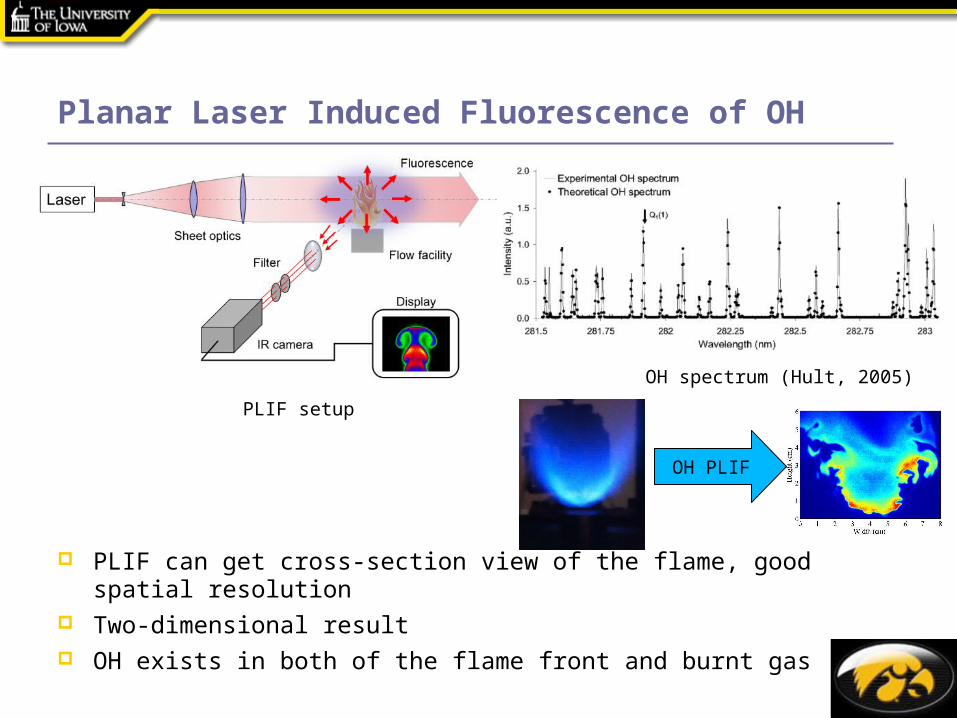
PLIF can get cross-section view of the flame, good spatial resolution
Two-dimensional result OH exists in both of the flame front and burnt gas
OH spectrum (Hult, 2005)
PLIF setup
OH PLIF
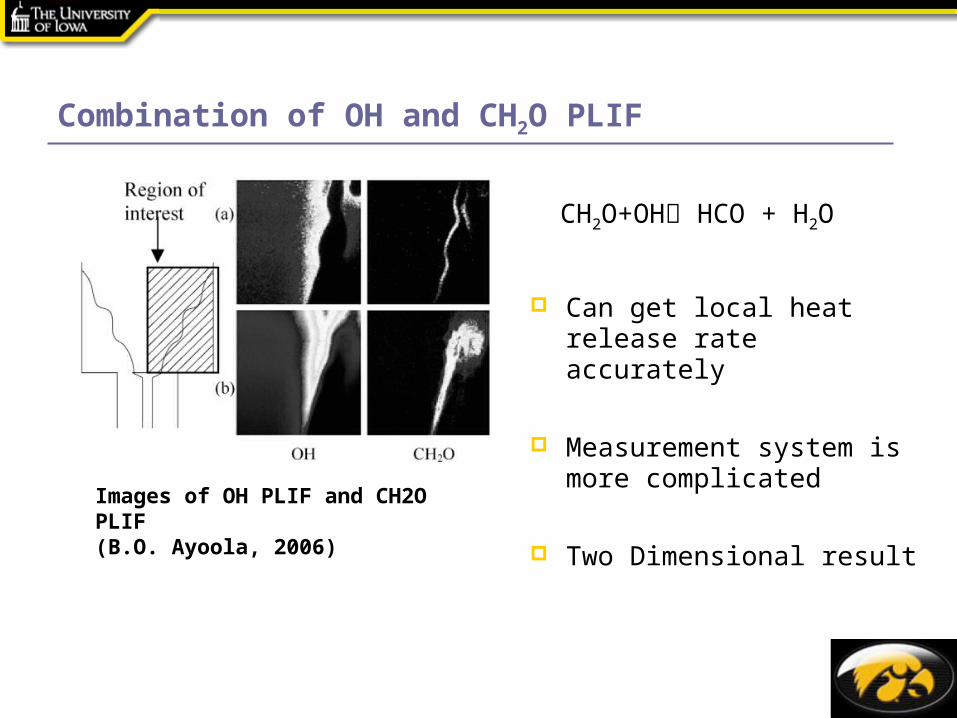
Combination of OH and CH2O PLIF
CH2O+OH HCO + H2O
Can get local heat release rate accurately
Measurement system is more complicated
Two Dimensional resultImages of OH PLIF and CH2O PLIF(B.O. Ayoola, 2006)

Outline
Motivation
Combustion Heat Release Measurement
Methods
Experimental System
Results and Discussion
Acknowledgements
Experimental System
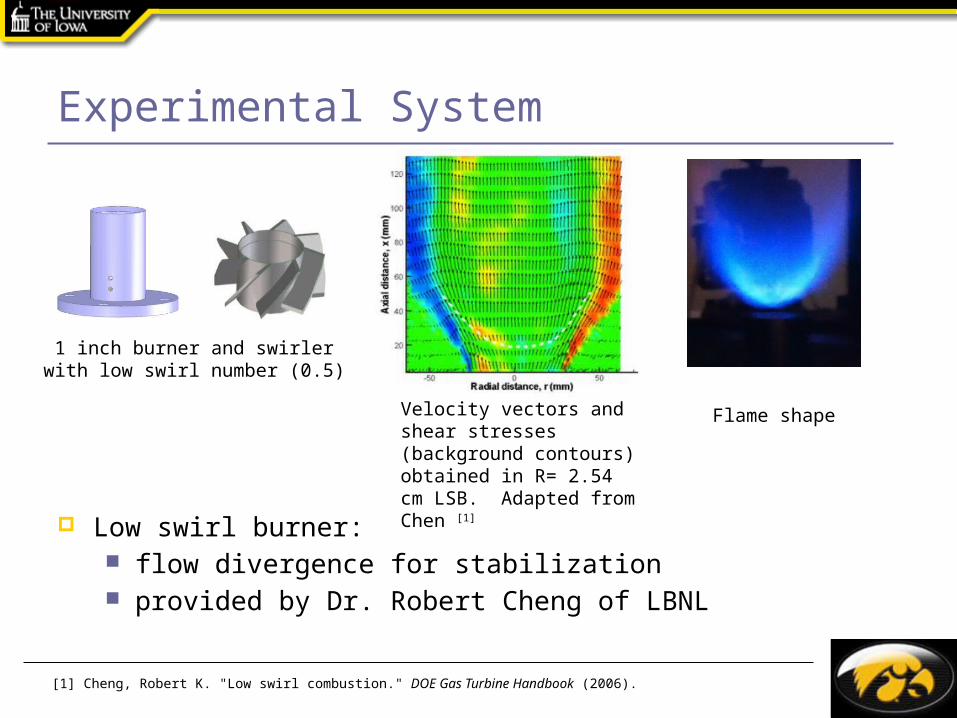
Low swirl burner: flow divergence for stabilization provided by Dr. Robert Cheng of LBNL
1 inch burner and swirler with low swirl number (0.5)
Flame shapeVelocity vectors and shear stresses (background contours) obtained in R= 2.54 cm LSB. Adapted from Chen [1]
[1] Cheng, Robert K. "Low swirl combustion." DOE Gas Turbine Handbook (2006).
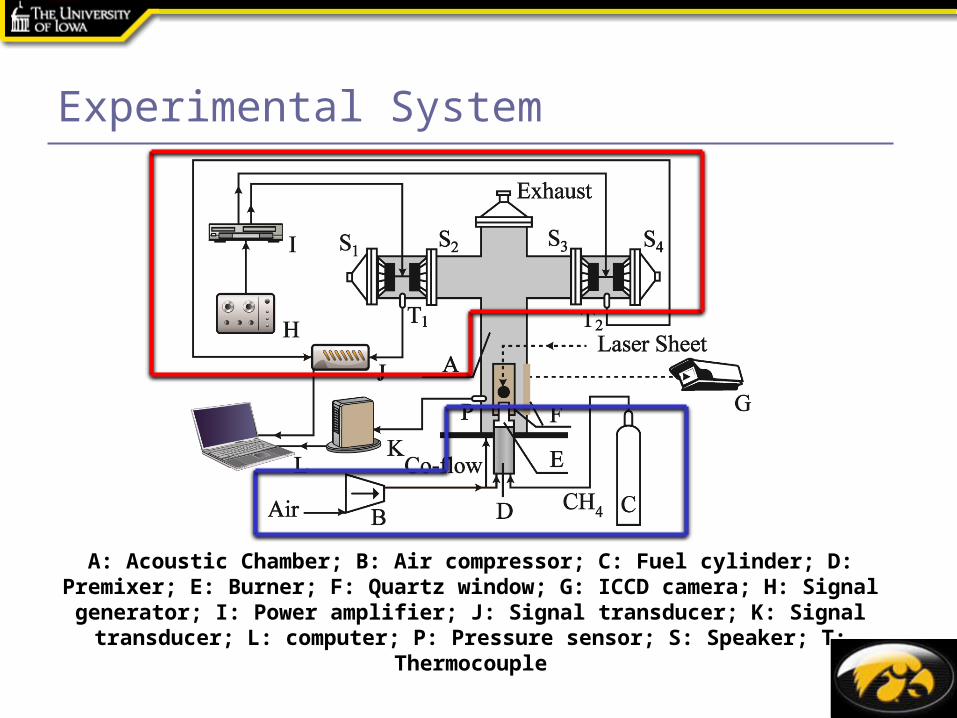
A: Acoustic Chamber; B: Air compressor; C: Fuel cylinder; D: Premixer; E: Burner; F: Quartz window; G: ICCD camera; H: Signal generator; I: Power amplifier; J: Signal transducer; K:
Signal transducer; L: computer; P: Pressure sensor; S: Speaker; T: Thermocouple
Experimental System
Experimental System
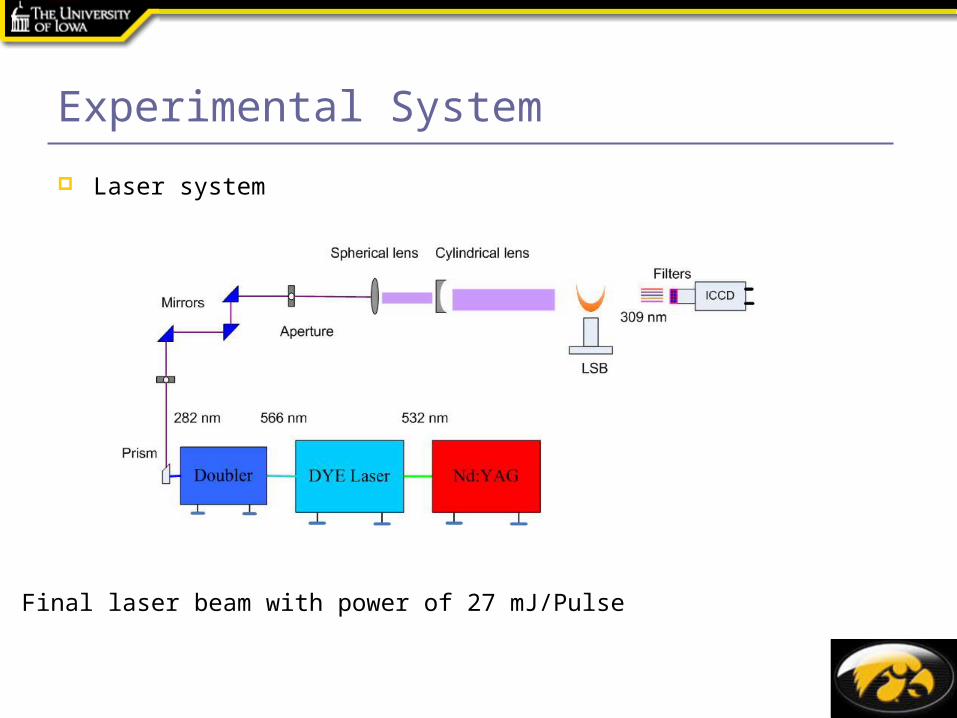
Laser system
Final laser beam with power of 27 mJ/Pulse
Outline
Motivation
Combustion Heat Release Measurement
Methods
Experimental System
Results and Discussion
Acknowledgements
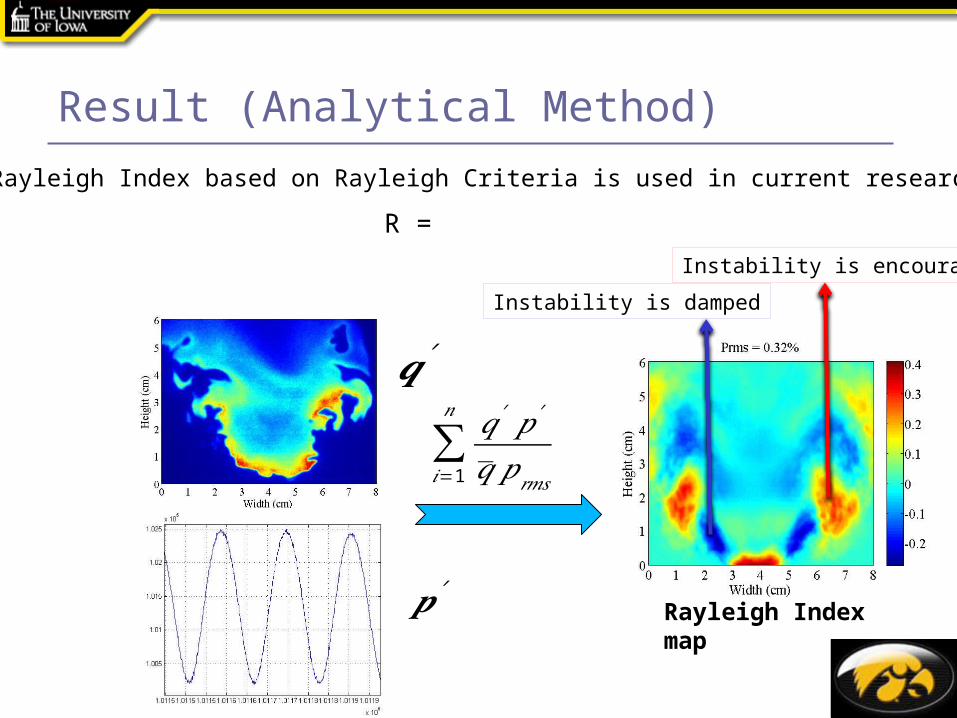
Result (Analytical Method)
∑𝑖=1
𝑛 𝑞′𝑝′
𝑞𝑝𝑟𝑚𝑠
𝒒 ′
𝒑 ′Rayleigh Index map
Rayleigh Index based on Rayleigh Criteria is used in current research.
R =
Instability is damped
Instability is encouraged
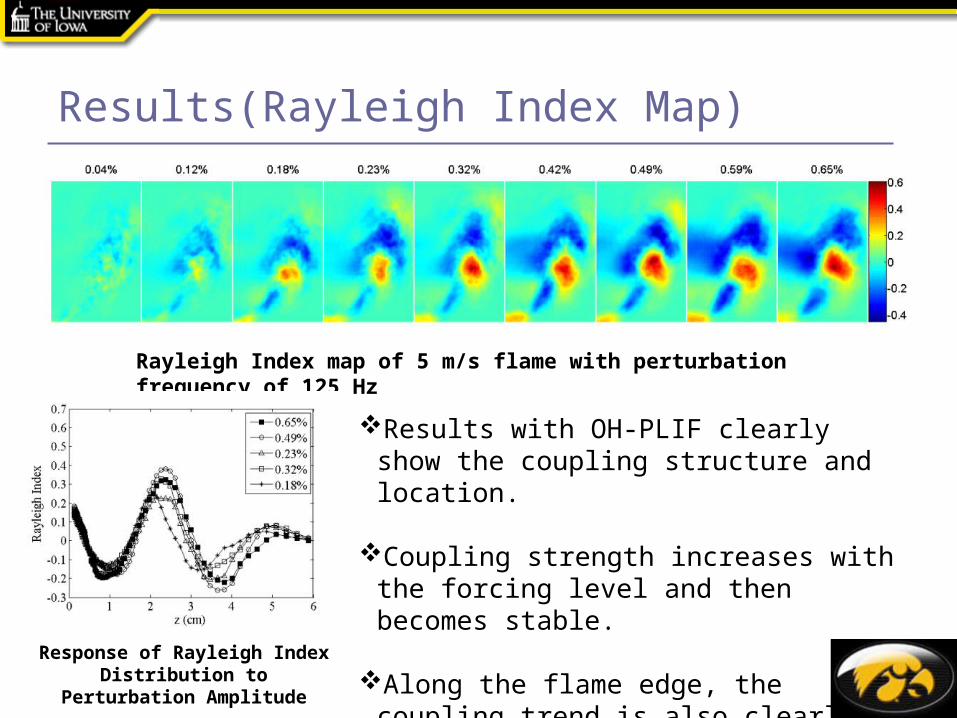
Results(Rayleigh Index Map)
Rayleigh Index map of 5 m/s flame with perturbation frequency of 125 Hz
Results with OH-PLIF clearly show the coupling structure and location.
Coupling strength increases with the forcing level and then becomes stable.
Along the flame edge, the coupling trend is also clearly illustrated. Response of Rayleigh Index
Distribution to Perturbation Amplitude
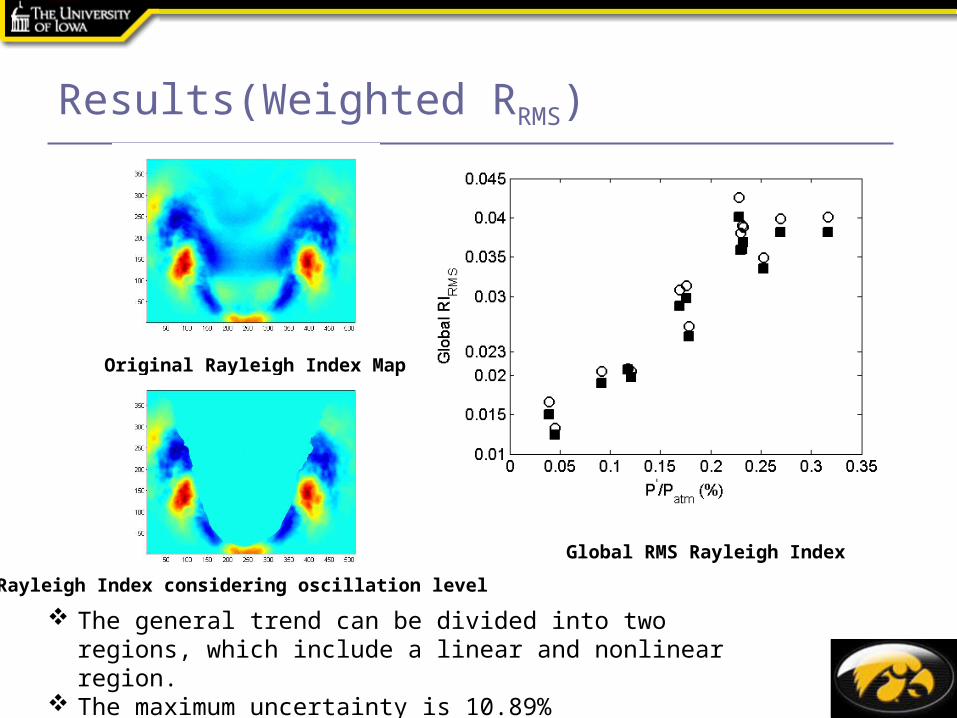
Results(Weighted RRMS)
Original Rayleigh Index Map
The general trend can be divided into two regions, which include a linear and nonlinear region.
The maximum uncertainty is 10.89%
Global RMS Rayleigh Index
Rayleigh Index considering oscillation level
Acknowledgement
Lawrence Berkeley National Laboratory for
providing the low swirl burner
The University of Iowa for financial support
and facilities

QUESTIONS?