Experimental evaluation of mixed fluid reactions between...
17
Experimental evaluation of mixed fluid reactions between supercritical carbon dioxide and NaCl brine: Relevance to the integrity of a geologic carbon repository John P. Kaszuba a, T , David R. Janecky b , Marjorie G. Snow c a Isotope and Nuclear Chemistry, Mail Stop J514, Los Alamos National Laboratory, Los Alamos, NM 87545, USA b Risk Reduction and Environmental Stewardship, Mail Stop J591, Los Alamos National Laboratory, Los Alamos, NM 87545, USA c Earth and Environmental Sciences, Mail Stop D469, Los Alamos National Laboratory, Los Alamos, NM 87545, USA Received 5 May 2003; accepted 10 December 2004 Abstract The reactive behavior of a mixed fluid (supercritical CO 2 and brine) under physical–chemical conditions relevant to geologic storage and sequestration in a carbon repository is largely unknown. Experiments were conducted in a flexible cell hydrothermal apparatus to evaluate fluid–rock (aquifer plus aquitard) reactions that may adversely impact the integrity of the repository. A 5.5 molal NaCl brine–rock system was held at 200 8C and 200 bars (20 MPa) for 32 days (772 h) to approach steady state, then injected with CO 2 and allowed to react for an additional 45 days (1079 h). In a separate experiment at 200 8C and 200 bars, the system was allowed to react for 77 days (1845 h) without injection of CO 2 . Corroded magnesite and euhedral siderite crystallized in a paragenetic sequence after CO 2 injection. Nucleation and growth of siderite on shale suggests the aquitard is a reactive component in the system. Changes in elemental abundances in the brine following addition of CO 2 include pH decrease and depletion of sodium due to accelerated growth of analcime. A pH increase follows pressure and temperature decrease and loss of saturated CO 2 from acidic brine. Silica concentrations and dissolution rates are enhanced and silica precipitation inhibited in the acidic brine. Geochemical reactions in a carbon repository extend beyond pH decrease and carbonate mineral precipitation. Rock- dominated reaction systems yield to acid-dominated and related reactions controlled by mixed fluid equilibria (i.e., a fluid- dominated system). Escape of CO 2 or migration of brine from the repository into overlying aquifers may cause silica super-saturation and increased alkalinity due to mixed fluid phase equilibria. These geochemical changes could be monitored in aquifers as indicators of repository integrity. Return of silica super-saturated brine to a rock-dominated reaction system buffered to neutral pH conditions may enhance precipitation of quartz, chalcedony, or amorphous silica. In addition to the potential effects (beneficial or deleterious) that silica super-saturation and precipitation may hold for repository performance, an understanding of the effects of multi-phase equilibrium relationships between supercritical CO 2 and dissolved silica in aquifer–brine systems also raises new questions for a variety of geologic systems. Multi-phase fluid 0009-2541/$ - see front matter D 2005 Elsevier B.V. All rights reserved. doi:10.1016/j.chemgeo.2004.12.014 T Corresponding author. Tel.: +1 505 665 7832; fax: +1 505 665 4955. E-mail address: [email protected] (J.P. Kaszuba). Chemical Geology 217 (2005) 277 – 293 www.elsevier.com/locate/chemgeo
Transcript of Experimental evaluation of mixed fluid reactions between...

www.elsevier.com/locate/chemgeo
Chemical Geology 217
Experimental evaluation of mixed fluid reactions between
supercritical carbon dioxide and NaCl brine: Relevance
to the integrity of a geologic carbon repository
John P. Kaszubaa,T, David R. Janeckyb, Marjorie G. Snowc
aIsotope and Nuclear Chemistry, Mail Stop J514, Los Alamos National Laboratory, Los Alamos, NM 87545, USAbRisk Reduction and Environmental Stewardship, Mail Stop J591, Los Alamos National Laboratory, Los Alamos, NM 87545, USA
cEarth and Environmental Sciences, Mail Stop D469, Los Alamos National Laboratory, Los Alamos, NM 87545, USA
Received 5 May 2003; accepted 10 December 2004
Abstract
The reactive behavior of a mixed fluid (supercritical CO2 and brine) under physical–chemical conditions relevant to
geologic storage and sequestration in a carbon repository is largely unknown. Experiments were conducted in a flexible cell
hydrothermal apparatus to evaluate fluid–rock (aquifer plus aquitard) reactions that may adversely impact the integrity of
the repository. A 5.5 molal NaCl brine–rock system was held at 200 8C and 200 bars (20 MPa) for 32 days (772 h) to
approach steady state, then injected with CO2 and allowed to react for an additional 45 days (1079 h). In a separate
experiment at 200 8C and 200 bars, the system was allowed to react for 77 days (1845 h) without injection of CO2.
Corroded magnesite and euhedral siderite crystallized in a paragenetic sequence after CO2 injection. Nucleation and growth
of siderite on shale suggests the aquitard is a reactive component in the system. Changes in elemental abundances in the
brine following addition of CO2 include pH decrease and depletion of sodium due to accelerated growth of analcime. A pH
increase follows pressure and temperature decrease and loss of saturated CO2 from acidic brine. Silica concentrations and
dissolution rates are enhanced and silica precipitation inhibited in the acidic brine.
Geochemical reactions in a carbon repository extend beyond pH decrease and carbonate mineral precipitation. Rock-
dominated reaction systems yield to acid-dominated and related reactions controlled by mixed fluid equilibria (i.e., a fluid-
dominated system). Escape of CO2 or migration of brine from the repository into overlying aquifers may cause silica
super-saturation and increased alkalinity due to mixed fluid phase equilibria. These geochemical changes could be
monitored in aquifers as indicators of repository integrity. Return of silica super-saturated brine to a rock-dominated
reaction system buffered to neutral pH conditions may enhance precipitation of quartz, chalcedony, or amorphous silica. In
addition to the potential effects (beneficial or deleterious) that silica super-saturation and precipitation may hold for
repository performance, an understanding of the effects of multi-phase equilibrium relationships between supercritical CO2
and dissolved silica in aquifer–brine systems also raises new questions for a variety of geologic systems. Multi-phase fluid
0009-2541/$ - s
doi:10.1016/j.ch
T Correspondi
E-mail addr
(2005) 277–293
ee front matter D 2005 Elsevier B.V. All rights reserved.
emgeo.2004.12.014
ng author. Tel.: +1 505 665 7832; fax: +1 505 665 4955.
ess: [email protected] (J.P. Kaszuba).
J.P. Kaszuba et al. / Chemical Geology 217 (2005) 277–293278
equilibria may, for example, account for quartz cements in some sedimentary basin sandstones and quartz vein
mineralization in some ore districts.
D 2005 Elsevier B.V. All rights reserved.
Keywords: Carbon dioxide; Geologic sequestration; Multi-phase fluids; Quartz veins; Crustal fluids
1. Introduction
A promising approach to the problem of managing
anthropogenic carbon is to store and dispose carbon
dioxide into geologic formations, including saline
aquifers, depleted petroleum reservoirs, and coal
deposits. These formations have contained fluids,
including natural gas, coal bed methane, and naturally
occurring carbon dioxide, for geologic time and possess
a capacity sufficient for disposal of many decades or
centuries worth of anthropogenic carbon dioxide
(Koide et al., 1992). In addition, these formations are
widely available and in close proximity to power
generation plants (Hitchon et al., 1999), a major source
of carbon dioxide emissions (Holloway, 1997).
Geologic formations artificially charged with car-
bon dioxide are here defined as a carbon repository.
The carbon repository is a complex structural and
stratigraphic package containing diverse geochemical
environments, brine and groundwater chemistries,
sandstone and shale compositions, lateral facies
transitions, etc. Overlying confining beds (aquitards)
must also be considered as a part of this potentially
rich reaction environment, the stability of which are
critical to long-term containment of carbon dioxide.
The environment of a carbon repository would also
span a range of depths for initial emplacement and
subsequent migration, and therefore a range of
pressures and temperatures of geochemical interest.
Pressures may range from a few bars where carbon
dioxide has migrated to the near-surface to several
hundreds of bars within the initial zone of emplace-
ment. Temperatures may range as high as 150–200
8C, depending on local and regional geothermal
gradients (Bachu, 2002, 2003). Within this environ-
ment, carbon dioxide will be in the supercritical state,
because its critical point lies at approximately 31 8Cand 74 bars (Span and Wagner, 1996), and will be
immiscible in water (Takenouchi and Kennedy, 1964).
Emplacement of carbon dioxide into a carbon
repository and the mechanisms for retention therein
are discussed in detail elsewhere (Bachu et al., 1994).
Broadly speaking, mineral precipitation can be
referred to as sequestration, whereas stratigraphic
and/or structural trapping and hydrodynamic trapping
can be termed storage. Sequestration, therefore,
implies the tying up of carbon in a geologically stable
form, whereas storage implies a potentially shorter-
term method.
Far less attention has been paid to mechanisms that
adversely impact the integrity of a carbon repository.
Lindeberg (1997) was among the first to quantita-
tively evaluate escape mechanisms of carbon dioxide
emplaced in a saline aquifer. With simple numerical
models incorporating the Darcy equation and Fick’s
law, Lindeberg (1997) attributed leakage of carbon
dioxide to gravity migration with subsequent release
through subvertical fractures and faults. More
recently, numeric simulations were used to evaluate
injection of carbon dioxide into a brine aquifer and
calculate the potential for leakage by discharge along
a fracture or fault zone (Ennis-King and Paterson,
2000; Pruess and Garcia, 2002; Saripalli and McGrail,
2002) and by caprock failure (Rutqvist and Tsang,
2002). These simulations did not evaluate the effects
of geochemical reactions (positive or negative) on
injection and leakage of carbon dioxide.
A few experimental studies do examine geochem-
ical reactions in a saline aquifer in response to injection
of carbon dioxide under repository conditions. In
numerical geochemical modeling studies that incorpo-
rate kinetic rate laws (Gunter et al., 2000; Perkins and
Gunter, 1995) and one study combining experiment
and modeling (Gunter et al., 1997), dissolution of
silicate minerals in a brine and precipitation of
carbonate are reported. In their investigation, Kaszuba
et al. (2003) identified geochemical reactions within an
experimental system at reservoir temperature and
pressure and began to identify potential failure modes
due to geochemical mechanisms.
The purpose of this study is to evaluate an
experimental brine–rock (aquifer plus aquitard) system

J.P. Kaszuba et al. / Chemical Geology 217 (2005) 277–293 279
that simulates a carbon repository for fluid–rock
reactions that may adversely impact the integrity of
the repository.Geochemical behavior ofmultiphase and
supercritical CO2 fluid in this system will defy
simplistic field sampling, assumptions and predictions
because the reactions will involve a two-phase fluid
(supercritical carbon dioxide and brine). Therefore,
evidence for fluid–rock reactions that may be detri-
mental to the repository include experimental data,
natural reaction textures on minerals comprising the
aquitard, and deleterious changes in brine chemistry. A
carbon repository will exhibit a wide range of temper-
ature and pressure, approximately 50–200 8C and 20–
1000 bars (Bachu, 2000; Benson, 2000; Carter et al.,
1998; Hitchon et al., 1999; Hurter and Pollack, 1996;
Oldenburg et al., 2001). The relatively high temperature
of 200 8C was selected for this study for consistency
with the experimentalwork ofKaszuba et al. (2003) and
so that kinetic rates of silicate reactions would be
maximized. A pressure of 200 bars (20 MPa) was
chosen for consistency with Kaszuba et al. (2003) and
accessibility for sequestration scenarios. In contrast to
the brine used by Kaszuba et al. (2003), in which Na,
Mg, and K were the predominant cations and Cl the
predominant anion, NaCl brine was used as the initial
0
200
400
600
800
1000
0 20 40
mole %
Pre
ssur
e (b
ars)
300
325
350
150
200
250
2
Fig. 1. Pressure-XCO2 phase diagram for H2O+CO2 with consolute curves
1964). Bulk compositions of the experimental reactions for brine–rock
(diamond) are also plotted. The dashed line represents the phase relationshi
and 200 bars (20 MPa).
fluid to emphasize reactions in the rock. Thus, the brines
evaluated by Kaszuba et al. (2003) and in this work
present a range of reaction potential among rock, brine,
and supercritical CO2. On one hand, carbonate mineral
may readily precipitate from Mg-rich brine containing
aqueous carbonate ion buffered by coexisting super-
critical CO2 (Kaszuba et al., 2003).On the other, theNa-
rich brine, initially devoid of divalent cations, can only
derive the cations needed for carbonate precipitation by
reaction with silicate minerals.
Evidence for reactions involving the aquitard and
potentially deleterious changes in brine chemistry
were observed in our experiments, from which a
number of clear implications can be drawn regarding
the integrity of a carbon repository. The discussion is
also extended to other geochemical systems in which
supercritical carbon dioxide may have impact.
2. Material and methods
2.1. Experimental approach
A model aquifer–aquitard geochemical system was
reacted with brine at 200 8C and 200 bars (20 MPa)
60 80 100
CO2
0
150
200
250
75
for temperatures of 150 to 350 8C (after Takenouchi and Kennedy,
(square) and supercritical CO2–brine–rock after injection of CO2
ps specific to the supercritical CO2–brine–rock experiment at 200 8C
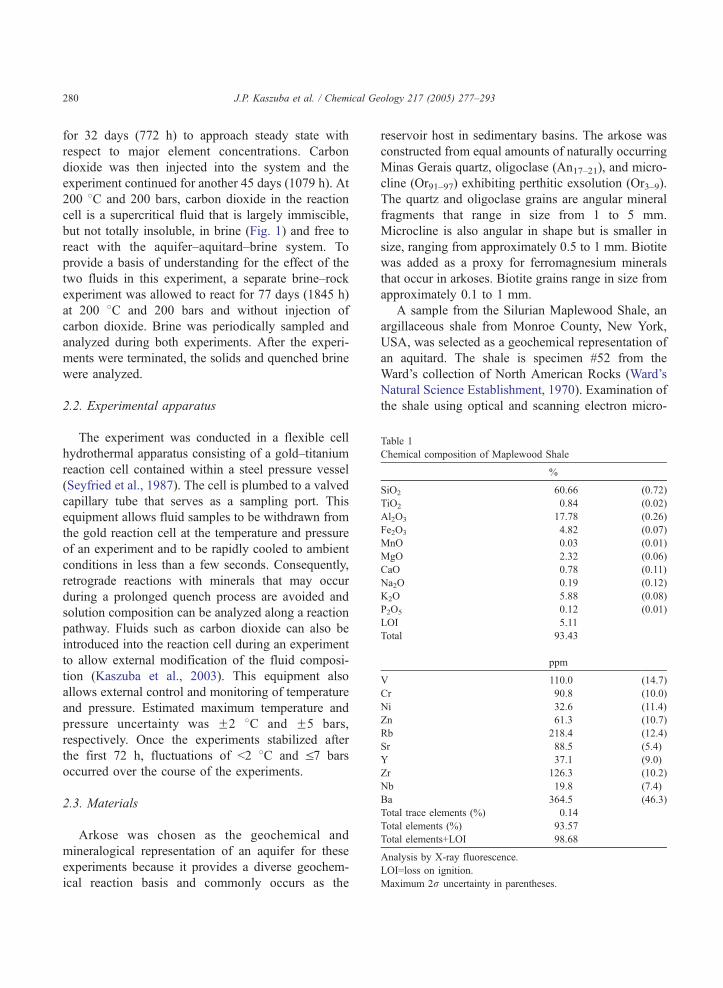
Table 1
Chemical composition of Maplewood Shale
%
SiO2 60.66 (0.72)
TiO2 0.84 (0.02)
Al2O3 17.78 (0.26)
Fe2O3 4.82 (0.07)
MnO 0.03 (0.01)
MgO 2.32 (0.06)
CaO 0.78 (0.11)
Na2O 0.19 (0.12)
K2O 5.88 (0.08)
P2O5 0.12 (0.01)
LOI 5.11
Total 93.43
ppm
V 110.0 (14.7)
Cr 90.8 (10.0)
Ni 32.6 (11.4)
Zn 61.3 (10.7)
Rb 218.4 (12.4)
Sr 88.5 (5.4)
Y 37.1 (9.0)
Zr 126.3 (10.2)
Nb 19.8 (7.4)
Ba 364.5 (46.3)
Total trace elements (%) 0.14
Total elements (%) 93.57
Total elements+LOI 98.68
Analysis by X-ray fluorescence.
LOI=loss on ignition.
Maximum 2r uncertainty in parentheses.
J.P. Kaszuba et al. / Chemical Geology 217 (2005) 277–293280
for 32 days (772 h) to approach steady state with
respect to major element concentrations. Carbon
dioxide was then injected into the system and the
experiment continued for another 45 days (1079 h). At
200 8C and 200 bars, carbon dioxide in the reaction
cell is a supercritical fluid that is largely immiscible,
but not totally insoluble, in brine (Fig. 1) and free to
react with the aquifer–aquitard–brine system. To
provide a basis of understanding for the effect of the
two fluids in this experiment, a separate brine–rock
experiment was allowed to react for 77 days (1845 h)
at 200 8C and 200 bars and without injection of
carbon dioxide. Brine was periodically sampled and
analyzed during both experiments. After the experi-
ments were terminated, the solids and quenched brine
were analyzed.
2.2. Experimental apparatus
The experiment was conducted in a flexible cell
hydrothermal apparatus consisting of a gold–titanium
reaction cell contained within a steel pressure vessel
(Seyfried et al., 1987). The cell is plumbed to a valved
capillary tube that serves as a sampling port. This
equipment allows fluid samples to be withdrawn from
the gold reaction cell at the temperature and pressure
of an experiment and to be rapidly cooled to ambient
conditions in less than a few seconds. Consequently,
retrograde reactions with minerals that may occur
during a prolonged quench process are avoided and
solution composition can be analyzed along a reaction
pathway. Fluids such as carbon dioxide can also be
introduced into the reaction cell during an experiment
to allow external modification of the fluid composi-
tion (Kaszuba et al., 2003). This equipment also
allows external control and monitoring of temperature
and pressure. Estimated maximum temperature and
pressure uncertainty was F2 8C and F5 bars,
respectively. Once the experiments stabilized after
the first 72 h, fluctuations of b2 8C and V7 bars
occurred over the course of the experiments.
2.3. Materials
Arkose was chosen as the geochemical and
mineralogical representation of an aquifer for these
experiments because it provides a diverse geochem-
ical reaction basis and commonly occurs as the
reservoir host in sedimentary basins. The arkose was
constructed from equal amounts of naturally occurring
Minas Gerais quartz, oligoclase (An17–21), and micro-
cline (Or91–97) exhibiting perthitic exsolution (Or3–9).
The quartz and oligoclase grains are angular mineral
fragments that range in size from 1 to 5 mm.
Microcline is also angular in shape but is smaller in
size, ranging from approximately 0.5 to 1 mm. Biotite
was added as a proxy for ferromagnesium minerals
that occur in arkoses. Biotite grains range in size from
approximately 0.1 to 1 mm.
A sample from the Silurian Maplewood Shale, an
argillaceous shale from Monroe County, New York,
USA, was selected as a geochemical representation of
an aquitard. The shale is specimen #52 from the
Ward’s collection of North American Rocks (Ward’s
Natural Science Establishment, 1970). Examination of
the shale using optical and scanning electron micro-
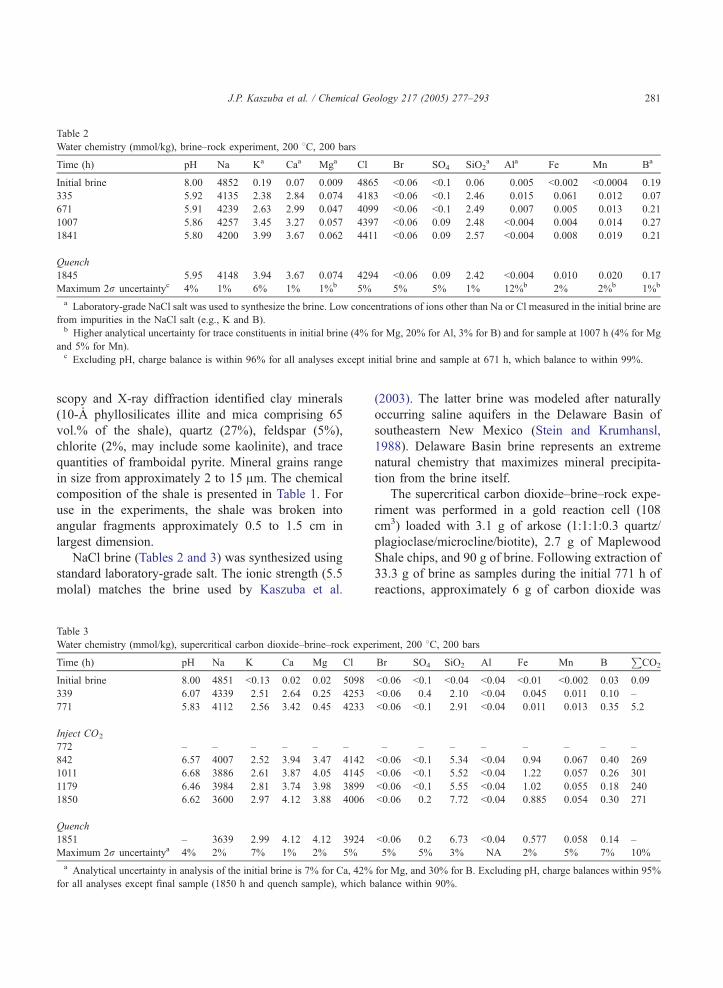
Table 2
Water chemistry (mmol/kg), brine–rock experiment, 200 8C, 200 bars
Time (h) pH Na Ka Caa Mga Cl Br SO4 SiO2a Ala Fe Mn Ba
Initial brine 8.00 4852 0.19 0.07 0.009 4865 b0.06 b0.1 0.06 0.005 b0.002 b0.0004 0.19
335 5.92 4135 2.38 2.84 0.074 4183 b0.06 b0.1 2.46 0.015 0.061 0.012 0.07
671 5.91 4239 2.63 2.99 0.047 4099 b0.06 b0.1 2.49 0.007 0.005 0.013 0.21
1007 5.86 4257 3.45 3.27 0.057 4397 b0.06 0.09 2.48 b0.004 0.004 0.014 0.27
1841 5.80 4200 3.99 3.67 0.062 4411 b0.06 0.09 2.57 b0.004 0.008 0.019 0.21
Quench
1845 5.95 4148 3.94 3.67 0.074 4294 b0.06 0.09 2.42 b0.004 0.010 0.020 0.17
Maximum 2r uncertaintyc 4% 1% 6% 1% 1%b 5% 5% 5% 1% 12%b 2% 2%b 1%b
a Laboratory-grade NaCl salt was used to synthesize the brine. Low concentrations of ions other than Na or Cl measured in the initial brine are
from impurities in the NaCl salt (e.g., K and B).b Higher analytical uncertainty for trace constituents in initial brine (4% for Mg, 20% for Al, 3% for B) and for sample at 1007 h (4% for Mg
and 5% for Mn).c Excluding pH, charge balance is within 96% for all analyses except initial brine and sample at 671 h, which balance to within 99%.
J.P. Kaszuba et al. / Chemical Geology 217 (2005) 277–293 281
scopy and X-ray diffraction identified clay minerals
(10-2 phyllosilicates illite and mica comprising 65
vol.% of the shale), quartz (27%), feldspar (5%),
chlorite (2%, may include some kaolinite), and trace
quantities of framboidal pyrite. Mineral grains range
in size from approximately 2 to 15 Am. The chemical
composition of the shale is presented in Table 1. For
use in the experiments, the shale was broken into
angular fragments approximately 0.5 to 1.5 cm in
largest dimension.
NaCl brine (Tables 2 and 3) was synthesized using
standard laboratory-grade salt. The ionic strength (5.5
molal) matches the brine used by Kaszuba et al.
Table 3
Water chemistry (mmol/kg), supercritical carbon dioxide–brine–rock expe
Time (h) pH Na K Ca Mg Cl
Initial brine 8.00 4851 b0.13 0.02 0.02 5098
339 6.07 4339 2.51 2.64 0.25 4253
771 5.83 4112 2.56 3.42 0.45 4233
Inject CO2
772 – – – – – –
842 6.57 4007 2.52 3.94 3.47 4142
1011 6.68 3886 2.61 3.87 4.05 4145
1179 6.46 3984 2.81 3.74 3.98 3899
1850 6.62 3600 2.97 4.12 3.88 4006
Quench
1851 – 3639 2.99 4.12 4.12 3924
Maximum 2r uncertaintya 4% 2% 7% 1% 2% 5%
a Analytical uncertainty in analysis of the initial brine is 7% for Ca, 42%
for all analyses except final sample (1850 h and quench sample), which b
(2003). The latter brine was modeled after naturally
occurring saline aquifers in the Delaware Basin of
southeastern New Mexico (Stein and Krumhansl,
1988). Delaware Basin brine represents an extreme
natural chemistry that maximizes mineral precipita-
tion from the brine itself.
The supercritical carbon dioxide–brine–rock expe-
riment was performed in a gold reaction cell (108
cm3) loaded with 3.1 g of arkose (1:1:1:0.3 quartz/
plagioclase/microcline/biotite), 2.7 g of Maplewood
Shale chips, and 90 g of brine. Following extraction of
33.3 g of brine as samples during the initial 771 h of
reactions, approximately 6 g of carbon dioxide was
riment, 200 8C, 200 bars
Br SO4 SiO2 Al Fe Mn BP
CO2
b0.06 b0.1 b0.04 b0.04 b0.01 b0.002 0.03 0.09
b0.06 0.4 2.10 b0.04 0.045 0.011 0.10 –
b0.06 b0.1 2.91 b0.04 0.011 0.013 0.35 5.2
– – – – – – – –
b0.06 b0.1 5.34 b0.04 0.94 0.067 0.40 269
b0.06 b0.1 5.52 b0.04 1.22 0.057 0.26 301
b0.06 b0.1 5.55 b0.04 1.02 0.055 0.18 240
b0.06 0.2 7.72 b0.04 0.885 0.054 0.30 271
b0.06 0.2 6.73 b0.04 0.577 0.058 0.14 –
5% 5% 3% NA 2% 5% 7% 10%
for Mg, and 30% for B. Excluding pH, charge balances within 95%
alance within 90%.
J.P. Kaszuba et al. / Chemical Geology 217 (2005) 277–293282
injected into the reaction cell. Thus, the initial brine to
rock mass ratio was 15.5:1 and the initial brine to
carbon dioxide mass ratio was approximately 9.5:1.
The brine–rock experiment was performed in a
smaller titanium reaction cell (79 cm3) loaded with
2.2 g of arkose (1:1:1:0.3 quartz/plagioclase/micro-
cline/biotite), 1.9 g of Maplewood Shale chips, and
64.1 g of brine. The initial brine to rock mass ratio for
this experiment was also 15.5:1. No attempt was made
to control the redox state of either experiment.
2.4. Analytical methods
Hydrothermal fluids within the reaction cell were
sampled as described by Seyfried et al. (1987). Brine
samples were diluted (10�) and divided into two
subequal fractions for cation and anion analysis. To
prevent precipitation, the aliquot of brine for cation
analysis was acidified to pH 2 with nitric acid.
Dissolved Si, Ca, Mg, Na, K, and B were de-
termined by ICP-ES, dissolved Al, Fe, and Mn by
ICP-MS, and dissolved anions by ion chromatog-
raphy. Separate aliquots of brine were used for
analysis of total carbon (as carbon dioxide) by
coulometric titration (Huffmann, 1977). Mineral
precipitates were not observed in any of the samples.
Analytical results and uncertainties are reported in
Tables 2 and 3. Solids were analyzed using optical
3500
4000
4500
5000
0 500 1000 1500 2000
time (hours)
mM
/Kg
Brine + CO2
Brine
Na+inject CO2
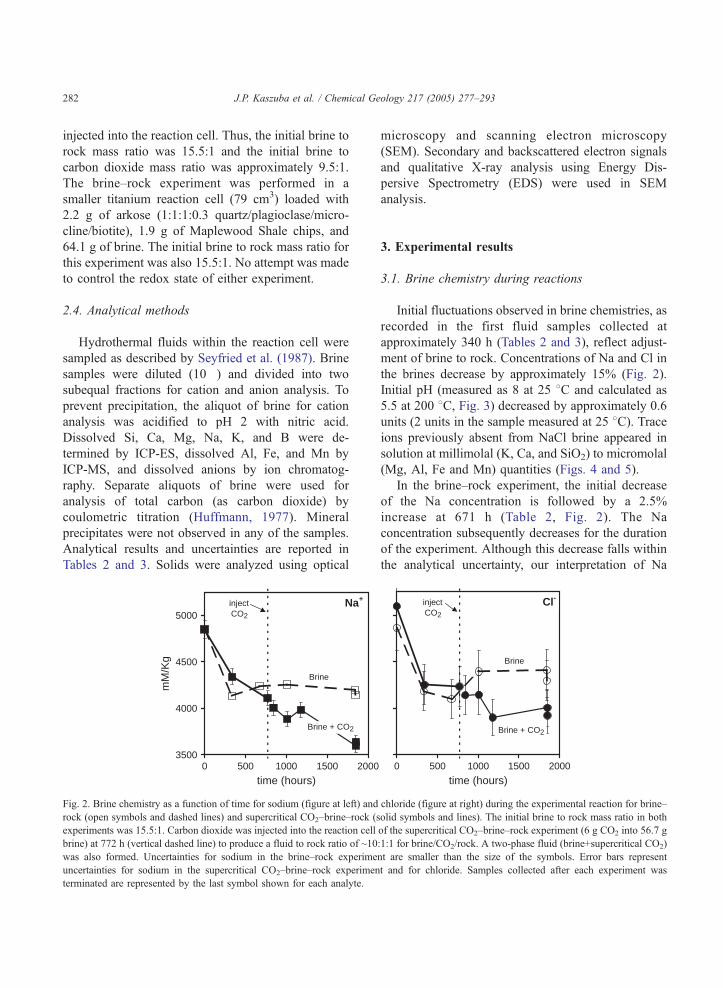
Fig. 2. Brine chemistry as a function of time for sodium (figure at left) and
rock (open symbols and dashed lines) and supercritical CO2–brine–rock (s
experiments was 15.5:1. Carbon dioxide was injected into the reaction cell
brine) at 772 h (vertical dashed line) to produce a fluid to rock ratio of ~10
was also formed. Uncertainties for sodium in the brine–rock experime
uncertainties for sodium in the supercritical CO2–brine–rock experimen
terminated are represented by the last symbol shown for each analyte.
microscopy and scanning electron microscopy
(SEM). Secondary and backscattered electron signals
and qualitative X-ray analysis using Energy Dis-
persive Spectrometry (EDS) were used in SEM
analysis.
3. Experimental results
3.1. Brine chemistry during reactions
Initial fluctuations observed in brine chemistries, as
recorded in the first fluid samples collected at
approximately 340 h (Tables 2 and 3), reflect adjust-
ment of brine to rock. Concentrations of Na and Cl in
the brines decrease by approximately 15% (Fig. 2).
Initial pH (measured as 8 at 25 8C and calculated as
5.5 at 200 8C, Fig. 3) decreased by approximately 0.6
units (2 units in the sample measured at 25 8C). Traceions previously absent from NaCl brine appeared in
solution at millimolal (K, Ca, and SiO2) to micromolal
(Mg, Al, Fe and Mn) quantities (Figs. 4 and 5).
In the brine–rock experiment, the initial decrease
of the Na concentration is followed by a 2.5%
increase at 671 h (Table 2, Fig. 2). The Na
concentration subsequently decreases for the duration
of the experiment. Although this decrease falls within
the analytical uncertainty, our interpretation of Na
0 500 1000 1500 2000
time (hours)
inject CO2
Cl-
Brine
Brine + CO2
chloride (figure at right) during the experimental reaction for brine–
olid symbols and lines). The initial brine to rock mass ratio in both
of the supercritical CO2–brine–rock experiment (6 g CO2 into 56.7 g
:1:1 for brine/CO2/rock. A two-phase fluid (brine+supercritical CO2)
nt are smaller than the size of the symbols. Error bars represent
t and for chloride. Samples collected after each experiment was
4
5
6
7
8
0 500 1000 1500 2000
Time (Hours)
pH
25oC Brine
200oC Brine
Brine
4
5
6
7
8
0 500 1000 1500 2000
Time (Hours)
Inject CO2
25oC Brine, degassed CO2
200oC Brine + supercritical CO2
Brine + CO2
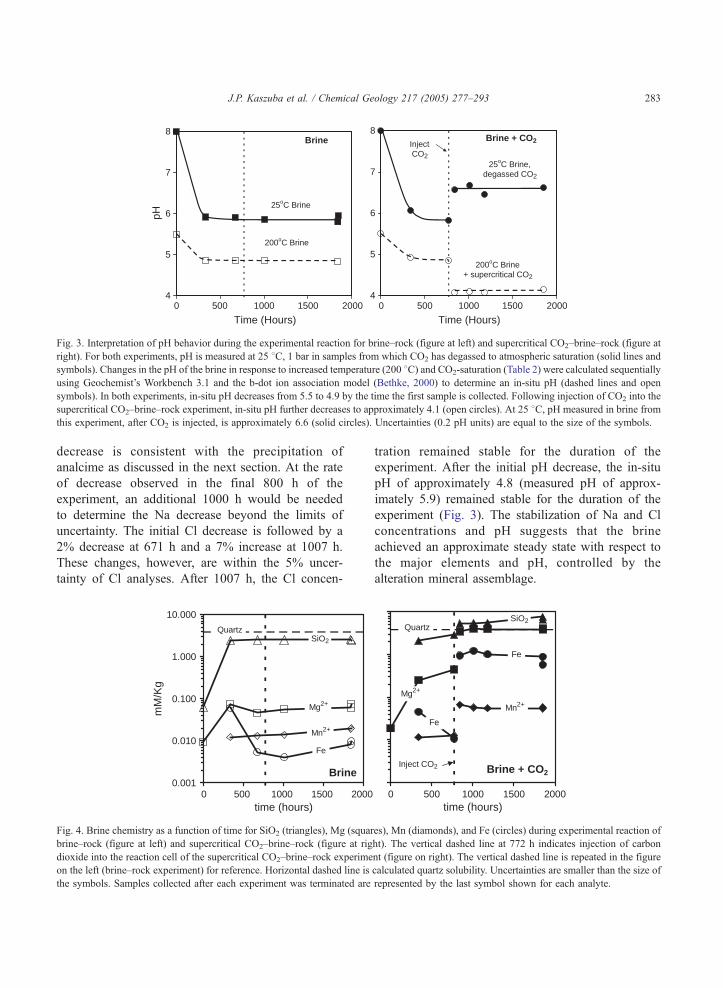
Fig. 3. Interpretation of pH behavior during the experimental reaction for brine–rock (figure at left) and supercritical CO2–brine–rock (figure at
right). For both experiments, pH is measured at 25 8C, 1 bar in samples from which CO2 has degassed to atmospheric saturation (solid lines and
symbols). Changes in the pH of the brine in response to increased temperature (200 8C) and CO2-saturation (Table 2) were calculated sequentially
using Geochemist’s Workbench 3.1 and the b-dot ion association model (Bethke, 2000) to determine an in-situ pH (dashed lines and open
symbols). In both experiments, in-situ pH decreases from 5.5 to 4.9 by the time the first sample is collected. Following injection of CO2 into the
supercritical CO2–brine–rock experiment, in-situ pH further decreases to approximately 4.1 (open circles). At 25 8C, pH measured in brine from
this experiment, after CO2 is injected, is approximately 6.6 (solid circles). Uncertainties (0.2 pH units) are equal to the size of the symbols.
J.P. Kaszuba et al. / Chemical Geology 217 (2005) 277–293 283
decrease is consistent with the precipitation of
analcime as discussed in the next section. At the rate
of decrease observed in the final 800 h of the
experiment, an additional 1000 h would be needed
to determine the Na decrease beyond the limits of
uncertainty. The initial Cl decrease is followed by a
2% decrease at 671 h and a 7% increase at 1007 h.
These changes, however, are within the 5% uncer-
tainty of Cl analyses. After 1007 h, the Cl concen-
0.001
0.010
0.100
1.000
10.000
0 500 1000 1500 2000time (hours)
mM
/Kg
QuartzSiO2
Mg2+
Fe
Mn2+
Brine
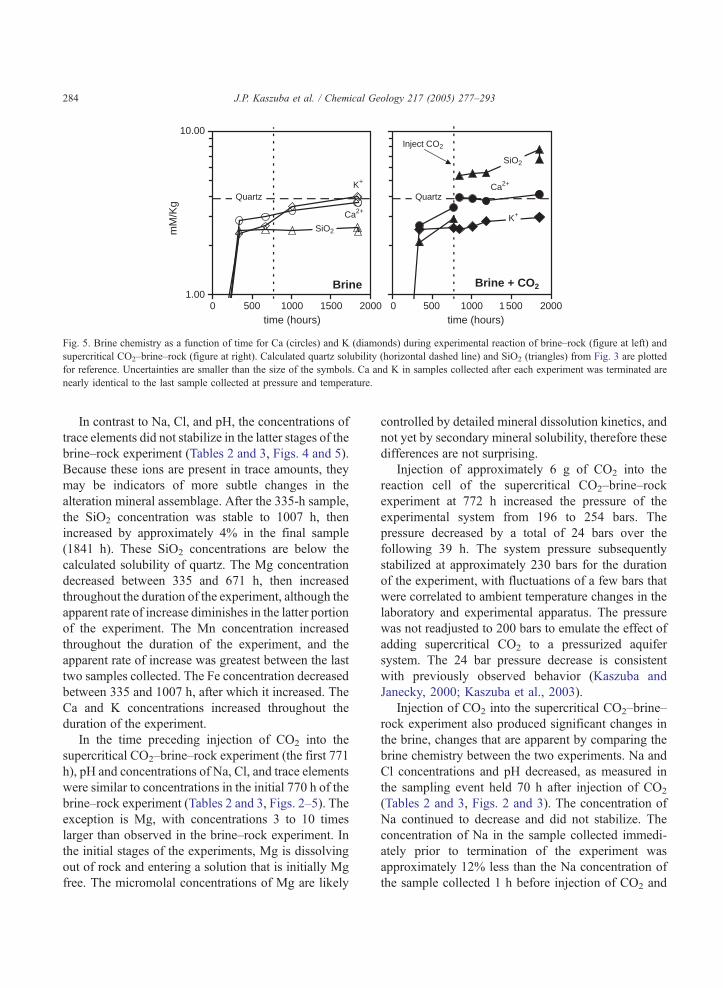
Fig. 4. Brine chemistry as a function of time for SiO2 (triangles), Mg (squar
brine–rock (figure at left) and supercritical CO2–brine–rock (figure at rig
dioxide into the reaction cell of the supercritical CO2–brine–rock experime
on the left (brine–rock experiment) for reference. Horizontal dashed line is
the symbols. Samples collected after each experiment was terminated are
tration remained stable for the duration of the
experiment. After the initial pH decrease, the in-situ
pH of approximately 4.8 (measured pH of approx-
imately 5.9) remained stable for the duration of the
experiment (Fig. 3). The stabilization of Na and Cl
concentrations and pH suggests that the brine
achieved an approximate steady state with respect to
the major elements and pH, controlled by the
alteration mineral assemblage.
0 500 1000 1500 2000time (hours)
Inject CO2
QuartzSiO2
Fe
Mg2+
Fe
Mn2+
Brine + CO2
es), Mn (diamonds), and Fe (circles) during experimental reaction of
ht). The vertical dashed line at 772 h indicates injection of carbon
nt (figure on right). The vertical dashed line is repeated in the figure
calculated quartz solubility. Uncertainties are smaller than the size of
represented by the last symbol shown for each analyte.
1.00
10.00
0 500 1000 1500 2000time (hours)
mM
/Kg
Quartz
SiO2
K+
Ca2+
Brine
0 500 1000 1500 2000time (hours)
Inject CO2
Quartz
SiO2
K+
Ca2+
Brine + CO2
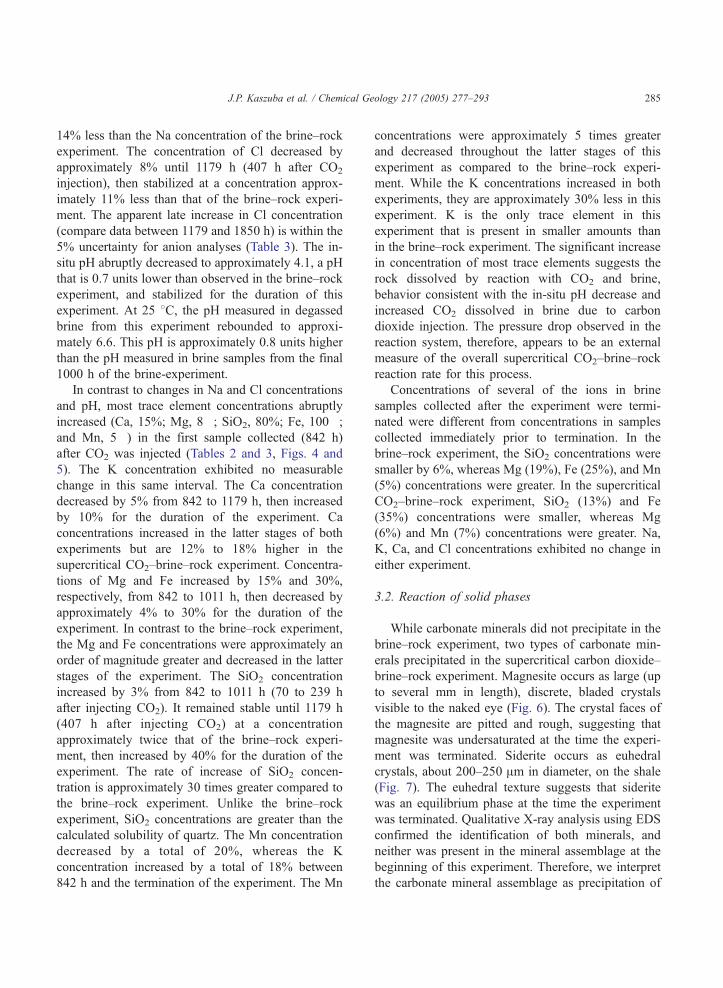
Fig. 5. Brine chemistry as a function of time for Ca (circles) and K (diamonds) during experimental reaction of brine–rock (figure at left) and
supercritical CO2–brine–rock (figure at right). Calculated quartz solubility (horizontal dashed line) and SiO2 (triangles) from Fig. 3 are plotted
for reference. Uncertainties are smaller than the size of the symbols. Ca and K in samples collected after each experiment was terminated are
nearly identical to the last sample collected at pressure and temperature.
J.P. Kaszuba et al. / Chemical Geology 217 (2005) 277–293284
In contrast to Na, Cl, and pH, the concentrations of
trace elements did not stabilize in the latter stages of the
brine–rock experiment (Tables 2 and 3, Figs. 4 and 5).
Because these ions are present in trace amounts, they
may be indicators of more subtle changes in the
alteration mineral assemblage. After the 335-h sample,
the SiO2 concentration was stable to 1007 h, then
increased by approximately 4% in the final sample
(1841 h). These SiO2 concentrations are below the
calculated solubility of quartz. The Mg concentration
decreased between 335 and 671 h, then increased
throughout the duration of the experiment, although the
apparent rate of increase diminishes in the latter portion
of the experiment. The Mn concentration increased
throughout the duration of the experiment, and the
apparent rate of increase was greatest between the last
two samples collected. The Fe concentration decreased
between 335 and 1007 h, after which it increased. The
Ca and K concentrations increased throughout the
duration of the experiment.
In the time preceding injection of CO2 into the
supercritical CO2–brine–rock experiment (the first 771
h), pH and concentrations of Na, Cl, and trace elements
were similar to concentrations in the initial 770 h of the
brine–rock experiment (Tables 2 and 3, Figs. 2–5). The
exception is Mg, with concentrations 3 to 10 times
larger than observed in the brine–rock experiment. In
the initial stages of the experiments, Mg is dissolving
out of rock and entering a solution that is initially Mg
free. The micromolal concentrations of Mg are likely
controlled by detailed mineral dissolution kinetics, and
not yet by secondary mineral solubility, therefore these
differences are not surprising.
Injection of approximately 6 g of CO2 into the
reaction cell of the supercritical CO2–brine–rock
experiment at 772 h increased the pressure of the
experimental system from 196 to 254 bars. The
pressure decreased by a total of 24 bars over the
following 39 h. The system pressure subsequently
stabilized at approximately 230 bars for the duration
of the experiment, with fluctuations of a few bars that
were correlated to ambient temperature changes in the
laboratory and experimental apparatus. The pressure
was not readjusted to 200 bars to emulate the effect of
adding supercritical CO2 to a pressurized aquifer
system. The 24 bar pressure decrease is consistent
with previously observed behavior (Kaszuba and
Janecky, 2000; Kaszuba et al., 2003).
Injection of CO2 into the supercritical CO2–brine–
rock experiment also produced significant changes in
the brine, changes that are apparent by comparing the
brine chemistry between the two experiments. Na and
Cl concentrations and pH decreased, as measured in
the sampling event held 70 h after injection of CO2
(Tables 2 and 3, Figs. 2 and 3). The concentration of
Na continued to decrease and did not stabilize. The
concentration of Na in the sample collected immedi-
ately prior to termination of the experiment was
approximately 12% less than the Na concentration of
the sample collected 1 h before injection of CO2 and
J.P. Kaszuba et al. / Chemical Geology 217 (2005) 277–293 285
14% less than the Na concentration of the brine–rock
experiment. The concentration of Cl decreased by
approximately 8% until 1179 h (407 h after CO2
injection), then stabilized at a concentration approx-
imately 11% less than that of the brine–rock experi-
ment. The apparent late increase in Cl concentration
(compare data between 1179 and 1850 h) is within the
5% uncertainty for anion analyses (Table 3). The in-
situ pH abruptly decreased to approximately 4.1, a pH
that is 0.7 units lower than observed in the brine–rock
experiment, and stabilized for the duration of this
experiment. At 25 8C, the pH measured in degassed
brine from this experiment rebounded to approxi-
mately 6.6. This pH is approximately 0.8 units higher
than the pH measured in brine samples from the final
1000 h of the brine-experiment.
In contrast to changes in Na and Cl concentrations
and pH, most trace element concentrations abruptly
increased (Ca, 15%; Mg, 8�; SiO2, 80%; Fe, 100�;
and Mn, 5�) in the first sample collected (842 h)
after CO2 was injected (Tables 2 and 3, Figs. 4 and
5). The K concentration exhibited no measurable
change in this same interval. The Ca concentration
decreased by 5% from 842 to 1179 h, then increased
by 10% for the duration of the experiment. Ca
concentrations increased in the latter stages of both
experiments but are 12% to 18% higher in the
supercritical CO2–brine–rock experiment. Concentra-
tions of Mg and Fe increased by 15% and 30%,
respectively, from 842 to 1011 h, then decreased by
approximately 4% to 30% for the duration of the
experiment. In contrast to the brine–rock experiment,
the Mg and Fe concentrations were approximately an
order of magnitude greater and decreased in the latter
stages of the experiment. The SiO2 concentration
increased by 3% from 842 to 1011 h (70 to 239 h
after injecting CO2). It remained stable until 1179 h
(407 h after injecting CO2) at a concentration
approximately twice that of the brine–rock experi-
ment, then increased by 40% for the duration of the
experiment. The rate of increase of SiO2 concen-
tration is approximately 30 times greater compared to
the brine–rock experiment. Unlike the brine–rock
experiment, SiO2 concentrations are greater than the
calculated solubility of quartz. The Mn concentration
decreased by a total of 20%, whereas the K
concentration increased by a total of 18% between
842 h and the termination of the experiment. The Mn
concentrations were approximately 5 times greater
and decreased throughout the latter stages of this
experiment as compared to the brine–rock experi-
ment. While the K concentrations increased in both
experiments, they are approximately 30% less in this
experiment. K is the only trace element in this
experiment that is present in smaller amounts than
in the brine–rock experiment. The significant increase
in concentration of most trace elements suggests the
rock dissolved by reaction with CO2 and brine,
behavior consistent with the in-situ pH decrease and
increased CO2 dissolved in brine due to carbon
dioxide injection. The pressure drop observed in the
reaction system, therefore, appears to be an external
measure of the overall supercritical CO2–brine–rock
reaction rate for this process.
Concentrations of several of the ions in brine
samples collected after the experiment were termi-
nated were different from concentrations in samples
collected immediately prior to termination. In the
brine–rock experiment, the SiO2 concentrations were
smaller by 6%, whereas Mg (19%), Fe (25%), and Mn
(5%) concentrations were greater. In the supercritical
CO2–brine–rock experiment, SiO2 (13%) and Fe
(35%) concentrations were smaller, whereas Mg
(6%) and Mn (7%) concentrations were greater. Na,
K, Ca, and Cl concentrations exhibited no change in
either experiment.
3.2. Reaction of solid phases
While carbonate minerals did not precipitate in the
brine–rock experiment, two types of carbonate min-
erals precipitated in the supercritical carbon dioxide–
brine–rock experiment. Magnesite occurs as large (up
to several mm in length), discrete, bladed crystals
visible to the naked eye (Fig. 6). The crystal faces of
the magnesite are pitted and rough, suggesting that
magnesite was undersaturated at the time the experi-
ment was terminated. Siderite occurs as euhedral
crystals, about 200–250 Am in diameter, on the shale
(Fig. 7). The euhedral texture suggests that siderite
was an equilibrium phase at the time the experiment
was terminated. Qualitative X-ray analysis using EDS
confirmed the identification of both minerals, and
neither was present in the mineral assemblage at the
beginning of this experiment. Therefore, we interpret
the carbonate mineral assemblage as precipitation of

100 um
30 um
Fig. 6. Secondary electron SEM micrograph of magnesite (figure on left) from the supercritical CO2–brine–rock experiment. Magnesite crystals
are large, up to a few mm in length, and occur as individual grains and splays. Close-up view (figure on right) illustrates pitted crystal faces
indicative of undersaturation and interpreted as dissolution of early-formed magnesite.
J.P. Kaszuba et al. / Chemical Geology 217 (2005) 277–293286
magnesite after injection of carbon dioxide, followed
by magnesite dissolution and siderite precipitation.
Silicate alteration phases observed are clay miner-
als and analcime. Secondary clay minerals are present
in abundance on surfaces of minerals comprising the
arkose and the shale. Analcime trapezohedrons are
ubiquitous to both experiments (Figs. 7 and 8) as
euhedral crystals, 20–40 Am in diameter, occurring on
the shale as well as the minerals comprising the
aquifer. Euhedral analcime is more abundant in the
40um
Fig. 7. Secondary electron SEM micrograph of siderite from the
supercritical CO2–brine–rock experiment. Siderite occurs as indi-
vidual crystals, about 200–250 Am in diameter, growing on shale.
Euhedral texture, indicative of equilibrium, is interpreted as
precipitation of siderite after early-formed magnesite. Small,
rounded grains surrounding the siderite are euhedral analcime.
,
brine–rock experiment as compared to the super-
critical CO2–brine–rock experiment. Euhedral tex-
tures suggest that analcime crystallized as an
equilibrium phase in both experiments. Analcime also
occurs as masses of skeletal crystals in the super-
critical CO2–brine–rock experiment, ranging in size
from 80 to 120 Am in diameter (Fig. 9). Skeletal
textures are interpreted as indicating acceleration of
normal crystal nucleation and growth, possibly due to
acidity in the brine or to the presence of an immiscible
supercritical carbon dioxide phase.
4. Discussion
4.1. Mixed fluid reactions and processes
In agreement with models proposed for geologic
sequestration of carbon (e.g., Gunter et al., 2000),
addition of supercritical carbon dioxide into the
experimental brine–rock (aquifer plus aquitard) sys-
tem decreased brine pH and precipitated carbonate
minerals. The pressure decrease following injection of
carbon dioxide indicates a decrease in the volume of
the system due to the phase change of supercritical
carbon dioxide, to dissolved carbonate, to mineral
carbonate. In addition to pH decrease and carbonate
mineral precipitation, a diversity of other fluid–rock
reactions took place between the mixed fluid (immis-
cible supercritical carbon dioxide plus brine, Fig. 1)
and rock that differ from the brine–rock system.
10 um
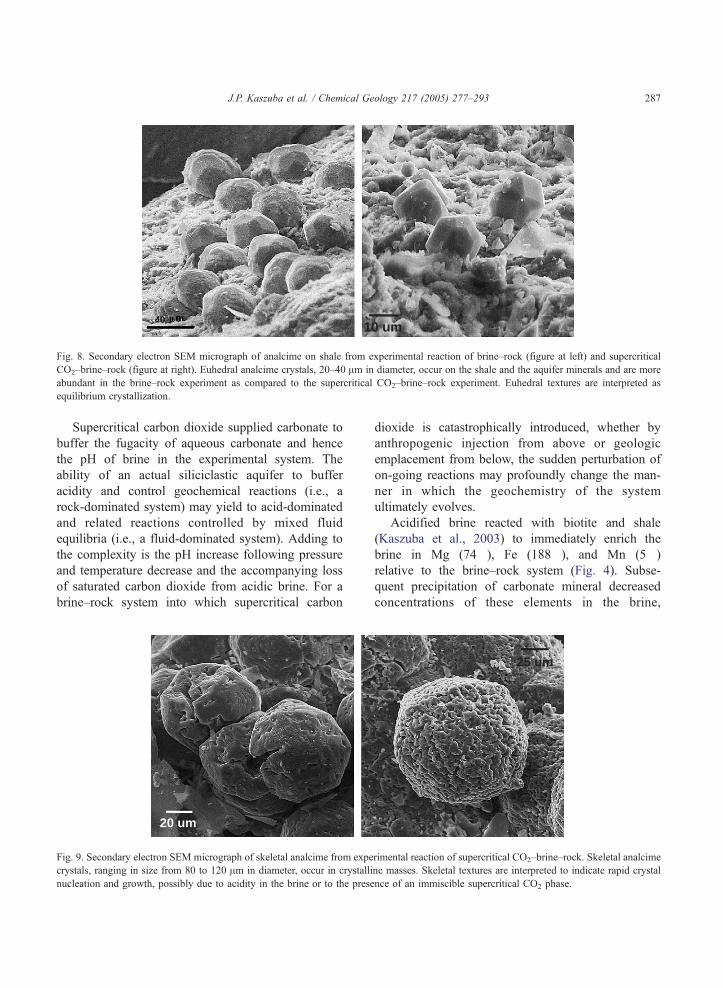
Fig. 8. Secondary electron SEM micrograph of analcime on shale from experimental reaction of brine–rock (figure at left) and supercritical
CO2–brine–rock (figure at right). Euhedral analcime crystals, 20–40 Am in diameter, occur on the shale and the aquifer minerals and are more
abundant in the brine–rock experiment as compared to the supercritical CO2–brine–rock experiment. Euhedral textures are interpreted as
equilibrium crystallization.
J.P. Kaszuba et al. / Chemical Geology 217 (2005) 277–293 287
Supercritical carbon dioxide supplied carbonate to
buffer the fugacity of aqueous carbonate and hence
the pH of brine in the experimental system. The
ability of an actual siliciclastic aquifer to buffer
acidity and control geochemical reactions (i.e., a
rock-dominated system) may yield to acid-dominated
and related reactions controlled by mixed fluid
equilibria (i.e., a fluid-dominated system). Adding to
the complexity is the pH increase following pressure
and temperature decrease and the accompanying loss
of saturated carbon dioxide from acidic brine. For a
brine–rock system into which supercritical carbon
20 um
Fig. 9. Secondary electron SEM micrograph of skeletal analcime from expe
crystals, ranging in size from 80 to 120 Am in diameter, occur in crystalli
nucleation and growth, possibly due to acidity in the brine or to the prese
dioxide is catastrophically introduced, whether by
anthropogenic injection from above or geologic
emplacement from below, the sudden perturbation of
on-going reactions may profoundly change the man-
ner in which the geochemistry of the system
ultimately evolves.
Acidified brine reacted with biotite and shale
(Kaszuba et al., 2003) to immediately enrich the
brine in Mg (74�), Fe (188�), and Mn (5�)
relative to the brine–rock system (Fig. 4). Subse-
quent precipitation of carbonate mineral decreased
concentrations of these elements in the brine,
25 um
rimental reaction of supercritical CO2–brine–rock. Skeletal analcime
ne masses. Skeletal textures are interpreted to indicate rapid crystal
nce of an immiscible supercritical CO2 phase.
3500
4000
4500
mM
/Kg
Na+
0
2
4
6
8
10
-300 0 300 600 900 1200
Time (hours) elapsed since CO2 injection
mM
/Kg
Quartz
SiO2
Chalcedony
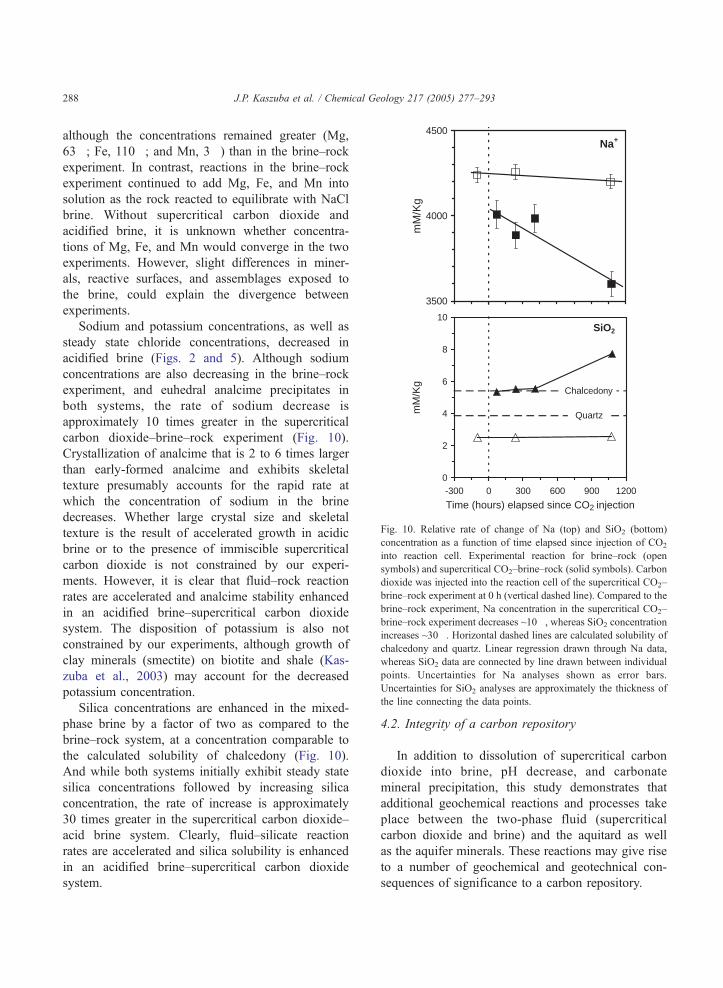
Fig. 10. Relative rate of change of Na (top) and SiO2 (bottom)
concentration as a function of time elapsed since injection of CO2
into reaction cell. Experimental reaction for brine–rock (open
symbols) and supercritical CO2–brine–rock (solid symbols). Carbon
dioxide was injected into the reaction cell of the supercritical CO2–
brine–rock experiment at 0 h (vertical dashed line). Compared to the
brine–rock experiment, Na concentration in the supercritical CO2–
brine–rock experiment decreases ~10�, whereas SiO2 concentration
increases ~30�. Horizontal dashed lines are calculated solubility of
chalcedony and quartz. Linear regression drawn through Na data
whereas SiO2 data are connected by line drawn between individua
points. Uncertainties for Na analyses shown as error bars
Uncertainties for SiO2 analyses are approximately the thickness of
the line connecting the data points.
J.P. Kaszuba et al. / Chemical Geology 217 (2005) 277–293288
although the concentrations remained greater (Mg,
63�; Fe, 110�; and Mn, 3�) than in the brine–rock
experiment. In contrast, reactions in the brine–rock
experiment continued to add Mg, Fe, and Mn into
solution as the rock reacted to equilibrate with NaCl
brine. Without supercritical carbon dioxide and
acidified brine, it is unknown whether concentra-
tions of Mg, Fe, and Mn would converge in the two
experiments. However, slight differences in miner-
als, reactive surfaces, and assemblages exposed to
the brine, could explain the divergence between
experiments.
Sodium and potassium concentrations, as well as
steady state chloride concentrations, decreased in
acidified brine (Figs. 2 and 5). Although sodium
concentrations are also decreasing in the brine–rock
experiment, and euhedral analcime precipitates in
both systems, the rate of sodium decrease is
approximately 10 times greater in the supercritical
carbon dioxide–brine–rock experiment (Fig. 10).
Crystallization of analcime that is 2 to 6 times larger
than early-formed analcime and exhibits skeletal
texture presumably accounts for the rapid rate at
which the concentration of sodium in the brine
decreases. Whether large crystal size and skeletal
texture is the result of accelerated growth in acidic
brine or to the presence of immiscible supercritical
carbon dioxide is not constrained by our experi-
ments. However, it is clear that fluid–rock reaction
rates are accelerated and analcime stability enhanced
in an acidified brine–supercritical carbon dioxide
system. The disposition of potassium is also not
constrained by our experiments, although growth of
clay minerals (smectite) on biotite and shale (Kas-
zuba et al., 2003) may account for the decreased
potassium concentration.
Silica concentrations are enhanced in the mixed-
phase brine by a factor of two as compared to the
brine–rock system, at a concentration comparable to
the calculated solubility of chalcedony (Fig. 10).
And while both systems initially exhibit steady state
silica concentrations followed by increasing silica
concentration, the rate of increase is approximately
30 times greater in the supercritical carbon dioxide–
acid brine system. Clearly, fluid–silicate reaction
rates are accelerated and silica solubility is enhanced
in an acidified brine–supercritical carbon dioxide
system.
,
l
.
4.2. Integrity of a carbon repository
In addition to dissolution of supercritical carbon
dioxide into brine, pH decrease, and carbonate
mineral precipitation, this study demonstrates that
additional geochemical reactions and processes take
place between the two-phase fluid (supercritical
carbon dioxide and brine) and the aquitard as well
as the aquifer minerals. These reactions may give rise
to a number of geochemical and geotechnical con-
sequences of significance to a carbon repository.
J.P. Kaszuba et al. / Chemical Geology 217 (2005) 277–293 289
Increased acidity of the aqueous fluids within a
carbon repository is a widely recognized and
acknowledged consequence of carbon dioxide dis-
posal (e.g., Gunter et al., 2000). The potential for
other reactions that may accompany migration of this
fluid within the repository, however, has not been
addressed. A pH increase accompanied the loss of
saturated carbon dioxide from acidic brine within the
experimental system (Fig. 3). With movement of
acidic brine to higher stratigraphic levels in a carbon
repository, or leakage into overlying strata, water–
rock reactions more characteristic of lower temper-
ature, lower pressure, and neutral or even alkaline pH
conditions become prevalent. Movement to distal
regions of the repository that remain at pressure and
temperature, yet away from the buffering influence of
the supercritical carbon dioxide and related processes
controlled by mixed fluid equilibria (i.e., a fluid-
dominated system), may return the fluid to a system of
rock-dominated reactions. As neutral pH conditions
prevail, silica super-saturated brine may precipitate
quartz, chalcedony, or amorphous silica. The same
deleterious effects that result from carbonate mineral
precipitation may also take place with silica mineral
precipitation, including pore plugging and repository
over-pressurization that encourage carbon dioxide
leakage and loss of integrity.
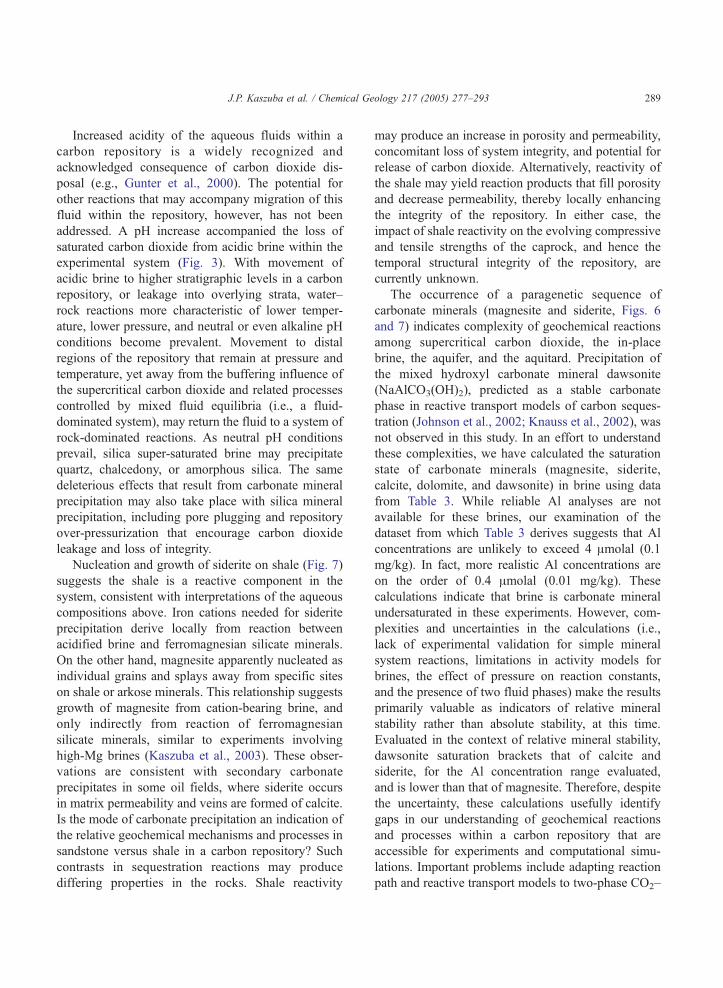
Nucleation and growth of siderite on shale (Fig. 7)
suggests the shale is a reactive component in the
system, consistent with interpretations of the aqueous
compositions above. Iron cations needed for siderite
precipitation derive locally from reaction between
acidified brine and ferromagnesian silicate minerals.
On the other hand, magnesite apparently nucleated as
individual grains and splays away from specific sites
on shale or arkose minerals. This relationship suggests
growth of magnesite from cation-bearing brine, and
only indirectly from reaction of ferromagnesian
silicate minerals, similar to experiments involving
high-Mg brines (Kaszuba et al., 2003). These obser-
vations are consistent with secondary carbonate
precipitates in some oil fields, where siderite occurs
in matrix permeability and veins are formed of calcite.
Is the mode of carbonate precipitation an indication of
the relative geochemical mechanisms and processes in
sandstone versus shale in a carbon repository? Such
contrasts in sequestration reactions may produce
differing properties in the rocks. Shale reactivity
may produce an increase in porosity and permeability,
concomitant loss of system integrity, and potential for
release of carbon dioxide. Alternatively, reactivity of
the shale may yield reaction products that fill porosity
and decrease permeability, thereby locally enhancing
the integrity of the repository. In either case, the
impact of shale reactivity on the evolving compressive
and tensile strengths of the caprock, and hence the
temporal structural integrity of the repository, are
currently unknown.
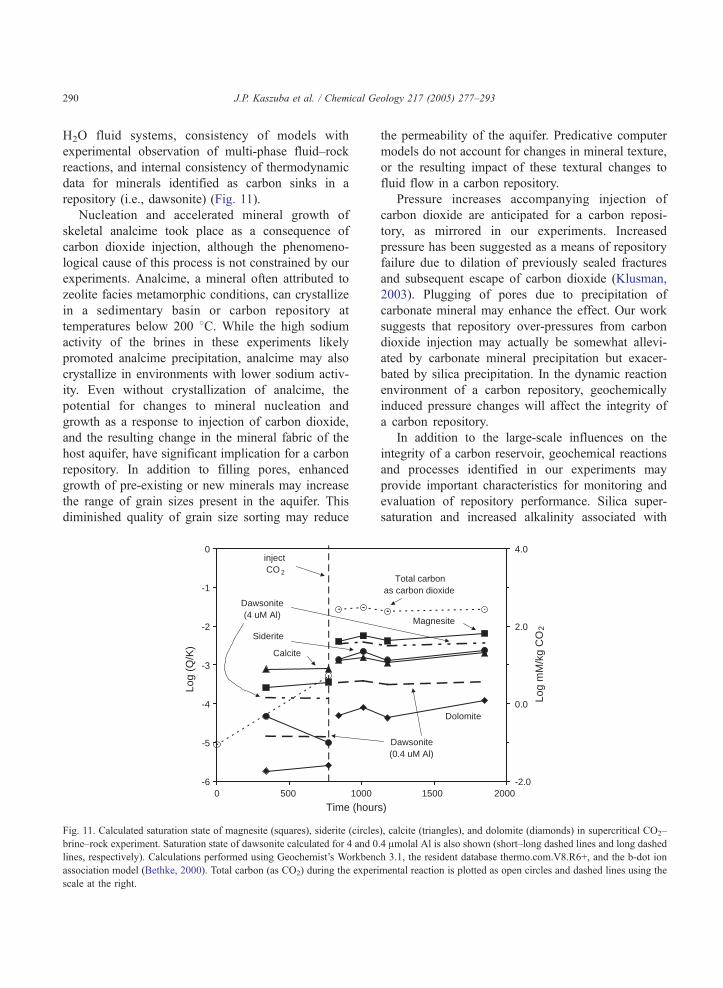
The occurrence of a paragenetic sequence of
carbonate minerals (magnesite and siderite, Figs. 6
and 7) indicates complexity of geochemical reactions
among supercritical carbon dioxide, the in-place
brine, the aquifer, and the aquitard. Precipitation of
the mixed hydroxyl carbonate mineral dawsonite
(NaAlCO3(OH)2), predicted as a stable carbonate
phase in reactive transport models of carbon seques-
tration (Johnson et al., 2002; Knauss et al., 2002), was
not observed in this study. In an effort to understand
these complexities, we have calculated the saturation
state of carbonate minerals (magnesite, siderite,
calcite, dolomite, and dawsonite) in brine using data
from Table 3. While reliable Al analyses are not
available for these brines, our examination of the
dataset from which Table 3 derives suggests that Al
concentrations are unlikely to exceed 4 Amolal (0.1
mg/kg). In fact, more realistic Al concentrations are
on the order of 0.4 Amolal (0.01 mg/kg). These
calculations indicate that brine is carbonate mineral
undersaturated in these experiments. However, com-
plexities and uncertainties in the calculations (i.e.,
lack of experimental validation for simple mineral
system reactions, limitations in activity models for
brines, the effect of pressure on reaction constants,
and the presence of two fluid phases) make the results
primarily valuable as indicators of relative mineral
stability rather than absolute stability, at this time.
Evaluated in the context of relative mineral stability,
dawsonite saturation brackets that of calcite and
siderite, for the Al concentration range evaluated,
and is lower than that of magnesite. Therefore, despite
the uncertainty, these calculations usefully identify
gaps in our understanding of geochemical reactions
and processes within a carbon repository that are
accessible for experiments and computational simu-
lations. Important problems include adapting reaction
path and reactive transport models to two-phase CO2–
J.P. Kaszuba et al. / Chemical Geology 217 (2005) 277–293290
H2O fluid systems, consistency of models with
experimental observation of multi-phase fluid–rock
reactions, and internal consistency of thermodynamic
data for minerals identified as carbon sinks in a
repository (i.e., dawsonite) (Fig. 11).
Nucleation and accelerated mineral growth of
skeletal analcime took place as a consequence of
carbon dioxide injection, although the phenomeno-
logical cause of this process is not constrained by our
experiments. Analcime, a mineral often attributed to
zeolite facies metamorphic conditions, can crystallize
in a sedimentary basin or carbon repository at
temperatures below 200 8C. While the high sodium
activity of the brines in these experiments likely
promoted analcime precipitation, analcime may also
crystallize in environments with lower sodium activ-
ity. Even without crystallization of analcime, the
potential for changes to mineral nucleation and
growth as a response to injection of carbon dioxide,
and the resulting change in the mineral fabric of the
host aquifer, have significant implication for a carbon
repository. In addition to filling pores, enhanced
growth of pre-existing or new minerals may increase
the range of grain sizes present in the aquifer. This
diminished quality of grain size sorting may reduce
-6
-5
-4
-3
-2
-1
0
0 500 1000
Time (hour
Log
(Q/K
)
Siderite
Calcite
inject CO 2
Dawsonite (4 uM Al)
Fig. 11. Calculated saturation state of magnesite (squares), siderite (circles
brine–rock experiment. Saturation state of dawsonite calculated for 4 and 0
lines, respectively). Calculations performed using Geochemist’s Workbenc
association model (Bethke, 2000). Total carbon (as CO2) during the exper
scale at the right.
the permeability of the aquifer. Predicative computer
models do not account for changes in mineral texture,
or the resulting impact of these textural changes to
fluid flow in a carbon repository.
Pressure increases accompanying injection of
carbon dioxide are anticipated for a carbon reposi-
tory, as mirrored in our experiments. Increased
pressure has been suggested as a means of repository
failure due to dilation of previously sealed fractures
and subsequent escape of carbon dioxide (Klusman,
2003). Plugging of pores due to precipitation of
carbonate mineral may enhance the effect. Our work
suggests that repository over-pressures from carbon
dioxide injection may actually be somewhat allevi-
ated by carbonate mineral precipitation but exacer-
bated by silica precipitation. In the dynamic reaction
environment of a carbon repository, geochemically
induced pressure changes will affect the integrity of
a carbon repository.
In addition to the large-scale influences on the
integrity of a carbon reservoir, geochemical reactions
and processes identified in our experiments may
provide important characteristics for monitoring and
evaluation of repository performance. Silica super-
saturation and increased alkalinity associated with
1500 2000
s)
-2.0
0.0
2.0
4.0Lo
g m
M/k
g C
O2
Total carbon as carbon dioxide
Magnesite
Dolomite
Dawsonite(0.4 uM Al)
), calcite (triangles), and dolomite (diamonds) in supercritical CO2–
.4 Amolal Al is also shown (short–long dashed lines and long dashed
h 3.1, the resident database thermo.com.V8.R6+, and the b-dot ion
imental reaction is plotted as open circles and dashed lines using the
J.P. Kaszuba et al. / Chemical Geology 217 (2005) 277–293 291
mixed fluid phase equilibria could be monitored as
geochemical indicators in interconnected or deep-
seated aquifers, springs, or water wells. Changes in
these chemical parameters may provide clues to the
subsurface disposition of stored carbon dioxide and
may also provide new perspectives for evaluating the
dynamics of existing reservoirs containing super-
critical carbon dioxide.
At a minimum, this experimental study demon-
strates that mixed fluid reactions and related processes
have potential for geochemical reactions that have not
been sufficiently addressed in the carbon sequestration
literature. Fracturing, loss of system integrity, and
leakage of carbon dioxide may occur just as readily as
self-healing of fractures. The beneficial (or delete-
rious) effects, and potential impacts to repository
integrity, have yet to be quantitatively identified. This
rather elementary conclusion is consistent with the
few studies that incorporate geochemisty into models
of geologic sequestration (Gunter et al., 1997, 2000;
Perkins and Gunter, 1995) and adds a vast dimension
of complexity and opportunity that must be under-
stood if geologic sequestration in a carbon repository
is to be successful.
4.3. Implications for silica precipitation and quartz
veins
In light of our experimental work, we suggest that
multi-phase equilibrium relationships between super-
critical carbon dioxide and brine–rock systems may be
a source of silica cement in some sandstones and
quartz mineralization in some veins. In the exper-
imental system containing acidic brine and super-
critical carbon dioxide, silica concentrations were
enhanced by dissolution of silicate minerals and
concomitant inhibition of the precipitation of quartz.
In their evaluation of the mixing of hot hydrothermal
solutions with ambient seawater at mid-ocean ridge
vents, Janecky and Seyfried (1984) also noted silica
super-saturation and inhibition of quartz precipitation.
They attributed these phenomena to kinetics of silica
polymerization and precipitation under acid pH
conditions, assumptions consistent with recent exper-
imental results (Icopini et al., 2002). Return of a silica
super-saturated brine into a rock-dominated reaction
system buffered to more neutral pH conditions may
enhance precipitation of quartz, chalcedony, or amor-
phous silica as veins or cements, depending on the
structure of permeability.
5. Conclusions
This experimental investigation examines geo-
chemical reactions and processes among supercritical
carbon dioxide, brine, and host rock (aquifer and
aquitard) simulating a carbon repository and evaluates
fluid–rock reactions that may adversely impact the
integrity of the repository. The following are con-
cluded from these experiments:
1. Addition of supercritical carbon dioxide to a brine–
rock system changes the system from rock- to
fluid-dominated reactions. Within a carbon reposi-
tory, the carbon dioxide that is injected will exert
control over geochemical reactions previously
regulated or buffered by the host rock. Acid–base
reactions and solubility of metals, for example, will
depend on interactions between supercritical car-
bon dioxide and brine, with the rock reacting to
these new equilibrium pressures.
2. A paragenetic sequence of carbonate mineraliza-
tion (corroded magnesite and euhedral siderite)
followed carbon dioxide injection. Solution com-
position changes, as well as nucleation and
growth of siderite on shale, indicate that the
aquitard will be a reactive component in a carbon
repository and raises questions regarding the
sequestering potential of sandstone aquifer versus
shale.
3. Saturation state calculations of experimental
results identify the need to adapt reaction path
and reactive transport models to two-phase CO2–
H2O fluid systems and to critically evaluate
thermochemical data systems for minerals identi-
fied as potentially important carbon sinks (i.e.,
dawsonite).
4. Precipitation of crystalline or amorphous silica
from silica–supersaturated brine and pH increase
may accompany migration of fluid within and
from the repository. Enhancement in silica pre-
cipitation could armor and protect flow paths or
plug them.
5. Injection of carbon dioxide leads to carbonate and
silicate mineral nucleation and growth. Concom-
J.P. Kaszuba et al. / Chemical Geology 217 (2005) 277–293292
itant change in the permeability structure of the
host aquifer may adversely impact a repository.
6. In addition to direct application to geologic aquifer
sequestration of carbon, an understanding of multi-
phase fluid equilibrium relationships between
supercritical carbon dioxide and aquifer–brine
systems raises new questions and potential inter-
pretations in a wide variety of natural geologic
systems. In particular, multi-phase fluid equilibria
may account for silica cement in some sedimentary
basin sandstones and quartz vein mineralization in
some ore districts.
Acknowledgements
Funding was provided by Los Alamos National
Laboratory (LDRD/DR) for this research and by the
US Department of Energy, Basic Energy Sciences,
Geosciences Program for the hydrothermal laboratory
facilities. Steve Chipera provided XRD analyses, Dale
Counce provided brine analyses, and Emily Kluk
provided XRF analyses. The final manuscript bene-
fited from constructive comments by Eric H. Oelkers
and two anonymous reviewers. This manuscript is
assigned LANL LAUR # 03-2978. [EO]
References
Bachu, S., 2000. Sequestration of CO2 in geological media: criteria
and approach for site selection in response to climate change.
Energy Convers. Manag. 41 (9), 953–970.
Bachu, S., 2002. Sequestration of CO2 in geological media in
response to climate change: road map for site selection using the
transform of the geological space into the CO2 phase space.
Energy Convers. Manag. 43 (1), 87–102.
Bachu, S., 2003. Screening and ranking of sedimentary basins for
sequestration of CO2 in geological media in response to climate
change. Environ. Geol. 44 (3), 277–289.
Bachu, S., Gunter, W.D., Perkins, E.H., 1994. Aquifer disposal of
CO2: hydrodynamic and mineral trapping. Energy Convers.
Manag. 35 (4), 269–279.
Benson, S.M., 2000. Advances in geologic sequestration: identify-
ing and addressing key issues. Abstr. Programs-Geol. Soc. Am.
32 (7), A200.
Bethke, C.R., 2000. The Geochemist’s Workbench Release 3.1: A
Users Guide. University of Illinois at Urbana-Champaign,
Champaign, IL. 202 pp.
Carter, L.S., Kelley, S.A., Blackwell, D.D., Naeser, N.D., 1998.
Heat flow and thermal history of the Anadarko basin,
Oklahoma. AAPG Bull. 82 (2), 291–316.
Ennis-King, J., Paterson, L., 2000. Reservoir engineering issues in
the geological disposal of carbon dioxide. In: Williams, D.J.,
Durie, R.A., McMullan, P., Paulson, C.A.J., Smith, A.Y. (Eds.),
5th International Conference on Greenhouse Gas Control
Technologies, Cairns, Australia, pp. 290–295.
Gunter, W.D., Wiwchar, B., Perkins, E.H., 1997. Aquifer disposal of
CO2-rich greenhouse gases: extension of the time scale of
experiment for CO2-sequestering reactions by geochemical
modelling. Mineral. Petrol. 59 (1–2), 121–140.
Gunter, W.D., Perkins, E.H., Hutcheon, I., 2000. Aquifer disposal of
acid gases: modelling of water–rock reactions for trapping of
acid wastes. Appl. Geochem. 15 (8), 1085–1095.
Hitchon, B., Gunter, W.D., Gentzis, T., Bailey, R.T., 1999.
Sedimentary basins and greenhouse gases: a serendipitous
association. Energy Convers. Manag. 40 (8), 825–843.
Holloway, S., 1997. An overview of the underground disposal of
carbon dioxide. Energy Convers. Manag. 38 (SS), S193–S198.
Huffmann, E., 1977. Performance of a new automatic carbon
dioxide coulometer. Microchem. J. 22 (4), 567–573.
Hurter, S.J., Pollack, H.N., 1996. Terrestrial heat flow in the
Parana Basin, southern Brazil. J. Geophys. Res. 101 (B4),
8659–8671.
Icopini, G., Brantley, S., Heaney, P., 2002. Kinetics of silica
nanocolloid formation from supersaturated solutions. Geochim.
Cosmochim. Acta 66 (15A), A351.
Janecky, D., Seyfried, W., 1984. Formation of massive sulfide
deposits on oceanic ridge crests—Incremental reaction models
for mixing between hydrothermal solutions and seawater.
Geochim. Cosmochim. Acta 48 (12), 2723–2738.
Johnson, J.W., Steefel, C.I., Knauss, K.G., 2002. Reactive transport
modeling of geologic CO2 sequestration. Abstr. Programs-Geol.
Soc. Am. 34 (6), 390.
Kaszuba, J.P., Janecky, D.R., 2000. Experimental hydration and
carbonation reactions of MgO: a simple analog for subsurface
carbon sequestration processes. Abstr. Programs-Geol. Soc. Am.
32 (7), A202.
Kaszuba, J.P., Janecky, D.R., Snow, M.G., 2003. Carbon dioxide
reaction processes in a model brine aquifer at 200 8C and 200
bars: implications for geologic sequestration of carbon. Appl.
Geochem. 18 (7), 1065–1080.
Klusman, R., 2003. Evaluation of leakage potential from a carbon
dioxide EOR/sequestration project. Energy Convers. Manag. 44
(12), 1921–1940.
Knauss, K.G., Steefel, C.I., Johnson, J.W., Boram, L.H., 2002.
Impact of CO2, contaminant gas, aqueous fluid, and reservoir
rock interactions on the geologic sequestration of CO2. Abstr.
Programs-Geol. Soc. Am. 34 (6), 306.
Koide, H., et al., 1992. Subterranean containment and long-term
storage of carbon dioxide in unused aquifers and in depleted
natural gas reservoirs. Energy Convers. Manag. 33 (5–8),
619–626.
Lindeberg, E., 1997. Escape of CO2 from aquifers. Energy Convers.
Manag. 38 (SS), S235–S240.
Oldenburg, C.M., Pruess, K., Benson, S.M., 2001. Process
modeling of CO2 injection into natural gas reservoirs for carbon
sequestration and enhanced gas recovery. Energy Fuels 15 (2),
293–298.
J.P. Kaszuba et al. / Chemical Geology 217 (2005) 277–293 293
Perkins, E.H., Gunter, W.D., 1995. Aquifer disposal of CO2-rich
greenhouse gasses: modelling of water–rock reaction paths in a
siliciclastic aquifer. In: Kharaka, Y.K., Chudaev, O.V. (Eds.),
Proceedings of the 8th International Symposium on Water2RockInteraction. A.A. Balkema, Vladivostok, Russia, pp. 895–898.
Pruess, K., Garcia, J., 2002. Multiphase flow dynamics during CO2
disposal into saline aquifers. Environ. Geol. 42 (2–3), 282–295.
Rutqvist, J., Tsang, C., 2002. A study of caprock hydromechanical
changes associated with CO2-injection into a brine formation.
Environ. Geol. 42 (2–3), 296–305.
Saripalli, P., McGrail, P., 2002. Semi-analytical approaches to
modeling deep well injection of CO2 for geological sequestra-
tion. Energy Convers. Manag. 43 (2), 185–198.
Seyfried Jr., W.E., Janecky, D.R., Berndt, M.E., 1987. Rocking
autoclaves for hydrothermal experiments, II. The flexible
reaction-cell system. In: Ulmer, G.C., Barnes, H.L. (Eds.),
Hydrothermal Experimental Techniques. John Wiley & Sons,
New York, pp. 216–239.
Span, R., Wagner, W., 1996. A new equation of state for carbon
dioxide covering the fluid region from the triple-point temper-
ature to 1100 K at pressures up to 800 MPa. J. Phys. Chem. Ref.
Data 25 (6), 1509–1596.
Stein, C.L., Krumhansl, J.L., 1988. A model for the evolution of
brines in salt from the lower Salado Formation, southeastern
New Mexico. Geochim. Cosmochim. Acta 52, 1037–1046.
Takenouchi, S., Kennedy, G.C., 1964. The binary system H2O–
CO2 at high temperatures and pressures. Am. J. Sci. 262,
1055–1074.
Ward’s Natural Science Establishment, I., 1970. Manual for Ward’s
Collection of Classic North American Rocks. 45 W 7217,
Rochester, NY.