Experimental Evaluation of Foam-Void Double-Tees
101
Clemson University TigerPrints All eses eses 12-2017 Experimental Evaluation of Foam-Void Double- Tees Sachin Sreedhara Clemson University Follow this and additional works at: hps://tigerprints.clemson.edu/all_theses is esis is brought to you for free and open access by the eses at TigerPrints. It has been accepted for inclusion in All eses by an authorized administrator of TigerPrints. For more information, please contact [email protected]. Recommended Citation Sreedhara, Sachin, "Experimental Evaluation of Foam-Void Double-Tees" (2017). All eses. 2767. hps://tigerprints.clemson.edu/all_theses/2767
Transcript of Experimental Evaluation of Foam-Void Double-Tees

Clemson UniversityTigerPrints
All Theses Theses
12-2017
Experimental Evaluation of Foam-Void Double-TeesSachin SreedharaClemson University
Follow this and additional works at: https://tigerprints.clemson.edu/all_theses
This Thesis is brought to you for free and open access by the Theses at TigerPrints. It has been accepted for inclusion in All Theses by an authorizedadministrator of TigerPrints. For more information, please contact [email protected].
Recommended CitationSreedhara, Sachin, "Experimental Evaluation of Foam-Void Double-Tees" (2017). All Theses. 2767.https://tigerprints.clemson.edu/all_theses/2767

EXPERIMENTAL EVALUATION OF FOAM-VOID DOUBLE-TEES
A Thesis Presented to
the Graduate School of Clemson University
In Partial Fulfillment of the Requirements for the Degree
Master of Science Civil Engineering
by Sachin Sreedhara December 2017
Accepted by: Dr. Brandon Ross, Committee Chair
Dr. Thomas Cousins Dr. Weichiang Pang

ii
ABSTRACT
Gross vehicular weight restrictions limit the shipping of typical pre-stressed
concrete double-tees (DT) for parking decks to one member per trip. The objective of this
study is to reduce the self-weight of these members to facilitate two-at-a-time shipping,
and thus enable lower shipping costs and reduced environmental footprint. In this
research, two 35 foot-long DT members were fabricated and tested to study strategies for
reducing self-weight. Foam boards were placed inside the stems of the DT members to
produce foam-void double-tees (FVDT). One inch and two inch-thick foam boards were
used along with normal and semi-light weight concretes. The two FVDT members were
cut length-wise through the top flanges to create four unique single-tee specimens, which
were then load tested to evaluate structural capacity and behavior. This thesis discusses
the experimental setup and results of flexural testing and shear testing. The test results
demonstrated that the presence of foam boards had negligible effect on flexural
performance; each of the foam-void specimens supported an experimental moment that
was greater than the calculated nominal moment capacity and the shear capacity was
more than that expected demand for a typical parking garage DT. Furthermore, cracking
near the edges of the foam voids was not an issue under service or higher loads.
iii
DEDICATION
I would like to dedicate this thesis to my beloved parents Mr. Sreedhara Hadya
Madappa and Ms. Sudha Malali Lingappa, who have been blessing me all these years,
my sisters Ms. Sowmya Praveen, Ms. Shruthi Sreedhara, my brother-in-law Mr. Praveen
Puttananjaiah, my beloved advisor Dr. Brandon Ross who has been guiding me since the
beginning of my graduate studies and to all my dear friends.

iv
ACKNOWLEDGMENTS
This research was initiated through a Daniel P. Jenny Fellowship awarded to
Srimaruthi Jonnalagadda. Mr. Sreedhara’s work on this project was funded by the
Clemson University Glenn Department of Engineering and by the Clemson University
School of Architecture. Test specimens were fabricated and donated by Tindall
Corporation. Ms. Mary Ann Griggas-Smith at the Tindall Corporation provided
assistance during design and fabrication of the test specimens. The foam-void concept
upon which this research was based was introduced to the Clemson team by Mr. Bryant
Zavitz. Assistance in the lab was provided by Mahmood Soltani, Scott Black, Sam
Biemann, Frank Filosa, Danny Metz, Anish Uppala, Ahmad Tarawneh, Mathew Thorn,
and Ninad Deshpande.
A project oversight panel was organized by the Precast/Prestressed Concrete
Institute to support this project. Contributions from the panel members are appreciated.
Panel members:
• Roger Becker, PCI • Frank Nadeau, Metromont • Sami Rizkalla, North Carolina State University • Tom D’Arcy, Consulting Engineers Group • Mary Ann Griggas-Smith, Tindall

v
TABLE OF CONTENTS
Page
ABSTRACT ........................................................................................................................ ii
DEDICATION ................................................................................................................... iii
ACKNOWLEDGMENTS ................................................................................................. iv
TABLE OF CONTENTS .................................................................................................... v
LIST OF TABLES ............................................................................................................ vii
LIST OF FIGURES ......................................................................................................... viii
CHAPTER
I. INTRODUCTION .......................................................................................... 1
II. BACKGROUND ............................................................................................ 3
Double – Tee Members ............................................................................... 3 Reduced Weight DTs .................................................................................. 5
III. ESTABLISHMENT OF A “BASELINE” DT MEMBER ........................... 10
Industry Survey ......................................................................................... 10 Analysis of baseline DT ............................................................................ 12
IV. IMPACT OF DT WEIGHT REDUCTION .................................................. 14
V. EXPERIMENTAL PROGRAM- SPECIMENS AND SETUP .................... 17
Overview ................................................................................................... 17 Specimen Design and Construction .......................................................... 17 Test Set-up ................................................................................................ 23
VI. TEST RESULTS ........................................................................................... 31
Stage 1: 50% service ................................................................................. 31

vi
Table of Contents (Continued)
Page
Stage 2: 100 Cycles between 20% and 50% service load ......................... 31 Stage 3: Static test to 100% service load .................................................. 34 Stage 4: 50% to 100% service .................................................................. 37 Stage 5: 24 hour sustained load test .......................................................... 38 Stage 6: Flexural load test ......................................................................... 40 Stage 7: Shear load test ............................................................................. 45
VII. ASSESSMENT OF EXPERIMENTAL OBJECTIVES ............................... 49
Comparison with nominal flexural capacity ............................................. 49 Comparison with factored shear of baseline beam ................................... 50 Cracking at the edges of foam .................................................................. 52
VIII. CONCLUSIONS AND RECOMMENDATIONS ....................................... 54
Test program conclusions ......................................................................... 54 Recommendations for design .................................................................... 55 Recommendations for future testing ......................................................... 56 Final Comments ........................................................................................ 58
REFERENCES ................................................................................................................. 59
APPENDICES .................................................................................................................. 61
Appendix A: Analysis of Baseline beam .................................................. 61 Appendix B: Stage 1 test data ................................................................... 71 Appendix C: Stage 2 test data ................................................................... 73 Appendix D: Stage 4 test data ................................................................... 75 Appendix E: Calculation of specimen nominal capacity .......................... 77

vii
LIST OF TABLES
Page Table 1. Summary of survey, and values for baseline DT member .................................. 11
Table 2. Details of baseline DT ........................................................................................ 12
Table 3. Summary of the baseline beam cross-section
(for one-half of a DT) ............................................................................................... 12
Table 4. Structural demands on baseline beam
(for one stem of the baseline DT) ............................................................................. 13
Table 5. Material properties of concrete and reinforcement ............................................. 21
Table 6. Mix design of normal weight concrete ............................................................... 21
Table 7. Mix design of light weight concrete ................................................................... 22
Table 8. Test set up parameters......................................................................................... 29
Table 9. Tests schedule ..................................................................................................... 30
Table 10. Results of 24 hr sustained load test ................................................................... 39
Table 11. ACI conditions for 24 hr sustained load test..................................................... 39
Table 12. Shear test results ............................................................................................... 48
Table 13. Comparison of experimental and nominal moments ........................................ 49

viii
LIST OF FIGURES
Page
Figure 1. Double Tee cross section ..................................................................................... 2
Figure 2. Early DT (left, figure from Edwards[3] ) and NEXT beams
(right, photo from Northeast Precast Products, LLC[4].) ........................................... 4
Figure 3. Field-topped (left) and factory-topped (right) ..................................................... 5
Figure 4. Tee beam with large web openings [5] ................................................................ 6
Figure 5. Vierendeel Truss .................................................................................................. 6
Figure 6. Single tee with web openings (photo courtesy- M. Tadros) ................................ 7
Figure 7. Recommended dimensions and locations of openings in
double tee members (Saleh et al. [7]) ......................................................................... 8
Figure 8. Recommended reinforcement details near edges of
openings (Saleh et al. [7]) ........................................................................................... 8
Figure 9. Cross-section of the baseline beam ................................................................... 11
Figure 10. Variation of unit weight with foam thickness to
meet GVW limits ...................................................................................................... 15
Figure 11. Test specimen labeling .................................................................................... 18
Figure 12. Specimen cross section .................................................................................... 18
Figure 13. Specimen vertical reinforcement ..................................................................... 19
Figure 14. Custom #3 stirrup used as transverse reinforcement ....................................... 20
Figure 15. FVDT prior to casting ..................................................................................... 22
Figure 16. Concrete placement in stem............................................................................. 23

ix
List of Figures (Continued)
Page
Figure 17. Support and load configuration for FVDT test specimens.
Locations of interest for shear force and tensile stress are also shown .................... 24
Figure 18. Flange cut-off location at the ends of the specimen ........................................ 25
Figure 19: Specimen braced by “saddle” at each support ................................................. 25
Figure 20. I-beam used for spreading load from jack to specimen ................................... 26
Figure 21: Strain gauge (SG) locations ............................................................................. 27
Figure 22: String pots (SP) locations. All SPs attached at mid-span ................................ 27
Figure 23. Dimensions to centerline of supports and to the end
of specimen ............................................................................................................... 29
Figure 24. Moment-strain response at edges of the foam for last
five cycles during test stage 2 ................................................................................... 33
Figure 25. Moment-strain response under point loads for last
five cycles during test stage 2 ................................................................................... 33
Figure 26. Moment-strain plot for gauges under the point loads
in test stage 3 ............................................................................................................. 34
Figure 27. Moment-displacement plot for all the specimens in
test stage 3 ................................................................................................................. 35
Figure 28. Moment-strain response at edges of the foam during
service load tests ....................................................................................................... 36
Figure 29. Moment-strain at edges of the foam for the last five cycles ............................ 38

x
List of Figures (Continued)
Page
Figure 30. Moment-displacement response during flexural tests ..................................... 40
Figure 31. Widening of the cracks and formation of new cracks
during flexural load test ............................................................................................ 41
Figure 32. Moment-strain response at edges of the foam during
flexural load tests ...................................................................................................... 43
Figure 33: Crack pattern around mid-span of all the beams during
flexural load test ........................................................................................................ 44
Figure 34: L-1 Cracking Pattern ....................................................................................... 44
Figure 35. Specimen L1 at location of strand rupture ...................................................... 46
Figure 36. Flexure-shear failure in the specimen N1 ........................................................ 46
Figure 37. Compression zone shear failure in the specimen N2....................................... 47
Figure 38. Comparison of experimental shear with the demand in
baseline beams .......................................................................................................... 52
Figure 39. Alternative shear reinforcement recommended............................................... 58

I. INTRODUCTION
Double-Tees (hereafter referred to as “DT”) members (Figure 1a) are a staple of
the precast concrete industry. Millions of square foot of DT members are fabricated in the
United States annually. These members offer flexibility in design and construction, and
are an ideal choice for structures such as parking garages that require long uninterrupted
spans and high load carrying capability. Because of their widespread use, small
improvements in the efficiency of DT members can have a significant effect on the
overall environmental footprint and economic competitiveness of the precast industry.
The Gross Vehicular Weight (GVW) limit for US highways – 80 kip in most
states and circumstances – can limit the economical use of DT members. Due to the
magnitude of their self-weight, typical 60 ft.-long parking garage DTs cannot be legally
transported two per truck. The weight of two parking garage DT members plus the
weight of the truck and trailer typically exceeds the Gross Vehicular Weight (GVW)
limits by approximately 15%. The current research is motivated by a desire for two-at-a-
time transport, which would improve both economic and environmental efficiency. An
experimental program was conducted to evaluate the structural viability of foam-void
double-tee (FVDT) members (Figure 1b).

2
(a) Without foam-void (b) With foam-void
Figure 1. Double Tee cross section
FVDT are similar to typical DT members; however, foam voids are placed in the
webs (stems) to displace the concrete and reduce the member weight. Using FVDT in
combination with reduced-weight concrete increases the potential for two parking garage
double-tees to be trucked simultaneously, thus reducing the economic and environmental
costs of transportation. To facilitate these benefits, this study investigated the effect of
foam void on service-level cracking behavior, nominal flexural capacity, and shear
capacity. Stress, moment, and shear demands on the test specimens were based on a
typical precast DT member in a parking garage.

3
II. BACKGROUND
Double – Tee Members
Precast pre-tensioned concrete double-tees were first built in 1951. The history of
these members in the precast industry has been documented by Nasser et al.[1], Wilden
[2], and Edwards [3]. Information in this section is based on these works. The overall
form of DT members is well suited for precast concrete construction; standardized cross
sections lead to fabrication efficiency and the cross section shape provides structural
stability for storage, shipping, erection, and service. The original double-tee cross section
(Figure 2, left) has changed and evolved over the years. The cross section has been
modified to account for changes in steel and concrete material properties and to suit
different loading conditions. Double-tees have been used as floor, roof, and wall
structures of buildings and have also been used in industrial applications and in bridges.
The New England Extreme Tee (NEXT) beam (Figure 2, right) is being used in highway
bridges and is one example of a modern DT member. Parking garages are currently one
of (if not the) most common applications of DT members. Parking garage DT members
(shown in Figure 1b) are the primary focus of the current research.

4
Figure 2. Early DT (left, figure from Edwards[3] ) and NEXT beams (right, photo from
Northeast Precast Products, LLC[4].)
DT members are fabricated as field-topped or factory-topped (Figure 3). Factory-
topped DTs have thicker top flanges. Once erected, the flanges act as floor/roof
diaphragms. Connections between adjacent factory-topped members are detailed to resist
differential vertical movement and to carry diagraph forces. Field-topped members have
thinner top flanges and have a concrete topping placed on them after erection. The
topping acts compositely with the precast to carry vertical and diaphragm loads.
Reinforcement for the diagram is placed in the cast-in-place topping. Field-topped
members are commonly used in regions with high seismic loads. The current study
focuses exclusively on field-topped DTs.

5
Figure 3. Field-topped (left) and factory-topped (right)
Reduced Weight DTs
Reducing the self-weight of DT members has been the subject of previous
research. Barney et al. [5] studied the behavior of the single tee beams with large
rectangular openings (Figure 4). They conducted tests on 18 tee beams, having spans of
36 ft and 18 ft. The main variables in the test program were size and location of openings,
type and amount of web shear reinforcement and primary flexural reinforcement. The
behavior of the beams was observed to be similar to that of a Vierendeel truss (Figure 5).
The results showed that the large web openings in the tee beam did not affect the strength
or serviceability, so long as the openings were placed outside the required strand
embedment length and adequate shear reinforcement was provided adjacent to openings.

6
Figure 4. Tee beam with large web openings [5]
Figure 5. Vierendeel Truss
Savage et al. [6] tested the performance of the prestressed concrete single-tee
beams having multiple large web openings (Figure 6). They investigated the opening
size, opening placement, required material strengths, and the effect of depressed strands.
The test results showed that the performance of the specimens with web openings was

7
similar to DT members without web openings. Similar to Barney et al., Savage et al. also
observed that specimen behavior was like that of a Vierendeel Truss (Figure 5). It was
also shown that there was no reduction of strength relative to the specimen without
openings, and the deflections were also similar. The ultimate strength of the web-opening
tees was not affected due to the presence of proper reinforcement around the openings.
The deflections were within the ACI requirements.
Figure 6. Single tee with web openings (photo courtesy- M. Tadros)
Saleh et al. [7] optimized the design of double-tee beams with large openings
without reducing the structural capability. This research was the continuation of the work
done by Savage et al. [6]. In order to meet that strength criteria, no openings were placed
at the end of the members within the strand development length. Additional vertical
stirrups at the edges of the openings were provided. Proposed dimensions and
reinforcement details are shown in Figure 7 and Figure 8. The main objective of the
beams with the openings was to reduce the floor to floor heights by using the openings as

8
chases for electrical and mechanical conduits. Also, because of the openings, the
structural demand due to gravity loads and the effect of seismic forces were reduced.
Figure 7. Recommended dimensions and locations of openings in double tee members
(Saleh et al. [7])
Figure 8. Recommended reinforcement details near edges of openings (Saleh et al. [7])

9
The proprietary BubbleDeck system [8] is another example of reducing structure
self-weight by placing voids where concrete is not needed for structural capacity. It is a
biaxial technology wherein plastic balls are used to displace the concrete above the
reinforcing bars and below the compression zone. Prior to casting the concrete, the plastic
balls are held in a prefabricated reinforcing grid. The BubbleDeck system has won
numerous awards for its “green” features.
This study expands on the findings of early works through experimentally
evaluating the possibility of continuous, outside of the end region, voids in pre-
stress/precast concrete beams. The development of FVDT has potential to enhance the
precast industry’s product lines towards solutions that are competitive in an increasing
eco-aware and green construction marketplace.

10
III. ESTABLISHMENT OF A “BASELINE” DT MEMBER
Industry Survey
A survey of precast companies was conducted by Srimaruthi Jonnalagadda and
Brandon Ross; they provided the results and data which are summarized in this thesis.
The survey was conducted to establish a “baseline” design for parking garage DTs. The
baseline design mimics typical parking garage DTs, and was used as a point of reference
in subsequent research tasks. The survey questionnaire included six questions and
requested a shop ticket for a typical parking garage DT. Six US precast fabricators
participated in this survey and four of them provided the shop tickets. Questions in the
survey asked about typical concrete unit weight, typical concrete strengths (28 day and at
transfer), percent of DT members that are field-topped, weight of tractor and trailer
shipping DT, truck GVW legal limit in the jurisdiction and trucking cost as percent of
total cost for every 100 miles.
Responses are summarized in Table 1. Key observations from the survey include
that truck plus trailer weigh between 30 and 35 kips, and that parking garage DT weigh
between 30 and 35 kips for normal weight concrete. It is also inferred from the survey
data that typically only one parking garage DT is hauled on a truck due to the GVW
restrictions. Also, it was noted that some fabricators are using light weight concrete for
DT. Using survey responses from the fabricators, properties for a baseline DT member
were determined. The self-weight and cross-sectional area of the baseline beam were also
established from the survey data, and are reported in Table 2 and Figure 9.

11
Table 1. Summary of survey, and values for baseline DT member
Item Range of the response Value used for baseline
Typical Concrete unit weight 115 – 150 pcf 126 pcf (LWC) 145 pcf (NWC)
Typical Concrete strengths (28 day) 6000 psi 6000 psi Typical Concrete strength at transfer 3500 – 4000 psi 3500 psi
Percent of DT members that are field topped 60% to 100% NA
Weight of tractor and trailer shipping DT 30 – 35 kips 32 kips
Figure 9. Cross-section of the baseline beam

12
Table 2. Details of baseline DT
Cross-sectional area 600 in2 Single DT weight 32.5 kips
Single DT Weight (distributed) 542 plf Target DT weight after reduction 24 kips
Analysis of baseline DT
In order to fabricate and test FVDT specimens that were comparable to parking
garage conditions, the baseline DT was first analyzed to determine service stresses and
ultimate shear forces. Baseline DTs with normal-weight and light-weight concrete were
considered. The baseline beams were 60 ft long solid (no foam voids) DT with parking
garage loading. Details of the baseline cross-section are summarized in Table 3. Loads
on the baseline beams included: self-weight, weight of composite topping (25 psf),
superimposed dead load (5 psf), and live load (40 psf). Loads were based on ASCE 7-10
[9] and the PCI Design Handbook [10]. Input from the Tindall Corporation was also
used to create and analyze the baseline DT design.
Table 3. Summary of the baseline beam cross-section (for one-half of a DT)
Baseline cross-sectional properties Area (in2) 298 Stop (in3) 2754
Sbottom (in3) 1008 Pe (kip) 153 e (in) 14.5
Yb (in) 20.5
Calculations for the complete analysis (moments, stresses, and shear) are shown
in appendix. Essential outputs of the analysis are summarized in Table 4. Because the test
specimens were cut into single-tee members, the values in the table are one-half of the

13
moments and shears determined for the baseline DT. Stresses reported in the table are the
maximum tensile stresses which occur at mid-span. Composite action between the precast
member and deck was considered when calculating stresses due to superimposed dead
load and live load. The test specimens and the test set-up were designed (presented in the
next chapter) such that the service level tensile stresses and service level shear force
occurred at approximately the same applied load in the tests.
Table 4. Structural demands on baseline beam (for one stem of the baseline DT)
Condition Moment (kip-ft) Shear at 5ft (kip) Concrete tensile stress (psi)
NWC LWC NWC LWC NWC LWC Service 323 305 17.9 16.9 966 757 Ultimate 430 410 23.9 22.7 NA NA

14
IV. IMPACT OF DT WEIGHT REDUCTION
Obvious questions of this research program include: Do foam voids allow two
DT members to be transported on one truck? What is the degree of weight-loss due to
the foam voids? This section provides context and answers for these questions.
Many factors influence the possibility of two-at-a-time trucking. The self-weight
of the DT is a primary factor. Self-weight is a function of the concrete unit weight, the
span length and cross-section, and the volume of the foam void (in any). Other factors
include the weight of the truck and trailer, and the gross vehicular weight (GVW) limit
for the highway system. GVW limit in the United States is typically 80 kips.
Figure 10 presents different combinations of foam void and concrete unit weight
that (dis)allow two-at-a-time trucking. The figure is only based on weight limits and
does not imply that any particular combination of concrete weight and foam void width is
structural viability. The remainder of this thesis focuses on structural viability. Using the
figure, a designer can select a unit weight, foam width, and a cross-section size that are
likely to allow two FVDT to be transported on the same truck.
Figure 10 is based on a combined truck and trailer weight of 26 kip; this value
was chosen based on the industry survey. The figure assumes that the foam void is 12 in.
deep in each stem and that the member length is 60 ft. The graph is for field-topped
members only. These assumptions must be checked when applying the figure.

15
Figure 10. Variation of unit weight with foam thickness to meet GVW limits
The 28 in. deep test specimens discussed in the remainder of the thesis had cross-
sectional area of 596 in2 and concrete unit weights of 126 and 145 pcf. From Figure 10 it
can be observed that the 126 pcf specimens would require a foam width larger than 3 in.
to qualify for two-at-a-time trucking. Because the foam void concept has not previously
been tested, the experimental program took a conservative approach using 1 inch and 2
inch wide foam voids. The test program focused on finding foam void details that were
structurally viable while also achieving a degree of weight reduction. Thus, the program
identified an amount of foam void that is structurally viable, but it did not find the upper
limit for structurally viable void size.
The void widths used in the test program were 12 in. deep and either 1 in. or 2 in.
wide. Relative to solid 28” deep DTs, these widths correspond to a 4% and 8% weight
reduction for the 1 in. and 2in. wide voids, respectively. Although this level of weight

16
reduction does not satisfy the requirements of two-at-a-time trucking for the assumptions
in Figure 10, it may be sufficient in other circumstances such as shallower members,
shorter members, or members with lighter-weight concretes. Even when two-at-a-time
trucking is not permissible, reduced weight still has the benefit of reducing overall
structural demands.

17
V. EXPERIMENTAL PROGRAM- SPECIMENS AND SETUP
Overview
An experimental program was conducted to study flexural and shear capacity of
DT members with foam voids. For efficiency in testing, each “specimen” in the study
was a single-tee member. Two FVDT members were cut lengthwise into four single-tee
specimens. This chapter describes design, fabrication, and testing of the specimens and
provides interpretation of the test results. Specific objectives of testing included:
• Evaluate experimental flexural capacity of FVDT relative to calculated
nominal capacity;
• Evaluate experimental shear capacity of FVDT relative to factored shear force
in the baseline beam; and
• Evaluate cracking (if any) at the end of the foam void.
Specimen Design and Construction
Specimens were created from two 35’ long 12DT28 members. One of the
members was cast with normal weight concrete (145 pcf) and the other with semi-light
weight concrete (126 pcf). One stem of each DT member had a 1 in.-thick foam board,
and the other stem had a 2 in.-thick foam board. Each specimen was given a unique label
based on the concrete unit-weight and width of foam board (Figure 11).

18
Figure 11. Test specimen labeling
The concrete unit-weights were chosen in consultation with the specimen
fabricator; mix designs were typical of those used for production members. The foam
width and reinforcement were also selected in consultation with the fabricator.
Cross section, elevations, prestressing, and reinforcement details of the specimens
are shown in Figure 12 and Figure 13. The edges (5 ft. from the ends), length (25 ft.), and
depth (12 in.) of the foam boards were the same in all four specimens (Figure 13).
Figure 12. Specimen cross section

19
Figure 13. Specimen vertical reinforcement
The test specimens were fabricated in the same bed as production members for a
building project, and the strand pattern (Figure 12) was based on the production
members. As the test specimens had a shorter span than that of the production members,
stresses in the specimens were controlled by debonding the top-most strand. For safety
purposes, a 3 ft. segment of the top-most strand was bonded at mid-span.
Transverse reinforcement in the specimens were custom-made #3 stirrups (Figure
14), which included an opening for holding the foam board. The horizontal pieces in the
stirrups were welded to the vertical legs to form the opening. The stirrups were anchored

20
down by the strands, and the foam was anchored down by the stirrups. Concrete and
reinforcement material properties are listed in Table 5 and mix designs for the normal
weight concrete and light weight concrete are shown in Table 6 and Table 7. The
members were fabricated in fall 2015. Photos of construction are shown in Figure 15 and
Figure 16. The specimens were designed by Srimaruthi Jonnalagadda, who also
documented the fabrication process.
Figure 14. Custom #3 stirrup used as transverse reinforcement

21
Table 5. Material properties of concrete and reinforcement
Material Properties
Semi-light weight concrete
28 day compressive strength: 7810 psi 401 day compressive strength: 11310 psi 441 day compressive strength: 10360 psi
Unit weight: 126 pcf Note: The same concrete was used for all LWC beams. Load
tests were conducted between days 401 and 441.
Normal weight concrete
28 day compressive strength: 7270 psi 464 day compressive strength: 9610 psi 576 day compressive strength: 10790 psi
Unit weight: 145 pcf Note: The same concrete was used for all NWC beams. Load
tests were conducted between days 464 and 576.
#3 reinforcing bars
ASTM 615M-14 Grade 420/60 Yield Strength: 77.4 ksi (534 MPa) Tensile strength: 107 ksi (738 MPa)
Note: properties based on rebar supplier documentation 9/16 in. diameter strands Type: Low- Relaxation Strands
Tensile Strength: 270 ksi
Table 6. Mix design of normal weight concrete
Item Batch quantity Units Type II/III cement 565 lb/cy Class "F" fly ash 140 lb/cy
C-33 sand 1247 lb/cy 57 stone granite 1534 lb/cy
Water 281 lb/cy Air admixture
HRWR admixture Inhibitor admixture
Air (6%)

22
Table 7. Mix design of light weight concrete
Item Batch quantity Units Type II/III cement 700 lbs/cy Class "F" fly ash 150 lb/cy
C-33 sand 1146 lb/cy 3/8" granite 377 lb/cy 1/2 Stalite 656 lb/cy
Water 279 lb/cy Air admixture
HRWR admixture Inhibitor admixture
Air (6%)
Figure 15. FVDT prior to casting

23
Figure 16. Concrete placement in stem
Test Set-up
The specimens, boundary conditions, and load locations were designed such that
the shear forces and flexural-tension stresses in the specimens mimicked those of the
baseline beam. Accordingly, a simple-span four-point bending configuration was selected
(Figure 17). At an experimental load of approximately 28 kip (total for both load points)
shear force in the specimens at the edge of the foam void was approximately equal to the
service-level shear force in the baseline beam at the same location. Also at a load of 28 kip,
the flexural-tension stress at mid-span of the specimens were approximately 15% less than
the service-level stress of the baseline beam. The “service load” referred to in this thesis
corresponds to a total applied load of 28 kip. These comparisons between the test
specimens and baseline beam are based on the normal-weight concrete specimens.

24
Figure 17. Support and load configuration for FVDT test specimens. Locations of interest
for shear force and tensile stress are also shown
The test set-up included features to ensure stability of the single-tee specimens
during testing. This was done by using a steel “saddle” support (Figure 19) at both ends
to restrain rotation along the long axis of the specimen. The saddles were effective and no
rotation or specimen instability was observed during testing.
Corners of flanges were cut as shown in Figure 18 in all the specimens to
facilitate bringing the specimens into the lab. Cuts were only made at the ends of the
beam and it is reasoned that thee cuts have negligible impact on strength of the beam.

25
Figure 18. Flange cut-off location at the ends of the specimen
Load was applied quasi-statically using a hydraulic jack at a rate of approximately
250 pounds per second. A steel I-beam was used to spread load from the jack to the
specimen (Figure 20). Rubber bearing pads were used at all support and load points.
Figure 19: Specimen braced by “saddle” at each support

26
Figure 20. I-beam used for spreading load from jack to specimen
Displacement, strain, and force were monitored and logged using a computer data
acquisition system. Strain gage locations are shown in Figure 21 and string potentiometer
locations are shown in Figure 22. String potentiometers were used to record vertical
displacement at mid-span of the specimens, where two were attached to stem and two
were attached to flange. Six strain gauges monitored concrete surface strain, two at the
edges of the foam voids, two on the bottom of the specimen below the load points, and
two on top of the flange at mid-span. The applied load was recorded using a pressure
gage, which was calibrated immediately prior to conducting the tests, and installed in the
hydraulic line supplying the jack. Area of the jack was 20.65 in2, therefore the applied
force was calculated by multiplying the gage pressure by the jack area.

27
Figure 21: Strain gauge (SG) locations
Figure 22: String pots (SP) locations. All SPs attached at mid-span
Specimens were loaded in seven different stages, in the following order: 1. Quasi-static load to 50 % of service load
2. Cyclic load (non-dynamic) between 20% to 50% of service load
3. Quasi-static load to 100% of service load
4. Cyclic load (non-dynamic) between 20% to 100% of service load
5. Sustain load test at 100% service for 24-hours (specimen L2 only)
6. Quasi-static load to flexural capacity
7. Quasi-static load to shear capacity
28
With the exception of stage 5 (more on this later), the tests were not based on any
standard code provisions. The test type and test sequence were selected to gradually
introduce load so that behavior could be evaluated under increasing levels of stress.
Details of the test geometry are presented in Figure 23 and Table 8. The
geometry of the test setup changed slightly during testing because a new spreader beam
was introduced after the test program was underway. The original spreader beam did not
have sufficient capacity to support the flexural load tests, particularly during shear
testing. Changes in geometry from the spreader beams were minor. The only significant
change in geometry during the test program was span length used during the shear tests
(stage 7). For these tests, the supports were moved to the edges of the foam voids to
ensure that the maximum shear force was applied through the foam void section. For all
other tests, the supports were located at the ends of the specimens.
In cyclic load tests (stages 2 and 4) load was applied for 100 cycles. Load cycles
were referenced to the service load. Data from the pressure gauge, strain gauges, and
string potentiometers were acquired only for the first five and last five cycles. The 24
hour sustained load test (stage 5) was conducted following the ACI 318-14, chapter
27[11].
The specimens were fabricated in fall 2015 and were brought the Clemson lab in
fall 2016 for testing. The gap between fabrication and testing was due to construction of
the strong floor at the Clemson lab. Testing began in October 2016 and ended in October
2017. The schedule of all the tests is shown in Table 9.

29
Figure 23. Dimensions to centerline of supports and to the end of specimen
Table 8. Test set up parameters
Stage Number
Stage Description
Geometry (ft) a L X
1 50 % service load test
12 (typ) 11.9 (N2) 34 0.5
2 20 % - 50 % cyclic load test
12 (typ) 11.9 (N2) 34 0.5
3 100 % service load test
12 (typ) 11.9 (N2) 34 0.5
4 20 % - 100 % cyclic load test
12 (typ) 11.9 (N2) 34 0.5
5 Sustained load test (only for L2) 12 34 0.5
6 Flexural load test
12 (typ) 11.9 (N2) 34 0.5
7 Shear test 7 (L1 & L2) 5.4 (N1 & N2)
25 (L1 & L2) 22(N1 & N2)
5 (L1 & L2) 6.5 (N1 & N2)
*Unless Noted Otherwise, stages and geometry are typical for all specimens.

30
Table 9. Tests schedule
Schedule of tests Stage
Number Stage Description Number of days after casting* L1 L2 N1 N2
1 50 % Service Load 380 410 494 653
2 20% to 50% cyclic load 380 410 494 653
3 100% Service Load 387 420 500 688
4 20% to 100% cyclic load 387 420 500 688
5 Sustained Load Test ------ 439 ------ ------ 6 Flexural Load Test 389 444 507 694 7 Shear Test 396 472 569 729
*Specimens were cast on 10/06/2015

31
VI. TEST RESULTS
Data from testing are typically reported in terms of moment and mid-span
displacement. Unless noted otherwise, the report displacement is always the average
displacement of the four spring potentiometers at mid-span. Displacement values do not
include self-weight displacements or camber. Moments are reported as the maximum
moment due to the applied loads and, except in a few cases which are clearly labeled, do
not include moment from self-weight. Similarly, strain data are only the strain due to
applied loads. Positive denotes tensile strain.
Stage 1: 50% service
The beams were loaded up to 15 kips in stage 1 to verify stability and adequacy of
the test set-up and to evaluate the performance of the FVDT specimens at low load levels.
The behavior of all specimens was similar for stage 1.The moment-displacement
behavior was linear-elastic for all the specimens and no visible cracks were observed
during this test stage. Strain data were linear-elastic, which confirmed the absence of
cracking. Specimens displaced 0.2 to 0.25 inches in stage 1. Moment-strain plots for
stage 1 are shown in appendix. Based on specimen stability and performance during
stage 1, a decision was made to proceed with the subsequent stages.
Stage 2: 100 Cycles between 20% and 50% service load
Parking garage DTs are subjected to millions of cycles of loading. In Stage 2,
specimens were tested for 100 cycles between 20% and 50% of the service load.
Admittedly, 100 cycles do not approach the condition of DT members in a parking

32
garages and performance of the specimens after 100 cycles does not suggest that the
specimens would perform similarly after millions of cycles. However, testing for 100
cycles was still deemed valuable because any issues observed during the first 100 cycles
would provide evidence to reject the foam-void concept.
Strain data from edges of foam and under point loads are shown in Figure 24 and
Figure 25. These data are from the last five load cycles for specimen L1 and are
representative of all specimens. Cracking was not observed either visually or in the strain
data. If cracking had occurred it would be reflected in the data as abrupt and extreme
changes in strain. Strain data in the tests was effectively linear-elastic and did not have
abrupt changes. It is also encouraging that cracks were not visually observed at the edges
of the foam during this stage. Also, as expected, flexural cracking did not occur during
stage 2.
Due an experimental error in stage 2, the peak load on L1 reached 65% of the
service load during one of the cycles. This did not affect in cracking at the edges of the
foam, but did result in flexural cracking and consequently reduced stiffness for L1 in
state 3.

33
Figure 24. Moment-strain response at edges of the foam for last five cycles during test
stage 2
Figure 25. Moment-strain response under point loads for last five cycles during test stage
2
0
20
40
60
80
100
120
0 0.02 0.04 0.06
Mom
ent (
kip-
ft)
Strain x 1000
G1 - L1G4 - L1
0
20
40
60
80
100
120
0 0.2 0.4 0.6
Mom
ent (
kip-
ft)
Strain x 1000
G2 - L1G3 - L1
G4 G1
G3 G2

34
Stage 3: Static test to 100% service load
The beams were loaded up to 100% service load (i.e. 28 kips) to evaluate service-
level performance. Similar behavior was observed in all the specimens. Based on prior
stress analysis of the specimens, flexural cracks were expected. Flexural cracking was
visually observed in all specimens between the load points. Moment-strain data for the
gauges under the point loads are plotted in Figure 26. Nonlinear strain response at higher
moments in some specimens also indicates the occurrence of cracking. Cracking was
more obvious in the L1 strain data and less obvious in strain data from the other
specimens.
Figure 26. Moment-strain plot for gauges under the point loads in test stage 3

35
Moment-displacement plot for all the specimens is shown in Figure 27. The
displacement was higher in case of L1 because it had undergone flexural cracking in
stage 2; the other specimens had not cracked during stage 2. Flexural cracks in L1
reopened at an applied moment near 120kip-ft during stage 3. Near the end of stage 3,
the normal-weight concrete specimens showed greater stiffness than the light-weight
specimens.
Figure 27. Moment-displacement plot for all the specimens in test stage 3
Strain data (Figure 28) show linear-elastic response for all gages except G1 on
specimen N1. This indicates that cracking did not occur during stage 3. In addition to
strain data, visual observations also confirm that cracking did not occur at the edges of
the foam during this stage.
The moment-strain data for specimen N1 at one end of the foam region shows
nonlinear behavior (Figure 28 left). This may be due to cracking but the nonlinear strain
0
20
40
60
80
100
120
140
160
180
200
0 0.5 1
Mom
ent (
kip-
ft)
Displacement (in)
L1L2N1N2

36
response was not observed in flexural load test (stage 6) results at that location. No cracks
were visually observed at the gage location. Thus, while the nonlinear behavior in N1
(gage G1) is noted, observations and data from other stages suggest that cracking did not
occur at the edge of the foam.
Figure 28. Moment-strain response at edges of the foam during service load tests
Strain data from gauges at the edge of the foam (e.g. Figure 28) has more noise
than strain from other gauges (e.g. Figure 26). This is primarily due to the relatively low
magnitude of strains measured at the edges of the foam and due to the sensitivity of the
gauges at low strain levels. The “clusters” of strain data occurring at intervals along the
data are due to pauses in loading.

37
Stage 4: 50% to 100% service
The same procedures and approach were taken for this stage as was described for
stage 2. The only difference was that the load level ranged from 50% to 100% service
load.
Strain data at edge of foam for last five cycles in the specimen L1 are shown in
Figure 29; data from other specimens are shown in the appendix. Based on strain data
and visual inspection, no cracking occurred at edges of foam. In case of the specimen
L1, the strain data at the edges of foam shows that there was approximately 20 micro
strain of residual strain after testing. Residual strains at the edges of the foam were not
observed in stage 4 data from the other specimens (L2, N1, and N2). While the residual
strain is noted in the data for specimen L1, no conclusions are reached regarding this
observation. If the residual strain was indicative of concrete damage, then cracking
would be expected during the subsequent flexural load test (stage 6). No cracking at this
location was observed visually or from strain data in the flexural test (stage 6) of L1.

38
Figure 29. Moment-strain at edges of the foam for the last five cycles
Stage 5: 24 hour sustained load test
This stage was conducted only for specimen L2. The test procedures followed
ACI 318-14 Chap. 27 [11]. The total applied load was 40 kip, which produced
approximately the same flexural stresses in the specimen as the load-level prescribed by
equation 27.4.2.2a in ACI 318 would produce in the baseline beam. Shear force in the
specimen at this load level was approximately 32% higher than the shear force in the
baseline beam at the ACI 318 specified load. The applied load in stage 5 was greater
than loads in stages 1 through 4.
The ACI 318 Chapter 27 test procedure provides a means of assessing structures
capacity of existing members. Flexure capacity for the sustained load is assessed by
considering total and residual displacements. The total displacement due to the loading at
the end of this test was 2.7 inches, and the residual displacement after load was removed
0
20
40
60
80
100
120
140
160
180
200
0 0.05 0.1 0.15
Mom
ent(k
ip-f
t)
Strain x 1000
G1 - L1G4 - L1

39
was 0.19 inches. Results are shown in Table 10 and comparisons to the ACI requirements
(27.4.5.5b) are shown in Table 11. To pass the requirements of ACI 318 Chapter 27, one
of two conditions must be satisfied. First, the total displacement must be less than the
value given by lt2/20000h, where lt is the span length and h is the member height. Second,
the residual displacement (∆r) must be less than ¼ of the total displacement (∆1) at the
end of the sustained load test. The specimen satisfied the second criteria and was deemed
as passing. Because the residual displacement was less than ¼ of the total displacement,
it was concluded that the specimen could likely have supported greater displacements
before reaching flexural capacity.
Table 10. Results of 24 hr sustained load test
Load (kip) Deflection (in) 0 0 8 0.13 16 0.31 24 0.56 32 1
40(Initial) 2.38 40(Final) 2.69
0 0.19 Total Displacement, ∆1= 2.69
Residual Displacement, ∆r= 0.19 Table 11. ACI conditions for 24 hr sustained load test
ACI Conditions:
1) ∆1 ≤ lt2/20000h lt = 34 ft, h = 28 in
∆1 > lt2/20000h Not
Satisfied 2.69 in. 0.30 in.
2) ∆r ≤ ∆1/4 ∆r < ∆1/4 Satisfied 0.19 in. 0.67 in.

40
Stage 6: Flexural load test
Load-displacement behavior during the flexural tests for all specimens is shown
in Figure 30. The figure also shows the moments associated with service level flexural
stresses and nominal flexural capacity. Comparisons with nominal flexural capacity will
be made in the next section.
Figure 30. Moment-displacement response during flexural tests
Load-displacement behavior was similar for all specimens during the flexural
tests. Response was initially linear-elastic. Stiffness decreased as flexural cracking
opened at a load of approximately ~19 kip (~120 kip-ft of moment). These cracks had
already formed during service load testing, so opening of the cracks at ~19 kip (~120 kip-
ft of moment) corresponded to decompression of the prestress.
New cracks formed and existing cracks extended (Figure 31) as load was
increased beyond the previous peak of 28 kip (175 kip-ft of moment from the service

41
load tests). As the force approached 50 kip (313 kip-ft of moment), stiffness was
effectively gone and the displacement was imposed without significant increase in load.
Testing continued until the jack reached its maximum stroke length. Because of changes
in the spacers and I-beams placed between the jack and specimen, the maximum
displacement achieved during testing was different for each specimen. Thus, maximum
displacement was a function of test set-up and is not used for comparison of specimens.
Figure 31. Widening of the cracks and formation of new cracks during flexural load test
Crushing of the top flange was not observed in any of the specimens during the
flexural load tests. It is likely that the specimens could have supported additional
displacement prior to crushing of the flange; however, it is not likely that the peak load
would not have increased significantly. Residual displacement of approximately 3 in.

42
(specimen L2) to 10 in. (specimen N1) was observed in the specimens after the load was
removed.
Each specimen’s behavior was ductile at loads near the peak experimental load.
However, relative ductility of specimens cannot be compared using the available data. As
previously mentioned, testing was terminated when the hydraulic jack reached the
maximum stroke; based on differences (height of spreader beam and spacers between the
specimen and jack) in test setups, the available stroke length was different for each test.
Thus, the apparent differences in ductility are a function of testing limitations and not a
function of the specimens.
Strain gages G1 and G4 were placed at angle on the concrete surface near the
foam ends (Figure 32) to monitor for cracking. This location is of interest because of the
abrupt change in cross section due to termination of the foam. The rational for placing the
gages at an angle were to approximately align with the direction of the principal tensile
stresses. Load-strain response of these gages was effectively linear-elastic throughout the
flexural load tests (Figure 32), suggesting that cracks did not form at this location. Visual
inspection during testing also confirmed that cracks did not form in the concrete adjacent
to the ends of the foam. Thus, it is considered unlikely that shear cracks would form at
this location in FVDT parking garage members having similar detailing and material
properties as the test specimens.

43
Figure 32. Moment-strain response at edges of the foam during flexural load tests
Figure 33 shows the cracks in the web at the mid-span of specimens after
approaching to the ultimate load. Figure 34 shows the propagation of cracks in specimen
L1 throughout the loading stages. This pattern of cracking was similar for all specimens.
The majority of the cracks in the stems occurred within the middle 20 ft of the specimens.
Flexural cracks originated during the service load testing and then expanded and
developed further from the load points during the flexural load test.

44
Figure 33: Crack pattern around mid-span of all the beams during flexural load test
Figure 34: L-1 Cracking Pattern

45
Stage 7: Shear load test
In the final stage, the specimens were tested for shear capacity. The supports
were moved inwards by 5 to 6 ft on both ends so that the maximum shear force was
carried through the foam void section. Displacement data were collected using string
potentiometers; however, these data are not insightful as the specimens had already
cracked by this stage and there was a residual set in them. The main insight behind this
test stage was to find the experimental shear capacity.
Failure behavior was distinct for different specimens. Specimen L1 failed in
flexure due to a strand rupture (shown in Figure 35) below one of the load points.
Specimen L2 did not fail completely as it was not possible to load it further after the
stroke length of the cylinder reached its maximum limit. Specimens N1 and N2 failed in
flexural-shear (shown in Figure 36 and Figure 37). It can be observed from figures that in
case of N1, the crack crossed one stirrup before reaching the flange and in N2, the failure
resulted from the crack which reached the flange straight from the web without crossing
any stirrup. The critical cracks (those associated with shear failure) in N1 and N2 had
occurred during flexural testing. For N2 the failure occurred due to shear failure of the
compression zone. For N1 the failure was a more classical flexural-shear mechanism.
The peak applied shear force, failure mode, and other observations of each specimen are
summarized in Table 12.

46
Figure 35. Specimen L1 at location of strand rupture
The upper-most strand in the photo was the debonded strand which was cut after the
test program was finished.
Figure 36. Flexure-shear failure in the specimen N1

47
Figure 37. Compression zone shear failure in the specimen N2
It may be questioned that a virgin specimen should be tested to determine
experimental shear capacity. By the time that the beams were tested in shear in stage 7
they had been subjected to flexural cracking from the earlier stages. It is reasoned that
the shear strength of damaged (pre-loaded) beams should be the same or lower than if the
shear tests were conducted on a virgin beam. It is considered unlikely that the shear
strength of an undamaged beam would be less than the shear strength of the damaged test
specimens.

48
Table 12. Shear test results
Shear test results of all the specimens Specimens Failure Mode Peak Shear
(kip) Notes
L1 Flexural (strand rupture)
46.7 Strand rupture below load point and resulted in sudden collapse
L2 Not failed 58.9 Terminated due to reaching maximum stroke length of jack
N1 Shear 47.5 Flexural-shear failure below the load point
N2 Shear 59.1 Flexural-shear failure below the load point

49
VII. ASSESSMENT OF EXPERIMENTAL OBJECTIVES
Comparison with nominal flexural capacity
The first objective was to evaluate experimental flexural capacity of FVDT
specimens relative to their calculated nominal capacity. Flexural capacity was calculated
using the strain compatibility approach. Calculations (shown in appendix) used the
constitutive model for strands from the PCI Design Handbook [9]. Based on material
tests, average concrete compressive strength used in the flexural calculations was taken to
be 9380 psi for NWC and 9880 psi for LWC. The presence of foam did not impact the
calculations because the theoretical compression block was within the flange at nominal
capacity.
The experimental capacities were reasonably close calculated nominal flexural
capacities. The experimental moments exceeded the calculated nominal flexural
capacities by 15% to 17% (Table 13). On average, the specimens supported experimental
moments that were 16% larger than their nominal flexural capacities.
Table 13. Comparison of experimental and nominal moments
Specimen
Max moment
due to self-weight (kip-ft)
Max moment due to
applied load
(kip-ft)
Total experimental
moment, Mexp
(kip-ft)
Nominal flexural capacity,
Mn (kip-ft)
Strength
ratio, Mexp/Mn
L1 38.3 320 358.3 305.5 1.17 L2 36.7 314.4 351.1 305.5 1.15 N1 44.1 314.4 358.5 305.3 1.17 N2 42.3 319.4 361.6 305.3 1.17
Average 1.17

50
The experimental moment was compared with the nominal capacity of the specimens
rather than that compared with the nominal capacity of the baseline beam. This is due to
the fact that the cross-section and prestressing were different than in the test specimens
than the baseline. Although the experimental and nominal capacities of the specimens
cannot be compared directly with the baseline beam, the level of agreement between the
experimental moment of the specimens and their nominal capacity suggests that the same
calculation approach would be appropriate for the baseline beam. For the first objective,
it is concluded that the nominal capacity calculations were conservative but sufficiently
accurate (within 15%) for FVDT, and the strain compatibility-based flexural calculations
are accurate for FVDT members.
Comparison with factored shear of baseline beam
For the second objective, the experimental shear was compared with the factored
design shear force in the baseline beam. Recall that the shear demand in the baseline
beam is 28.7 kip (NWC) and 27.3 kip (LWC) (Table 12). These shear forces are located 5
ft from the ends of the baseline, this is the location wherein the foam void started in the
specimens.
Maximum experimental shear forces and factored shear demand in baseline beam
are compared shown the Figure 38. Because of the support set-up for the shear tests, the
maximum experimental shear force crossed the foam-void section of the specimens. In
most cases, the maximum experimental shear force corresponded with shear failure;
however in the case of L2 the maximum shear did not result in failure (see discussion of

51
test stage 7). Figure 38 also shows the contribution of the reinforcement to the nominal
shear (Vs) capacity of the specimens. This quantity was calculated using ACI 318
equation 22.5.10.5.3 [11]. The concrete contribution was not consdiered in the
calculations because the shear area was interupted by the foam voids. As such, it was
considered conservative to ignore the concrete contribution.
Two points are made regarding Figure 38 . First, the experimental shear forces
were significantly (at least 66 %) more than the factored shear demand in the baseline
beam. This suggests that the beams with foam voids may be suitable for carrying shear
forces in parking garages. Second, the experimental capacity was significantly more than
the steel contribution to nominal shear capacity. From this result it is concluded that the
concrete, inspite of the foam, was a significant contirbutor to shear capacity. This may be
attributed to the relatively high concrete strength, which was approximately 10 ksi at the
time of testing. It is suggested that lower concrete strength be considered in any future
tests.
The test specimens did not have a topping slab which would be present in the
baseline beam. The presence of topping would likely have increased the shear capcity of
the specimens; however, the specimens exceeded the baseline beam’s shear demand even
without the topping. This further confirms that FVDT specimens were more than
sufficient for carrying parking garage shear loads.

52
Figure 38. Comparison of experimental shear with the demand in baseline beams
Cracking at the edges of foam
The third and final objective was to evaluate cracking behavior (if any) at the end
of the foam void. This was done by using visual observations and strain gage
monitoring. This objective was considered during stages one though six; in stage seven
the load did not pass through the section in question.
Intuitively, the transition point between the solid and foam-void portions of the
specimens was considered as a likely location for cracking. The cross-section changes
abruptly at this location and the corners of the foam void were likely locations for stress
concentrations. In spite of these conditions, no cracks were observed near the edges of the
foam. As was shown previously in the Figure 32, the moment-strain relationship reported
by strain gages at the edges of the foam was linear-elastic throughout the flexural load
test. Furthermore, no cracks were observed during visual inspections. As with the
27.3 27.3 28.7 28.7
46.7
58.9
47.5
59.1
22 22 22 22
0
10
20
30
40
50
60
70
L1 L2 N1 N2
Shea
r (ki
p)
Specimens
Vu
Vexp
Vs

53
concrete contribution to shear capacity, the absence of cracking may have been due to the
relatively high concrete strength at the time of testing. The absence of cracking at the
edges of the foam during the tests suggested that the concrete strength, foam detail, and
reinforcement detail provide adequate resistance to cracking under parking garage load
conditions.

54
VIII. CONCLUSIONS AND RECOMMENDATIONS
This thesis reports the results of experimental testing of four foam-void precast
prestressed tee-beams. The tests were complimented by structural analyses of a
“baseline” beam which the specimens were designed to mimic. The baseline beam was a
typical 60-ft span precast DT member for a parking garage. The motivation for the
research was to reduce the self-weight of parking garage DT members such that two
members can be shipped in one load.
The experimental program had three specific objectives:
• Evaluate experimental flexural capacity of FVDT relative to calculated
nominal capacity;
• Evaluate experimental shear capacity of FVDT relative to factored shear force
in baseline beam; and
• Evaluate cracking behavior (if any) at the end of the foam void.
Test program conclusions
The following conclusions are made with respect to each of the stated objectives:
• The foam-void test specimens supported experimental moments that exceeded
theoretical nominal capacity. The ratios of experimental-to-nominal moment
capacities were between 1.15 and 1.17. It was concluded that classical
flexural theory can be reasonably applied to precast concrete DT members
with foam-voids placed in the web.

55
• The test specimens had significantly more shear capacity than the calculated
shear demand of the “baseline” parking garage beam. The experimental shear
capacity of the specimens was always greater than two times that of the
calculated shear demand. In spite of the foam-voids placed within the web, the
concrete contribution to experimental shear capacity was always greater than
the calculated contribution from the steel reinforcement.
• Cracking was not observed at the end of the foam voids near the ultimate load
levels. Thus, cracking at the foam ends would not be expected in service
conditions for similar foam-void DT members.
The above observations are specific to the tested specimens and are conditional on
the concrete strength, transverse reinforcement, and other structural details. The
minimum compressive strength for any specimens at the time of testing was on an
average 9610 psi. Transverse reinforcement consisted of double-leg #3 stirrups spaced at
12 in.
Recommendations for design
When designing foam-void double-tee members, it is recommend that classical
flexural theory be applied. The foam voids had no observable influence on the flexural
capacity or behavior of the test specimens. Care should be taken, however, if the
compression block is interrupted by the foam void or if the void is placed at a location
that would interrupt bond between strands and concrete.

56
Regarding shear design, the shear reinforcement details used in the test program
are recommended unless an alternative detail is experimentally validated. The tested
foam-void thicknesses (1 in. and 2in.) are recommended for use with the tested shear
reinforcement detail. Foam voids should not be placed within 5 ft (approximately two
times the beam height) from member ends. Chamfering or curving the edges of the foam
boards at the transition to a solid cross section, while not done in the test program, are
recommended; this can be easily implemented by cutting the foam boards prior to
placement in the webs.
The recommendations do not change with respect to concrete unit weight. The
above recommendations apply to FVDT members with reduced-weight and normal-
weight concretes.
Recommendations for future testing
The experimental program considered four specimens with variable unit-weight
of concrete and thickness of the foam. The member size, strand pattern, reinforcement
details, depth of foam void, and length of foam void remained constant. If future tests are
to be conducted, the following variables and conditions are recommended:
• Thicker foam voids are recommended for testing. Thickness of the foam in
the current test program was on the conservative side. Future tests could
“push the limit” of foam thickness to see how far the concept can be taken.
• Deeper foam voids are recommend if deeper members are tested.
57
• To reduce any effects of stress concentrations at the edges of the foam voids,
chamfers or curves of the foam boards are recommended. This wasn’t an issue
in the current test program, but is unlikely to have any negative impact and
can be relativity easily implemented.
• Combinations of foam void thickness and concrete unit weight that are likely
to result in two-at-a-time trucking are recommended for testing. Figure 10 can
be used as a starting point for selecting variables.
• Concretes having lower compressive strengths are recommended for use in
future FDVT test specimens. The compressive strengths in the current
program were 9610 psi or greater.
• Alternative shear reinforcement details are suggested for consideration. One
possibility is the use of bent wire mesh that sandwiches the foam void (Figure
39). Similar to the concept in the current test program, the bottom bend can
anchor the mesh around the prestressed strands. Distinct from the current
program, the foam would be anchored to the mesh using tie wire instead of
welded cross pieces. This detail would reduce the effort required to make
custom stirrups used in the test program. It would also ease the placement of
the foam boards because the top cross pieces are replaced by wires that can be
installed after the board is in place. This detail would require enough wire ties
at the top to prevent the foam from floating upward when the concrete is cast.

58
Figure 39. Alternative shear reinforcement recommended
Final Comments
The overall goal was to create a FVDT parking garage members that allowed two-
at-a-time trucking. The FVDT test specimens had desirable structural performance,
while also having a degree of weight reduction. The weight reducing measures in the test
program didn’t “push the limits” of the foam void concept, but still provide up to 8%
weight reduction relative to a solid DT section. The measures (foam board thickness and
concrete unit weight) in the test program may facilitate two-at-a-time trucking in some
specific circumstances; however, the variables do not provide sufficient weight reduction
associated with the constraints (member size, vehicle weight, GVW limits) associated
with typical parking garage members. The thesis author hopes that this work will
nevertheless act as a stepping stone from which even lighter FVDT parking garage
members may be studied, tested, and implemented.
59
REFERENCES 1. Nasser, G., Tadros, M., Sevenker A., and Nasser D., “The Legacy and Future of
an American Icon: The Precast, Prestressed Concrete Double Tee,” PCI Journal
(2015).
2. Wilden H. “Setting the Record Straight on the Origin of the Prestressed Double
Tee” (2014) http://www.enconunited.com/pdf/Double%20Tee%20Origin.pdf
Accessed 28 June 2017.
3. Edwards, H., “The Innovators of Prestressed Concrete in Florida.” PCI Journal
(1978).
4. (“PCI Northeast - Projects” n.d.), http://www.pcine.org/projects/project.cfm
Accessed 10 November 2017.
5. Barney, G., Corley, W., Hanson, J., and Parmelee, R., “Behavior and Design of
Prestressed Concrete Beams with Large Web Openings,” PCI Journal (1977).
6. Savage, J., Tadros, M., Arumugasaamy, P., and Fischer, L “Behavior and Design
of Double Tees with Web Openings,” PCI Journal (1996).
7. Saleh, M., Tadros, M., Einea, A., Fischer, L., and Foster, E “Standardized
Design of Double Tees with Large Web Openings.” PCI Journal, (1999).
8. BubbleDeck Systems. (2008), http://www.bubbledeck.com/ Accessed 28 June
2017.
9. ASCE. 2010. Minimum Design Loads for Buildings and Other Structures.
ASCE/SEI Standard 7-10

60
10. PCI. “PCI Design Handbook 7th Edition” Precast/Prestressed Concrete Institute
(2010).
11. ACI Committee 318, “Building Code Requirements for Structural Concrete (ACI
318-14) and Commentary (ACI 318R-14),” American Concrete Institute,
Farmington Hills, MI, 2014, 519 pp.

61
APPENDICES
Appendix A: Analysis of Baseline beam

62

63

64

65

66

67

68

69

70

71
Appendix B: Stage 1 test data
0
15
30
45
60
75
90
105
0 0.02 0.04 0.06
Mom
ent (
kip-
ft)
Strain x 1000
G1-L1G1-L2G1-N1G1-N2
0
15
30
45
60
75
90
105
0 0.1 0.2 0.3
Mom
ent (
kip-
ft)
Strain x 1000
G2-L1G2-L2G2-N1G2-N2

72
0
15
30
45
60
75
90
105
0 0.1 0.2 0.3 0.4
Mom
ent (
kip-
ft)
Strain x 1000
G3-L1G3-L2G3-N1G3-N2
0
15
30
45
60
75
90
105
0 0.02 0.04 0.06
Mom
ent (
kip-
ft)
Strain x 1000
G4-L1G4-L2G4-N1G4-N2

73
Appendix C: Stage 2 test data
0
20
40
60
80
100
120
0 0.02 0.04 0.06
Mom
ent (
kip-
ft)
Strain x 1000
G1-L1G1-L2G1-N1G1-N2
0
20
40
60
80
100
120
0 0.2 0.4 0.6
Mom
ent (
kip-
ft)
Strain x 1000
G2-L1G2-L2G2-N1G2-N2

74
0
20
40
60
80
100
120
0 0.1 0.2 0.3 0.4
Mom
ent (
kip-
ft)
Strain x 1000
G3-L1G3-L2G3-N1G3-N2
0
20
40
60
80
100
120
0 0.02 0.04 0.06
Mom
ent (
kip-
ft)
Strain x 1000
G4-L1G4-L2G4-N1G4-N2

75
Appendix D: Stage 4 test data
0
20
40
60
80
100
120
140
160
180
200
0 0.05 0.1 0.15
Mom
ent(k
ip-f
t)
Strain x 1000
G1-L1G1-L2G1-N1G1-N2
0
20
40
60
80
100
120
140
160
180
200
0 1 2 3
Mom
ent(k
ip-f
t)
Strain x 1000
G2-L1G2-L2G2-N1G2-N2

76
0
20
40
60
80
100
120
140
160
180
200
0 0.2 0.4 0.6 0.8
Mom
ent(k
ip-f
t)
Strain x 1000
G3-L1G3-L2G3-N1G3-N2
0
20
40
60
80
100
120
140
160
180
200
0 0.05 0.1
Mom
ent(k
ip-f
t)
Strain x 1000
G4-L1G4-L2G4-N1G4-N2

77
Appendix E: Calculation of specimen nominal capacity

78

79
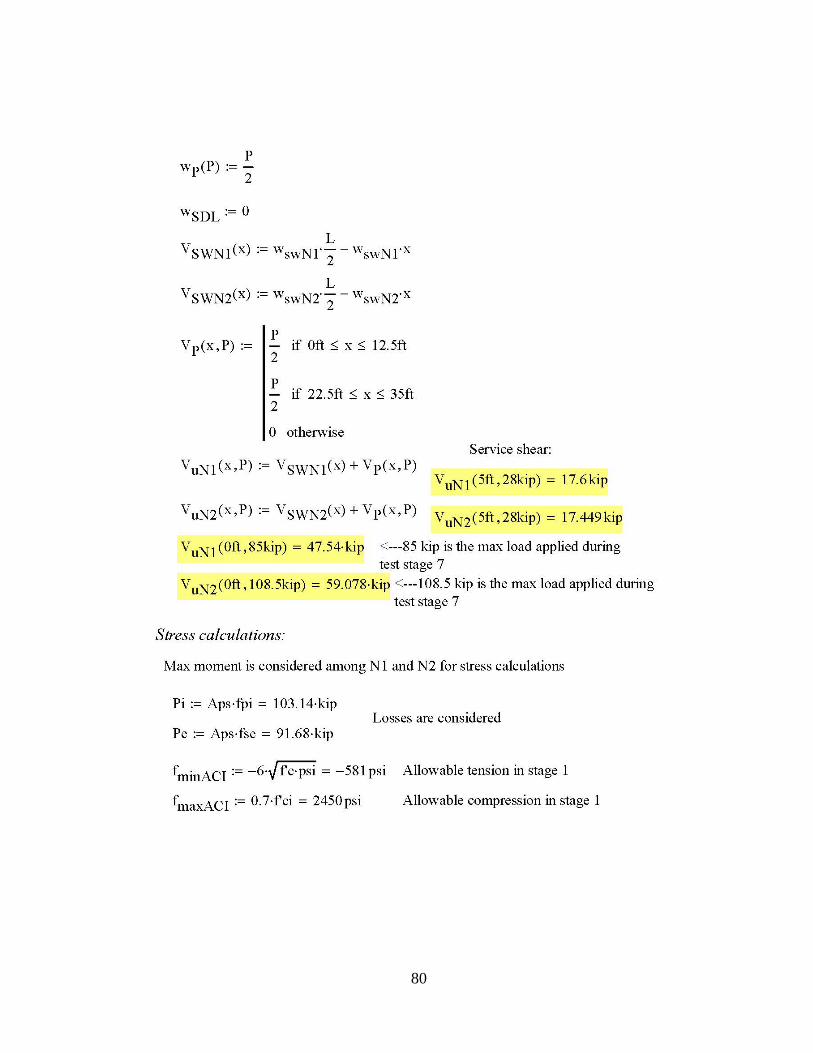
80

81

82

83

84

85

86

87

88

89

90