Experimental bench for study of settling-consolidation ...
12
HAL Id: hal-01006838 https://hal.archives-ouvertes.fr/hal-01006838 Submitted on 5 Dec 2018 HAL is a multi-disciplinary open access archive for the deposit and dissemination of sci- entific research documents, whether they are pub- lished or not. The documents may come from teaching and research institutions in France or abroad, or from public or private research centers. L’archive ouverte pluridisciplinaire HAL, est destinée au dépôt et à la diffusion de documents scientifiques de niveau recherche, publiés ou non, émanant des établissements d’enseignement et de recherche français ou étrangers, des laboratoires publics ou privés. Experimental bench for study of settling-consolidation soil formation Alain Alexis, Gilbert Lebras, Pierre Thomas To cite this version: Alain Alexis, Gilbert Lebras, Pierre Thomas. Experimental bench for study of settling-consolidation soil formation. Geotechnical Testing Journal, ASTM International, 2004, 27 (6), pp.557-567. 10.1520/GTJ11582. hal-01006838
Transcript of Experimental bench for study of settling-consolidation ...

HAL Id: hal-01006838https://hal.archives-ouvertes.fr/hal-01006838
Submitted on 5 Dec 2018
HAL is a multi-disciplinary open accessarchive for the deposit and dissemination of sci-entific research documents, whether they are pub-lished or not. The documents may come fromteaching and research institutions in France orabroad, or from public or private research centers.
L’archive ouverte pluridisciplinaire HAL, estdestinée au dépôt et à la diffusion de documentsscientifiques de niveau recherche, publiés ou non,émanant des établissements d’enseignement et derecherche français ou étrangers, des laboratoirespublics ou privés.
Experimental bench for study of settling-consolidationsoil formation
Alain Alexis, Gilbert Lebras, Pierre Thomas
To cite this version:Alain Alexis, Gilbert Lebras, Pierre Thomas. Experimental bench for study of settling-consolidationsoil formation. Geotechnical Testing Journal, ASTM International, 2004, 27 (6), pp.557-567.�10.1520/GTJ11582�. �hal-01006838�

A lain Alexis, 1 Gilbert Le bras, 1 and Pierre Thomas1
Experimental Bench For Study of
Settling-Consolidation Soil Formation
ABSTRACT: A laboratory experimental bench suiting the evolution survey of little concentrated materials in the course of deposition is presented here. The materials concerned can be in formation soils (mud) or any other fine granular materials, however, all characterized by their strong deformability and by their complex behaviour with constant changes from settling to consolidation phases. First, the already available experimental devices are summed up in a state-of-the-art section. The restraints imposed by the material (properties, consistency, quick evolution) have directed the development towards automated settings consisting of a column containing the material studied, a gammadensitometer and a pressure sensor. The device proposed here, the experimental procedures and the result post -processing are described in detail to provide an accurate follow up of the densities and of the interstitial excess pore pressures. The most original feature of the device lies in the possibility to obtain profiles within the first minutes of the evolution. The results, presented here in terms of effective stress and pore pressure, make it possible to delimit the range of validity of the usually adopted constitutive laws better.
KEYWORDS: sedimentation, consolidation, soils, mud, pore pressure, gammadensitometer
Many industrial and scientific domains are concerned by an improved understanding of the settling-consolidation link during the deposition of fine mineral materials. Port and estuary silting, and dredging deposit on shore are among the most striking examples, but it also affects some ore deposits and grout implementation. Theoretical studies (Tan and Scott 1988, Toorman and Berlamont 1991,Alexis et al. 1992, Toorman 1992) have shown the relevance of suiting experimental devices, which can be used to test the validity of the constitutive laws adopted in models.
This paper initially presents a detailed automated experimental device used to measure densities and pore pressure at the beginning of the self-weight consolidation without disturbing the extremely sensitive materiaL The complexity of the system is dependent on the achievement of the best compromise between the quickness and the accuracy of the measurements. The interpretation of some experimental density and pressure results is presented to show the potential of the system.
The various experimental devices found in the literature are summarized in Table 1. Destructive density measurements (coring, slicing, syringing) cannot be used to follow the evolution of the profiles. Non-destructive density measurement, on the other hand, uses X-ray or gamma sources, the radiation of which through the material is measured in places.
Pore pressure measurements, nevertheless essential for the observation of dissipation phenomena, are not always performed. The non-negligible fluid exchange phenomenon between column and measuring system, which can disturb both the measurement and the material behavior, is the inconvenience of the standpipes. Most authors usually use one sensor for each pressure tapping. The system proposed here, on the other hand, uses one single sensor successively linked to each pressure tapping.
The different translucent columns presented in the literature (Table 1) are not of the same size (the inside diameter ranges from
1 Laboratoire de Genie Civil de Nantes Saint-Nazaire, IUT de Saint-Nazaire. Saint Nazaire, France.
47-I 12 mm, and the height from 1 14-4000 mm). Similarly, the length of the tests varies from a few hours to over four months.
The bibliographic study also shows the evolution of the experimental settings. The first studies, indeed, are characterized by observation and empirical approach of the phenomena (Owen 1970).
Then, oedometers suiting low stresses have been used (Monte and Krizek 1976), sometimes coupled with a sampling method (Umehara and Zen 1982) or a gamma source and several pressure sensors (Tan et al. 1988). A great step forward was taken when routine tests began to be systematically performed out in columns with an accuracy suiting low densities and stresses better (Been and Sills 1981, Sills 1995). More recent settings (mostly developed within the context of the European Program MAST) are inspired by the preceding one (Menge et al. 1991, Toorman 1992, Berlamont et al. 1992, Alexis et al. 1992, Gallois 1995, Le Bras 2000, Masutti 2001).
Moreover, many references refer to Ph.D. theses (the accessibility to which is often uncertain), whereas the published papers too often present results without justifying the choices, the equipment and the procedures used. That is why, considering the sharp increase in the sophistication of the experimental settings, clarifying the whole experimental process to improve the reproducibility of the tests and, therefore, the scientific and experimental progress, appears essential here.
Settling-Consolidation Bench Design
General Methodological Choices
The study of soils in the course of settling-consolidation is confronted with two antagonistic requirements: quickness and accuracy. The quick evolution of the material at the beginning of the test, indeed, requires performing measurements during the first minutes of the phenomenon. The interpretation of the very low effective stresses and, particularly, hydraulic gradient values (stemming from the difference between two pressures), on the other hand, also requires a measurement accuracy of a few pascals for both stresses
1

Ref
eren
ces
Ale
xis
et a
l. (
19
92
) B
een
et
al.
(19
81
)
Gal
lois
( 1
99
5)
Imai
(1
98
1)
Le
Bra
s (2
00
0)
Mig
nio
t et
al.
(19
90
) S
anch
ez e
t al
. (1
99
2)
Set
hi
et a
l. (
19
86
) S
hen
et a
l. (
19
94
) S
ills
(1
99
5,
19
97
)
Sri
dh
aran
et
al. (
200
1)
To
orm
an (
19
92
) W
ich
man
(2
00
0)
Zen
an
d U
meh
ara
(19
86
)
TA
BL
E !
-Sy
nth
esis
of d
evic
es a
nd e
xper
imen
tal
cond
itio
ns.
Co
lum
ns
Exp
erim
enta
l Co
nd
itio
ns
int.
dia
m.*
H
(mm
)
90
*1
70
0
10
2*
20
00
90*
170
0
50*
250
20
0x
250
90
*!70
0
86*
250
to
40
00
1
00
?*20
00
1
12
.5*
32
0
47
*1
14
1
01
.6*
20
00
50
x?
98
*2
00
0
10
2*
? 5
5*
35
0
Tem
p.
Max
. d
ura
tio
n
Mat
eria
l CO
C)
(day
s)
ple
xig
las
10
ac
ryli
c V
aria
ble
ple
xig
las
10
?
? p
m m
a 1
0
? 2
0
? 2
1
ple
xig
las
? 22
to
27
ac
ryli
c ?
? ?
ple
xig
las
13
ac
ryli
c ?
vyn
il
?
62
1
00
62
3
3
2
62
100
0.1
2
�7
1
42
? 93
94
80
Inst
rum
ent
Typ
e
rra
ys
X ra
ys
rra
ys
Sli
cin
g
rra
ys
rra
ys
cori
ng
sy
rin
gin
g
X ra
ys
X ra
ys
cori
ng
r
rays
X
rays
sl
icin
g
Den
sity
Mea
sure
men
t P
ore
Pre
ssu
re M
easu
rem
ent
Tra
nsl
atio
n
Sp
atia
l R
esol
uti
on
(mm
) (m
m)
Acc
ura
cy
Sen
sors
F
ilte
rs
12
00
�
IOm
m
+/-
0.0
05
7
fix
ed, 2
0 k
Pa.
20
, p
oro
us
bro
nze
1
20
0?
+/-
1
0.0
! I +
shif
tin
g c
on
nec
tio
ns,
2
1, p
oro
us
sto
nes
3
5 k
Pa
15
00
3
0
1 +
10
tap
s co
nn
ecti
on
s 1
0, p
oro
us
sto
nes
�
10
?
15
00
2
5
0.0
01
a 0
.00
5
1 +
Pre
ssu
re m
ult
iple
xin
g
10
, ci
gar
ette
filt
ers
un
it,
2.5
kP
a ?
75
?
? �
30
?
? 2
1
20
0
1 +
/-0
.00
2
Pre
ssu
re m
ult
iple
xin
g u
nit
, 3
5 k
Pa
? ?
200
0
? +
/-0
.03
st
and
pip
es
cig
aret
te f
ilter
s 1
0
.00
2
1 +
8 c
on
nec
tio
ns
? 3
50
? ?
stan
dp
ipes
p
orou
s st
on
es
Acc
ura
cy
(Pa)
35
20
3
10
10
c..
2

and pressures. Both requirements, moreover, can be intensified by the strong sensitivity of the material to disturbances and by its normal evolution during the test, which can disturb the repeatability of the results. All these restraints have directed the researches towards the development of an automated device, based on nondestructive density and pore pressure measurements within a controlled environment, following up the vertical profiles achieved the evolution of the phenomena (duration of approximately 30
Density profiles are mainly achieved using the vertical shifting of a gammadensimeter along the column containing the material. For bulk, availability, and cost reasons, gamma rays have been preferTed to X-rays. It should be emphasized that the use of ionizing radiation imposed some constraints (legal and medical) on the bench scientists.
Because the translation time of the carriage necessarily causes a time delay between the measurements carried out at the bottom and those performed at the top of the column, both an ascending and a descending profile are systematically perfonned in order to achieve, after a time-centered profile. Reference times (instants where the densitometer is in the up position) have been selected so as to be consistent with the speed of evolution of the phenomenon observed. In this way, reference times are here in a geometric progression with a common ratio of 2 (like in the oedometer from 22.5 min to 32 days profiles). To take advantage of the quickness of the system, the first profile spacing is one whole (2.7 min). Consequently, the first five reference times are: 1.33 min, 4.15, 6.9, 9.66, and 12.45 mins. The last two weeks can be used to start a new test with the same equipment on another adjoining column.
In to pressure measurements, the most direct method consists of placing a sensor at each selected pressure tapping. Besides its cost, which is not negligible for 10 pressure tappings, this method needlessly measures the hydrostatic pressure (a constant component of approximately 15 kPa) and is sensitive to the unavoidable long-tenn clock drift of the sensors, which can affect nificantly the hydraulic gradient values. To avoid these problems, we use a specific measurement method, which is not clearly described in the literature. This method (called "overpressure mode") uses one pressure sensor only, which connects successively and automatically to each pressure tapping l ). The problem of the stabilization time required for each connection, can, however, be settled quickly by conducting pressure profiles simultaneously with density profiles.
The equilibrium at the pressure tapping is given by:
u + Yw ·(Ho Um + Ywo · (Xc- x)
where respectively, Ho, Xc, x: dimensions of the water-air interface, of the sensor, of
the pressure tapping,
Yw, Ywo: the weight density of natural water (in the column), and of clean water (in the tubes),
u, Um: the excess pore pressure and the pressure measured by the sensor.
Then, the measured pressure is:
Um U + Ywo · + ·(Ho (2)
So, for each pressure tapping, the sensor measures the excess pore pressure plus a constant. Densities of natural and clean water being very close, the measuring range of the sensor can be reduced by positioning it close to the top of the column (low Ho while maintaining positive measured pressure values. This method makes it to limit the measuring range to 2500 Pa (equivalent to 25 cm of water) and, therefore, to achieve a higher absolute accuracy for a given type of sensor (given relative accuracy).
Regarding the sequence of measurements and profiles, the system automation 2) is used to control all the measurement prC)Cedm'·es, to provide a better management of time (night, weekends, parallel tests) and, consequently, a better reproducibility of the results. The whole measurement device and the materials are also placed in a I ooc ± 1 °C climatic chamber to prevent any breakdown of matter within natural materials.
Elaboration and out of the Columns
The main bench characteristics are summarized in Fig. 3. Each column is closed at the top, using a cover valve, equipped with a small tube to maintain a contact with the atmospheric pressure while preventing evaporation. The column has a constant outside diameter without outgrowth to leave the density move freely along the column and, thus, provide density profiles along the whole length of the column.
The pressure nozzles positioning is very accurate 0.01 mm are equivalent to a pressure of 0.1 Pa) to cause the accuracy of the pressure measurement no prejudice. The PVC nozzles are hot-welded to the column (using a PVC welding rod). Stabilization annealing is then practiced on the column to minimize the intemal tensions
Pure water (Ywo) Natural water (Yw) Pressure sensor (Um)
Ho
:vfeasurement
FIG. !-Excess ovetpressure measurement method
3

Position sensor
Controlled
Electric
motor
Shining carnage
Scintillometer
Frame
Pressure connexion
Connecting tube
Pressure sensor
Multiplexing unit
To motor
control
Tested soil
Control and data unit
FIG. 2-Schematic of the gammadensitometer bench.
1500 mm
10 pressure nozzles w rth
cigarette filters -----'
PVC mt. Diam. 90 lOOmm, height
FIG. 3--Gammadensitometer bench characteristics.
induced by welding within PVC pipe. For pore pressure measurements, each nozzle includes a cigarette filter to prevent the dispersion of the material grains. Sintcrbronzc filters were first used, but they clogged easily and were difficult to clean. The adopted
made of filter tips and in a bronze performed better that they arc replaced in each new test. Each nozzle is connected to a 1.59-mm inside diameter translucent nylon tube filled with distilled water.
4

FIG. 4 Gammadensiromerric bench.
Pore Pressure Measuring System
The overpressure measuring system (Fig. 4) consists in a multiplexing unit (used to select each pressure tapping) and in a pressure sensor (positioned to measure ovcrpressures).
At the beginning of the study the multiplexing unit was rn•Y>nAC>>f1
of solenoid valves connected in parallel, but the device was difficult to bleed and could generate transient spurious overprcssures. With the adopted multiplexing unit, every next input is selected through an impulse with a maximum rate of 20 selections per second pcrfonncd by the rotary motion of a perforated disk to avoid spurious overprcssures.
Density
The density carriage (Fig. 5) consists of the radioactive source and the scintillation counter, which is fastened to a strand. The different phases followed by the densitometric are: the gamma rays are mrliated by the radioactive source, the gamma rays are absorbed by the material depending on its density, the attenuated radiation is converted into electrical impulses by the scintillation counter, and the calculator counts the impulses and calculates the
of the materiz1Y to data. The gamma-ray presents a maximum actual �cam width
of 30 •,fie beam standard aperture. The density source effects and
FIG. 5-Derai/ column and gammadensitometric carriage.
A speed regulator controls an engine, which drives the density into traveling motion. With a time constant of l sec. the
accuracy of the gammadensitometer is 0.001 in static position, 0.002 at 4 mm/s, and 0.005 at 23 mm/s, which are the velocities used in this The position of the carriage is measured by a position transducer (the first transducer used, consisting of a photoelectric cell counting the driving screw turns, was simple and cheap but not accurate enough).
Cmurol Data Unit
The control and acquisition pa11 of the settling-consolidation bench is provided by a data unit, which principally controls the densitometer caniage engine direction, speed, acceleration ramp) and the multiplexing unit (pressure tapping selection impulses), manages the profile times according to the preset planning, carries out the measurements from the sensors (relative density, pressure, distance, temperature), stores all measurements and reference values and transfers them towards the PC, and can finally be used to view the parameters in a real-time mode useful during the adjustment phases).
The data unit uses a task-level programming technology, which allows much flexibility during the adjustment phase and, apparently, maintains parallel operation during the automatic sequences.
Evolution of a Measuring Cycle
The evolution of a cycle is based on the data unit programming. One whole cycle combines one ascending half-cycle and one descending half-cycle. A half-cycle consists in updating the reference values, completing one relative density profile and one pressure profile. For the user, both profiles seem to take place simultaneously. The profiles are obtained with the repetition of their respective sequence. The pressure sequence is composed of the sensor stabilization delay, the pressure measurement, the pulsing towards the scanner, updating and storage. The sequence is composed of the distance measurement, the density measurement, updating, and storage.
Most arc conducted in a low mode. However, in the first 24 h, during which the evolution of all the phenomena is very quick, the arc run in the quick mode. In the slow mode. the velocity is constant (4 mm/s) and the sensor stabilization delay is 10 sec. In the quick mode !.n the other hand,
5

Height 1. 3 3 min 4.15 min
Time
FIG. 6-Shijiing cycles of gammadensitometer carriage.
the velocity maintains a 4 mm/s speed for the first 20 mm at the top and at the bottom of the column and reaches 23 mm/s for the rest of the profile, whereas the sensor stabilization delay falls to 4 sec. Consequently, for a J 500 mm high profile, one measuring
lasts 2 min. 40 sec. in the quick mode and 13 min. in the slow mode.
Test Methodology
For a given type of soil, the gammadensimeter is previously calibrated in two points (demineralized water and soil density measured by weight and volume, relative densities l and 1.28 for these tests). The calculator time constant is set to 1 sec. The column preparation consists of its erection, the bleeding of the pressure system (using gravity while the column is filled with distilled water), water removal from the column and filling with the material, which has been prepared so as to match the required concentration. To be
Height
Measured Value
Nodal va.Lue
filled, the column is placed on a balance and the material is poured until the expected mass is reached I g, which corresponds to 0.1 mm of the filling height). The column, inside which a constant manual agitation is maintained using a ballasted disk to prevent any settling start before the beginning ofthe test, is then fasten to the strand.
The data unit program is started just when the agitation is stopped. It scans continuously the test elapsed time and starts the cycles by updating the parameters (slow, quick, etc.) to complete automatically and autonomously the profiles at the preset reference instants
A total of 8800 values are thus measured during one whole 32-day test (17 profiles), among which 2720 density values, 340 pressure values, 3060 measurement instants and 2720 distance measurements. All these values are then with a view to the required post-processing objectives.
Experimental Data Processing
Because of vast experimental data collected, a treatment code (in Visual Basic) has been specially developed for the automatic information processing. This code is used to test the sensitivity of the results to the experimental conditions and to analyze the evolution of the material behavior.
The quick evolution of the phenomena at the beginning of the test incited us to run half-cycles (ascending and descending) and to combine density and pressure measurement sequences. Measurements are then achieved at irregular distances and time intervals. For a better systematization of the data processing phase, some nodal values are deduced at the nodes of a regular temporal and spatial meshing at preset distances (about 900 points for 1.5 and at the reference times (17 instants for a 32-day test). Density and pressure nodal values are achieved by linear interpolation for relative density and cubic interpolation for pressure (without smoothing) between the distances of the measured values, on the one hand, and by time linear interpolation between the values obtained during the (run slightly before and after the reference times) (Fig. 7), on the other hand.
Time
of nodal values.
6

1500
!400
1300
1200
I 100
!000
900 5 5 800 .::; eJj 700 .'" =
600
500
400
300
200
100
0 1.1 1,2 1,3
Relative density 1.4
-1.33min
-4.15min
-6.9min
-9.66min
-12.45min
-22.5min
-1.5hours
-3hours
-6hours
-12hours
-24hours
-2days
-4days
-8days
-16days
32days
1,6
FIG. 8-Relative density profiles.
The achievement of the density and excess pore pressure nodal values also requires a careful consideration of the of the measurement system. Regarding densities, the positions related to the measured density values are translated from the distance covered by the densitometer carriage during the integration time of the gammadensitometric computer (1 sec.). Moreover, a specific test, conducted on PVC and water only, has shown that the actual width of the gamma radiation actual beam obtained after it went through the column was 30 mm and had a triangular repartition. These significant results demonstrate that the beam also cuts through a different material (PVC column base at the bottom and air at the
in the lower and upper areas of the column (15 mm). Pore overpressures are inferred from l
Total stress values are achieved by integrating the gravity nodal values y (stemming from the density) on the height. The net total stress is defined as the difference between total stress and hydrostatic pressure:
Ho
G,(x,t) .! y(�,t)d� Yw·(Ho
X
The net total stress can be considered as a material coordinate, as other authors do (for ex. Gibson 1967, Sills Toorman !996). The lines joining places having identical net total stresses can be interpreted as particle trajectories, if relative velocity between different class of grains (segregation) is negligible.
Pore overpressures are obtained from Eq 2. The effective stress is the difference between net total stress and pore overpressure.
The hydraulic and the falling velocity can also be �alculated to obtain the permeability (which are not presented here).
Example of Profiles Obtained
Characteristics of Test
For illustration, the results of a test performed on natural estuarine mud (Saint Nazaire, FRANCE) are presented. This material has a 63-J-Lm undersize material of 77 a liquid limit of 84 %, a plastic limit of 53 an organic matter concentration of 15 and relative density of 2. 7. The initial relative density of the test is 1.071 (corresponding to an initial concentration of I 00 g/1 and a void ratio of 26). Estuarine natural water density is 1.01. The material height in the column is 1500 mm. The test total duration is 32 days.
Density and Excess Pore Pressure Profiles
All the relative density profiles (Fig. 8) have a regular shape, which changes from a quasi-vertical group of curves close to the initial relative density (1.07) to values con·esponding to natural water (l.O J). The final relative density on the bottom is au'""''"'
mately 1.5, whereas the water-soil interface is found at the quarter of the initial height (distance 360 mm). In time, the interface lowers and the density in the lower part of the column increases sharply. In the first 22 min. of the test, the interface has not fallen yet, whereas the density profile has already noticeably changed within the column.
The shape of the excess pore pressure profiles (Fig. 9) is also satisfactorily regular. The profiles change from quasi-linear initial overpressures to quasi-nil overpressures in water and to overpressures within 10% of the initial values on the bottom, which corresponds to a consolidation rate of in comparison the initial values.
The first measured theoretical one
1 .';!13 min) is very closed to the ftoJ1'! �· Pa, 1500 mm to 900 Pa, 0 mm),
7

150\
200
100
-l.33min -4.15min -6.9min -9.66min -12.45min -22.5min -45min -l.5hours -3hours -6hours -12hours -24hour -2days -4days -8days
16days -32days
-50 0 50 I 00 150 200 250 300 350 400 450 500 550 600 650 700 750 800 850
Excess pore pressure {Pa) FIG. 9-Excess pore pressure profiles.
1500
1400
1300
1200 1.33min Test2
1100 --· 45min Test2
1000 -
900 E 24hours Test2
E 800- -- 32days Test2
...... ..c: 700 Ol
'(D -1.33min Test1 I 600
500 -45min Test1
400 -24hours Test1
300 -32days Test1 200
100 -
0
1 1,1 1,2 1,3 1,4 1,5 1,6
Relative density
FIG. lOa--Density profiles repeatability.
showing quasi-nil effective stress at the beginning of the test just after the agitation is stopped.
Figure lOa and lOb show the profiles repeatability. Test 2 was performed with the same procedure except that the material was just poured into the column and not then agitated. Although the
1500
1400 1.33min Test2 1300
45min Test2 1200
24hours T est2 1100
32days Test2 1000
- 1.33min Test1 900
E -45min Test1 §_ 800 :!: - 24hours Test1 Ol 700 .iii I - 32days Test1 600
500
400
300
200
100
0 0 100 200 300 400 500 600 700 800 900
Excess pore pressure (Pa) FIG. lOb-Excess pore pressure profiles repeatability.
initial conditions were not exactly the same, the profiles from 45 min are similar.
Trajectory and Effective Stress
Iso-net total stress curves, which are called "trajectories" for more convenience (Fig. 11 ), represent the relative density evolution better
8

1500
1400
1300
1200
11()0
1000
900
1 800
� 700 =
600
500
400
30{)
200
100
0 10 100 1000 10000
Time(s) 100000
-+-lOOPa
-e-200Pa
___._._ 300Pa
'"""*- 400Pa
-8-500Pa
-tr600Pa
......f--700Pa
- 800Pa
1000000 10000000
FIG. 11-Particle trajectories.
than the typical relative density profiles, on which many crossings of curves appear.
The study of these lines makes it possible to follow graphically the evolution of the material layers contained between two isovalue lines: lowering and settlement of each layer. The required iso-values are selected within a range according to the amount of material poured into the column (from 100-800 Pa with a pitch of 100 Pa for the presented 100-g/l test).
During the first 22 min. of the test, when the interface has not moved yet, significant evolutions are observed in the lower part of the column. This evolution is much weaker in the upper part. A few hours later, however, there is nearly no evolution anymore in the bottom layers whereas upper layers evolve sharply. Thus, in the first minutes of the test, the particle fall occurs with no pressure dissipation whereas, afterwards, the settlement phenomenon is accompanied by a sharp pressure dissipation.
Figure 12 presents the compared size distribution of initial material and final samples.
These 6 samples were pumped out from the final bed (360 mm height at 32 days).
The bottom sample (0-60 mm) presents a clearly coarser distribution and the other samples a slightly finer than the homogeneous initial materiaL It shows that partial segregation has occurred during the test.
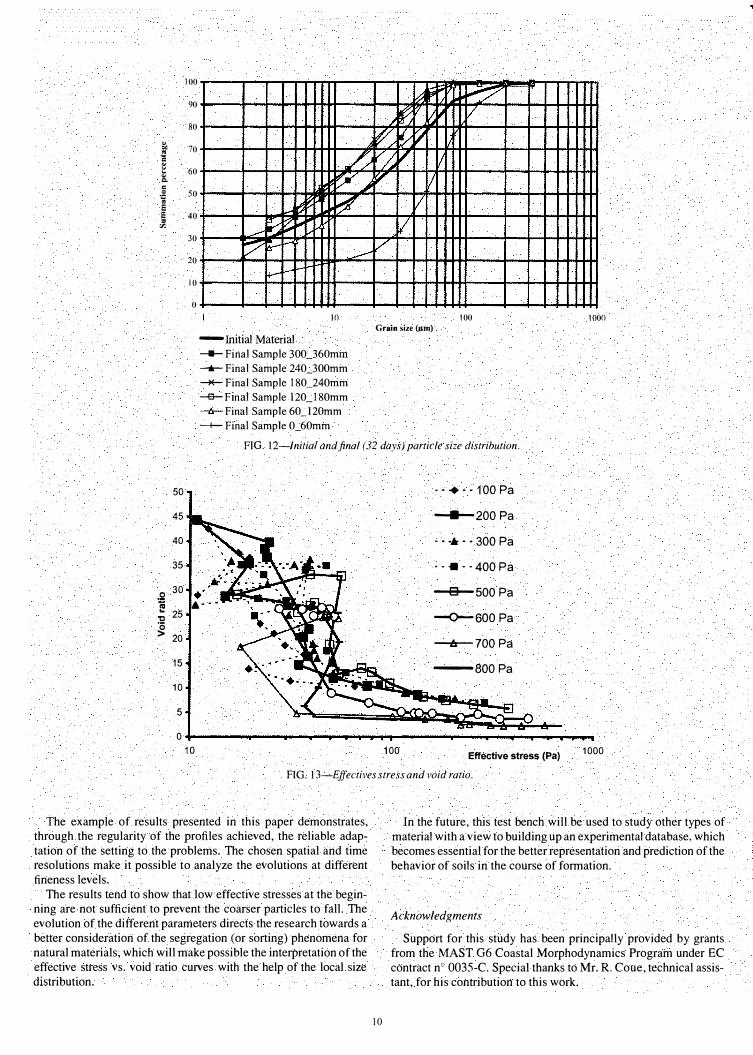
Figure 13 presents curve families showing the evolution of the effective stress vs. the material void ratio following the iso-net total stresses. The first points ( 1.33 min.) of each line are placed on a quasi-horizontal straight line, which represents the homogeneity of the initial mixture. It is possible to analyze the curves with roughly two areas. First, the area of low effective stresses (less than 50 Pa) where the incertitude 10 Pa) is visible. This area also corresponds to the beginning of the test when the segregation
may have occurred, and then induces an increase in void ratio for the upper layers. In this area, the material coordinate is not strictly valid. Second, the area of high effective stresses (more than 50 Pa) where the bottom layers (coarser) have a different behavior than the upper ones (finer). In this area, the effective stresses are high enough to prevent the continuation of segregation (and then the material coordinate becomes valid again).
The results of the test presented here show the material complex behavior, which is characterized by dissimilar evolutions, principally in the upper and lower parts of the column. These evolutions tend to show a quick particle fall of the coarse grains during the first minutes (rise in the void ratio at the top and decreasing at the bottom) followed by a consolidation phase within each layer, whose coarse size fractions are not identical anymore (fine material at the top, coarse material at the bottom). Considering the measurements achieved here, the phenomena could be addressed (and mode led) in terms of segregation and sorting.
Conclusions
A new test bench for the study of settling-consolidation soil formation has been described here. Although it is inspired by devices already available, this bench presents the original feature to be able to carry out density and excess pore pressure profiles from 1.33 min. along the 1.5 m length of the test column. The overpressure measurement method applied, moreover, maintains an accuracy of a few pascals. Measurement automation makes it possible to respect the same measurement procedure over several tests. The collected data are processed by a specific treatment code taking the specificity of the system and the types of representation required for the mechanical interpretation of the material behavior into account.
9
100
90
80 " .. 70 " = " " 60 .. "' Q. " "' 50'i s s " 40
;/';. 30
20
10
0
// p--_.,
� � ..-- � ;:;; ...
? li-" f.-
+-f.-
10
-Initial Material ---Final Sample 300_360mm
-.tr-Final Sample 240_300mm
"""""*--Final Sample 180_240mm
-s-Final Sample 120_180mm
---t:r- Final Sample 60_120mm
-+-Final Sample 0_60mm
---
�lill � � V. V
� y 'I V� , 1/
17 1/
V
V V
100 1000 Grain size (p;m}
FIG. 12-lnitia/ and final (32 days) particle size distribution.
50
45
40
35
� 30 ••
,. . . .'C 25 � 20
15
10
5
0 10 100
· · + · · 100 Pa
-----200Pa
· · ·• • · 300 Pa
· · • · ·400 Pa
--B--500 Pa
--o-eooPa
--11::-- 700 Pa
- 800Pa
Effective stress (Pa) 1000
FIG. 13-Effectives stress and void ratio.
The example of results presented in this paper demonstrates, through the regularity of the profiles achieved, the reliable adaptation of the setting to the problems. The chosen spatial and time resolutions make it possible to analyze the evolutions at different fineness levels.
The results tend to show that low effective stresses at the beginning are not sufficient to prevent the coarser particles to fall. The evolution of the different parameters directs the research towards a better consideration of the segregation (or sorting) phenomena for natural materials, which will make possible the interpretation of the effective stress vs. void ratio curves with the help of the local size distribution.
In the future, this test bench will be used to study other types of material with a view to building up an experimental database, which becomes essential for the better representation and prediction of the behavior of soils in the course of formation.
Acknowledgments
Support for this study has been principally provided by grants from the MAST G6 Coastal Morphodynamics Program under EC contract no 0035-C. Special thanks to Mr. R. Coue, technical assistant, for his contribution to this work.
10

References
Alexis, A., Bassoulet, P., Le Hir, P. , and Teisson, C., 1992, "Consolidation of Soft Marine Soils: Unifying Theories, Numerical Modelling and In situ Experiments," Proceedings, 23rd International Conference on Coastal Engineering, ASCE , Venice, Italy, Ed. B. L. Edge, ISBN 0-87262-933-3, pp. 2949-2961.
Been, K. and Sills, G. C., 1981, "Self-weight Consolidation of Soft Soils: An Experimental and Theoretical Study," Geotechnique, Vol. 31(4), pp. 519-535.
Berlamont, J., Van Den Bosch, L., and Toorman, E., 1992, "Effective Stresses and Permeability in Consolidating Mud," Proceedings, 23rd International Conference on Coastal Engineering, Venice, Sept. 92, ASCE, pp. 2962-2975.
Gallois, S., 1995, "Modelisation de la Sedimentation-consolidation et Experimentations sur les Vases Estuariennes," Rapport de these, Universite de Nantes-Ecole Centrale de Nantes, 224 p.
Gibson, R. E., England, G. L., and Hussey, M. J. L., 1967, "TheTheory of One-dimensional Consolidation of Saturated Clays," I .
Finite Non-linear Consolidation o f Thin Homogeneous Layers, Geotechnique, Vol. 17, pp. 261-273.
Imai G., 1981, "Experimental Studies on Sedimentation Mechanism and Sediment formation of Clay Materials," Soils and Foundations, JSSMFE, Vol. 21, No. 1, pp. 7-20.
Le Bras, G., 2000, "Etude Experimentale du Debut de Consolidation de Sediments Fins Naturels," These de Doctorat, Universite de Nantes. 190 p.
Masutti, F., 2001, "Etude Experimentale de la Sedimentationconsolidation et de !'acquisition de Resistance d'un sol fin," These de doctorat, Institut Polytechnique de Lorraine, 225 p.
Menge, P. , Van Den Bosch, L., Van Impe, W., and Berlamont, J.,1991, "Mud Basin and Capture Reservoir Experimental Pprogram," Laboratmy E\periments Report, Soil Mechanics Laboratory, R. U. Gent and hydraulics Laboratory, K. U. LEUV EN.
Migniot, C. and Ham L., 1990, "Consolidation and Rheological Properties of Mud Deposits," Proceedings, 22nd International Conference on Coastal Engineering, Delft, ASCE, pp. 2975-2983.
Monte, J. L. and Krizek, R. J., 1976, "One Dimensionnal Mathematical Model for Large-strain Consolidation," Geotechnique, Vol. 26, No. 3, pp. 495-510.
Owen, M. W., 1970, "Properties of a Consolidation Mud," Hydraulics Research Station, Wallingford, England Int 83, December.
Sanchez, M. and Grovel, A., 1992, "Consolidation de la Vase sousContraintes Variables," Genie Civil-Genie cotier, Joumees In-
temationales, Nantes, 26-28 fevrier 1992, Ed. Paralia, ISBN 2-9505787-1-3, pp. 421-436.
Sethi, A. F., 1986, "Determination of Clay Suspension Concentration Profile in a Settling Column Using the Fall-drop Technique," Consolidation f?fsoils: Testing and Evaluation, ASTM STP 892, R. N. Yong and F. C. Townsend (eds.), West Conshohocken, PA,pp. 490-499.
Shen, C., Russel, R., and Auzerais, F. M., 1994, "Colloidal Gel Filtration: Experiment and Theory," AIChe Journal, Vol. 40, No. 11, pp. 1876-1891.
Sills, G. C., 1995, "Time Dependent Processes in Soil Consolidation," lnt Symp. Compression and Consolidation of Clayed Soils, Hiroshima, mai 95, Yoshikuni and Kusakabe (eds.), pp. 875-890.
Sills, G. C., 1997, "Consolidation of Cohesive Sediments in Settling Columns," Cohesive Sediments, N. Burt, R. Parker, and J. Watts (eds.), Chichester: Wiley, pp. l07-120.
Sridharan, A. and Prakash, K., 2001, "Consolidation and Permeability Behavior of Segregated and Homogeneous Sediments," Geotechnical Testing Journal, GTJODJ, Vol. 24, No. I , March 2001, pp. l 09-120.
Tan, S. A., Tan, T. S., Ting, L. C, Yong, K. Y., Karunaratne G. P., and Lee S., 1988, "Determination of Consolidation Properties for Very Soft Clay," Geotechnical Testing Journal, Vol. 11, No. 14, pp. 233-240.
Tan, T. S. and Scott, R. F., 1988, "Finite Strain Consolidation-A Study of Convection," Soils and Foundations, Vol. 28, No. 3, pp. 64-74.
Toorman, E. A. and Berlamont, J. E., 1991, "Mathematical Modelling of Cohesive Sediment Settling and Consolidation," Proceedings, International Workshop on Nearshore and Estuarine Cohesive Sediments, St. Petersburg, Florida, 8-12 April l 99L
Toorman, E. A., 1992, "Modelling of Fluid Mud Flow and Consolidation," Ph.D. thesis, Katholieke universiteit Leuven, pp. 219.
Toorman, E. A., 1996, "Sedimentation and Self-weight Consolidation: General Unifying Theory," Geotechnique, Vol. 46, No. 1, pp. 103-11.3.
Umehara, Y. and Zen, K., 1982, "Consolidation Characteristics of Dredged Marine Bottom Sediments with High Water Content," Soils and Foundations, Vol. 22, No. 2, pp. 40-54.
Wichman, B. G. H. M., 2000, "A Finite Strain Theory for Glassy Sudge," Geotechnique, Vol. 50, No. I , pp. 35-41.
Zen, K. and Umehara, Y., 1986, "A New Consolidation Testing Procedure and Technique for Very Soft Soils," Consolidation
t?f Soils: Testing and Evaluation, ASTM STP 892, Yong and Townsend Eds., ASTM International, West Conshohocken, PA, pp. 405-432.
11