
EXPERIMENTAL AND THEORETICAL STUDY OF …€¦ · EXPERIMENTAL AND THEORETICAL STUDY OF WATER SIDE...
111
EXPERIMENTAL AND THEORETICAL STUDY OF WATER SIDE FOULING THERMAL PERFORMANCE OF REFRIGERANT TO WATER CONDENSERS By XIAOXIAO WU Bachelor of Science in HVAC Donghua University Shanghai, China 2007 Master of Engineering in HVAC Donghua University Shanghai, China 2010 Submitted to Faculty of Mechanical and Aerospace Engineering Oklahoma State University In partial fulfillment of the requirements of the Degree of MASTER OF SCIENCE December, 2013
Transcript of EXPERIMENTAL AND THEORETICAL STUDY OF …€¦ · EXPERIMENTAL AND THEORETICAL STUDY OF WATER SIDE...
EXPERIMENTAL AND THEORETICAL STUDY OF
WATER SIDE FOULING THERMAL PERFORMANCE
OF REFRIGERANT TO WATER CONDENSERS
By
XIAOXIAO WU
Bachelor of Science in HVAC
Donghua University
Shanghai, China
2007
Master of Engineering in HVAC
Donghua University
Shanghai, China
2010
Submitted to Faculty of
Mechanical and Aerospace Engineering
Oklahoma State University
In partial fulfillment of the requirements of
the Degree of
MASTER OF SCIENCE December, 2013
ii
EXPERIMENTAL AND THEORETICAL STUDY OF
WATER SIDE FOULING THERMAL PERFORMANCE
OF REFRIGERANT TO WATER CONDENSERS
Thesis Approved:
Dr. Lorenzo Cremaschi
Thesis Adviser
Dr. Daniel Fisher
Dr. Chad Penn
iii
Acknowledgements reflect the views of the author and are not endorsed by committee members
or Oklahoma State University.
ACKNOWLEDGEMENT
Completing my Master’s degree is probably one of the top 10 most challenging journeys of my
life so far. The best and worst moments of this journey have been shared with many people, and
the memories will always remain.
My first debt of gratitude would go to my advisor, Dr Lorenzo Cremaschi for his patience,
motivation, immense knowledge, and encouragement. His continuous guidance helped me
through all the ups and downs in the past three years, and I cannot have asked for a better advisor.
Heartiest thanks to the committee members, Dr. Fisher, Dr. Penn and Dr. Spitler for their
insightful comments and hard questions. Special thanks to Gary Thacker, the ATRC building
manager, for spending time and effort in the electronic and safety connections.
My sincere appreciation also goes to my fellow lab partners in OSU HVAC group: Atharva Barve,
Ardi Yatim, Jeremy Smith, Pratik Deokar, Auvi Biswas, Shanshan Cai, Weiwei Zhu, Pedro Perez,
Ehsan Moallem, Kasey Worthington, Ozgur Aslan, etc. for helping me adjust to the new
environment, for the troubleshooting discussions, for the sleepless nights working together before
deadlines and for all the fun we had during the last three years.
Last but not least, I would like to thank my family for their unconditional love and support; I
would not be able to make it without them.
iv
Name: XIAOXIAO WU
Date of Degree: DECEMBER, 2013
Title of Study: EXPERIMENTAL AND THEORETICAL STUDY OF WATER SIDE
FOULING THERMAL PERFORMANCE OF REFRIGERANT TO
WATER CONDENSERS
Major Field: MECHANICAL & AEROSPACE ENGINEERING
Abstract:
Brazed plate heat exchanges (BPHEs) and tube-in-tube heat exchangers (TTHEs) are commonly
used in the refrigeration, air conditioning, and food industry as refrigerant-to-water condensers, in
which the refrigerant rejects heat to water circulating in cooling tower loops. These heat
exchangers often suffer from severe fouling issues because as the water in the cooling tower
evaporates, the mineral concentration in the remaining water increases. Once the solubility limits
are reached, the minerals precipitate and a layer of fouling formed on the heat transfer surfaces.
Due to the fouling deposit, the thermal resistance between refrigerant and water gradually
increases. The fouling formation penalizes the overall effectiveness of the refrigerant condensers,
and thus, must be properly accounted for during the equipment design.
This thesis focuses on fouling effects on the thermal and hydraulic performance of condensers in
cooling tower systems. Two braze plate heat exchangers and a smooth tube-in-tube heat
exchanger was experimentally investigated under fouling operating conditions by using a new
experimental facility at Oklahoma State University. The aim was to measure the fouling
resistance in real time and correlate the data with the heat exchanger internal geometry, water
quality, and refrigerant saturation temperature. The fouling resistance in the TTHE was observed
to have asymptotic trend, and the asymptotic limit was lower than that for BPHEs with soft
corrugation angles and higher than that of BPHEs with hard corrugation angles operating at
similar conditions. The hydraulic performance was similar to BPHEs with hard corrugation
angles. Both refrigerant saturation temperature and water fouling potential increase would lead to
a measurable increase in the fouling resistance inside the refrigerant to water condenser. A model
for the mineral species dissociation and mineral precipitation on the heat transfer surfaces was
verified. By considering a semi-empirical relation for the fouling deposition strength factor, the
simulation results predicted the fouling thermal resistance with an error of 30%. Model
limitations and research needs for potential improvements are discussed.
v
TABLE OF CONTENTS
Chapter page
1 INTRODUCTION ................................................................................................................... 1
1.1 Introduction ...................................................................................................................... 1 1.2 Thesis organization .......................................................................................................... 2
2 LITERATURE REVIEW ........................................................................................................ 3
2.1 Fouling formation ............................................................................................................ 3 2.2 Parameters influencing fouling ........................................................................................ 5 2.3 Fouling model ................................................................................................................ 10 2.4 Conclusion from the literature review ........................................................................... 12
3 OBJECTIVE ......................................................................................................................... 14
3.1 Objectives ...................................................................................................................... 14 3.2 Research approach ......................................................................................................... 14 3.3 Scope of this thesis work ............................................................................................... 17
4 EXPERIMENTAL METHODOLOGY ................................................................................ 22
4.1 Description of test set up ................................................................................................ 22 4.2 Experimental apparatus .................................................................................................. 22
4.2.1 Cooling tower water loop ....................................................................................... 22 4.2.2 Refrigerant loop ..................................................................................................... 23 4.2.3 Auxiliary loops and safety devices ........................................................................ 24
4.3 Instrumentation and data acquisition system ................................................................. 26 4.3.1 Pressure measurement ............................................................................................ 26 4.3.2 Temperature measurement ..................................................................................... 27 4.3.3 Mass flow rate measurement .................................................................................. 28 4.3.4 Pump control and heater control ............................................................................ 28 4.3.5 Data acquisition system ......................................................................................... 29
vi
Chapter page
5 DATA REDUCTION AND UNCERTAINTY ANALYSIS ................................................ 31
5.1 Test procedure ................................................................................................................ 31 5.2 Data reduction ................................................................................................................ 37 5.3 Uncertainty analysis ....................................................................................................... 41
6 RESULTS AND DISCUSSION ........................................................................................... 45
6.1 Fouling deposit chemical analysis ................................................................................. 45 6.2 Fouling heat transfer analysis ........................................................................................ 49
6.2.1 Fouling formation in BPHEs and TTHE ................................................................ 49 6.2.2 Impacts of condensation temperature and water quality on fouling formation ...... 54
6.3 Water loss in cooling tower due to fouling .................................................................... 65 6.4 Application and improvement of existing fouling model .............................................. 67
7 CONCLUSION ..................................................................................................................... 77
7.1 Conclusion from this thesis work................................................................................... 77 7.2 Recommendations for future work ................................................................................ 79
REFERENCE ................................................................................................................................. 83
APPENDICES ............................................................................................................................... 87
Appendix A Fouling tests results summary ................................................................................... 87 Appendix B water sample report ................................................................................................... 88 Appendix C LSI computation ........................................................................................................ 92
vii
LIST OF TABLES
Table page
Table 3-1 Summary of the condensers tested for the fouling study ............................................... 18 Table 3-2 Test conditions for fouling tests .................................................................................... 19 Table 3-3 Summary of test matrix for the fouling tests ................................................................. 20 Table 4-1 Fouling tests facility application .................................................................................... 25 Table 4-2 BPHE application in auxiliary loops ............................................................................. 26 Table 4-3 Differential pressure transducer calibration from Validyne .......................................... 27 Table 5-1 Typical chemistry analysis for water quality ................................................................. 36 Table 5-2 Specifications of the key instrumentation for the fouling experiments ......................... 41 Table 6-1 comparison of measured fouling from approximated LMDT and comprehensive LMDT
method ........................................................................................................................................... 58 Table 6-2 Effect of refrigerant saturation temperature on asymptotic fouling resistance ............. 63 Table 6-3 Effects of water quality on asymptotic fouling resistance ............................................ 65 Table 6-4 Fouling model verification of linear correlation ............................................................ 68 Table 6-5 Sensitivity analysis of Rf with respect to Ψ ................................................................... 71
Appendix A Figure A - 1 Summary of fouling tests results ............................................................................... 87
Appendix B
Table B - 1 Water sample report for Test No. 1 (A1-105F) .......................................................... 88 Table B - 2 Water sample report for Test No. 2 (A2-105F) .......................................................... 88 Table B - 3 Water sample report for Test No. 3 (A2-120F) .......................................................... 89 Table B - 4 Water sample report for Test No. 4 (A1-120F) .......................................................... 89 Table B - 5 Water sample report for Test No. 5 (A1-105F-med) .................................................. 90 Table B - 6 Water sample report for Test No. 6 (A2-105F-med) .................................................. 90 Table B - 7 Water sample report for Test No. 7 (A1-105F-repeat) ............................................... 91 Table B - 8 Water sample report for Test No. 8 (tube-in-tube) ..................................................... 91
Appendix C
Table C - 1 LSI computation for Test No. 1 (A1-105F) ................................................................ 92 Table C - 2 LSI computation for Test No. 2 (A2-105F) ................................................................ 93 Table C - 3 LSI computation for Test No. 3 (A2-120F) ................................................................ 94 Table C - 4 LSI computation for Test No. 4 (A1-120F) ................................................................ 95 Table C - 5 LSI computation for Test No. 5 (A1-105F-med FP) .................................................. 96 Table C - 6 LSI computation for Test No. 6 (A2-105F-med FP) .................................................. 97 Table C - 7 LSI computation for Test No. 7 (A1-105F-repeat) ..................................................... 98 Table C - 8 LSI computation for Test No. 8 (Tube-in-tube) .......................................................... 99
viii
LIST OF FIGURES
Figure page
Figure 2-1 Illustration of fouling formation on a simple flat plate .................................................. 5 Figure 3-1 Main geometric parameters of BPHEs [from (Cremaschi, et al., 2011)] ..................... 18 Figure 3-2 Schematic and dimensions of tube-in-tube heat exchanger ......................................... 19 Figure 4-1 Principles of the cooling tower water loop ................................................................... 23 Figure 4-2 Principle of refrigerant loop ......................................................................................... 24 Figure 5-1 Langelier Saturation Index (LSI) during the fouling tests .......................................... 34 Figure 5-2 Schematic of temperature distribution of refrigerant R134a and water ....................... 37 Figure 5-3 Fouling resistance uncertainty analysis ........................................................................ 44 Figure 6-1 Fouling sample from TTHE condenser ........................................................................ 47 Figure 6-2 Solubility of CaCO3 [adapted from (Flynn & Nalco, 2009)] ....................................... 47 Figure 6-3 Image of fouling deposit inside smooth tubes .............................................................. 48 Figure 6-4 Images of fouling deposit inside a BPHE .................................................................... 49 Figure 6-5 Measured fouling factor for TTHE and BPHEs ........................................................... 50 Figure 6-6 Measured water temperature difference for TTHE and BPHEs ................................... 52 Figure 6-7 Measured pressure drop penalty factor for TTHE and BPHEs .................................... 53 Figure 6-8 Effect of refrigerant temperature and water quality on fouling resistance .................. 55 Figure 6-9 Degree of sub-cooling of the refrigerant for the BPHEs in fouling tests ..................... 58 Figure 6-10 Effect of refrigerant temperature and water quality on pressure drop ........................ 60 Figure 6-11 Reduction of water leaving temperature in the condenser due to fouling .................. 61 Figure 6-12 Effect of refrigerant saturation temperature on asymptotic fouling resistance (high
water fouling potential LSI 2.1 to 3.5) ........................................................................................... 62 Figure 6-13 Effect of water quality on asymptotic fouling resistance with refrigerant saturation
temperature of 1.5.5 °F(41°C) ....................................................................................................... 64 Figure 6-14 Summary of water losses in cooling tower ................................................................ 67 Figure 6-15 Ca
2+ accumulate due to water loss in smooth tubes ................................................... 67
Figure 6-16 Fouling model verification in a smooth tube-in-tube heat exchanger ........................ 71 Figure 6-17 Fouling model verification in BPHE ( =63˚) ........................................................... 73 Figure 6-18 Fouling model verification in BPHE ( =30˚) ........................................................... 74 Figure 6-19 Fouling model verification in BPHE ( =30˚) from literature ................................... 74 Figure 6-20 Fouling model verification with experimental data ................................................... 75
ix
NOMENCLATURE
A area ft2 or m
2
BPHE brazed plate heat exchanger
[Ca2+]
calcium concentration ppm
[Cl-] chloride concentration ppm
[CO32-
] carbonate concentration ppm
cr removal coefficient dimensionless
cycle concentration cycle dimensionless
de equivalent diameter in or m
f friction factor dimensionless
FP fouling potential
G mass flux lbm/ft2-s or kg/m
2-s
kD convective diffusion coefficient dimensionless
kR precipitation rate coefficient dimensionless
kSP solubility product mol2/L
2
L length in or m
LMTD Logatithm mean temperature difference °F or °C
LSI Langelier Saturation Index dimensionless
Mass flow rate lbm/min or kg/s
m mass lbm/in2-min or g/m
2-s
Malklinity “M” alkalinity ppm
med medium
p corrugation depth in or m
ΔP pressure drop kPa
PDPF pressure drop penalty factor dimensionless
heat transfer rate Btu/hr or W
R thermal resistance hr-°F –ft/Btu or m2-K/W
Re Reynolds number dimensionless
Rg universal gas constant cal/K-mol
RTD resistance temperature detector
t time hours or days
T temperature °F or °C or K
TDS total dissolved solid ppm
TTHE tube-in-tube heat exchanger
UA Overall heat transfer coefficient Btu/hr-°F or W/°C
volume flow rate gpm or m3/s
v velocity m/s
w width in or m
Subscript c clean
circulate Circulate water
d deposit
x
EWT entering water temperature
f fouled or fouling
ht heat transfer
k conduction
LWT leaving water temperature
makeup makeup water
r removal
ref refrigerant
s surface
sat saturated
SH superheat
tot total
w water
asymptotic
Greek symbols
φ corrugation angle (degree from flow direction) degree
λ corrugation pitch or thermal conductivity in or W/m-K
ρ density lbm/ft3kg/m
3
δ fouling thickness in or m
ψ deposition strength factor dimensionless
c time constant day
1
CHAPTER I
1 INTRODUCTION
1.1 Introduction
Tubular heat exchanger was commonly applied in industry for heat transfer purposes due to its high
flow velocity and high capacity, not sensitive to particle clogging and easy for maintenance. Recently,
Brazed plate heat exchangers (BPHEs) have been introduced in the air conditioning industry as
refrigerant to water condensers because they provide higher heat transfer coefficients and are more
compact than conventional tube-and-shell heat exchangers. The performance of BPHEs relies on the
internal geometry of their corrugated plates, which often incorporate a herringbone pattern. This type of
pattern is designed to maximize effective surface area of the plates, promote turbulence, and distribute
the fluid flow. Depending on the internal geometry of the plates, the flow pattern could either be in the
form of “zigzag” or “double-cross” flow (Luan et al., 2008). In both flow patterns, the fluid streams
flows to each other at the intersection, which induces turbulent flow and at the same time increases
pressure drop inside the BPHE (Focke et al., 1985) The stacked plates are assembled with thin copper
sheets between the plates before the unit enters a furnace. The melted copper acts as a brazing agent to
seal the edges of the BPHE plates and also bonds the meeting points of the corrugation ridges to
provide pressure retention strength.
In refrigerant to water condensers, heat is rejected from the refrigerant side to the water side, which
often circulates in cooling tower loops. Since large amount of inversely-soluble minerals, such as
calcium carbonate and magnesium carbonate contained in the water loop, due to the evaporation
2
process, water became concentrated. When the concentrated water is heated up by the refrigerant inside
condensers, the solubility of the minerals decrease, and precipitation occurs (Cho et al., 2003). Mineral
fouling, the deposition of this unwanted layer of material on the heat transfer surface, reduces the
overall heat transfer coefficient and increases the resistance to the fluid flow (Muller-Steinhagen &
Branch, 1988).
The performance of BPHEs under clean conditions is well understood; however, the impact of fouling
on the thermal and hydraulic performance of BPHEs is difficult to quantify because it is a function of
multiple variables of water chemistry, suspended particles, temperature, pH, operating conditions of the
condenser, and chemical cleaning procedures.
1.2 Thesis organization
The focuses of this master thesis is to investigate the thermal and hydraulic performance of refrigerant
to water condensers under fouling conditions experimentally and theoretically. This thesis is divided
into seven chapters. The first chapter is the introduction. The second chapter summarizes the recent
literature on fouling formation, driving factors leading to fouling in heat exchangers, and fouling
models in the literature. The third chapter presents the objectives and the scope of work in this thesis.
Chapter four introduces the experimental apparatus developed to measure the thermal and hydraulic
performance of test condensers in cooling tower applications. The test equipment and instrumentation
are described. In chapter five, test procedure, data reduction and uncertainty analysis are included.
Chapter six presents the chemical and thermal analysis of the fouling study, and fouling model
verification. Chapter eight summarizes the main findings in this thesis.
3
CHAPTER II
2 LITERATURE REVIEW
2.1 Fouling formation
Fouling has been an unavoidable problem since the cooking pot was invented (Somerscales, 1990). The
first reference in history appeared in 1756; it was reported that a layer of deposit, the inverse solubility
salt, which was the component of hard water, was left on the heated surface after water evaporated.
Because of this layer of deposit, fouling, thermal efficiency of the equipment was reduced. From 1850
to 1900, disputes regarding the significance of fouling effects were aroused. In order to quell the
controversy, experiments were conducted at the University of Illinois in 1898. Clean and fouled boilers
were tested, results shown that the former evaporated 13% more steam than the latter.
Since the influence of fouling was agreed, heat transfer surface cleaning became necessary. Due to the
potential corrosive nature and difficulties of using acid solution, hand washing using untreated or
poorly treated water to clean fouling deposit on the heat transfer surface was prevailed in nineteenth
century. By the early 1920s, people tended to apply phosphate treatment in boilers, which was
confirmed suitability. Since 1920, measurement and representation of fouling became more systematic.
The heat transfer coefficient, thermal resistance, cleanliness factor and fouling resistance were
formulated to present empirical results in structural and machine design. In 1959, Kern and Seaton
proposed a time related model to describe fouling formation, which was regarded as a landmark of the
fouling study. Their study changed the original way people look at fouling, which took no account of
the time dependent nature of fouling.
4
According to Kern and Seaton, fouling formation is a continuous deposition and removal process, and
the fouling resistance is proportional to the net fouling deposition rate per unit area, , which depends
on the rates of this process (Kern & Seaton, 1959):
(2-1)
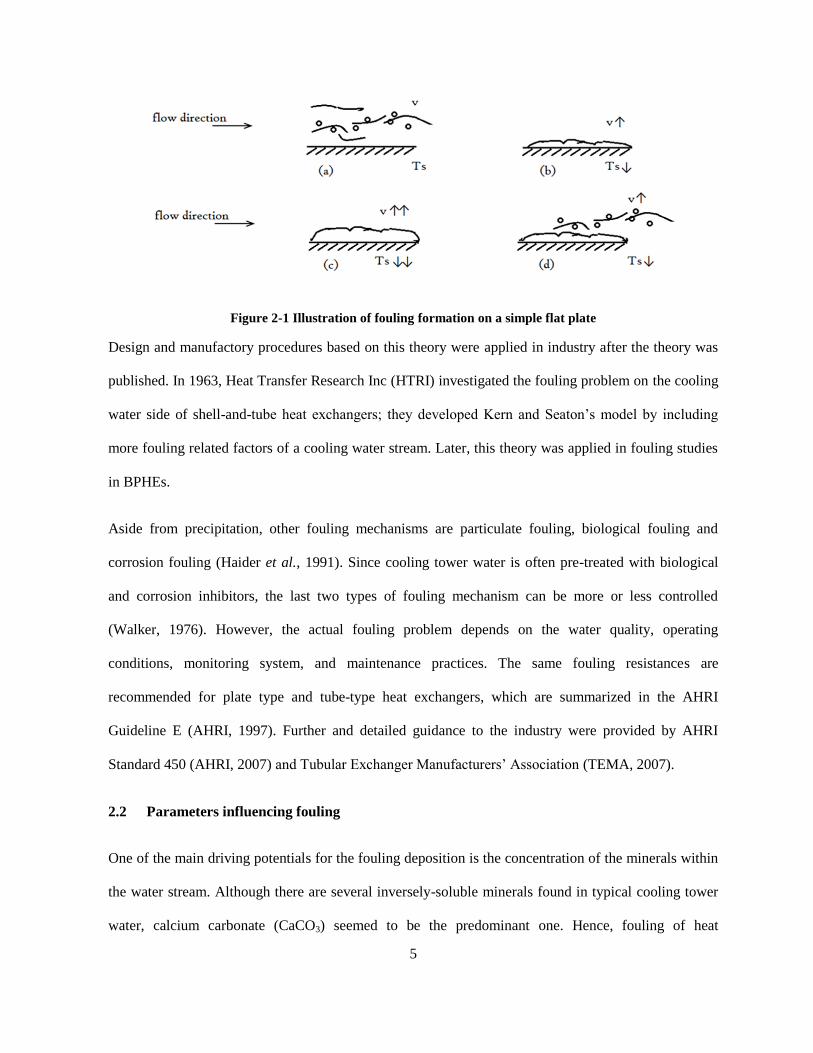
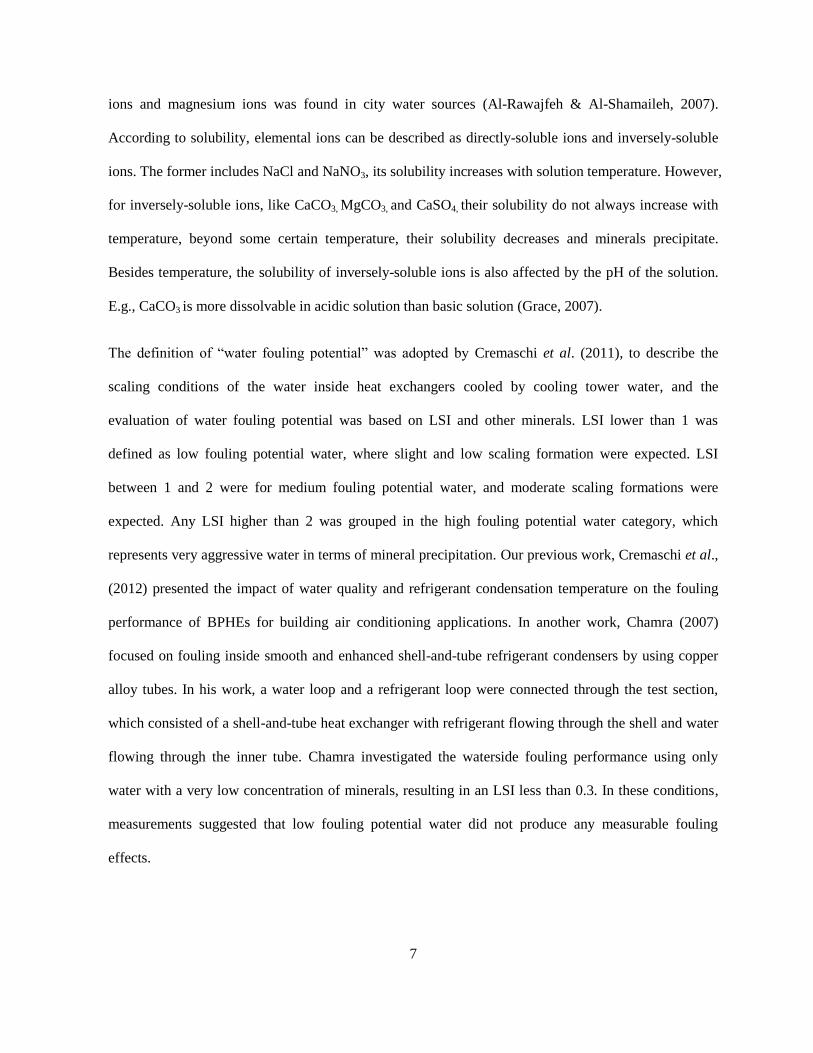
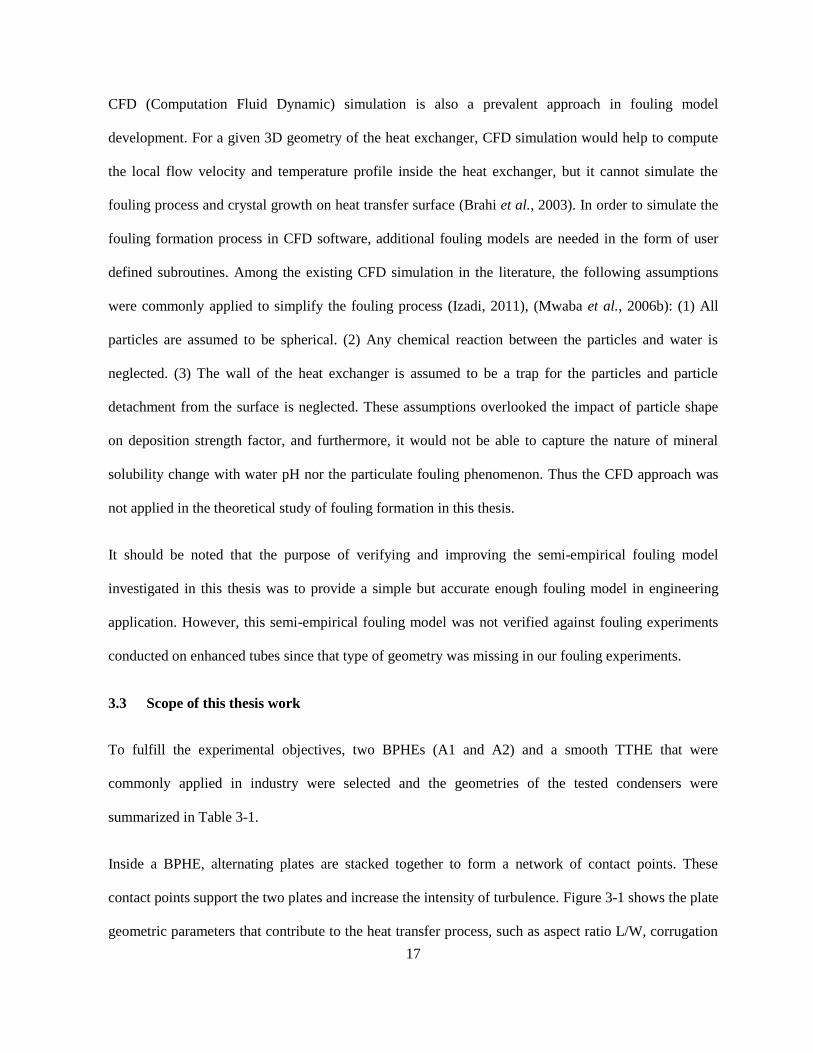
where , and are the deposition and removal rate per unit area, respectively. An illustration of this
theory for a simple heated flat plate is shown in Figure 2-1. Fluid with fouling agent flows across the
heated surface with velocity v and fluid temperature at wall surface Ts, as indicated in Figure 2-1(a).
Fluid is heated up and an increase of fluid temperature leads to a drop of local solubility; thus
previously dissolved calcium carbonate in the fluid begins to precipitate and a layer of fouling deposit
begins to form on the heat transfer surface, shown in Figure 2-1 (b). The layer of fouling increases the
thermal resistance between the heated surface and fluid, leading to the reduction of fluid film
temperature on the top of the surface. Since the solubility of calcium carbonate increases with
decreasing temperature (Flynn & Nalco, 2009), then the fouling precipitation rate decreases due to
lower Ts, see Figure 2-1 (c). Meanwhile, due to the flow barrier caused by the fouling deposit, the local
fluid velocity and shear stress increase accordingly. A removal process of clusters of fouling deposit
might occur if the shear stress is high enough to carry particles away from the fouling layer, in Figure
2-1 (d). The removal of fouling reduces the thermal resistance of the heat transfer surface, thus the
fouling precipitation restarts due to higher local water film temperature Ts near the plate. The local
water temperature and mineral concentration drive the precipitation process. The thickness of fouling
inside the condensers is expected to reach a limiting threshold in which the process of fouling
deposition and fouling removal are in equilibrium. If the particles do not obstruct the flow, particle
precipitation and removal process would recur, and Figure 2-1 (c) and (d) show this situation; and the
thermal resistance offered by the mineral deposition layer on the heat transfer surface approaches an
asymptotic value, referred to as the asymptotic fouling resistance.
5
Figure 2-1 Illustration of fouling formation on a simple flat plate
Design and manufactory procedures based on this theory were applied in industry after the theory was
published. In 1963, Heat Transfer Research Inc (HTRI) investigated the fouling problem on the cooling
water side of shell-and-tube heat exchangers; they developed Kern and Seaton’s model by including
more fouling related factors of a cooling water stream. Later, this theory was applied in fouling studies
in BPHEs.
Aside from precipitation, other fouling mechanisms are particulate fouling, biological fouling and
corrosion fouling (Haider et al., 1991). Since cooling tower water is often pre-treated with biological
and corrosion inhibitors, the last two types of fouling mechanism can be more or less controlled
(Walker, 1976). However, the actual fouling problem depends on the water quality, operating
conditions, monitoring system, and maintenance practices. The same fouling resistances are
recommended for plate type and tube-type heat exchangers, which are summarized in the AHRI
Guideline E (AHRI, 1997). Further and detailed guidance to the industry were provided by AHRI
Standard 450 (AHRI, 2007) and Tubular Exchanger Manufacturers’ Association (TEMA, 2007).
2.2 Parameters influencing fouling
One of the main driving potentials for the fouling deposition is the concentration of the minerals within
the water stream. Although there are several inversely-soluble minerals found in typical cooling tower
water, calcium carbonate (CaCO3) seemed to be the predominant one. Hence, fouling of heat
6
exchangers by precipitation of CaCO3 has been the main focus of many researchers for the past two
decades. The first study performed regarding precipitation fouling was done by Langelier (1936). He
proposed the “Langelier Index” now commonly known as Langelier Saturation Index or LSI. This
parameter is used to predict solubility of CaCO3 in water. The parameters used to determine the LSI are
the amount of total dissolved solids, calcium hardness, total alkalinity, fluid temperature, and actual pH
of the water. LSI is defined as the algebraic difference between actual pH of the water sample and its
computed saturation pH, pHsat, which is the pH at which the calcium concentration in a given water
sample is in equilibrium with the total alkalinity. In the current work, the saturation pH values are
approximated using the following equations from (Pearson, 2003).
LSI = pHactual – pHsat (2-2)
pHsat = 12.18 + 0.1 log10(TDS) – 0.0084 (Tw) – log10 (Ca) – log10 (Malkalinity) (2-3)
Where: TDS = Total Dissolved Solid (ppm)
Twater = water temperature in (°F)
Ca = calcium concentration (ppm as CaCO3)
Malkalinity = “M” alkalinity (ppm as CaCO3)
If the index equals zero, the water is in equilibrium state; a plus sign of the index means a tendency of
precipitation and a minus sign indicating a tendency of dissolving. However, the quality of cooling
tower water varies geographically. In order to determine the typical water qualities applied in actual
cooling towers, Zdaniuk & Chamra (2008) established a database according to the survey of cooling
tower water applications collected from 19 sites across the United States. Chemical analysis results
showed that water qualities can be grouped in three levels: low, average and severe, in terms of fouling
potential. Tap water quality was also assessed and inversely-soluble elemental ions such as calcium
7
ions and magnesium ions was found in city water sources (Al-Rawajfeh & Al-Shamaileh, 2007).
According to solubility, elemental ions can be described as directly-soluble ions and inversely-soluble
ions. The former includes NaCl and NaNO3, its solubility increases with solution temperature. However,
for inversely-soluble ions, like CaCO3, MgCO3, and CaSO4, their solubility do not always increase with
temperature, beyond some certain temperature, their solubility decreases and minerals precipitate.
Besides temperature, the solubility of inversely-soluble ions is also affected by the pH of the solution.
E.g., CaCO3 is more dissolvable in acidic solution than basic solution (Grace, 2007).
The definition of “water fouling potential” was adopted by Cremaschi et al. (2011), to describe the
scaling conditions of the water inside heat exchangers cooled by cooling tower water, and the
evaluation of water fouling potential was based on LSI and other minerals. LSI lower than 1 was
defined as low fouling potential water, where slight and low scaling formation were expected. LSI
between 1 and 2 were for medium fouling potential water, and moderate scaling formations were
expected. Any LSI higher than 2 was grouped in the high fouling potential water category, which
represents very aggressive water in terms of mineral precipitation. Our previous work, Cremaschi et al.,
(2012) presented the impact of water quality and refrigerant condensation temperature on the fouling
performance of BPHEs for building air conditioning applications. In another work, Chamra (2007)
focused on fouling inside smooth and enhanced shell-and-tube refrigerant condensers by using copper
alloy tubes. In his work, a water loop and a refrigerant loop were connected through the test section,
which consisted of a shell-and-tube heat exchanger with refrigerant flowing through the shell and water
flowing through the inner tube. Chamra investigated the waterside fouling performance using only
water with a very low concentration of minerals, resulting in an LSI less than 0.3. In these conditions,
measurements suggested that low fouling potential water did not produce any measurable fouling
effects.
8
Awad et al. (2009) also investigated at different surface temperatures of the tubular heat exchanger and
asymptotic values of fouling resistance were estimated. Their results suggested that the surface
temperature had a significant effect on the particulate fouling resistance but a small effect on the
precipitation fouling. They concluded that particulate fouling is of the asymptotic type while
precipitation fouling is of the linear type. As the surface temperature increased, the particulate fouling
resistance decreased while the precipitation fouling resistance increased. Thus, depending of the local
water quality, the authors recommended operation of the heat transfer equipment at the highest possible
temperature if particulate fouling needed to be minimized and vice versa if hindering precipitation
fouling was the critical factor to improve the performance of the heat exchanger. Xu and Knudsen
(1986) analyzed experimental data of fouling resistance and change in overall heat transfer coefficients
for cooling tower applications. They suggested the idea that at constant fluid velocity, the shear stress
responsible for interference in the fouling process would also be constant. Their study indicated that
deposit strength, in terms of adherence and toughness, increased with an augment of the surface
temperature of the heat exchanger.
Several researchers worked on evaluating the impact of geometry on fouling formation in heat
exchangers. Karabelas et al. (1997) conducted experiments to reveal that internal geometry of BPHEs
would impact the fouling resistance, plates with corrugation angle of 30° had more tendencies to foul
than ones with corrugation angle of 60°. Similar observation was reported by (Grandgeorge et al.,
1998), (Thonon et al., 1999), and our previous work (Cremaschi, et al., 2011) and (Wu & Cremaschi,
2012). Webb & Li (2000) evaluated the impact of internal geometry on fouling formation in tubular
heat exchangers. In their work, the fouling mechanism is a combination of precipitation and particulate
fouling, which was similar as our work, and the fouling tests in the Webb and Li study were conducted
with water velocity of 3.5 ft/s (1.1 m/s) and Reynolds number of about 16,000. The total hardness of
cooling tower water was approximately 800 ppm CaCO3, electrical conductivity of 1600 to 1800 ,
and pH = 8.5. They observed that more minerals would precipitate in enhanced tubes than smooth tubes,
9
indicating that the asymptotic fouling resistance has a strong dependence on internal geometry of the
tubular heat exchangers.
Flow velocity and particle type are also believed to be parameters impacting fouling deposit. Bansal &
Mueller-Steinhagen (1993) proposed that, due to mineral fouling, the free flow area inside the heat
exchanger channels decreased, resulting in the growth of the flow velocity and a drop on the surface
temperature, hence the fouling deposition rate was decreased accordingly. Similar phenomenon was
also reported by Thonon et al. (1999), who investigated in the influence of flow velocity on fouling
formation in plate heat exchangers experimentally. They claimed that the asymptotic fouling resistance
was inversely proportional to the flow velocity. In their experiments, TiO2, CaCO3 and clay were
applied as fouling agents and the fouling rate was significantly affected by the particle type. For similar
particle size and concentration, fouling rates with TiO2 were much lower than with CaCO3. Bansal et al.
(1997) further investigated the impact of suspended particles on crystallization fouling and they
observed that the presence of calcium sulfate particles created extra nucleation sites for crystallization,
resulting in significant increase in the fouling rate; however, the presence of alumina particles reduced
the crystallization rate because they acted as distorting agents, leading to a reduction of crystal growth
rate and an increase of fouling removal rates. In another work, Noda et al. (2013) proposed that a trace
amount of phosphate in water solution would also slow down the calcium carbonate precipitation rate.
Bansal & Mueller-Steinhagen (1993) proposed that, most crystal formation was initiated near the
contact points inside the plate type of heat exchangers, because the temperature profile in this part is
different from the flow channels, since the liquid was heated up from several directions. Aslo, the
scanning electron microscope micrograph of fouling crystals suggested that crystals can be divided into
two different size categories, that is, homogeneous small cubic crystals directly on the plate surface and
needle shape crystals on the top of this initial layer. Researchers also proposed that the precipitation
fouling has an induction period of 3-4 days, in which crystal nucleation sites start developing before
10
mineral precipitation (Webb & Li, 2000; Zan et al., 2009). However, the induction period was not
observed in the appearance of particulate fouling (Chamra & Webb, 1994; Kim & Webb, 1991).
Hasson (1997) proposed that, longer induction period can be expected for surfaces with higher
roughness because the surface roughness increases the contact surface area. An increase in the surface
roughness promotes the mineral precipitation because the local valley of the surface profile provides a
shelter from the main water stream velocity. Thus lower fouling removal rate can be expected for rough
surfaces with respect to smooth surfaces. Benzinger et al. (2007) and Geddert et al. (2009) studied the
impacts of different surface materials on the induction period and fouling formation. Their tested
surface materials included stainless steel, fluorinated ethylene propylene (FEP), diamond like carbon
(DLC), and others. They reported that no major influence of the tested surface materials on the
induction period and on the fouling formation was observed for calcium carbonate precipitation.
However, in the case of calcium sulfate precipitation, the DLC coated surface showed less fouling
tendency compared to the uncoated surface.
2.3 Fouling model
Analytical and numerical analysis was also developed to describe fouling characteristic of heat transfer
surfaces. In 1959, Kern and Seaton (1959) proposed a time related model to describe fouling formation.
Their asymptotic fouling model indicates, once the heat transfer surface is exposed to the fouling fluid,
the fouling formation is a combination of fouling deposit and fouling removal. As reported by Webb
(1994), there are three possible fouling curve trends: linear, falling and asymptotic. A linear growth rate
occurs either when the removal rate is negligible or when the deposition rate is constantly greater than
the removal rate. The fouling resistance will attain an asymptotic value only when the deposition rate
equals the removal rate. If the fouling removal rate is greater than the precipitation rate, a falling
fouling curve could be expected. Most fouling studies report the measured fouling resistance with
respect to time, for example, the study of effects of alkalinity on fouling in simulated cooling tower
11
water by Morse & Knudsen (1977); the investigation of the impacts of surface temperature, flow rate
and water quality on fouling characteristics by Knudsen & Story (1978) and the work on particulate
fouling by Chamra and Webb (1993) in enhanced tubes. Assuming deposition on the heat exchanger
surface is uniform, the fouling resistance Rf, can be expressed as a function of net fouling deposition
rate, as follows:
(2-4)
Where is the density of fouling deposit and kf is the thermal conductivity of the deposit material.
From equation (2-4), it is clear that the fouling phenomenon depends on physical properties of the
deposit material and fouling mechanisms. Hasson and Zahavi (1970) presented a scaling thickness
model to predict the deposition rate of CaCO3 in tube-type heat exchangers using ionic diffusion theory;
this model was further improved to a deposition rate model to predict CaCO3 fouling rate in acid and
basic solution by Hasson et al. (1978). Taborek et al. (1972b) made a comparison of fouling models in
the literature, and the characteristics of fouling type were discussed for each of them, as well as the
parameters might impact the deposition and removal term. Then, based on the massive data bank
accumulated with the HTRI fouling tests, they proposed a semi-theoretical model to predict fouling
formation. Particularly, they included two processes in the deposition term: diffusion of the potential
depositing substance to the surface and bonding at the surface; and the removal rate is proportional to
the ratio of the fluid shear stress to the bonding resistance of the fouling layer. Chamra & Webb (1994)
proposed a semi-theoretical model to predict the asymptotic fouling resistance in enhanced tubes, which
considered solution concentration, velocity and particle size.
Models were also developed to predict fouling phenomenon in plate heat exchangers. Mueller-
Steinhagen and Bloechl (1988) investigated the impacts of particle size, particle concentration and
particle/fluid combination on fouling in plate heat exchangers experimentally; they also applied the
experimental data to verify a fouling model from the literature. Grandgeorge et al. (1998) studied the

12
impacts of flow velocity on fouling formation in corrugated BPHEs and a fouling rate global model was
proposed to predict the asymptotic deposit on the heat transfer surface.
More recent work on fouling model development includes logistic fouling model proposed by Mwaba
et al. (2006a) which can be applied to predict the evolution of the fouling scale layers in heat
exchangers. Quan et al. (2008) developed a heat mass transfer model based on kern-Seaton model to
predict fouling formation of CaCO3 in tube-type heat exchangers. Xu et al. (2011) investigated the
impacts of water quality in a river on fouling formation in plate heat exchangers experimentally and a
partial least squares regression (PLS) model was proposed to predict the fouling characteristics. The
model applied a set of input variables, including mineral concentration, pH, dissolved oxygen, turbidity,
conductivity, and etc. Ojamiemi et al., (2013) investigated on the impact of turbulence on the
particulate fouling by comparing LES (Large Eddy Simulations) and standard k-Ɛ model numerically,
and the author reported that the resulting profile for the deposition distribution were markedly different
and LES result seemed to be more close to experimental results.
2.4 Conclusion from the literature review
Brazed plate heat exchanges (BPHEs) and tube-in-tube heat exchangers (TTHEs) were adopted in
refrigeration, air conditioning and food industry as condensers, in which refrigerant rejects heat to water
circulating in cooling tower loops. These heat exchangers often suffer from severe fouling because as
the water evaporates, the mineral concentration increases and once the solubility limits are reached, the
minerals precipitate and might stick to the heat transfer surfaces. Due to the layers of fouling deposit on
the heat transfer surfaces, the thermal resistance between refrigerant and water gradually increases. The
fouling resistance, or sometimes referred to as fouling allowance, depends on several factors such as
heat exchanger geometry, heat flux, water quality, and water flow rates. The fouling resistance
penalizes the overall effectiveness of the refrigerant condensers, and thus, must be properly accounted
for during the equipment design. Work has been conducted to study the parameters that affect fouling

13
mechanisms in both BPHEs and TTHEs, and some correlations to predict the long term fouling
allowances exist in open literature.
14
CHAPTER III
3 OBJECTIVE
3.1 Objectives
The main purpose of this work is to study the impacts of water fouling on refrigerant to water
condensers thermal and hydraulic performance experimentally and theoretically. The overall objectives
were:
1. Determine the key parameters that affect water-side fouling formation inside heat exchangers.
2. Isolate and possibly quantify the effects of these parameters on the thermal and hydraulic
performance of refrigerant condensers under fouling conditions.
3. Verify and possibly improve the fouling models in the literature.
Based on the overall objectives of this thesis work, specific objectives in the experimental part and the
theoretical part were made and the research approach was discussed in detail.
3.2 Research approach
Researchers have conducted experiments to investigate parameters affecting fouling formation inside
the heat exchangers and it is proposed that one of these parameters is heat exchanger internal geometry.
In this master thesis, we want to clarify that, the internal geometry of BPHEs (brazed plate heat
exchangers) mainly referred to the corrugation angle. Since the refrigerant condensers were cooled by
cooling tower water, the impact of refrigerant saturation temperature and water quality of the cooling
water was also investigated.
15
Fouling studies have been conducted by people in different place and most of them tested heat
exchangers with different type and geometry with local water sources with particular chemistry, which
make generalization and comparison difficult. In this thesis, we want to provide a baseline in the
investigation of thermal and hydraulic performance of BPHEs, to make it comparable with traditional
tubular heat exchangers.
Considering fouling is a very slow process that requires months, investigations showed that the long
term fouling performance can be inferred from the accelerated fouling experiments (Webb & Li, 2000).
With the above mentioned consideration, accelerated-type of fouling tests were developed in our
laboratory and the specific objectives for the experiments were given below:
1) To measure fouling resistance of BPHEs with different corrugation angles under the same
operating condition.
2) To investigate the impacts of water quality and refrigerant saturation temperature on fouling
formation inside BPHEs.
3) To test a TTHE (tube-in-tube heat exchanger) under the same operating condition and identify
any similarities and differences of fouling performance between BPHE and TTHE.
Several steps were taken in the theoretical study of fouling formation to verify and possibly improve the
fouling models in the literature. Firstly, among the different fouling model approaches in the open
literature, a common linear correlation with the format of Rf=a0+a1x1+a2x2+a3x3+…+anxn was proposed
to predict fouling resistance inside heat exchangers (Wen et al., 2013; Xu, et al., 2011; Zhang & Wang,
2010). In the linear fouling correlation, x1, x2, x3…xn represent parameters such as water chemistry,
water velocity, water temperature, etc. The linear correlation proposed in the literature was verified
against the experimental work presented in this thesis. The linear approach tended to overestimate the
fouling resistance significantly and it would not capture the asymptotic trend of the fouling formation
inside heat exchangers. So the author speculated that, the linear correlation does not represent the
16
fouling formation in the general case. Secondly, another type of semi-empirical fouling model in the
literature which considered the chemical dissociation, heat and mass transfer by applying the first
principle equations in fouling formation (Quan, et al., 2008) was further verified against our
experimental work. It should be noted that, water pH affects minerals solubility and precipitation rate,
thus the proper chemical reaction equation should be incorporated into the model. Thirdly, the difficulty
in applying the semi-empirical fouling model in engineering application is that, it included a parameter,
deposition strength factor, to describe the fouling removal rates. Since little information was in the
literature to compute this parameter, a sensitivity analysis was conducted based on one of the
experiments in this thesis, and a correlation was proposed to estimate the value of this parameter. The
same correlation was applied in the semi-empirical model to verify against our other fouling tests
conducted in this thesis and in the literature. The modified semi-empirical model would somewhat
predict the fouling resistance both from our experiments and from the literature. Detailed discussion
about this modified semi-empirical model was given in chapter 6.
According to the semi-empirical fouling model, water chemistry, local velocity inside the heat
exchanger, and deposition factor are considered as important parameters in computing fouling
resistance. We monitored water chemistry information in our fouling experiments in an interval of once
every week and we assumed the mineral concentration contained in the water had a linear change
between each sampling rate. As discussed in detail in chapter 6, it turns out that, this assumption was
not accurate enough in fouling resistance prediction and more intensive monitoring on the water
chemistry is required. We would not be able to monitor the deposition strength factor and local water
velocity directly in our fouling tests. However, research have proposed that the deposition strength
factor is affected by fluid shear stress, surface material and structure (Taborek et al., 1972a; Webb et al.,
2000) as well as the type and shape of the fouling particles (Andritsos & Karabelas, 2003).
17
CFD (Computation Fluid Dynamic) simulation is also a prevalent approach in fouling model
development. For a given 3D geometry of the heat exchanger, CFD simulation would help to compute
the local flow velocity and temperature profile inside the heat exchanger, but it cannot simulate the
fouling process and crystal growth on heat transfer surface (Brahi et al., 2003). In order to simulate the
fouling formation process in CFD software, additional fouling models are needed in the form of user
defined subroutines. Among the existing CFD simulation in the literature, the following assumptions
were commonly applied to simplify the fouling process (Izadi, 2011), (Mwaba et al., 2006b): (1) All
particles are assumed to be spherical. (2) Any chemical reaction between the particles and water is
neglected. (3) The wall of the heat exchanger is assumed to be a trap for the particles and particle
detachment from the surface is neglected. These assumptions overlooked the impact of particle shape
on deposition strength factor, and furthermore, it would not be able to capture the nature of mineral
solubility change with water pH nor the particulate fouling phenomenon. Thus the CFD approach was
not applied in the theoretical study of fouling formation in this thesis.
It should be noted that the purpose of verifying and improving the semi-empirical fouling model
investigated in this thesis was to provide a simple but accurate enough fouling model in engineering
application. However, this semi-empirical fouling model was not verified against fouling experiments
conducted on enhanced tubes since that type of geometry was missing in our fouling experiments.
3.3 Scope of this thesis work
To fulfill the experimental objectives, two BPHEs (A1 and A2) and a smooth TTHE that were
commonly applied in industry were selected and the geometries of the tested condensers were
summarized in Table 3-1.
Inside a BPHE, alternating plates are stacked together to form a network of contact points. These
contact points support the two plates and increase the intensity of turbulence. Figure 3-1 shows the plate
geometric parameters that contribute to the heat transfer process, such as aspect ratio L/W, corrugation
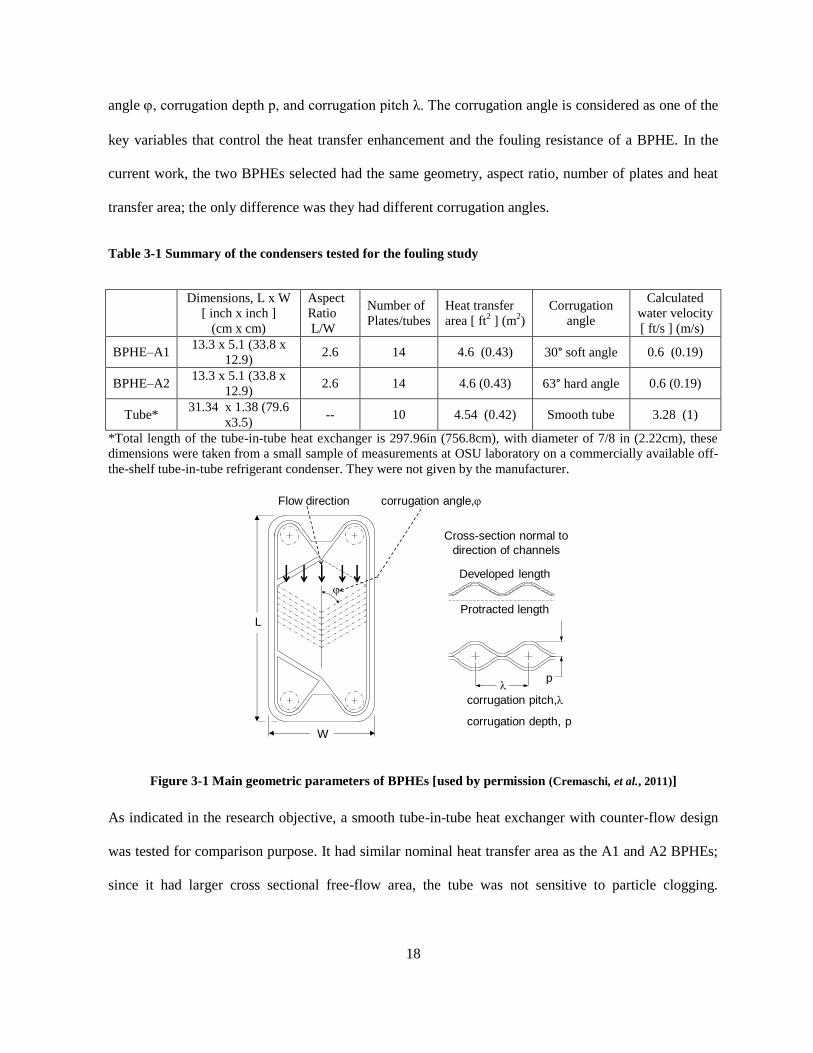
18
angle , corrugation depth p, and corrugation pitch λ. The corrugation angle is considered as one of the
key variables that control the heat transfer enhancement and the fouling resistance of a BPHE. In the
current work, the two BPHEs selected had the same geometry, aspect ratio, number of plates and heat
transfer area; the only difference was they had different corrugation angles.
Table 3-1 Summary of the condensers tested for the fouling study
Dimensions, L x W
[ inch x inch ]
(cm x cm)
Aspect
Ratio
L/W
Number of
Plates/tubes
Heat transfer
area [ ft2 ] (m
2)
Corrugation
angle
Calculated
water velocity
[ ft/s ] (m/s)
BPHE–A1 13.3 x 5.1 (33.8 x
12.9) 2.6 14 4.6 (0.43) 30° soft angle 0.6 (0.19)
BPHE–A2 13.3 x 5.1 (33.8 x
12.9) 2.6 14 4.6 (0.43) 63° hard angle 0.6 (0.19)
Tube* 31.34 x 1.38 (79.6
x3.5) -- 10 4.54 (0.42) Smooth tube 3.28 (1)
*Total length of the tube-in-tube heat exchanger is 297.96in (756.8cm), with diameter of 7/8 in (2.22cm), these
dimensions were taken from a small sample of measurements at OSU laboratory on a commercially available off-
the-shelf tube-in-tube refrigerant condenser. They were not given by the manufacturer.
Figure 3-1 Main geometric parameters of BPHEs [used by permission (Cremaschi, et al., 2011)]
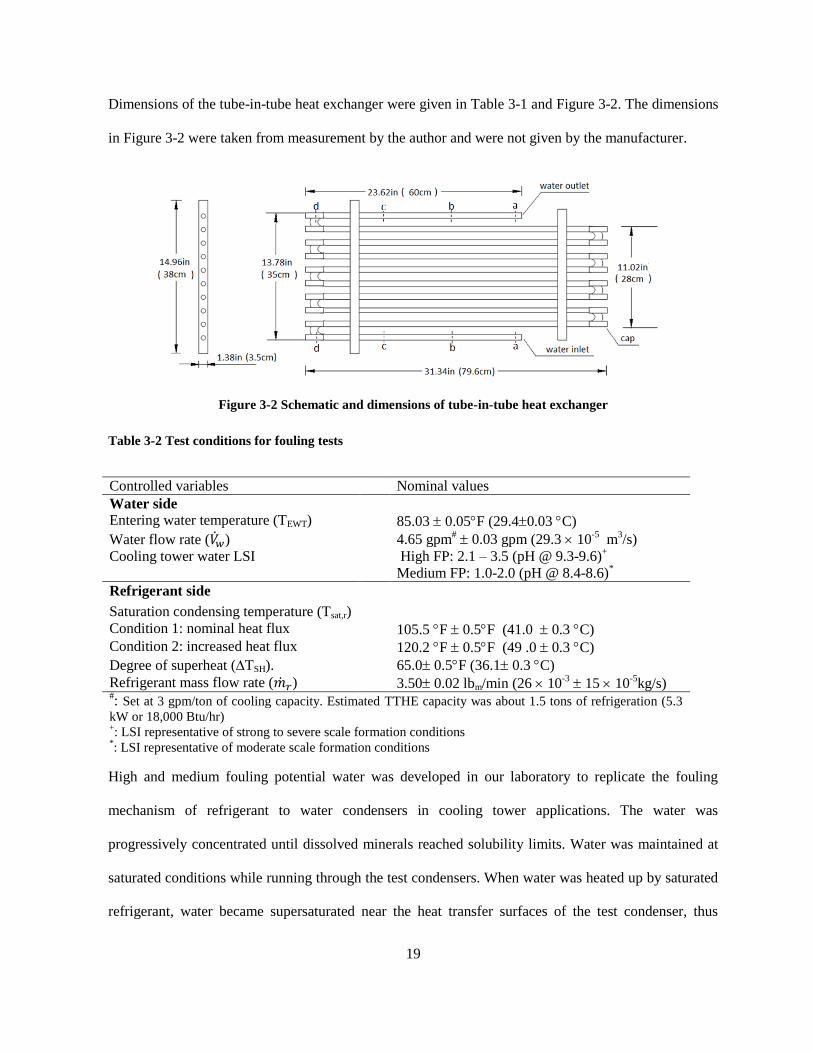
As indicated in the research objective, a smooth tube-in-tube heat exchanger with counter-flow design
was tested for comparison purpose. It had similar nominal heat transfer area as the A1 and A2 BPHEs;
since it had larger cross sectional free-flow area, the tube was not sensitive to particle clogging.
Protracted length
p
corrugation angle,
Developed length
Cross-section normal to
direction of channels
L
W
Flow direction
corrugation pitch,
corrugation depth, p
19
Dimensions of the tube-in-tube heat exchanger were given in Table 3-1 and Figure 3-2. The dimensions
in Figure 3-2 were taken from measurement by the author and were not given by the manufacturer.
Figure 3-2 Schematic and dimensions of tube-in-tube heat exchanger
Table 3-2 Test conditions for fouling tests
Controlled variables Nominal values
Water side
Entering water temperature (TEWT) 85.03 0.05F (29.40.03 C)
Water flow rate ( ) 4.65 gpm# 0.03 gpm (29.3 10
-5 m
3/s)
Cooling tower water LSI High FP: 2.1 – 3.5 (pH @ 9.3-9.6)+
Medium FP: 1.0-2.0 (pH @ 8.4-8.6)*
Refrigerant side
Saturation condensing temperature (Tsat,r)
Condition 1: nominal heat flux 105.5 F 0.5F (41.0 0.3 C)
Condition 2: increased heat flux 120.2 F 0.5F (49 .0 0.3 C)
Degree of superheat (TSH). 65.0 0.5F (36.1 0.3 C)
Refrigerant mass flow rate ( ) 3.50 0.02 lbm/min (26 10-3
15 10-5
kg/s) #: Set at 3 gpm/ton of cooling capacity. Estimated TTHE capacity was about 1.5 tons of refrigeration (5.3
kW or 18,000 Btu/hr) +: LSI representative of strong to severe scale formation conditions
*: LSI representative of moderate scale formation conditions
High and medium fouling potential water was developed in our laboratory to replicate the fouling
mechanism of refrigerant to water condensers in cooling tower applications. The water was
progressively concentrated until dissolved minerals reached solubility limits. Water was maintained at
saturated conditions while running through the test condensers. When water was heated up by saturated
refrigerant, water became supersaturated near the heat transfer surfaces of the test condenser, thus
20
mineral precipitation was promoted due to a local sudden drop of solubility. The operating conditions
for the fouling tests were shown in Table 3-2.
The operating conditions during the fouling measurements were carefully selected, so that the tested
condensers would operate in similar conditions as cooling tower applications in industry. Test
conditions were also in agreement with the recommendations given in the AHRI 450 guidelines (AHRI,
2007). Table 3-2 provides the list of independent variables that were fixed and accurately controlled
during the fouling experiments in this thesis. Since this work is part of a broad research project
supported by ASHRAE, the American Society of Heating, Refrigeration and Air Conditioning
Engineers, the degree of superheat and the water flow rate were selected from typical range of brazed
plate-type condensers and within the scope expressed by the request for proposal RF-1345 (ASHRAE,
2007).
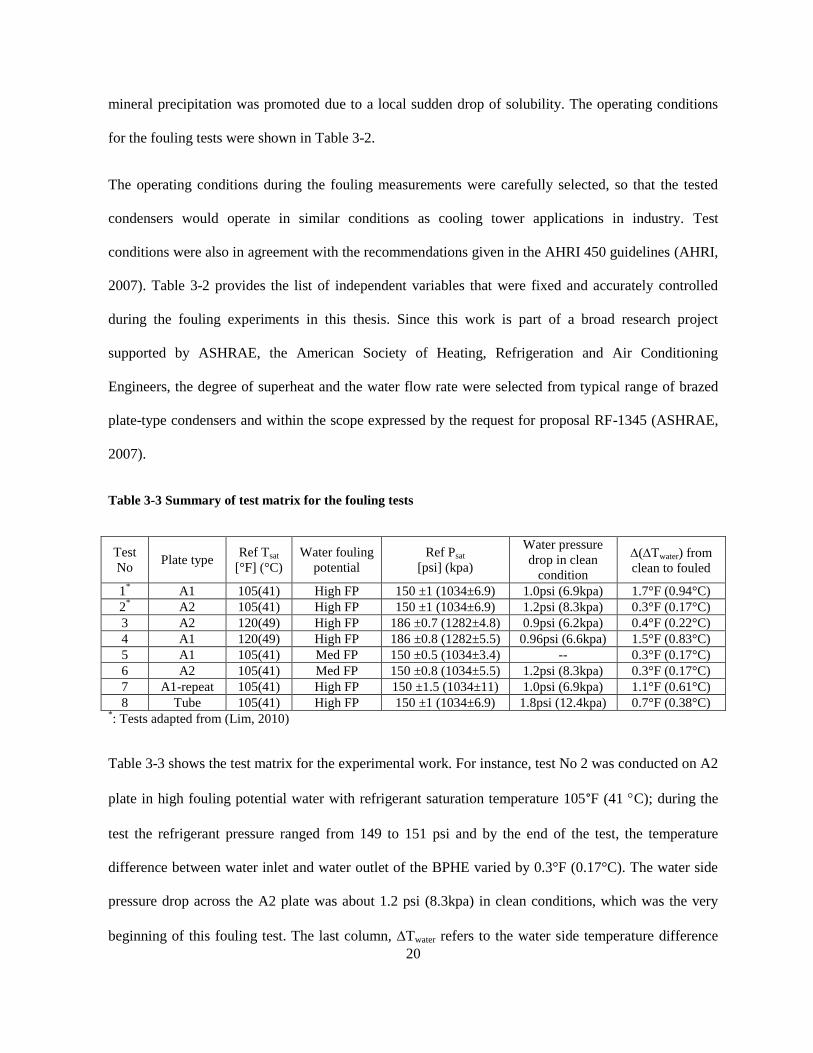
Table 3-3 Summary of test matrix for the fouling tests
Test
No Plate type
Ref Tsat
[°F] (°C)
Water fouling
potential
Ref Psat
[psi] (kpa)
Water pressure
drop in clean
condition
(Twater) from
clean to fouled
1* A1 105(41) High FP 150 ±1 (1034±6.9) 1.0psi (6.9kpa) 1.7°F (0.94°C)
2* A2 105(41) High FP 150 ±1 (1034±6.9) 1.2psi (8.3kpa) 0.3°F (0.17°C)
3 A2 120(49) High FP 186 ±0.7 (1282±4.8) 0.9psi (6.2kpa) 0.4°F (0.22°C)
4 A1 120(49) High FP 186 ±0.8 (1282±5.5) 0.96psi (6.6kpa) 1.5°F (0.83°C)
5 A1 105(41) Med FP 150 ±0.5 (1034±3.4) -- 0.3°F (0.17°C)
6 A2 105(41) Med FP 150 ±0.8 (1034±5.5) 1.2psi (8.3kpa) 0.3°F (0.17°C)
7 A1-repeat 105(41) High FP 150 ±1.5 (1034±11) 1.0psi (6.9kpa) 1.1°F (0.61°C)
8 Tube 105(41) High FP 150 ±1 (1034±6.9) 1.8psi (12.4kpa) 0.7°F (0.38°C) *: Tests adapted from (Lim, 2010)
Table 3-3 shows the test matrix for the experimental work. For instance, test No 2 was conducted on A2
plate in high fouling potential water with refrigerant saturation temperature 105°F (41 C); during the
test the refrigerant pressure ranged from 149 to 151 psi and by the end of the test, the temperature
difference between water inlet and water outlet of the BPHE varied by 0.3°F (0.17°C). The water side
pressure drop across the A2 plate was about 1.2 psi (8.3kpa) in clean conditions, which was the very
beginning of this fouling test. The last column, Twater refers to the water side temperature difference

21
across the test heat exchanger, that is Twater = TLWT – TEWT. (Twater) indicates the relative change of
the water temperature from the beginning of the test until the last day of the fouling test period.
22
CHAPTER IV
4 EXPERIMENTAL METHODOLOGY
4.1 Description of test set up
A test set up was designed and built in laboratory to investigate the thermal and hydraulic performances
of refrigerant to water condensers under fouling conditions. The overall dimension of the experimental
apparatus was 10.5ft W × 9.5ft H × 4ft D (3.2m W × 2.9m H × 1.2m D). Large amounts of piping, heat
exchangers, tanks and pumps were applied. The experimental apparatus mainly consisted of two loops:
a simulated cooling tower water loop and a refrigerate loop. The two loops shared the test heat
exchanger, functioned as refrigerant to water condenser. System construction detail was given in
(Ramesh, 2010).
4.2 Experimental apparatus
4.2.1 Cooling tower water loop
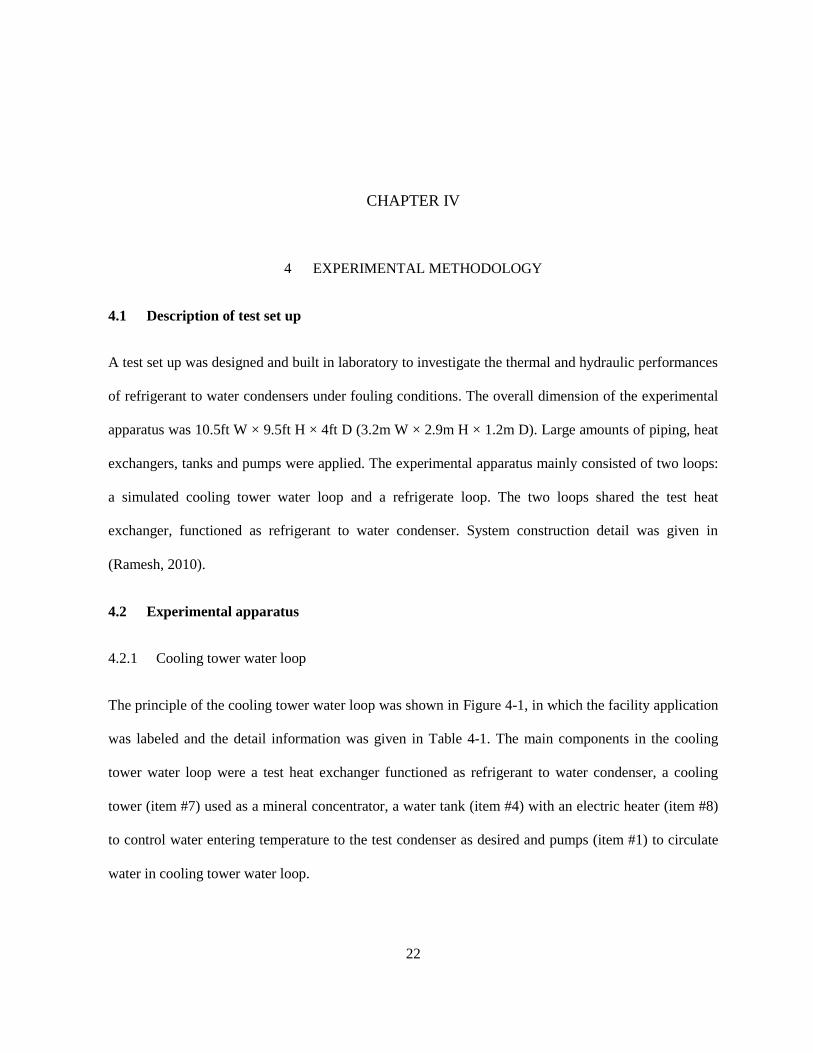
The principle of the cooling tower water loop was shown in Figure 4-1, in which the facility application
was labeled and the detail information was given in Table 4-1. The main components in the cooling
tower water loop were a test heat exchanger functioned as refrigerant to water condenser, a cooling
tower (item #7) used as a mineral concentrator, a water tank (item #4) with an electric heater (item #8)
to control water entering temperature to the test condenser as desired and pumps (item #1) to circulate
water in cooling tower water loop.
23
Figure 4-1 Principles of the cooling tower water loop
About 25% of the total flow rate was diverted to the cooling tower in order to evaporate the water at
ambient temperature, and the rest of the load was shared by a post-cooler (item #24 in Figure 4-1)
installed in parallel. In the current work, the cooling tower acted more as a mineral concentrator rather
than a heat sink. The cooling tower progressively increased the concentration of the minerals in the
water stream until saturated conditions were achieved. Low fouling potential water was applied as make
up water to replace the amount of water evaporated in cooling tower water loop periodically. This
concentration method was significant in preparing cooling tower water with desired fouling potential.
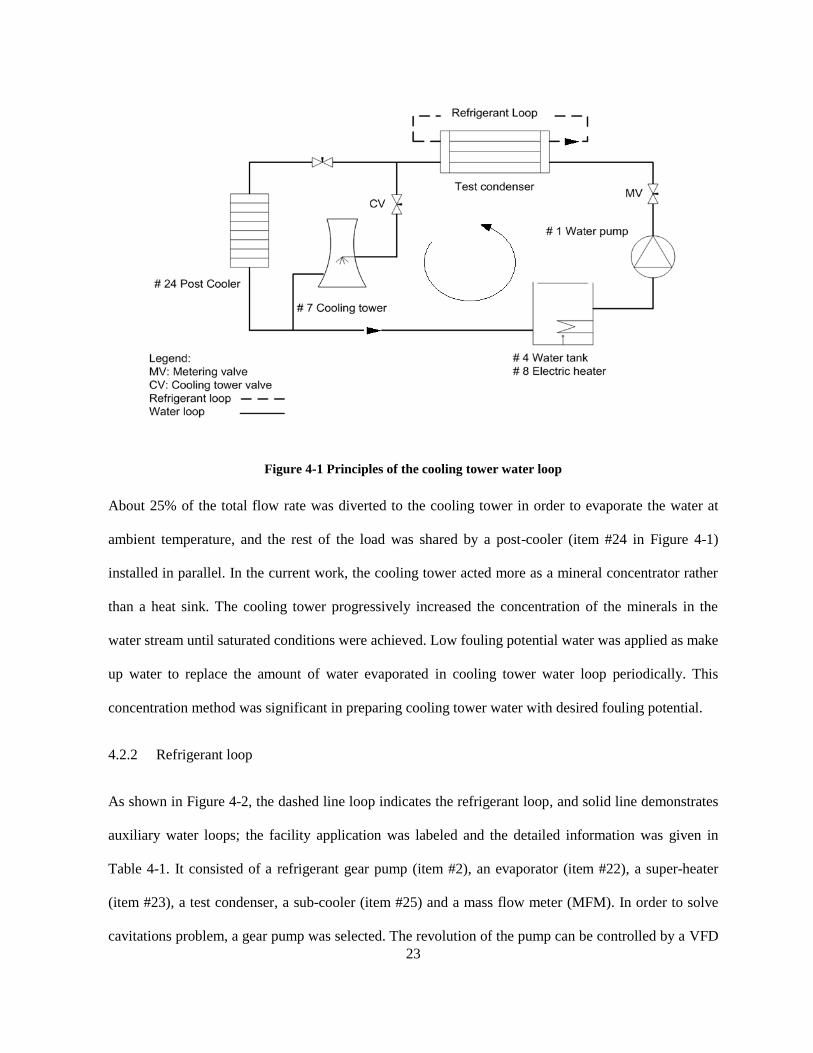
4.2.2 Refrigerant loop
As shown in Figure 4-2, the dashed line loop indicates the refrigerant loop, and solid line demonstrates
auxiliary water loops; the facility application was labeled and the detailed information was given in
Table 4-1. It consisted of a refrigerant gear pump (item #2), an evaporator (item #22), a super-heater
(item #23), a test condenser, a sub-cooler (item #25) and a mass flow meter (MFM). In order to solve
cavitations problem, a gear pump was selected. The revolution of the pump can be controlled by a VFD
24
(Variable Frequency Drive), which was used to set the RPM of the gear pump. The refrigerant was first
evaporated in the evaporator and then further superheated in the super-heater before entering the test
condenser. The pressure was taken at the inlet of the test condenser while temperature sensors were
installed before and after the test condenser. The flow rate was measured by using a coriolis type flow
meter (MFM), which was installed right after the sub-cooler.
Figure 4-2 Principle of refrigerant loop
4.2.3 Auxiliary loops and safety devices
The saturation pressure of the refrigerant was controlled by the saturation temperature and the
refrigerant charge in the system. In order to precisely control the refrigerant saturation temperature,
three auxiliary loops: evaporator water loop, super-heater water loop and campus chilled water loop
were designed to control the system at the specific conditions shown in Table 3-2. The description,
function, manufacturers, models and specifications of the main components used in the experimental
apparatus were summarized in Table 4-1 and heat exchangers application were listed in Table 4-2. And
the detail description of the three auxiliary loops were given in (Ramesh, 2010) and (Lim, 2010).
25
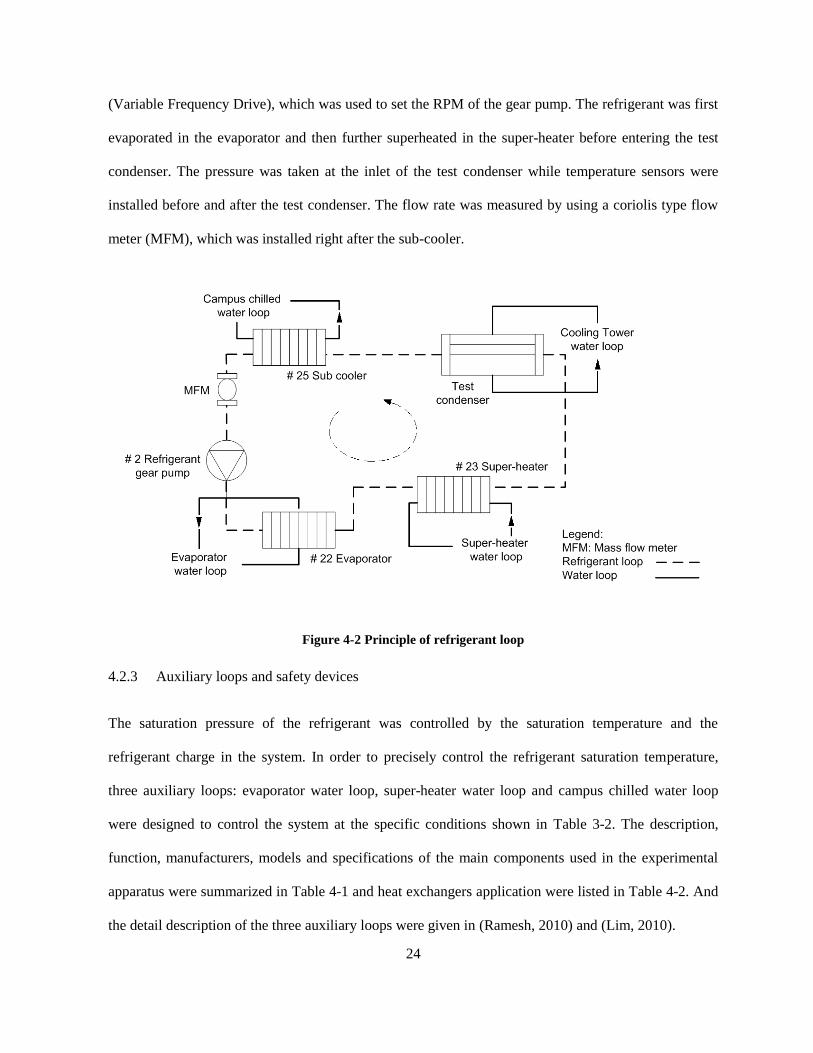
Table 4-1 Fouling tests facility application
Item Component quantity Manufacture Description
1 Water pump 5 TACO Model: 1400-50; 115V/5.0Amps; Located in water
loop
2 Gear pump 1 Micro Pump Model: GC-M25-JVSE; 230/460V, 2.8/1.4A, 1HP
Located in refrigerant loop
3 Chiller pump 1 Dayton Model: 6K581B; HP3/4, 3450RPM
4 makeup water tank 1 Ace Roto-
Mold
Polyethylene tank, 170 gallon
located in cooling tower water loop
5 Conical tank 1 Ace Roto-
Mold
Polyethylene tank, 30 gallon, located in evaporator
loop
6 Storage tank 1 Ace Roto-
Mold
Polyethylene tank, 300 gallon, contain make-up
water
7 Cooling tower 1 Ace Roto-
Mold
Polyethylene tank, 105 gallon; 65”H×23”D,diameter
8”
¾”PVC pipe inserted through the sidewall, two flat
nozzles are installed at the end of pipe to spray water
downward
8 Electric heater in
makeup water tank 1 Chromalox
Model: KTLS-390A-036; 480V/3PH/9KW
Located in water loop
9 Electric heater in
conical tank 1 Chromalox
Model: KTLS-330A-036; 480V/3PH/3KW
Located in evaporator loop
10 column heater 1 Chromalox Model: VTS-3-024P-E; 480V/24KW
Located in super-heater loop
11 Cooling tower fan 1 EMS
Equip with a variable frequency drive,
Model P5U-23P7, 240V/30A/50 Hz
Mesh wire is installed to stop water droplets by
mechanical filter
12 Cooling tower blower 1 Dayton model 9KX03, 3 HP, RPM 3505
13 Cooling tower nozzle 2 ¼” NPT male connection, 80° deflection angle
14 Flexible duct 1 Connect cooling tower and fan, diameter 8”
15 PVC pipes 30ft Located in water loop, diameter ¾”
16 Electric fan 1 Lasko Used to cool down the water pump in super-heater
loop
17 Electric fan 1 Honeywell Used to cool down the chiller pump in chiller loop
18 Expansion tank 1 Bell & Gossett
Model:HFT-15
located at the exit of electric heater in super-heater
loop
19 Floating switch 2 SJE-Rhombus 120/230VAC, 5A, 50/60Hz
20 Liquid flow switch 1 McDonnell &
Miller FS4-3T general purpose liquid flow switches
21 Copper pipes 60ft
25ft used in water loop, 1” diameter;
15ft used in evaporator loop, 1” diameter;
20ft used in super-heater loop, ¾” diameter
For safety purposes, three flow switches were installed in cooling tower water loop, evaporator water
loop and super heater water loop, respectively. The first two operated as floating valves in water tanks
and they were activated when the water level in the tank was above the cut off limit. The third flow
26
switch was connected inside the pipes in super heater water loop and it was activated when certain
amount of water flowing in the pipelines. These three flow switches were installed in parallel in the
system, serving as primary safety devices. In case of water leakage, pipe bursts or dry outs in any of the
three water loops, the flow switches would automatically stop the system to prevent further damage.
Thermal fuses were installed on the outside surface of water tank and pipelines in evaporator loop and
super heater loop to serve as secondary safety devices. The thermal fuses would stop the system if the
water temperature in tanks or pipelines is above 165 F.
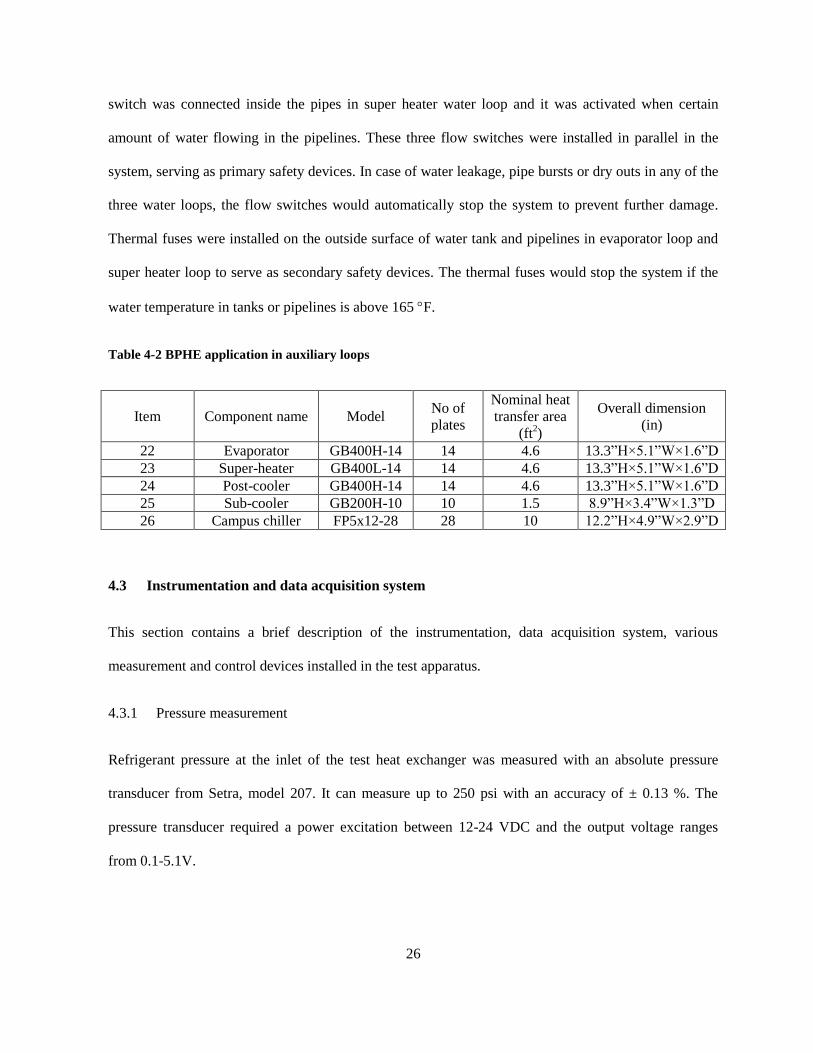
Table 4-2 BPHE application in auxiliary loops
Item Component name Model No of
plates
Nominal heat
transfer area
(ft2)
Overall dimension
(in)
22 Evaporator GB400H-14 14 4.6 13.3”H×5.1”W×1.6”D
23 Super-heater GB400L-14 14 4.6 13.3”H×5.1”W×1.6”D
24 Post-cooler GB400H-14 14 4.6 13.3”H×5.1”W×1.6”D
25 Sub-cooler GB200H-10 10 1.5 8.9”H×3.4”W×1.3”D
26 Campus chiller FP5x12-28 28 10 12.2”H×4.9”W×2.9”D
4.3 Instrumentation and data acquisition system
This section contains a brief description of the instrumentation, data acquisition system, various
measurement and control devices installed in the test apparatus.
4.3.1 Pressure measurement
Refrigerant pressure at the inlet of the test heat exchanger was measured with an absolute pressure
transducer from Setra, model 207. It can measure up to 250 psi with an accuracy of ± 0.13 %. The
pressure transducer required a power excitation between 12-24 VDC and the output voltage ranges
from 0.1-5.1V.
27
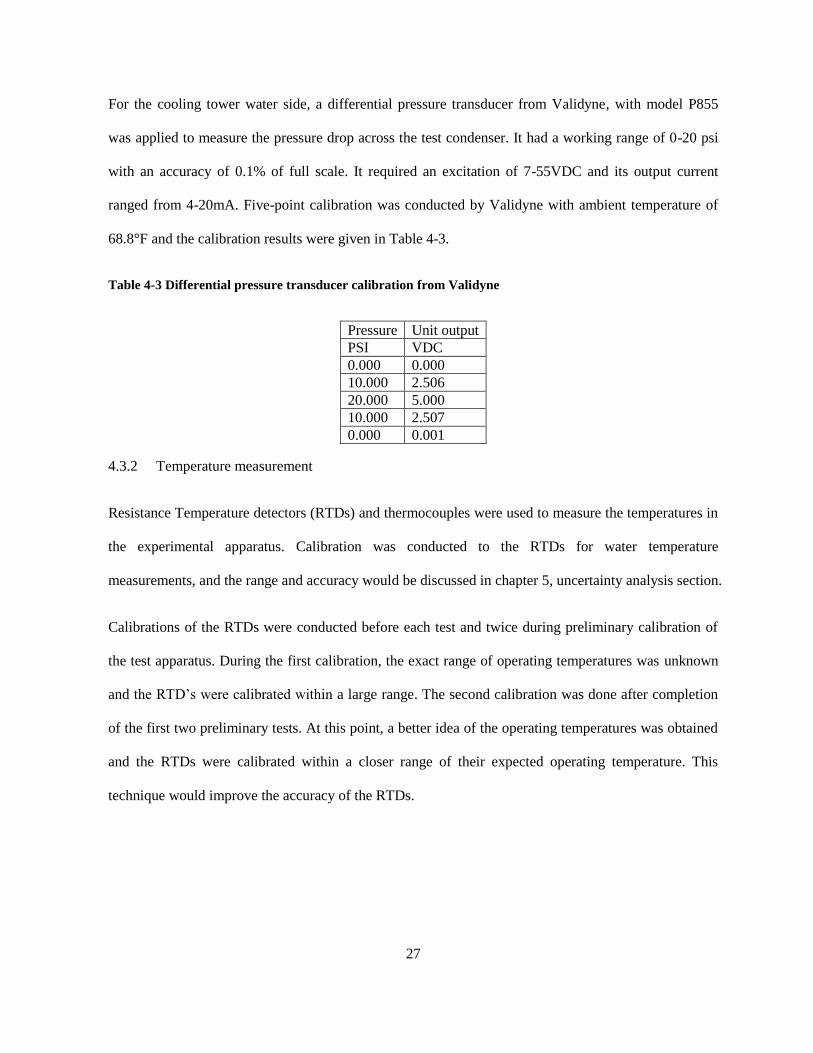
For the cooling tower water side, a differential pressure transducer from Validyne, with model P855
was applied to measure the pressure drop across the test condenser. It had a working range of 0-20 psi
with an accuracy of 0.1% of full scale. It required an excitation of 7-55VDC and its output current
ranged from 4-20mA. Five-point calibration was conducted by Validyne with ambient temperature of
68.8°F and the calibration results were given in Table 4-3.
Table 4-3 Differential pressure transducer calibration from Validyne
Pressure Unit output
PSI VDC
0.000 0.000
10.000 2.506
20.000 5.000
10.000 2.507
0.000 0.001
4.3.2 Temperature measurement
Resistance Temperature detectors (RTDs) and thermocouples were used to measure the temperatures in
the experimental apparatus. Calibration was conducted to the RTDs for water temperature
measurements, and the range and accuracy would be discussed in chapter 5, uncertainty analysis section.
Calibrations of the RTDs were conducted before each test and twice during preliminary calibration of
the test apparatus. During the first calibration, the exact range of operating temperatures was unknown
and the RTD’s were calibrated within a large range. The second calibration was done after completion
of the first two preliminary tests. At this point, a better idea of the operating temperatures was obtained
and the RTDs were calibrated within a closer range of their expected operating temperature. This
technique would improve the accuracy of the RTDs.
28
4.3.3 Mass flow rate measurement
Two Coriolis type mass flow meter from Micro Motion, were applied to measure the water and
refrigerant mass flow rates. Each of them consisted of a sensor and a transmitter capable of measuring
mass flow rate based on the coriolis force.
The refrigerant mass flow meter can measure flow rates up to 5 lb/min (0.04 kg/s), with an accuracy of
± 0.03% and maximum measurable flow rate for the water mass flow meter was 55 lb/min (0.4 kg/s)
with an accuracy of ± 0.03%. The transmitter current output ranged from 4-20mA, which was referred
to no flow and maximum flow rate, respectively.
4.3.4 Pump control and heater control
A variable frequency drive (VFD) was used to control the speed of the refrigerant pump in order to
maintain a constant flow rate of the refrigerant during the period at the fouling test. A Baldor VS1SP21-
1B drive, with a 2 HP electric motor rating requiring 240V 3-phase, was used in this work. An input
voltage ranging between 0-10V was supplied to the VFD drive by the LABVIEW control system. The
speed varied linearly with the voltage and 10V enabled the pump to rotate with a maximum RPM of
3450.
Three heaters were installed in the system to heat up the water to a desired temperature in cooling tower
water loop, super-heater water loop and evaporator water loop. Each of the heaters was controlled by a
Mini Max controller. The controller received an input voltage from the LABVIEW program. The input
voltage ranged between 0 and 10V, with 0 being no power supplied to the heater and 10V enables the
heater to operate at its maximum capacity. A PID control determined the input voltage to the controller
based on the difference between actual temperature and the set point temperature.
29
4.3.5 Data acquisition system
In this thesis, the measurements of the data were conducted using a data acquisition (DAQ) system
from National Instrument. Each recorder file included quantities such as the entering/ leaving water
temperature, water mass flow rate, refrigerant saturation pressure, refrigerant inlet/ outlet temperature,
refrigerant flow rate and etc. Each quantity was sampled every 2 seconds for 3 hours for a total of 5400
data points. Averages were calculated for each quantity. The DAQ system consisted of three parts: a
PXI, an SCXI and LABVIEW.
PXI is short for PCI Extensions for Instruments and was composed of three components, a chassis, a
system controller and peripheral modules. The PXI applied here was from National Instruments with
model NI PXI-1031.
SCXI (Signal Conditioning and Extension for Instrumentation) is a signal conditioning and switching
platform for measurement and automation systems. SCXI chassis model 1000 was applied, which can
power and control four modules. Three types of modules were installed in the SCXI; each type was
designed for a specific task and connected to a terminal block, where all the measurement instruments,
such as pressure transducers and thermocouples were connected to. All modules were located in an air-
conditioned control room that was away from the test set up.
LABVIEW was the software used to communicate with the DAQ hardware. It was graphical
programming software used to read, store and visualize the measurements. LABVIEW was selected for
the data acquisition system because of the following merits: robustness during operation, high sample
rate, easiness for code programming and maintaining, flexibility for modifications and expansion, and
user-friendly graphic interfaces.
LABVIEW consisted of two windows, a front panel and a block diagram. The front panel contained
controls and indicators, which allows the operator to control the inputs and visualize the measurements.

30
The block diagram contained all the actual programming code. The version of LABVIEW used in this
thesis was LABVIEW Real Time 8.6.
31
CHAPTER V
5 DATA REDUCTION AND UNCERTAINTY ANALYSIS
5.1 Test procedure
The procedure for the fouling tests consisted of 10 main steps as follows:
1) Prepare 270 gallon (1.04 m3) of make-up water in storage tank. Magnesium Sulfate (93.7 grams
or 0.2065 lb), Calcium Chloride (162.7 grams or 0.3587 lb) and Calcium Hydroxide (30.2
grams or 0.0666 lb) were added and mixed into the distilled water. Then Tolytriazole (344 ml
or 330 ppm) and chlorine (about 198 ppm) were added to the solution to prevent corrosion
(Rother et al., 1985) and microbiology deposits (Flynn & Nalco, 2009). The make-up water had
total hardness of about 180-358 ppm CaCO3, electrical conductivity of 649-1359 μS/cm, M-
alkalinity from 54 to 91 (ppm as CaCO3), and pH ranging between 8.2 and 8.4. Chlorides and
Sulfates were less than 260 ppm whereas the total dissolved solids ranged from 428 to 897
ppm. The calculated LSI of make-up water by applying Eq (2-2) and (2-3) is below 1, which
could be grouped in low fouling potential water.
2) Turn on campus chilled water loop (shown in Figure 4-2) to pre-cool refrigerant sub-cooler
(item #25 in Figure 4-2) for at least 20 minutes.
3) Turn on refrigerant gear pump (item #2 in Figure 4-2) at speed of 100 RPM to avoid vapor
bubble entrainment into pump suction that could potentially cause pump cavitations.
32
4) Turn on two out of three water pumps (item #1 in Figure 4-1) in the cooling tower water loop
and adjust metering valve (MV in Figure 4-1) to obtain desired flow rate of 4.6gpm. Turn on
water pumps in evaporator and super-heater water loops.
5) Turn on heaters (item #8 in Figure 4-1 and heaters located in super-heater water loop and
evaporator water loop) and increase RPM of the refrigerant pump (item #2 in Figure 4-2) to
about 360-370 RPM in order to achieve refrigerant flow rate of 3.50 lb/min.
6) Adjust water/ refrigerant inlet temperature, water/ refrigerant mass flow rate and system
pressure according to the test condition in Table 3-2, and wait 8-10 hours to reach thermal
equilibrium of the set-up with the surrounding ambient.
7) Conduct calibration test to measure UAclean within 24 hours once the system stabilized.
8) Open valve (CV in Figure 4-1) to divert water flow to the cooling tower (item #7 in Figure 4-1)
and start cooling tower fan. At this point, measure the total volume of water in the system to
determine LSI. Water evaporation was assumed to start once the cooling tower was on.
9) Adjust water pH according to the desired water fouling potential and calculate LSI. Sample the
water from the water tank (item #4 in Figure 4-1) once every week to determine the
concentration of the dissolved minerals.
10) Each day, record the data for about 2 to 3 hours. The period of recording start approximately at
the same time of the day to avoid thermal difference between the test set-up and the
surrounding ambient.
Tests were conducted until fouling resistance achieved the asymptotic fouling conditions or until the
waterside pressure losses exceeded the maximum pumping head available in the water loop. Cleaning
procedures were followed by the end of each test. For the cleaning procedures, we used Rydlyme and
33
water mixture as cleanser. After using the cleanser, the system was flushed with clean water. The
cleaning steps were as follows:
a) Clean cooling tower water loop with cleanser and flush with clean water afterwards.
b) Recover refrigerant in the system.
c) Clean evaporator water loop and super-heater water loop.
d) Clean the shafts of all the water pumps (item #1 in Figure 4-1) and cooling tower fan.
e) Clean heat coils for electric heaters (item #8 in Figure 4-1) located in water tanks.
f) Clean water tanks installed in cooling tower water loop (item #4 in Figure 4-1) and evaporator
loop.
g) Disconnect flexible duct from cooling tower (item #7 in Figure 4-1) and clean cooling tower
nozzles.
h) Recalibrate RTDs in temperature bath with thermo meter as reference
i) Back up LABVIEW program and data files
j) Install new condenser for next fouling test. Charge Nitrogen in the system to leak check.
k) Charge 15 to 18 pounds of refrigerant R-134A in the system.
In each test, the low fouling potential water was circulated through the test heat exchangers and cycled
through the cooling tower. The concentration of minerals in the cooling tower water was progressively
increased by evaporating the water at a controlled rate of 10-15 gallons per day (38 - 57 liters per day)
and the dissolved minerals quickly reached solubility limits. Make-up water was charged into the water
tank in the cooling tower water loop periodically; if actual pH was below 8.6, Potassium Hydroxide
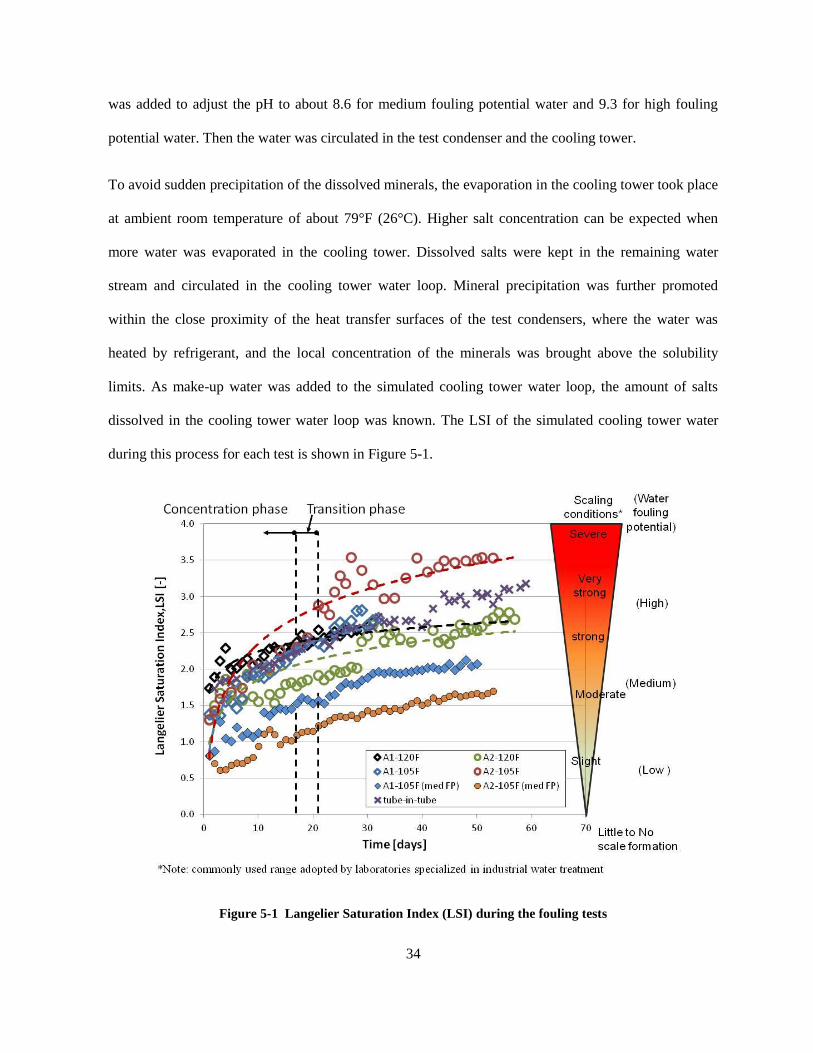
34
was added to adjust the pH to about 8.6 for medium fouling potential water and 9.3 for high fouling
potential water. Then the water was circulated in the test condenser and the cooling tower.
To avoid sudden precipitation of the dissolved minerals, the evaporation in the cooling tower took place
at ambient room temperature of about 79°F (26°C). Higher salt concentration can be expected when
more water was evaporated in the cooling tower. Dissolved salts were kept in the remaining water
stream and circulated in the cooling tower water loop. Mineral precipitation was further promoted
within the close proximity of the heat transfer surfaces of the test condensers, where the water was
heated by refrigerant, and the local concentration of the minerals was brought above the solubility
limits. As make-up water was added to the simulated cooling tower water loop, the amount of salts
dissolved in the cooling tower water loop was known. The LSI of the simulated cooling tower water
during this process for each test is shown in Figure 5-1.
Figure 5-1 Langelier Saturation Index (LSI) during the fouling tests
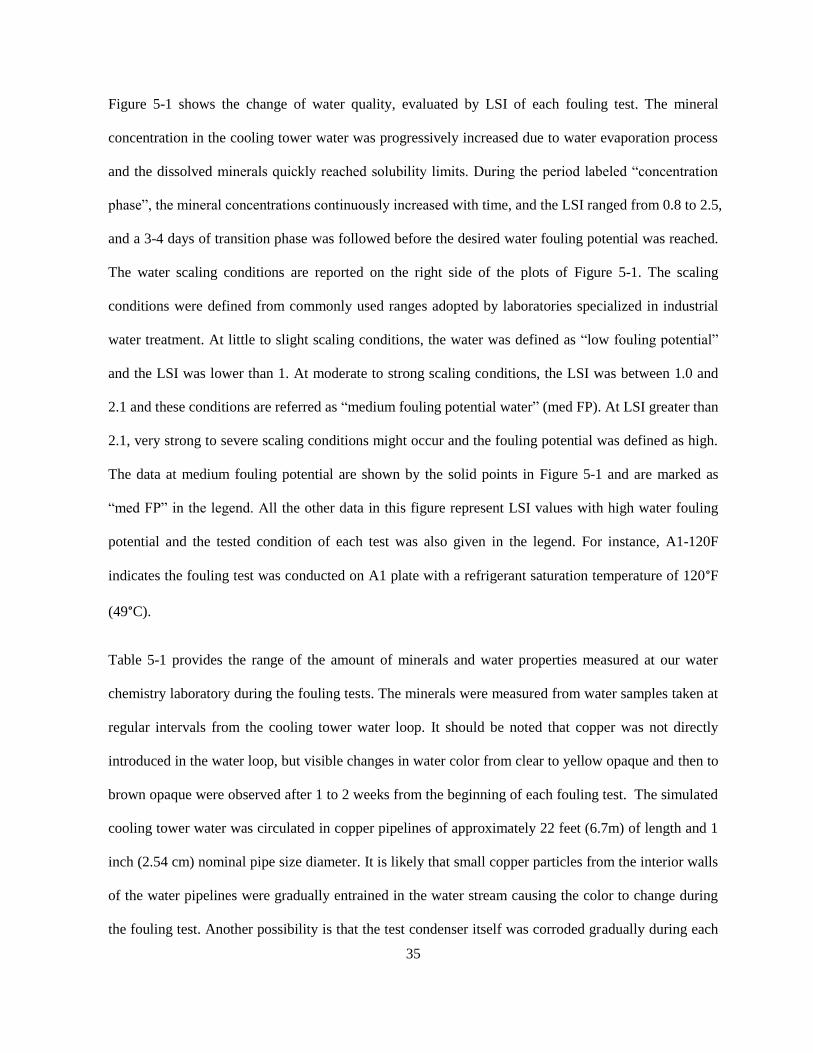
35
Figure 5-1 shows the change of water quality, evaluated by LSI of each fouling test. The mineral
concentration in the cooling tower water was progressively increased due to water evaporation process
and the dissolved minerals quickly reached solubility limits. During the period labeled “concentration
phase”, the mineral concentrations continuously increased with time, and the LSI ranged from 0.8 to 2.5,
and a 3-4 days of transition phase was followed before the desired water fouling potential was reached.
The water scaling conditions are reported on the right side of the plots of Figure 5-1. The scaling
conditions were defined from commonly used ranges adopted by laboratories specialized in industrial
water treatment. At little to slight scaling conditions, the water was defined as “low fouling potential”
and the LSI was lower than 1. At moderate to strong scaling conditions, the LSI was between 1.0 and
2.1 and these conditions are referred as “medium fouling potential water” (med FP). At LSI greater than
2.1, very strong to severe scaling conditions might occur and the fouling potential was defined as high.
The data at medium fouling potential are shown by the solid points in Figure 5-1 and are marked as
“med FP” in the legend. All the other data in this figure represent LSI values with high water fouling
potential and the tested condition of each test was also given in the legend. For instance, A1-120F
indicates the fouling test was conducted on A1 plate with a refrigerant saturation temperature of 120°F
(49°C).
Table 5-1 provides the range of the amount of minerals and water properties measured at our water
chemistry laboratory during the fouling tests. The minerals were measured from water samples taken at
regular intervals from the cooling tower water loop. It should be noted that copper was not directly
introduced in the water loop, but visible changes in water color from clear to yellow opaque and then to
brown opaque were observed after 1 to 2 weeks from the beginning of each fouling test. The simulated
cooling tower water was circulated in copper pipelines of approximately 22 feet (6.7m) of length and 1
inch (2.54 cm) nominal pipe size diameter. It is likely that small copper particles from the interior walls
of the water pipelines were gradually entrained in the water stream causing the color to change during
the fouling test. Another possibility is that the test condenser itself was corroded gradually during each
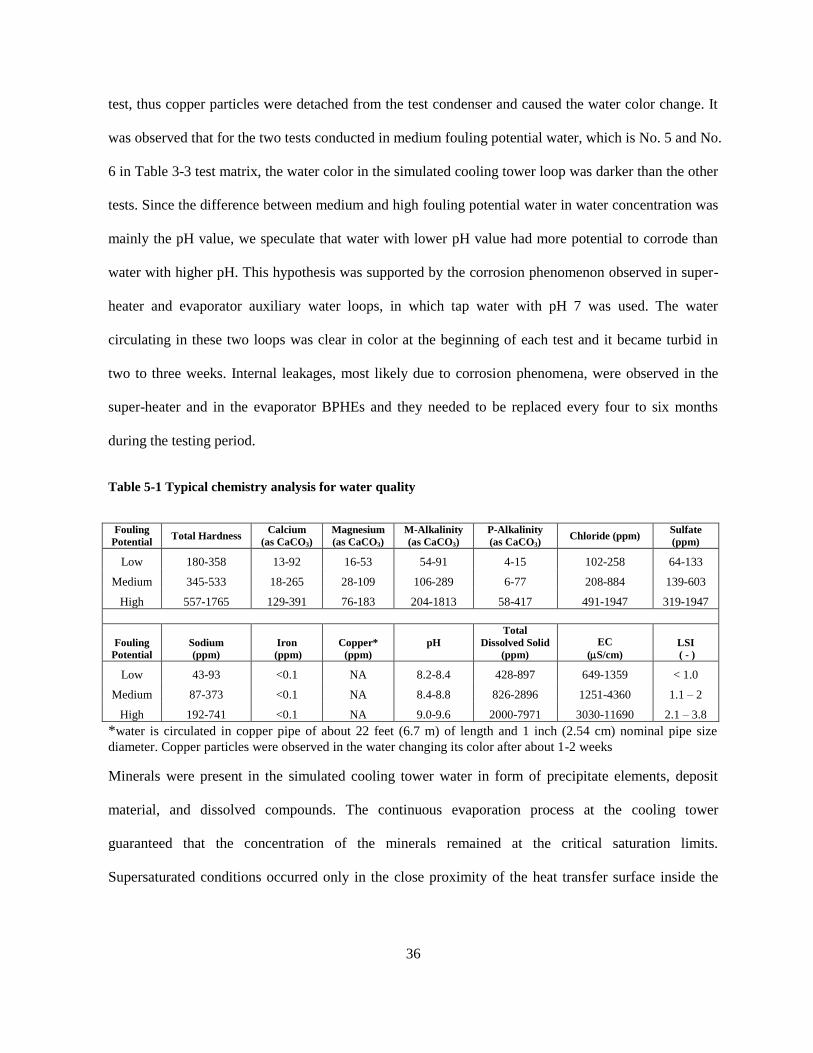
36
test, thus copper particles were detached from the test condenser and caused the water color change. It
was observed that for the two tests conducted in medium fouling potential water, which is No. 5 and No.
6 in Table 3-3 test matrix, the water color in the simulated cooling tower loop was darker than the other
tests. Since the difference between medium and high fouling potential water in water concentration was
mainly the pH value, we speculate that water with lower pH value had more potential to corrode than
water with higher pH. This hypothesis was supported by the corrosion phenomenon observed in super-
heater and evaporator auxiliary water loops, in which tap water with pH 7 was used. The water
circulating in these two loops was clear in color at the beginning of each test and it became turbid in
two to three weeks. Internal leakages, most likely due to corrosion phenomena, were observed in the
super-heater and in the evaporator BPHEs and they needed to be replaced every four to six months
during the testing period.
Table 5-1 Typical chemistry analysis for water quality
Fouling
Potential Total Hardness
Calcium
(as CaCO3)
Magnesium
(as CaCO3)
M-Alkalinity
(as CaCO3)
P-Alkalinity
(as CaCO3) Chloride (ppm)
Sulfate
(ppm)
Low 180-358 13-92 16-53 54-91 4-15 102-258 64-133
Medium 345-533 18-265 28-109 106-289 6-77 208-884 139-603
High 557-1765 129-391 76-183 204-1813 58-417 491-1947 319-1947
Fouling
Potential
Sodium
(ppm)
Iron
(ppm)
Copper*
(ppm)
pH
Total
Dissolved Solid
(ppm)
EC
(S/cm)
LSI
( - )
Low 43-93 <0.1 NA 8.2-8.4 428-897 649-1359 < 1.0
Medium 87-373 <0.1 NA 8.4-8.8 826-2896 1251-4360 1.1 – 2
High 192-741 <0.1 NA 9.0-9.6 2000-7971 3030-11690 2.1 – 3.8
*water is circulated in copper pipe of about 22 feet (6.7 m) of length and 1 inch (2.54 cm) nominal pipe size
diameter. Copper particles were observed in the water changing its color after about 1-2 weeks
Minerals were present in the simulated cooling tower water in form of precipitate elements, deposit
material, and dissolved compounds. The continuous evaporation process at the cooling tower
guaranteed that the concentration of the minerals remained at the critical saturation limits.
Supersaturated conditions occurred only in the close proximity of the heat transfer surface inside the
37
test condenser, where water was quickly heated up by the refrigerant and its local solubility limits
suddenly decreased.
5.2 Data reduction
Heat transfer performance of the test heat exchanger was evaluated over a range of internal geometries,
refrigerant saturation temperature and water qualities. In order to calculate the overall heat transfer
coefficients, heat transfer rate on the water side of the test heat exchanger was computed as follows:
(5-1)
Water and refrigerant exchange heat inside the test condenser and a schematic of temperature
distribution of these two fluids is shown in Figure 5-2(a). Super heated refrigerant entered the test
condenser and was cooled to saturation status, then left the condenser as sub cooled liquid, which were
indicated as stage 1, 2 and 3 in Figure 5-2(a).
Figure 5-2 Schematic of temperature distribution of refrigerant R134a and water
Log mean temperature difference (LMTD) for a counter flow is defined as:
(5-2)
38
However, according to AHRI standard 450, the LMTD for a water-cooled refrigerant condenser is
computed with the following equation (AHRI, 2007):
(5-3)
The corresponding temperature profiles are illustrated in Figure 5-2(b). The heat transfer coefficients
reported here were obtained by applying the AHRI method. This method does not consider either the
degree of superheat or the degree of sub-cooling on the refrigerant side of the test condenser. From the
8 tests conducted in this thesis, the degree of superheat was controlled to 65.0F (36.1C) in order to
replicate operating conditions similar to the ones of actual condensers in cooling tower applications.
However, the degree of sub-cooling of the refrigerant varied from test to test, depending on the
refrigerant saturation temperature and fouled conditions. This observation had important impacts in the
calculated fouling resistance as it will be discussed later.
As stated in (Cremaschi, et al., 2011), the data reduction for calculating the fouling resistance in heat
exchangers was carried out according to the following steps:
Step 1: At initial time t=t0, measure the parameters, , , , ,
Perform a first test with refrigerant conditions as close as possible to their nominal values of
Table 3-2. Calculate average values and standard deviation. For example
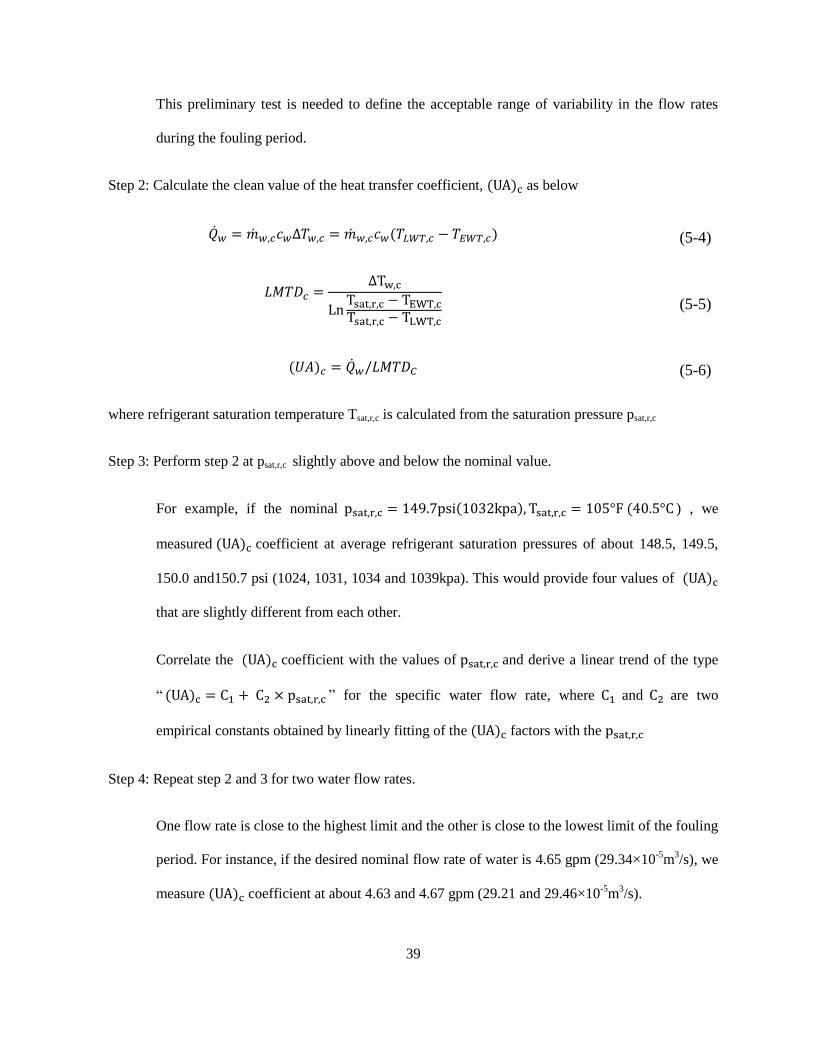
39
This preliminary test is needed to define the acceptable range of variability in the flow rates
during the fouling period.
Step 2: Calculate the clean value of the heat transfer coefficient, as below
(5-4)
(5-5)
(5-6)
where refrigerant saturation temperature Tsat,r,c is calculated from the saturation pressure psat,r,c
Step 3: Perform step 2 at psat,r,c slightly above and below the nominal value.
For example, if the nominal ) , we
measured coefficient at average refrigerant saturation pressures of about 148.5, 149.5,
150.0 and150.7 psi (1024, 1031, 1034 and 1039kpa). This would provide four values of
that are slightly different from each other.
Correlate the coefficient with the values of and derive a linear trend of the type
“ ” for the specific water flow rate, where and are two
empirical constants obtained by linearly fitting of the factors with the
Step 4: Repeat step 2 and 3 for two water flow rates.
One flow rate is close to the highest limit and the other is close to the lowest limit of the fouling
period. For instance, if the desired nominal flow rate of water is 4.65 gpm (29.34×10⁻⁵
m3/s), we
measure coefficient at about 4.63 and 4.67 gpm (29.21 and 29.46×10⁻⁵
m3/s).
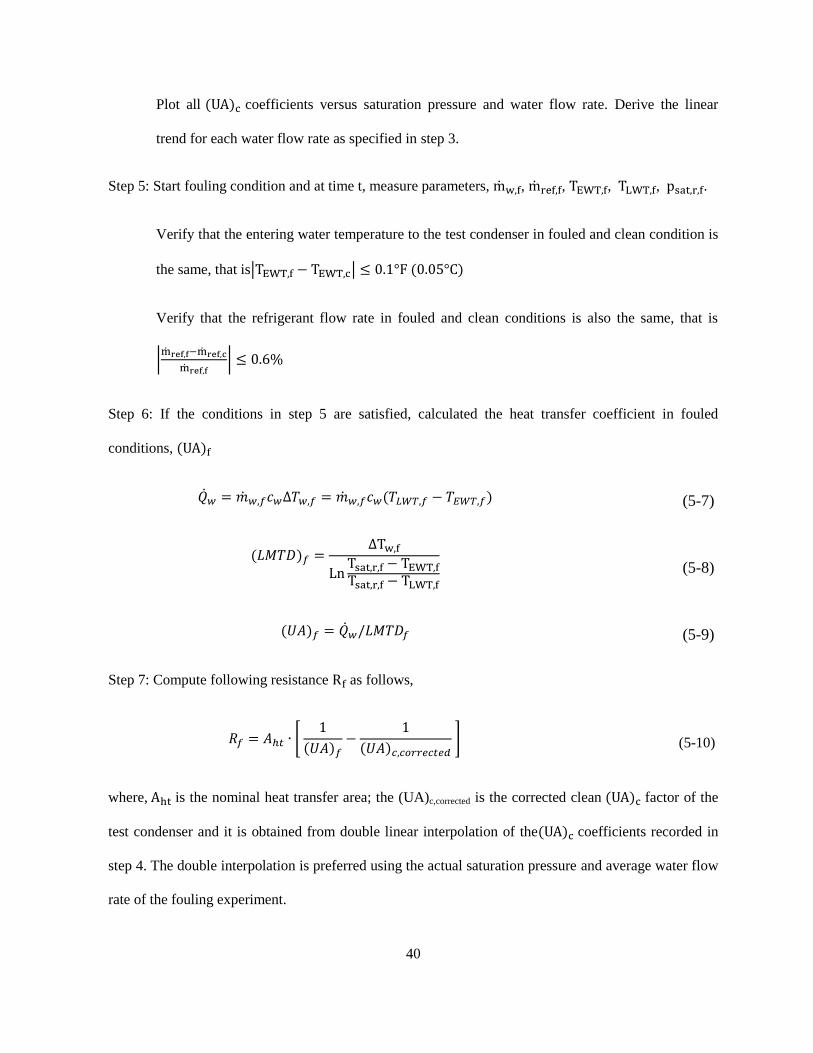
40
Plot all coefficients versus saturation pressure and water flow rate. Derive the linear
trend for each water flow rate as specified in step 3.
Step 5: Start fouling condition and at time t, measure parameters, , , , , .
Verify that the entering water temperature to the test condenser in fouled and clean condition is
the same, that is
Verify that the refrigerant flow rate in fouled and clean conditions is also the same, that is
Step 6: If the conditions in step 5 are satisfied, calculated the heat transfer coefficient in fouled
conditions,
(5-7)
(5-8)
(5-9)
Step 7: Compute following resistance as follows,
(5-10)
where, is the nominal heat transfer area; the (UA)c,corrected is the corrected clean factor of the
test condenser and it is obtained from double linear interpolation of the coefficients recorded in
step 4. The double interpolation is preferred using the actual saturation pressure and average water flow
rate of the fouling experiment.
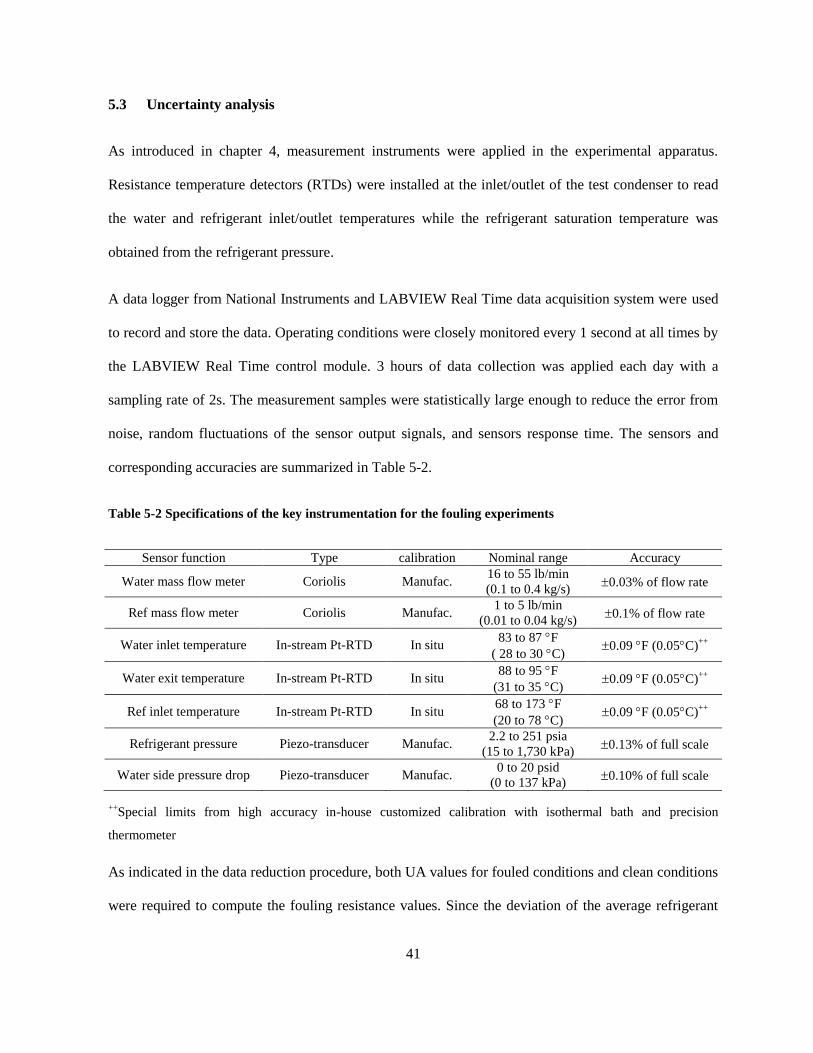
41
5.3 Uncertainty analysis
As introduced in chapter 4, measurement instruments were applied in the experimental apparatus.
Resistance temperature detectors (RTDs) were installed at the inlet/outlet of the test condenser to read
the water and refrigerant inlet/outlet temperatures while the refrigerant saturation temperature was
obtained from the refrigerant pressure.
A data logger from National Instruments and LABVIEW Real Time data acquisition system were used
to record and store the data. Operating conditions were closely monitored every 1 second at all times by
the LABVIEW Real Time control module. 3 hours of data collection was applied each day with a
sampling rate of 2s. The measurement samples were statistically large enough to reduce the error from
noise, random fluctuations of the sensor output signals, and sensors response time. The sensors and
corresponding accuracies are summarized in Table 5-2.
Table 5-2 Specifications of the key instrumentation for the fouling experiments
Sensor function Type calibration Nominal range Accuracy
Water mass flow meter Coriolis Manufac. 16 to 55 lb/min
(0.1 to 0.4 kg/s) 0.03% of flow rate
Ref mass flow meter Coriolis Manufac. 1 to 5 lb/min
(0.01 to 0.04 kg/s) 0.1% of flow rate
Water inlet temperature In-stream Pt-RTD In situ 83 to 87 F
( 28 to 30 C) 0.09 F (0.05C)
++
Water exit temperature In-stream Pt-RTD In situ 88 to 95 F
(31 to 35 C) 0.09 F (0.05C)
++
Ref inlet temperature In-stream Pt-RTD In situ 68 to 173 F
(20 to 78 C) 0.09 F (0.05C)
++
Refrigerant pressure Piezo-transducer Manufac. 2.2 to 251 psia
(15 to 1,730 kPa) 0.13% of full scale
Water side pressure drop Piezo-transducer Manufac. 0 to 20 psid
(0 to 137 kPa) 0.10% of full scale
++Special limits from high accuracy in-house customized calibration with isothermal bath and precision
thermometer
As indicated in the data reduction procedure, both UA values for fouled conditions and clean conditions
were required to compute the fouling resistance values. Since the deviation of the average refrigerant
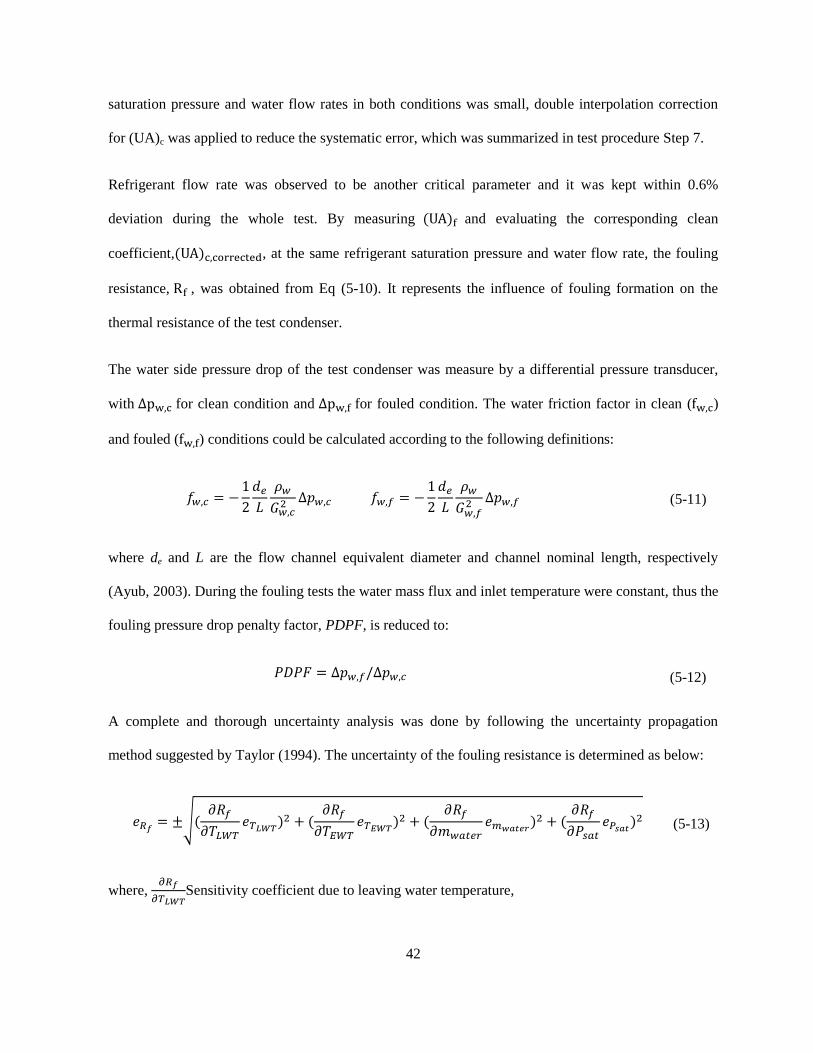
42
saturation pressure and water flow rates in both conditions was small, double interpolation correction
for (UA)c was applied to reduce the systematic error, which was summarized in test procedure Step 7.
Refrigerant flow rate was observed to be another critical parameter and it was kept within 0.6%
deviation during the whole test. By measuring and evaluating the corresponding clean
coefficient, , at the same refrigerant saturation pressure and water flow rate, the fouling
resistance, , was obtained from Eq (5-10). It represents the influence of fouling formation on the
thermal resistance of the test condenser.
The water side pressure drop of the test condenser was measure by a differential pressure transducer,
with for clean condition and for fouled condition. The water friction factor in clean ( )
and fouled ( ) conditions could be calculated according to the following definitions:
(5-11)
where de and L are the flow channel equivalent diameter and channel nominal length, respectively
(Ayub, 2003). During the fouling tests the water mass flux and inlet temperature were constant, thus the
fouling pressure drop penalty factor, PDPF, is reduced to:
(5-12)
A complete and thorough uncertainty analysis was done by following the uncertainty propagation
method suggested by Taylor (1994). The uncertainty of the fouling resistance is determined as below:
(5-13)
where,
Sensitivity coefficient due to leaving water temperature,
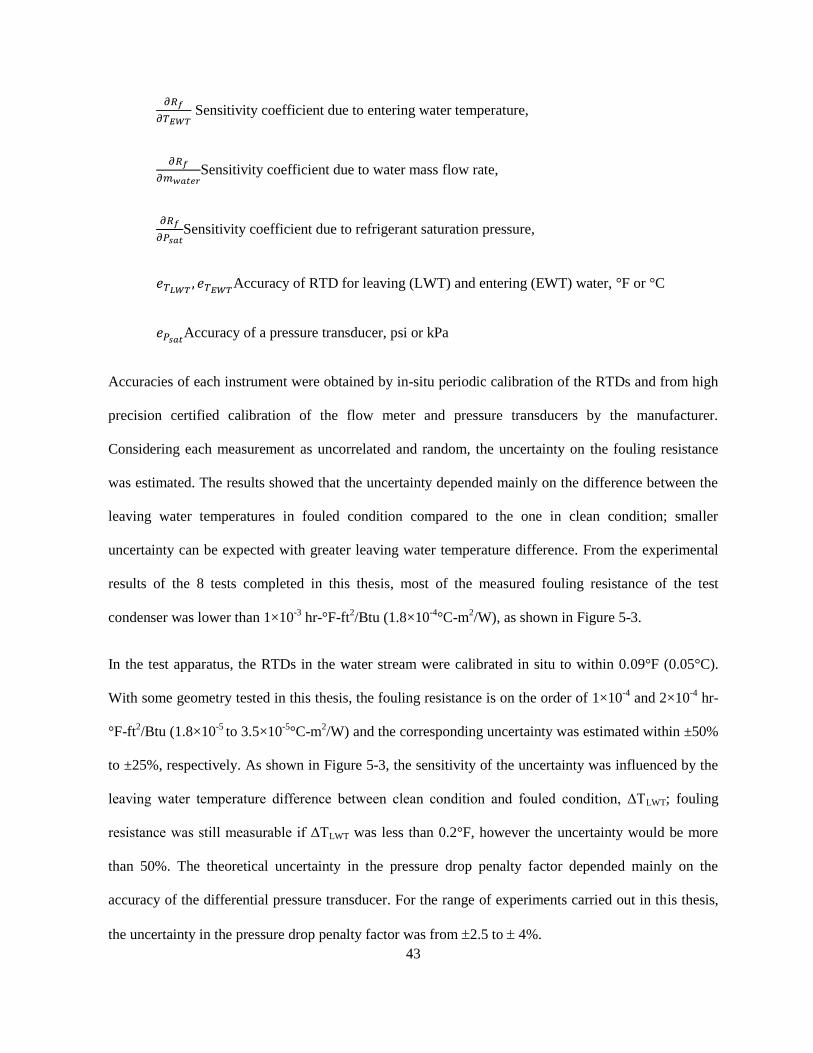
43
Sensitivity coefficient due to entering water temperature,
Sensitivity coefficient due to water mass flow rate,
Sensitivity coefficient due to refrigerant saturation pressure,
Accuracy of RTD for leaving (LWT) and entering (EWT) water, °F or °C
Accuracy of a pressure transducer, psi or kPa
Accuracies of each instrument were obtained by in-situ periodic calibration of the RTDs and from high
precision certified calibration of the flow meter and pressure transducers by the manufacturer.
Considering each measurement as uncorrelated and random, the uncertainty on the fouling resistance
was estimated. The results showed that the uncertainty depended mainly on the difference between the
leaving water temperatures in fouled condition compared to the one in clean condition; smaller
uncertainty can be expected with greater leaving water temperature difference. From the experimental
results of the 8 tests completed in this thesis, most of the measured fouling resistance of the test
condenser was lower than 1×10⁻³
hr-°F-ft2/Btu (1.8×10
-4°C-m
2/W), as shown in Figure 5-3.
In the test apparatus, the RTDs in the water stream were calibrated in situ to within 0.09°F (0.05°C).
With some geometry tested in this thesis, the fouling resistance is on the order of 1×10⁻⁴
and 2×10⁻⁴
hr-
°F-ft2/Btu (1.8×10
-5 to 3.5×10
-5°C-m
2/W) and the corresponding uncertainty was estimated within ±50%
to ±25%, respectively. As shown in Figure 5-3, the sensitivity of the uncertainty was influenced by the
leaving water temperature difference between clean condition and fouled condition, ΔTLWT; fouling
resistance was still measurable if ΔTLWT was less than 0.2°F, however the uncertainty would be more
than 50%. The theoretical uncertainty in the pressure drop penalty factor depended mainly on the
accuracy of the differential pressure transducer. For the range of experiments carried out in this thesis,
the uncertainty in the pressure drop penalty factor was from 2.5 to 4%.
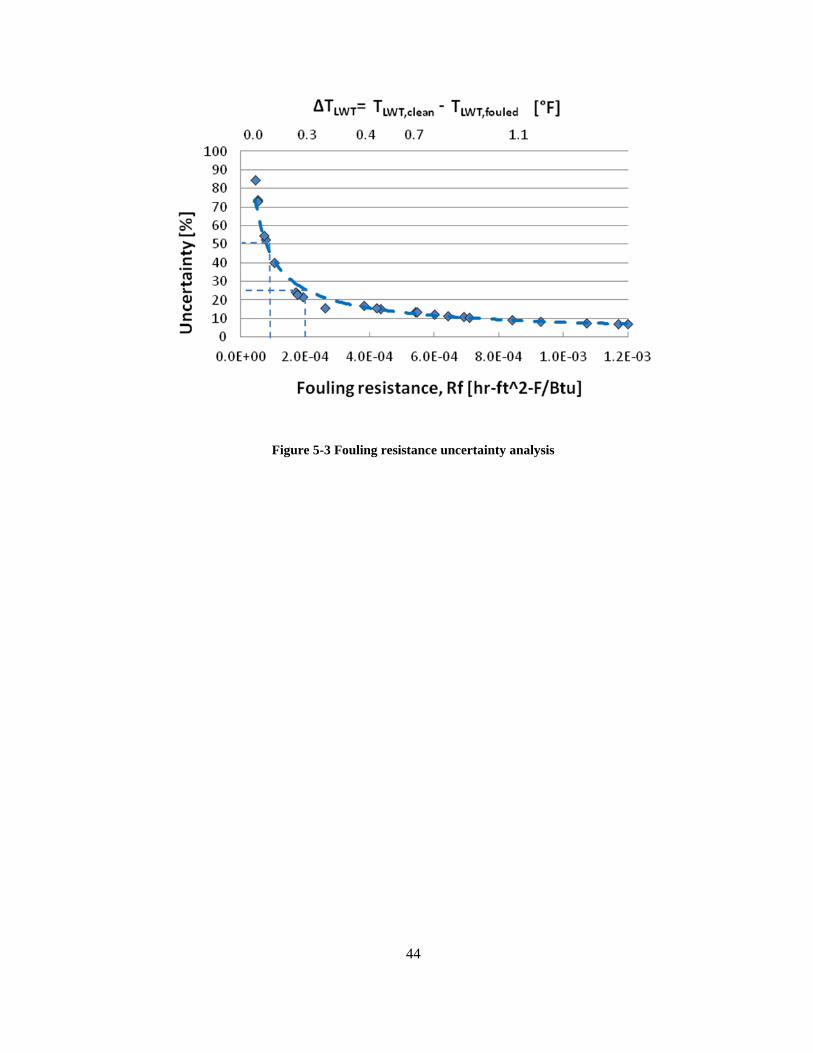
44
Figure 5-3 Fouling resistance uncertainty analysis
45
CHAPTER VI
6 RESULTS AND DISCUSSION
6.1 Fouling deposit chemical analysis
In each test, the low fouling potential water was circulated through the cooling tower, due to evaporation
process, minerals contained in the cooling tower water was concentrated and quickly reached solubility
limits. The concentrated water cycled through the test heat exchangers and heated up by refrigerant,
precipitation occurred on the surface of the test condenser.
After two months of testing on the TTHE (tube-in-tube heat exchanger), the condenser was opened from
the caps located at the end of each tube and a layer of light yellowish fouling deposit on the cap surface
was visually observed, as shown in Figure 6-1(a). These images were taken by a conventional digital
camera and it is evidence of mineral precipitation and that the heat exchanger experienced fouling.
The fouling deposit material was sampled, as shown in Figure 6-1(b), and chemical digestion analysis
was conducted at Soil, Water and Forage Analytical Laboratory (SWFAL) at Oklahoma State University.
Chemical analysis showed that more than 34% is calcium, the amount of Mg was less than 0.5%; and the
amount of Fe, Cu, and Zn were within 5%. It is assumed that carbon dioxide from the air in the cooling
tower was dissolved in the water stream and reacted with the calcium ions already present in the water,
forming CaCO3. Since only certain specific amount of chemicals were added to distilled water in my tests
to produce Calcium ions and no other anions were added, this is a reasonable assumption. By assessing
the molecular weight of Ca and CaCO3, it was estimated that CaCO3 was up to 85% of the fouling deposit.
46
However, when there are different types of anions coexisting in the water during the fouling operation, it
is recommended to dissolve the fouling deposit in water and measure the balancing ions of both calcium
and carbonate in order to estimate the chemical composition of the mineral fouling deposit.
During the fouling test, fouling deposited on every component throughout the entire water loop, including
water tank, electric heater, cooling tower, water pumps, heat exchangers, and water pipes. By measuring
the weight of fouling deposited on the surface of the eighteen caps located at the end of the smooth tube
and the surface area of the caps, it was estimated that the precipitation mass flux in two months of
continuous run was about 3.7×10⁻⁵
lb/in2 (2.6 mg/cm
2). When considering the total amount of calcium
added to the water and its solubility, and the area of the entire test set up without the TTHE, the mineral
precipitation mass flux in the rest of the system was about 4.4×10⁻⁵
lb/in2 (3 mg/cm
2) in two month of
continuous run. Considering the measurement uncertainty in the fouling deposit mass sampled from the
TTHE and the approximation for the effective area exposed to fouling in the water tank and in the cooling
tower, the two precipitation mass flux were similar. In the TTHE the water had the highest bulk
temperature but in the water tank, water reached the highest local temperature near the heating elements.
Inside the cooling tower, due to aeration, the production of CaCO3 is locally increased according to the
reaction given in Eq (6-1):
(6-1)
These observations support the fact that the mineral precipitation mass flux was practically the same for
the entire system and the analysis provide an order of magnitude of the mineral precipiation mass flux for
the case of high water fouling potential.
In the process of sampling fouling deposit material from the tube caps, an observation was made that, the
thickness of fouling varies according to the location of the cap. Thicker deposition appeared at the water
outlet, where the water temperature was almost 10°F (5.56°C) higher than the water inlet. This
phenomenon can be explained by the solubility of minerals in water since the solubility of CaCO3
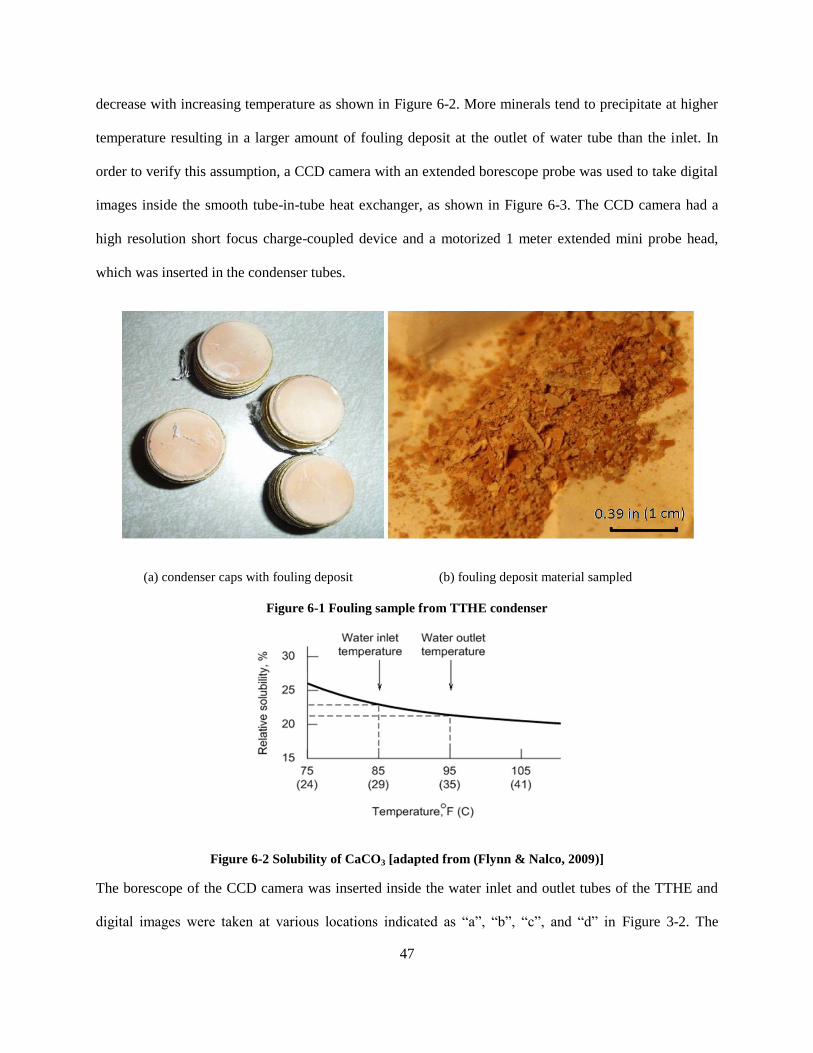
47
decrease with increasing temperature as shown in Figure 6-2. More minerals tend to precipitate at higher
temperature resulting in a larger amount of fouling deposit at the outlet of water tube than the inlet. In
order to verify this assumption, a CCD camera with an extended borescope probe was used to take digital
images inside the smooth tube-in-tube heat exchanger, as shown in Figure 6-3. The CCD camera had a
high resolution short focus charge-coupled device and a motorized 1 meter extended mini probe head,
which was inserted in the condenser tubes.
(a) condenser caps with fouling deposit (b) fouling deposit material sampled
Figure 6-1 Fouling sample from TTHE condenser
Figure 6-2 Solubility of CaCO3 [adapted from (Flynn & Nalco, 2009)]
The borescope of the CCD camera was inserted inside the water inlet and outlet tubes of the TTHE and
digital images were taken at various locations indicated as “a”, “b”, “c”, and “d” in Figure 3-2. The
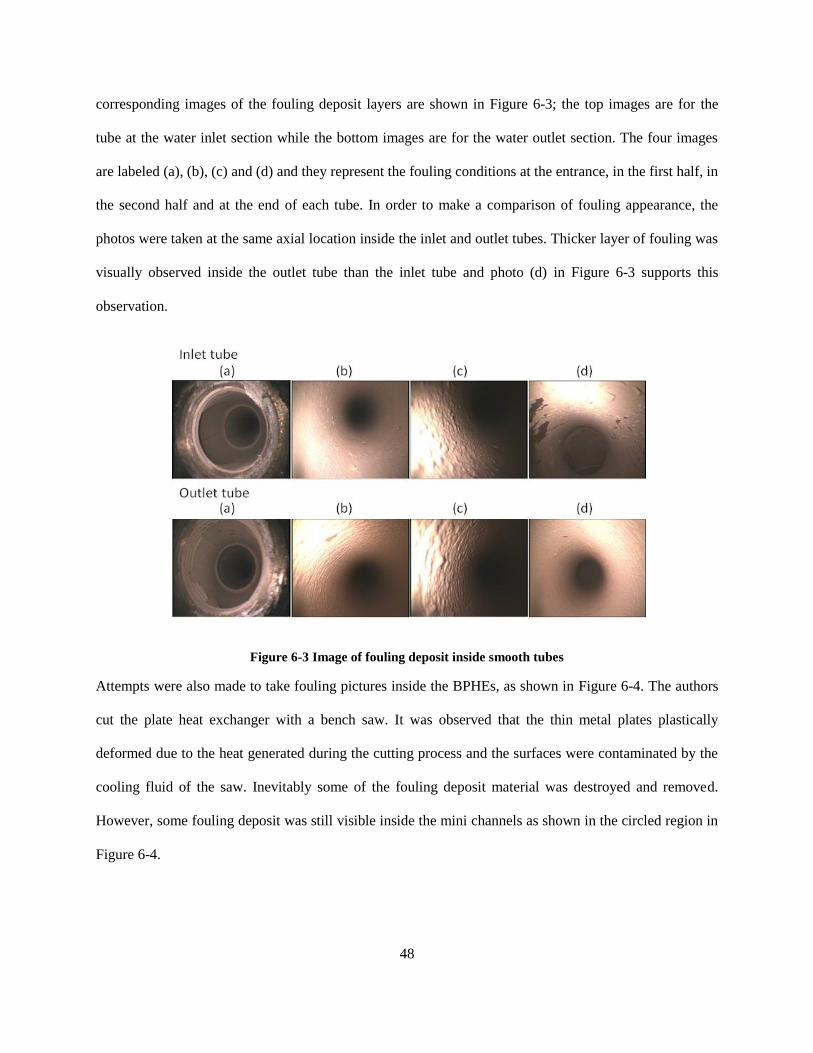
48
corresponding images of the fouling deposit layers are shown in Figure 6-3; the top images are for the
tube at the water inlet section while the bottom images are for the water outlet section. The four images
are labeled (a), (b), (c) and (d) and they represent the fouling conditions at the entrance, in the first half, in
the second half and at the end of each tube. In order to make a comparison of fouling appearance, the
photos were taken at the same axial location inside the inlet and outlet tubes. Thicker layer of fouling was
visually observed inside the outlet tube than the inlet tube and photo (d) in Figure 6-3 supports this
observation.
Figure 6-3 Image of fouling deposit inside smooth tubes
Attempts were also made to take fouling pictures inside the BPHEs, as shown in Figure 6-4. The authors
cut the plate heat exchanger with a bench saw. It was observed that the thin metal plates plastically
deformed due to the heat generated during the cutting process and the surfaces were contaminated by the
cooling fluid of the saw. Inevitably some of the fouling deposit material was destroyed and removed.
However, some fouling deposit was still visible inside the mini channels as shown in the circled region in
Figure 6-4.
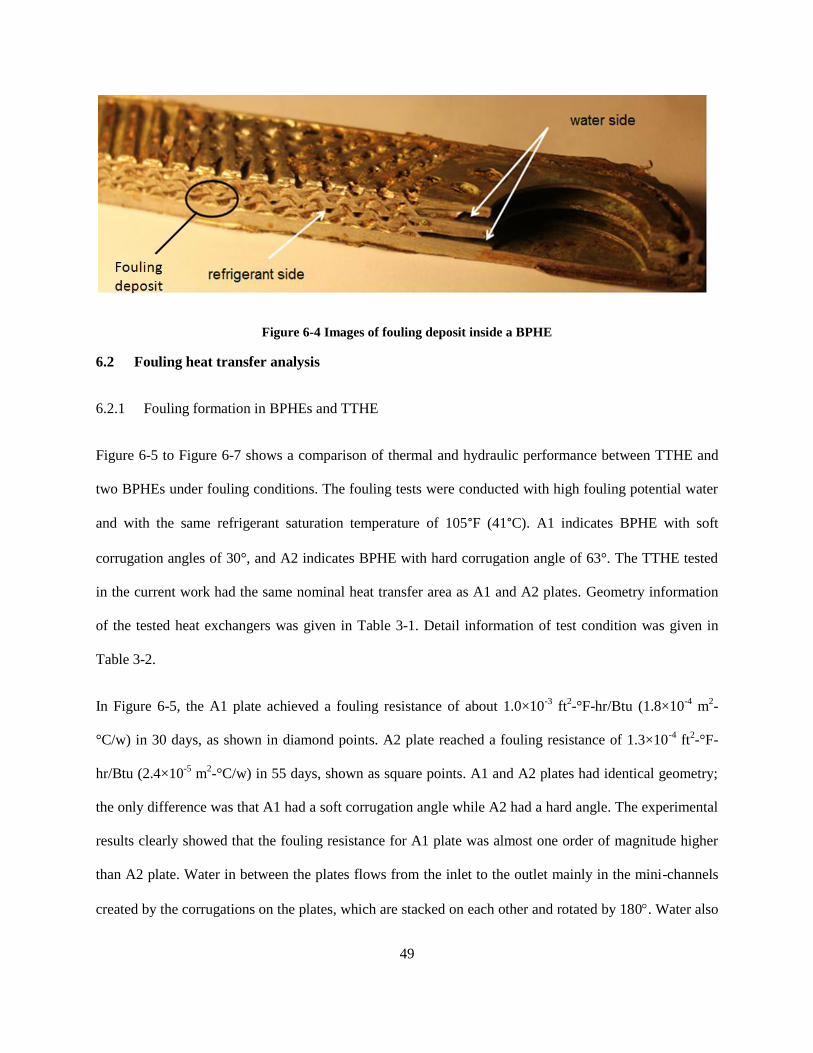
49
Figure 6-4 Images of fouling deposit inside a BPHE
6.2 Fouling heat transfer analysis
6.2.1 Fouling formation in BPHEs and TTHE
Figure 6-5 to Figure 6-7 shows a comparison of thermal and hydraulic performance between TTHE and
two BPHEs under fouling conditions. The fouling tests were conducted with high fouling potential water
and with the same refrigerant saturation temperature of 105°F (41°C). A1 indicates BPHE with soft
corrugation angles of 30°, and A2 indicates BPHE with hard corrugation angle of 63°. The TTHE tested
in the current work had the same nominal heat transfer area as A1 and A2 plates. Geometry information
of the tested heat exchangers was given in Table 3-1. Detail information of test condition was given in
Table 3-2.
In Figure 6-5, the A1 plate achieved a fouling resistance of about 1.0×10⁻³
ft2-°F-hr/Btu (1.8×10
-4 m
2-
°C/w) in 30 days, as shown in diamond points. A2 plate reached a fouling resistance of 1.3×10⁻⁴
ft2-°F-
hr/Btu (2.4×10⁻⁵
m2-°C/w) in 55 days, shown as square points. A1 and A2 plates had identical geometry;
the only difference was that A1 had a soft corrugation angle while A2 had a hard angle. The experimental
results clearly showed that the fouling resistance for A1 plate was almost one order of magnitude higher
than A2 plate. Water in between the plates flows from the inlet to the outlet mainly in the mini-channels
created by the corrugations on the plates, which are stacked on each other and rotated by 180. Water also
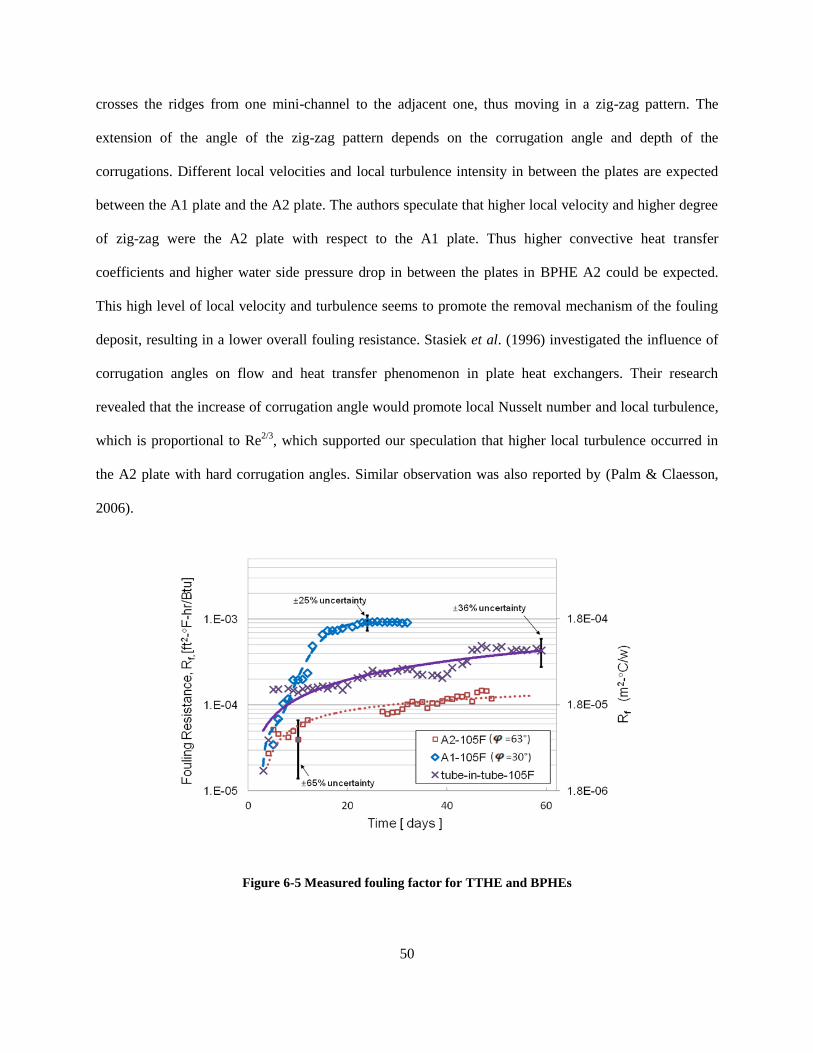
50
crosses the ridges from one mini-channel to the adjacent one, thus moving in a zig-zag pattern. The
extension of the angle of the zig-zag pattern depends on the corrugation angle and depth of the
corrugations. Different local velocities and local turbulence intensity in between the plates are expected
between the A1 plate and the A2 plate. The authors speculate that higher local velocity and higher degree
of zig-zag were the A2 plate with respect to the A1 plate. Thus higher convective heat transfer
coefficients and higher water side pressure drop in between the plates in BPHE A2 could be expected.
This high level of local velocity and turbulence seems to promote the removal mechanism of the fouling
deposit, resulting in a lower overall fouling resistance. Stasiek et al. (1996) investigated the influence of
corrugation angles on flow and heat transfer phenomenon in plate heat exchangers. Their research
revealed that the increase of corrugation angle would promote local Nusselt number and local turbulence,
which is proportional to Re2/3
, which supported our speculation that higher local turbulence occurred in
the A2 plate with hard corrugation angles. Similar observation was also reported by (Palm & Claesson,
2006).
Figure 6-5 Measured fouling factor for TTHE and BPHEs
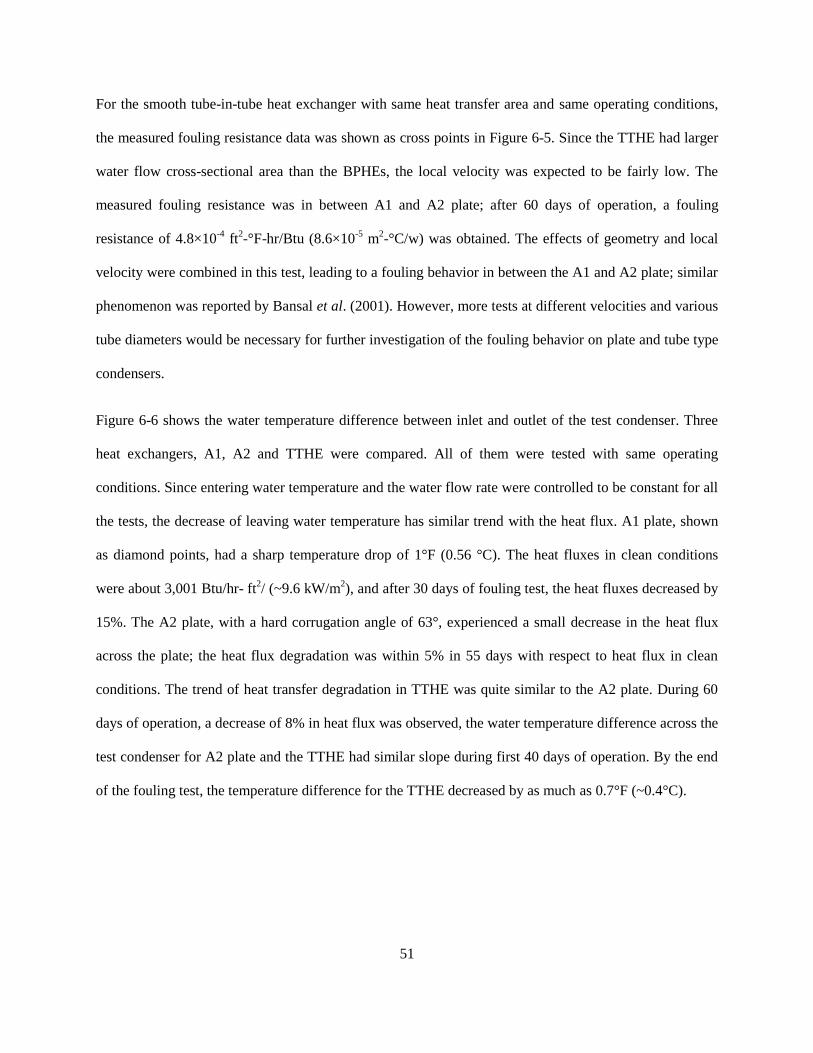
51
For the smooth tube-in-tube heat exchanger with same heat transfer area and same operating conditions,
the measured fouling resistance data was shown as cross points in Figure 6-5. Since the TTHE had larger
water flow cross-sectional area than the BPHEs, the local velocity was expected to be fairly low. The
measured fouling resistance was in between A1 and A2 plate; after 60 days of operation, a fouling
resistance of 4.8×10⁻⁴
ft2-°F-hr/Btu (8.6×10
-5 m
2-°C/w) was obtained. The effects of geometry and local
velocity were combined in this test, leading to a fouling behavior in between the A1 and A2 plate; similar
phenomenon was reported by Bansal et al. (2001). However, more tests at different velocities and various
tube diameters would be necessary for further investigation of the fouling behavior on plate and tube type
condensers.
Figure 6-6 shows the water temperature difference between inlet and outlet of the test condenser. Three
heat exchangers, A1, A2 and TTHE were compared. All of them were tested with same operating
conditions. Since entering water temperature and the water flow rate were controlled to be constant for all
the tests, the decrease of leaving water temperature has similar trend with the heat flux. A1 plate, shown
as diamond points, had a sharp temperature drop of 1°F (0.56 °C). The heat fluxes in clean conditions
were about 3,001 Btu/hr- ft2/ (~9.6 kW/m
2), and after 30 days of fouling test, the heat fluxes decreased by
15%. The A2 plate, with a hard corrugation angle of 63°, experienced a small decrease in the heat flux
across the plate; the heat flux degradation was within 5% in 55 days with respect to heat flux in clean
conditions. The trend of heat transfer degradation in TTHE was quite similar to the A2 plate. During 60
days of operation, a decrease of 8% in heat flux was observed, the water temperature difference across the
test condenser for A2 plate and the TTHE had similar slope during first 40 days of operation. By the end
of the fouling test, the temperature difference for the TTHE decreased by as much as 0.7°F (~0.4°C).
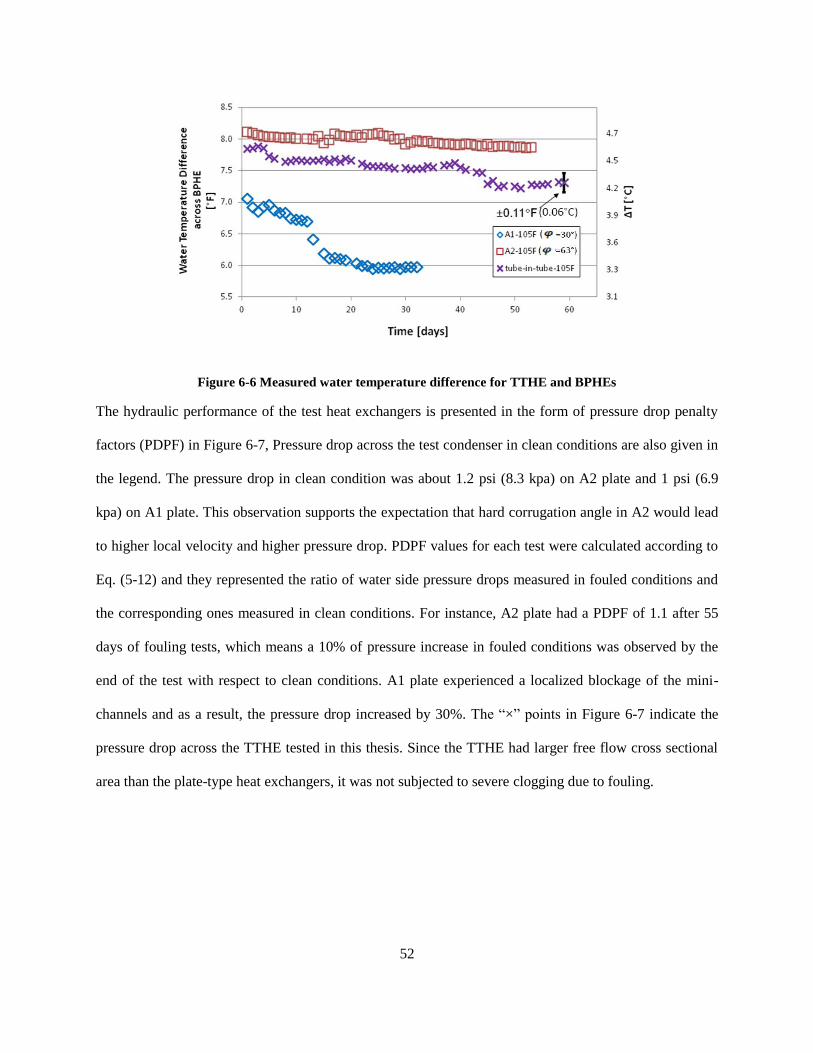
52
Figure 6-6 Measured water temperature difference for TTHE and BPHEs
The hydraulic performance of the test heat exchangers is presented in the form of pressure drop penalty
factors (PDPF) in Figure 6-7, Pressure drop across the test condenser in clean conditions are also given in
the legend. The pressure drop in clean condition was about 1.2 psi (8.3 kpa) on A2 plate and 1 psi (6.9
kpa) on A1 plate. This observation supports the expectation that hard corrugation angle in A2 would lead
to higher local velocity and higher pressure drop. PDPF values for each test were calculated according to
Eq. (5-12) and they represented the ratio of water side pressure drops measured in fouled conditions and
the corresponding ones measured in clean conditions. For instance, A2 plate had a PDPF of 1.1 after 55
days of fouling tests, which means a 10% of pressure increase in fouled conditions was observed by the
end of the test with respect to clean conditions. A1 plate experienced a localized blockage of the mini-
channels and as a result, the pressure drop increased by 30%. The “×” points in Figure 6-7 indicate the
pressure drop across the TTHE tested in this thesis. Since the TTHE had larger free flow cross sectional
area than the plate-type heat exchangers, it was not subjected to severe clogging due to fouling.
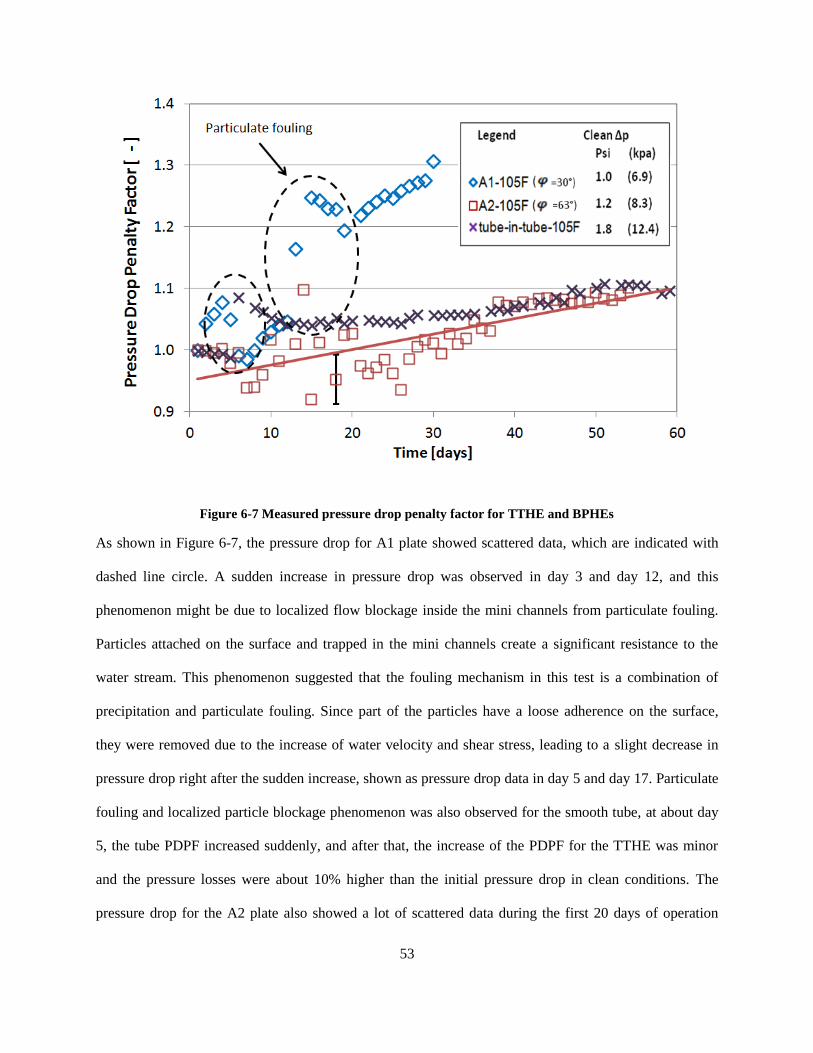
53
Figure 6-7 Measured pressure drop penalty factor for TTHE and BPHEs
As shown in Figure 6-7, the pressure drop for A1 plate showed scattered data, which are indicated with
dashed line circle. A sudden increase in pressure drop was observed in day 3 and day 12, and this
phenomenon might be due to localized flow blockage inside the mini channels from particulate fouling.
Particles attached on the surface and trapped in the mini channels create a significant resistance to the
water stream. This phenomenon suggested that the fouling mechanism in this test is a combination of
precipitation and particulate fouling. Since part of the particles have a loose adherence on the surface,
they were removed due to the increase of water velocity and shear stress, leading to a slight decrease in
pressure drop right after the sudden increase, shown as pressure drop data in day 5 and day 17. Particulate
fouling and localized particle blockage phenomenon was also observed for the smooth tube, at about day
5, the tube PDPF increased suddenly, and after that, the increase of the PDPF for the TTHE was minor
and the pressure losses were about 10% higher than the initial pressure drop in clean conditions. The
pressure drop for the A2 plate also showed a lot of scattered data during the first 20 days of operation
54
with high fouling potential water. Some PDPF values were even lower than initial values, which is an
intriguing result but most likely due to a systematic error with the test apparatus at the beginning of this
experimental campaign. This might be due to the uncertainty in the pressure measurements. In addition, it
is also possible that the A2 plate have been contaminated with particles coming from the rest of the test
set up at the beginning of the fouling test. Thus, the measured pressure drop in clean conditions might
have been a worst case estimate. Comparing with the A1 plate, which is the lowest pressure drop BPHE
by design, the pressure drop in clean conditions of the A2 plate could be 1.0 psi in the best case scenario.
The measured value in clean conditions for this test was about 20% higher already. This observation
could indicate some contamination of the A2 plate at the beginning of this test. To address this issue some
recommendations are proposed in the future work section of the thesis.
6.2.2 Impacts of condensation temperature and water quality on fouling formation
Figure 6-8 to Figure 6-11 shows the experimental measurements of the fouling tests conducted on the
BPHEs A1 and A2 at two refrigerant temperatures 105°F (41°C) and 120°F (49°C) and with high and
medium water fouling potentials. Detailed information of the test conditions is given in Table 3-2. The
data at medium fouling potential are shown by the solid points in Figure 6-8 to Figure 6-11 and are
marked as “med FP” in the legend. All other data in these figures represent fouling tests with high water
fouling potential and the notation of high fouling potential was omitted in the legend for clarity.
Figure 6-8 shows the measured fouling resistance data, after about 30 days of operation at refrigerant
temperature at 105°F (41°C) with high fouling potential water, the fouling resistance of BPHE A1 was
about 9.310-4
hr-F-ft2/Btu (1.610
-5 C-m
2/W), indicated as hollow diamond points; while the A2 plate,
with hard corrugation angle of 63 had a fouling resistance of about 1.510-4
hr-F-ft2/Btu (2.6 10
-5 C-
m2/W) after 50 days, see hollow square points. Both BPHEs had same aspect ratio, identical geometry
and heat transfer area. BPHE A1 had a soft corrugation angle of 30° and the experimental results clearly
showed that its fouling resistance is one order of magnitude higher than the one experienced by BPHEs
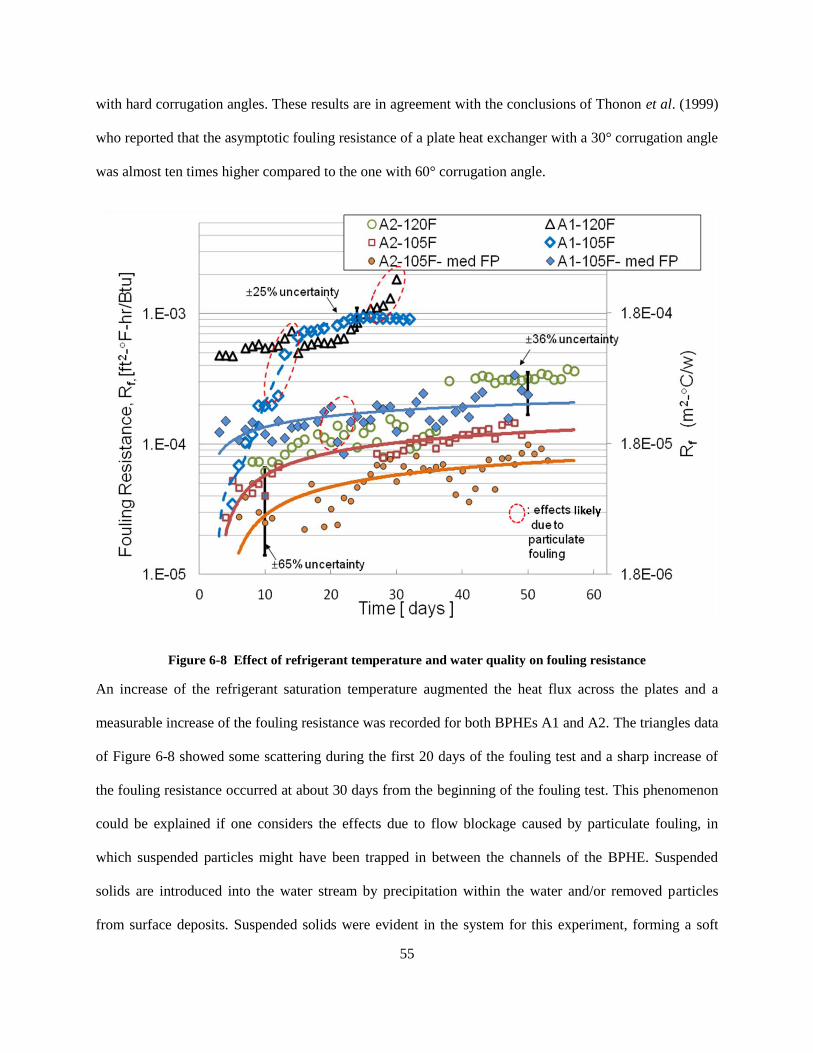
55
with hard corrugation angles. These results are in agreement with the conclusions of Thonon et al. (1999)
who reported that the asymptotic fouling resistance of a plate heat exchanger with a 30° corrugation angle
was almost ten times higher compared to the one with 60° corrugation angle.
Figure 6-8 Effect of refrigerant temperature and water quality on fouling resistance
An increase of the refrigerant saturation temperature augmented the heat flux across the plates and a
measurable increase of the fouling resistance was recorded for both BPHEs A1 and A2. The triangles data
of Figure 6-8 showed some scattering during the first 20 days of the fouling test and a sharp increase of
the fouling resistance occurred at about 30 days from the beginning of the fouling test. This phenomenon
could be explained if one considers the effects due to flow blockage caused by particulate fouling, in
which suspended particles might have been trapped in between the channels of the BPHE. Suspended
solids are introduced into the water stream by precipitation within the water and/or removed particles
from surface deposits. Suspended solids were evident in the system for this experiment, forming a soft
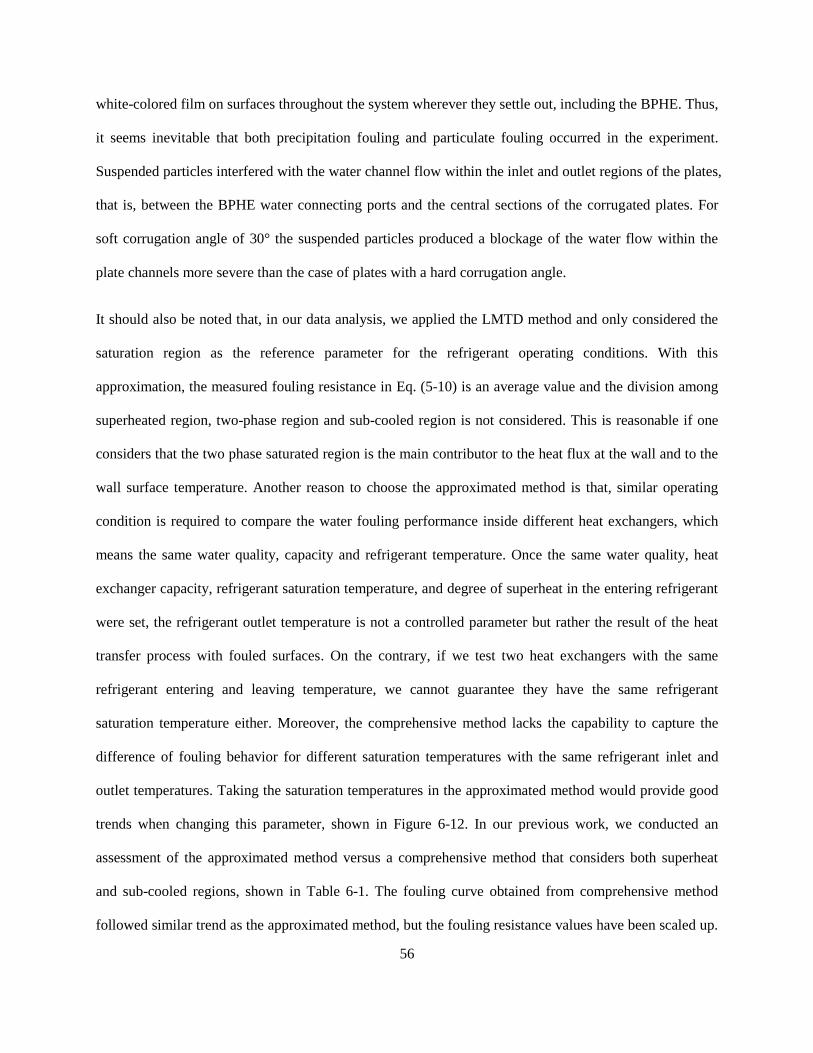
56
white-colored film on surfaces throughout the system wherever they settle out, including the BPHE. Thus,
it seems inevitable that both precipitation fouling and particulate fouling occurred in the experiment.
Suspended particles interfered with the water channel flow within the inlet and outlet regions of the plates,
that is, between the BPHE water connecting ports and the central sections of the corrugated plates. For
soft corrugation angle of 30° the suspended particles produced a blockage of the water flow within the
plate channels more severe than the case of plates with a hard corrugation angle.
It should also be noted that, in our data analysis, we applied the LMTD method and only considered the
saturation region as the reference parameter for the refrigerant operating conditions. With this
approximation, the measured fouling resistance in Eq. (5-10) is an average value and the division among
superheated region, two-phase region and sub-cooled region is not considered. This is reasonable if one
considers that the two phase saturated region is the main contributor to the heat flux at the wall and to the
wall surface temperature. Another reason to choose the approximated method is that, similar operating
condition is required to compare the water fouling performance inside different heat exchangers, which
means the same water quality, capacity and refrigerant temperature. Once the same water quality, heat
exchanger capacity, refrigerant saturation temperature, and degree of superheat in the entering refrigerant
were set, the refrigerant outlet temperature is not a controlled parameter but rather the result of the heat
transfer process with fouled surfaces. On the contrary, if we test two heat exchangers with the same
refrigerant entering and leaving temperature, we cannot guarantee they have the same refrigerant
saturation temperature either. Moreover, the comprehensive method lacks the capability to capture the
difference of fouling behavior for different saturation temperatures with the same refrigerant inlet and
outlet temperatures. Taking the saturation temperatures in the approximated method would provide good
trends when changing this parameter, shown in Figure 6-12. In our previous work, we conducted an
assessment of the approximated method versus a comprehensive method that considers both superheat
and sub-cooled regions, shown in Table 6-1. The fouling curve obtained from comprehensive method
followed similar trend as the approximated method, but the fouling resistance values have been scaled up.
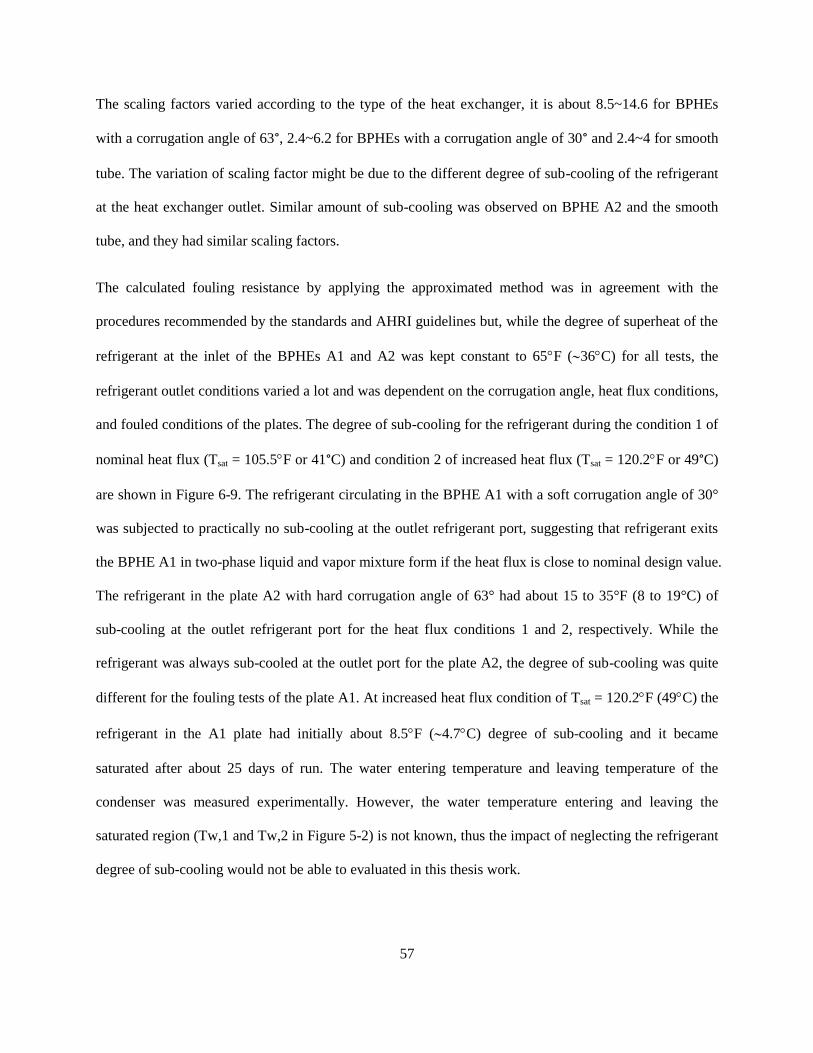
57
The scaling factors varied according to the type of the heat exchanger, it is about 8.5~14.6 for BPHEs
with a corrugation angle of 63°, 2.4~6.2 for BPHEs with a corrugation angle of 30° and 2.4~4 for smooth
tube. The variation of scaling factor might be due to the different degree of sub-cooling of the refrigerant
at the heat exchanger outlet. Similar amount of sub-cooling was observed on BPHE A2 and the smooth
tube, and they had similar scaling factors.
The calculated fouling resistance by applying the approximated method was in agreement with the
procedures recommended by the standards and AHRI guidelines but, while the degree of superheat of the
refrigerant at the inlet of the BPHEs A1 and A2 was kept constant to 65F (36C) for all tests, the
refrigerant outlet conditions varied a lot and was dependent on the corrugation angle, heat flux conditions,
and fouled conditions of the plates. The degree of sub-cooling for the refrigerant during the condition 1 of
nominal heat flux (Tsat = 105.5F or 41°C) and condition 2 of increased heat flux (Tsat = 120.2F or 49°C)
are shown in Figure 6-9. The refrigerant circulating in the BPHE A1 with a soft corrugation angle of 30°
was subjected to practically no sub-cooling at the outlet refrigerant port, suggesting that refrigerant exits
the BPHE A1 in two-phase liquid and vapor mixture form if the heat flux is close to nominal design value.
The refrigerant in the plate A2 with hard corrugation angle of 63° had about 15 to 35°F (8 to 19°C) of
sub-cooling at the outlet refrigerant port for the heat flux conditions 1 and 2, respectively. While the
refrigerant was always sub-cooled at the outlet port for the plate A2, the degree of sub-cooling was quite
different for the fouling tests of the plate A1. At increased heat flux condition of Tsat = 120.2F (49C) the
refrigerant in the A1 plate had initially about 8.5F (4.7C) degree of sub-cooling and it became
saturated after about 25 days of run. The water entering temperature and leaving temperature of the
condenser was measured experimentally. However, the water temperature entering and leaving the
saturated region (Tw,1 and Tw,2 in Figure 5-2) is not known, thus the impact of neglecting the refrigerant
degree of sub-cooling would not be able to evaluated in this thesis work.
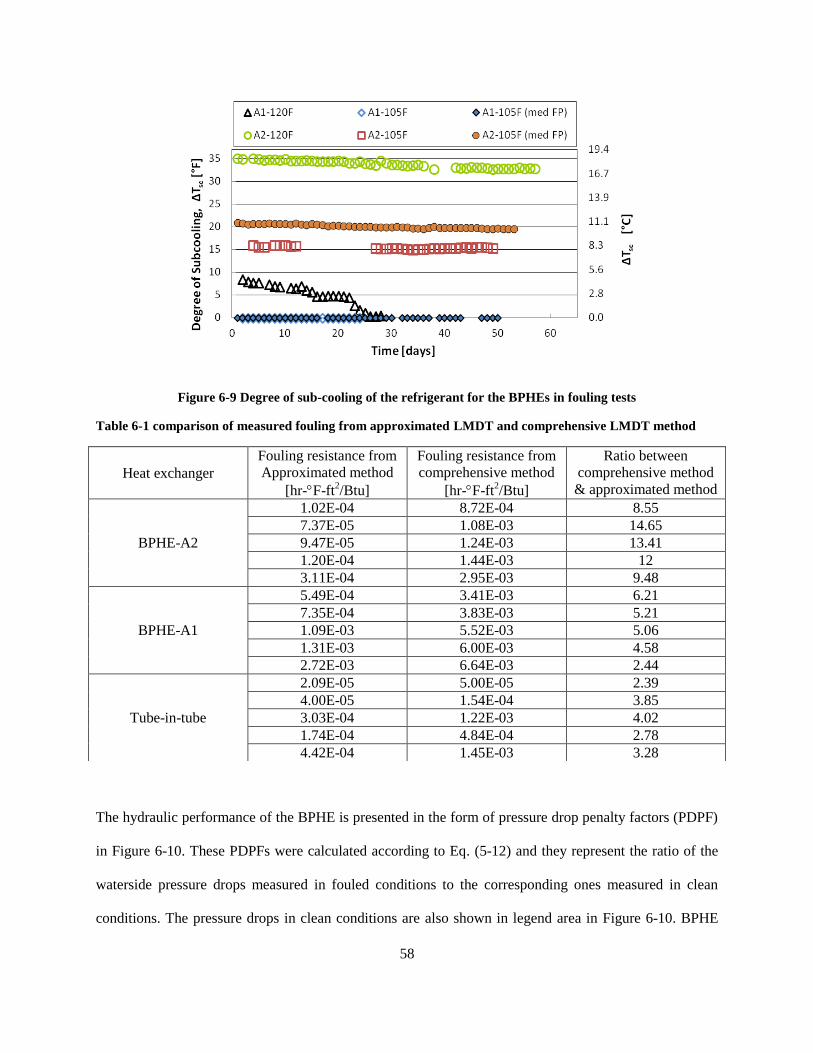
58
Figure 6-9 Degree of sub-cooling of the refrigerant for the BPHEs in fouling tests
Table 6-1 comparison of measured fouling from approximated LMDT and comprehensive LMDT method
The hydraulic performance of the BPHE is presented in the form of pressure drop penalty factors (PDPF)
in Figure 6-10. These PDPFs were calculated according to Eq. (5-12) and they represent the ratio of the
waterside pressure drops measured in fouled conditions to the corresponding ones measured in clean
conditions. The pressure drops in clean conditions are also shown in legend area in Figure 6-10. BPHE
Heat exchanger
Fouling resistance from
Approximated method
[hr-F-ft2/Btu]
Fouling resistance from
comprehensive method
[hr-F-ft2/Btu]
Ratio between
comprehensive method
& approximated method
BPHE-A2
1.02E-04 8.72E-04 8.55
7.37E-05 1.08E-03 14.65
9.47E-05 1.24E-03 13.41
1.20E-04 1.44E-03 12
3.11E-04 2.95E-03 9.48
BPHE-A1
5.49E-04 3.41E-03 6.21
7.35E-04 3.83E-03 5.21
1.09E-03 5.52E-03 5.06
1.31E-03 6.00E-03 4.58
2.72E-03 6.64E-03 2.44
Tube-in-tube
2.09E-05 5.00E-05 2.39
4.00E-05 1.54E-04 3.85
3.03E-04 1.22E-03 4.02
1.74E-04 4.84E-04 2.78
4.42E-04 1.45E-03 3.28
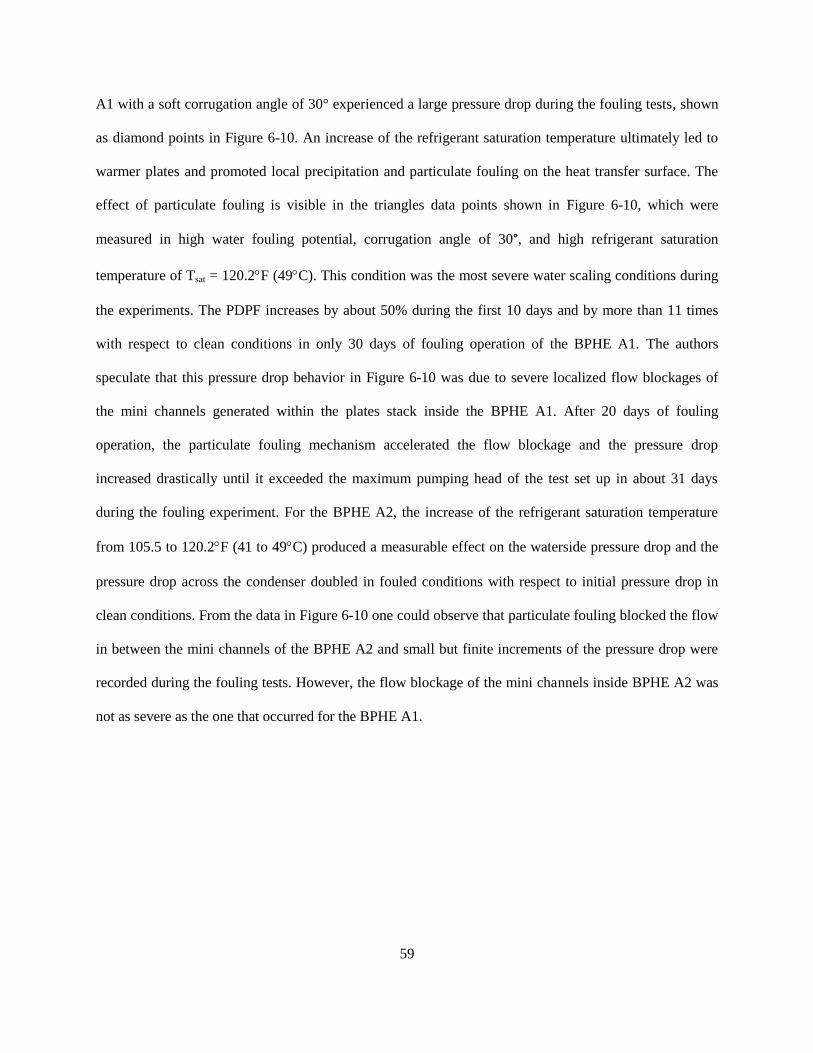
59
A1 with a soft corrugation angle of 30° experienced a large pressure drop during the fouling tests, shown
as diamond points in Figure 6-10. An increase of the refrigerant saturation temperature ultimately led to
warmer plates and promoted local precipitation and particulate fouling on the heat transfer surface. The
effect of particulate fouling is visible in the triangles data points shown in Figure 6-10, which were
measured in high water fouling potential, corrugation angle of 30°, and high refrigerant saturation
temperature of Tsat = 120.2F (49C). This condition was the most severe water scaling conditions during
the experiments. The PDPF increases by about 50% during the first 10 days and by more than 11 times
with respect to clean conditions in only 30 days of fouling operation of the BPHE A1. The authors
speculate that this pressure drop behavior in Figure 6-10 was due to severe localized flow blockages of
the mini channels generated within the plates stack inside the BPHE A1. After 20 days of fouling
operation, the particulate fouling mechanism accelerated the flow blockage and the pressure drop
increased drastically until it exceeded the maximum pumping head of the test set up in about 31 days
during the fouling experiment. For the BPHE A2, the increase of the refrigerant saturation temperature
from 105.5 to 120.2F (41 to 49C) produced a measurable effect on the waterside pressure drop and the
pressure drop across the condenser doubled in fouled conditions with respect to initial pressure drop in
clean conditions. From the data in Figure 6-10 one could observe that particulate fouling blocked the flow
in between the mini channels of the BPHE A2 and small but finite increments of the pressure drop were
recorded during the fouling tests. However, the flow blockage of the mini channels inside BPHE A2 was
not as severe as the one that occurred for the BPHE A1.
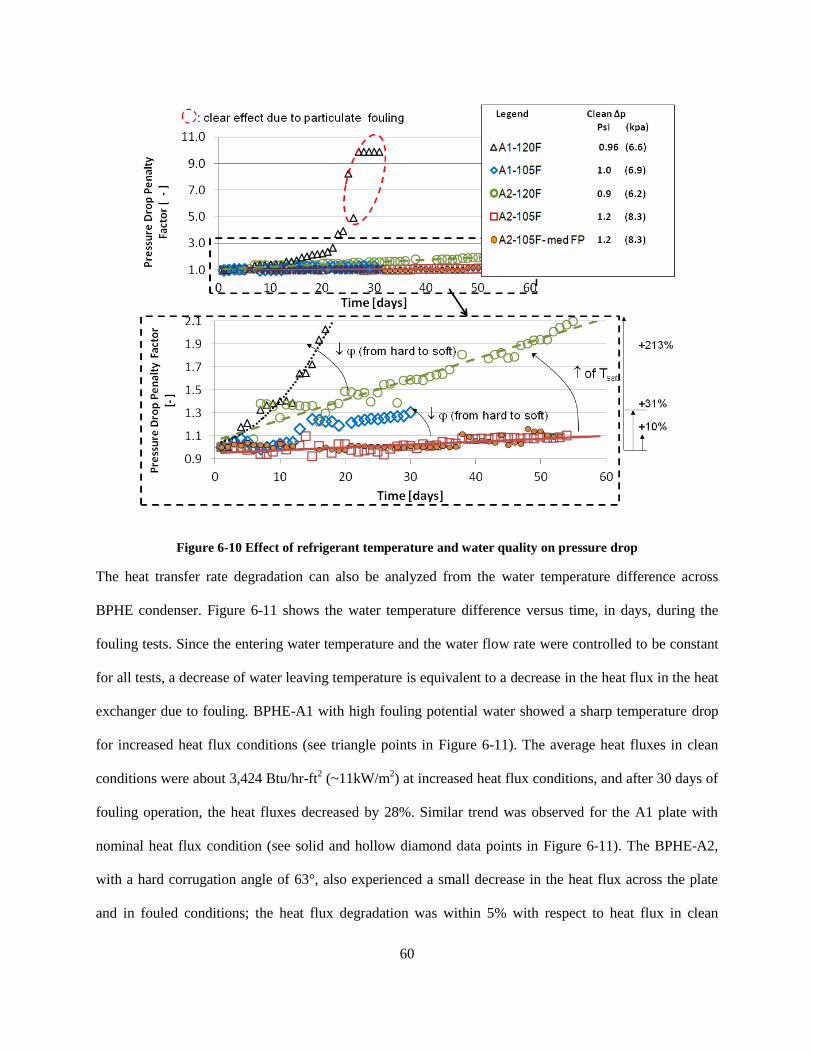
60
Figure 6-10 Effect of refrigerant temperature and water quality on pressure drop
The heat transfer rate degradation can also be analyzed from the water temperature difference across
BPHE condenser. Figure 6-11 shows the water temperature difference versus time, in days, during the
fouling tests. Since the entering water temperature and the water flow rate were controlled to be constant
for all tests, a decrease of water leaving temperature is equivalent to a decrease in the heat flux in the heat
exchanger due to fouling. BPHE-A1 with high fouling potential water showed a sharp temperature drop
for increased heat flux conditions (see triangle points in Figure 6-11). The average heat fluxes in clean
conditions were about 3,424 Btu/hr-ft2 (~11kW/m
2) at increased heat flux conditions, and after 30 days of
fouling operation, the heat fluxes decreased by 28%. Similar trend was observed for the A1 plate with
nominal heat flux condition (see solid and hollow diamond data points in Figure 6-11). The BPHE-A2,
with a hard corrugation angle of 63°, also experienced a small decrease in the heat flux across the plate
and in fouled conditions; the heat flux degradation was within 5% with respect to heat flux in clean
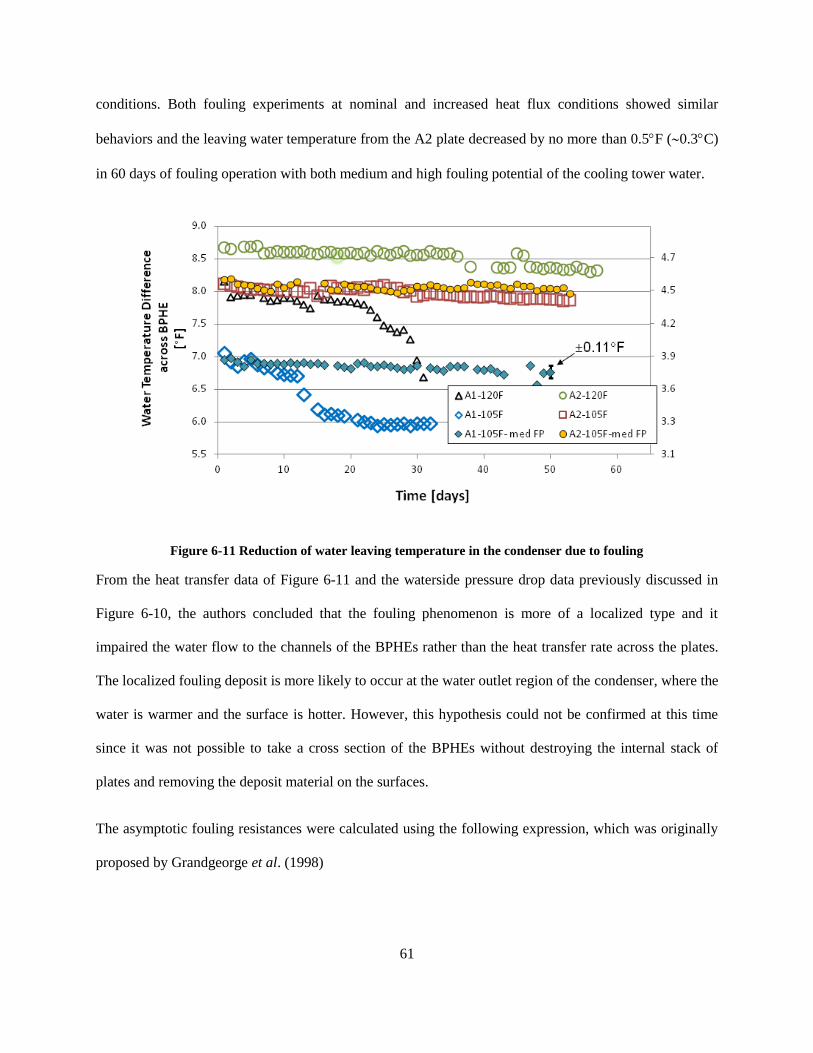
61
conditions. Both fouling experiments at nominal and increased heat flux conditions showed similar
behaviors and the leaving water temperature from the A2 plate decreased by no more than 0.5F (0.3C)
in 60 days of fouling operation with both medium and high fouling potential of the cooling tower water.
Figure 6-11 Reduction of water leaving temperature in the condenser due to fouling
From the heat transfer data of Figure 6-11 and the waterside pressure drop data previously discussed in
Figure 6-10, the authors concluded that the fouling phenomenon is more of a localized type and it
impaired the water flow to the channels of the BPHEs rather than the heat transfer rate across the plates.
The localized fouling deposit is more likely to occur at the water outlet region of the condenser, where the
water is warmer and the surface is hotter. However, this hypothesis could not be confirmed at this time
since it was not possible to take a cross section of the BPHEs without destroying the internal stack of
plates and removing the deposit material on the surfaces.
The asymptotic fouling resistances were calculated using the following expression, which was originally
proposed by Grandgeorge et al. (1998)
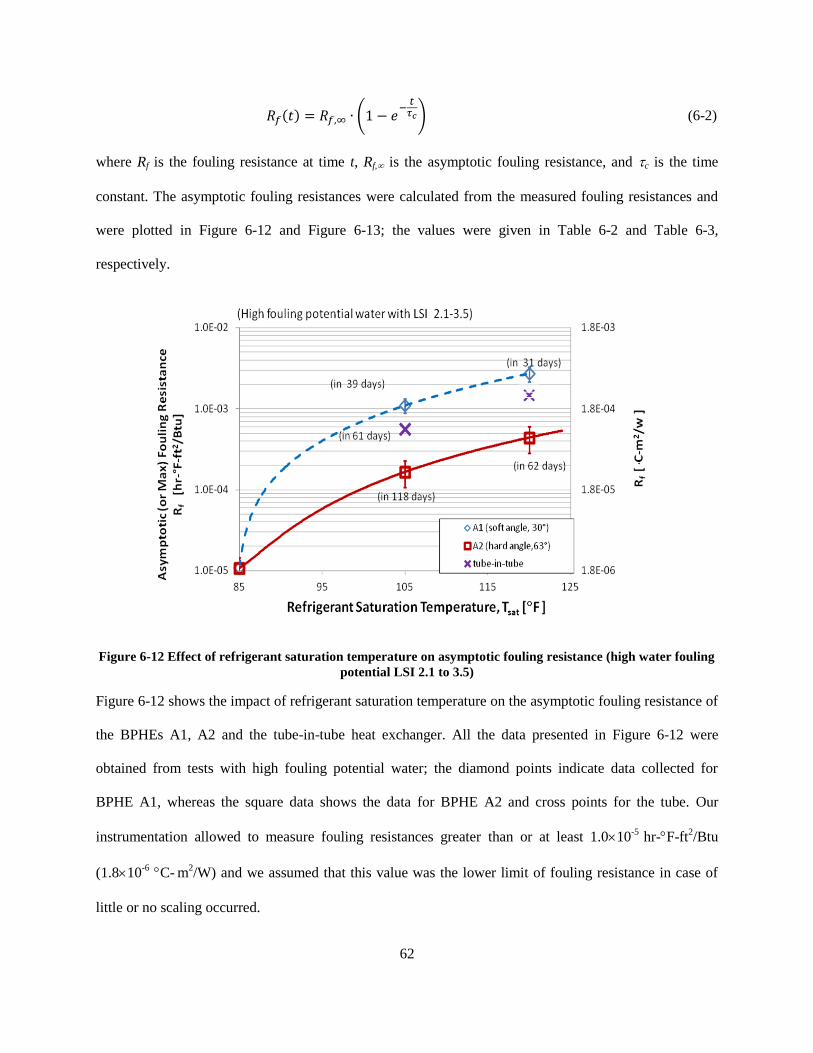
62
(6-2)
where Rf is the fouling resistance at time t, Rf, is the asymptotic fouling resistance, and c is the time
constant. The asymptotic fouling resistances were calculated from the measured fouling resistances and
were plotted in Figure 6-12 and Figure 6-13; the values were given in Table 6-2 and Table 6-3,
respectively.
Figure 6-12 Effect of refrigerant saturation temperature on asymptotic fouling resistance (high water fouling
potential LSI 2.1 to 3.5)
Figure 6-12 shows the impact of refrigerant saturation temperature on the asymptotic fouling resistance of
the BPHEs A1, A2 and the tube-in-tube heat exchanger. All the data presented in Figure 6-12 were
obtained from tests with high fouling potential water; the diamond points indicate data collected for
BPHE A1, whereas the square data shows the data for BPHE A2 and cross points for the tube. Our
instrumentation allowed to measure fouling resistances greater than or at least 1.010-5
hr-F-ft2/Btu
(1.810-6
C- m
2/W) and we assumed that this value was the lower limit of fouling resistance in case of
little or no scaling occurred.
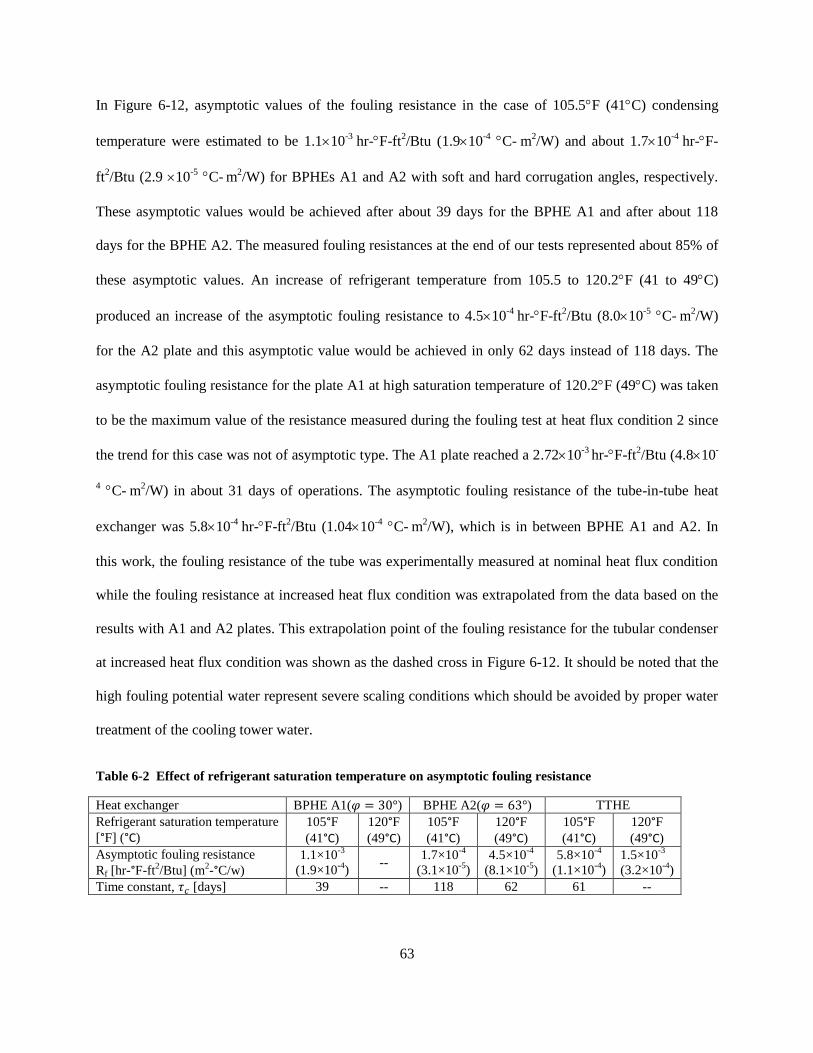
63
In Figure 6-12, asymptotic values of the fouling resistance in the case of 105.5F (41C) condensing
temperature were estimated to be 1.110-3
hr-F-ft2/Btu (1.910
-4 C-
m
2/W) and about 1.710
-4 hr-F-
ft2/Btu (2.9 10
-5 C-
m
2/W) for BPHEs A1 and A2 with soft and hard corrugation angles, respectively.
These asymptotic values would be achieved after about 39 days for the BPHE A1 and after about 118
days for the BPHE A2. The measured fouling resistances at the end of our tests represented about 85% of
these asymptotic values. An increase of refrigerant temperature from 105.5 to 120.2F (41 to 49C)
produced an increase of the asymptotic fouling resistance to 4.510-4
hr-F-ft2/Btu (8.010
-5 C-
m
2/W)
for the A2 plate and this asymptotic value would be achieved in only 62 days instead of 118 days. The
asymptotic fouling resistance for the plate A1 at high saturation temperature of 120.2F (49C) was taken
to be the maximum value of the resistance measured during the fouling test at heat flux condition 2 since
the trend for this case was not of asymptotic type. The A1 plate reached a 2.7210-3
hr-F-ft2/Btu (4.810
-
4 C-
m
2/W) in about 31 days of operations. The asymptotic fouling resistance of the tube-in-tube heat
exchanger was 5.810-4
hr-F-ft2/Btu (1.0410
-4 C-
m
2/W), which is in between BPHE A1 and A2. In
this work, the fouling resistance of the tube was experimentally measured at nominal heat flux condition
while the fouling resistance at increased heat flux condition was extrapolated from the data based on the
results with A1 and A2 plates. This extrapolation point of the fouling resistance for the tubular condenser
at increased heat flux condition was shown as the dashed cross in Figure 6-12. It should be noted that the
high fouling potential water represent severe scaling conditions which should be avoided by proper water
treatment of the cooling tower water.
Table 6-2 Effect of refrigerant saturation temperature on asymptotic fouling resistance
Heat exchanger BPHE A1( ) BPHE A2( ) TTHE
Refrigerant saturation temperature
[°F] (°C)
105°F
(41°C)
120°F
(49°C)
105°F
(41°C)
120°F
(49°C)
105°F
(41°C)
120°F
(49°C)
Asymptotic fouling resistance
Rf [hr-°F-ft2/Btu] (m
2-°C/w)
1.1×10⁻³
(1.9×10⁻⁴
) --
1.7×10⁻⁴
(3.1×10⁻⁵
)
4.5×10⁻⁴
(8.1×10⁻⁵
)
5.8×10⁻⁴
(1.1×10⁻⁴
)
1.5×10⁻³
(3.2×10⁻⁴
)
Time constant, [days] 39 -- 118 62 61 --
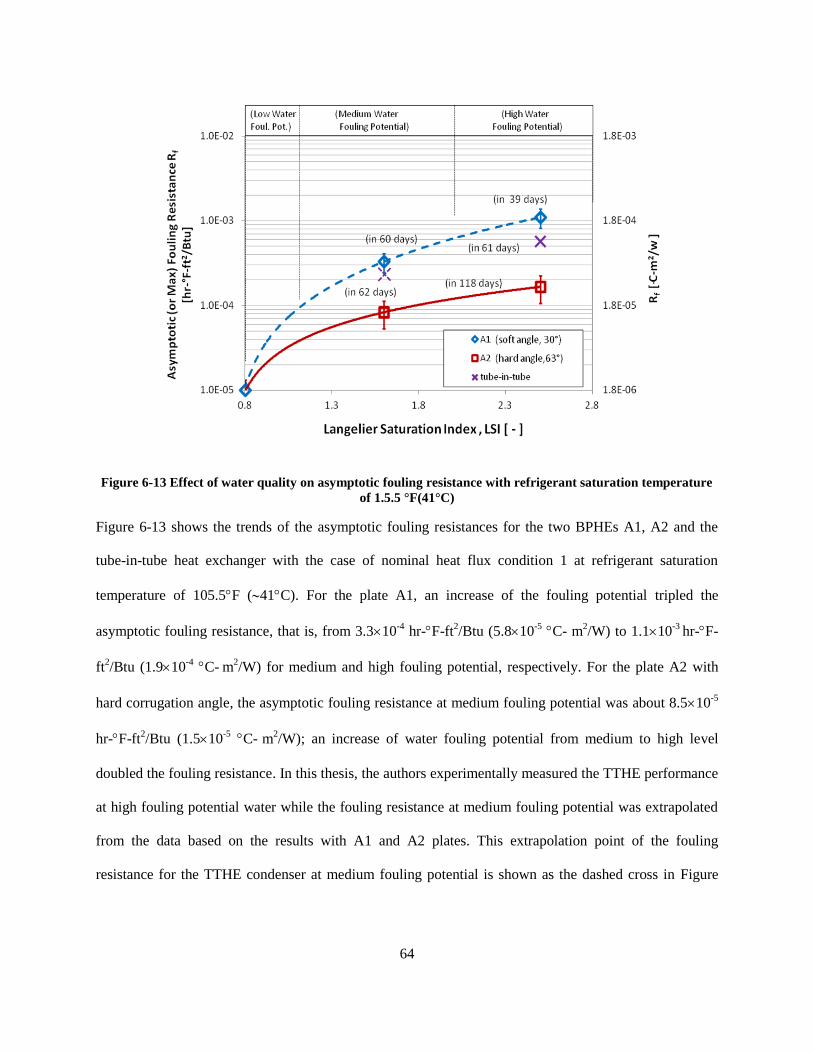
64
Figure 6-13 Effect of water quality on asymptotic fouling resistance with refrigerant saturation temperature
of 1.5.5 °F(41°C)
Figure 6-13 shows the trends of the asymptotic fouling resistances for the two BPHEs A1, A2 and the
tube-in-tube heat exchanger with the case of nominal heat flux condition 1 at refrigerant saturation
temperature of 105.5F (41C). For the plate A1, an increase of the fouling potential tripled the
asymptotic fouling resistance, that is, from 3.310-4
hr-F-ft2/Btu (5.810
-5 C- m
2/W) to 1.110
-3 hr-F-
ft2/Btu (1.910
-4 C-
m
2/W) for medium and high fouling potential, respectively. For the plate A2 with
hard corrugation angle, the asymptotic fouling resistance at medium fouling potential was about 8.510-5
hr-F-ft2/Btu (1.510
-5 C-
m
2/W); an increase of water fouling potential from medium to high level
doubled the fouling resistance. In this thesis, the authors experimentally measured the TTHE performance
at high fouling potential water while the fouling resistance at medium fouling potential was extrapolated
from the data based on the results with A1 and A2 plates. This extrapolation point of the fouling
resistance for the TTHE condenser at medium fouling potential is shown as the dashed cross in Figure
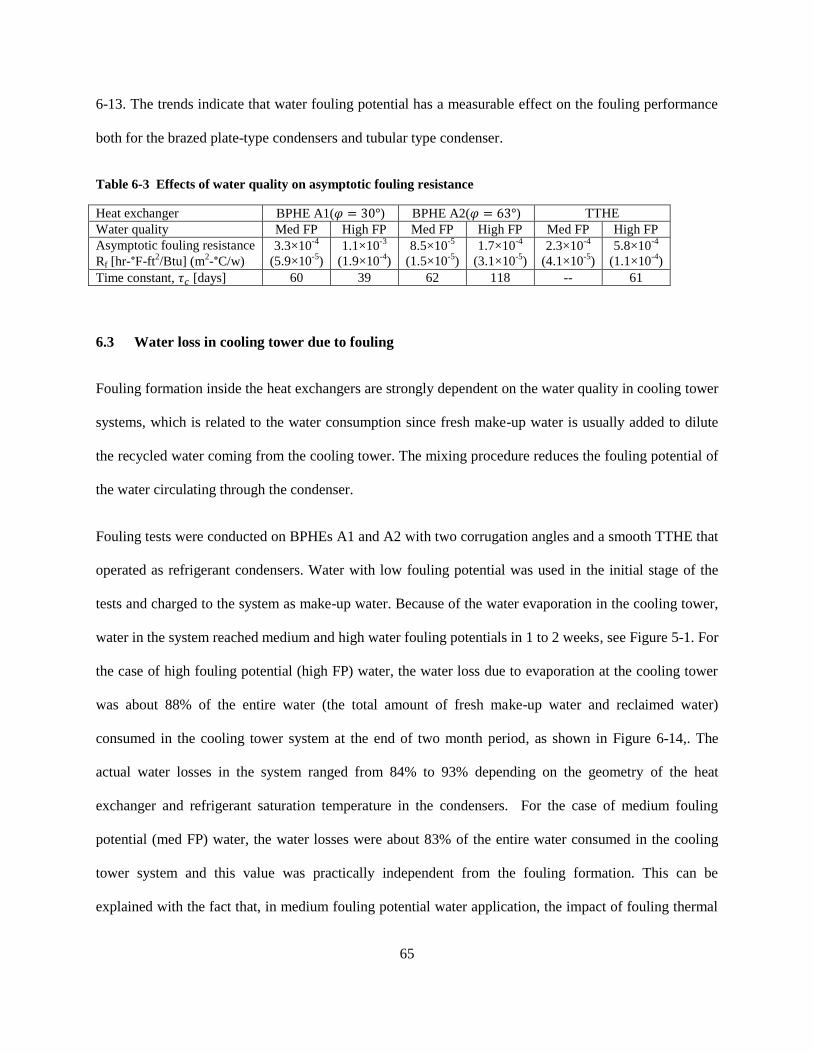
65
6-13. The trends indicate that water fouling potential has a measurable effect on the fouling performance
both for the brazed plate-type condensers and tubular type condenser.
Table 6-3 Effects of water quality on asymptotic fouling resistance
Heat exchanger BPHE A1( ) BPHE A2( ) TTHE
Water quality Med FP High FP Med FP High FP Med FP High FP
Asymptotic fouling resistance
Rf [hr-°F-ft2/Btu] (m
2-°C/w)
3.3×10⁻⁴
(5.9×10⁻⁵
)
1.1×10⁻³
(1.9×10⁻⁴
)
8.5×10⁻⁵
(1.5×10⁻⁵
)
1.7×10⁻⁴
(3.1×10⁻⁵
)
2.3×10⁻⁴
(4.1×10⁻⁵
)
5.8×10⁻⁴
(1.1×10⁻⁴
)
Time constant, [days] 60 39 62 118 -- 61
6.3 Water loss in cooling tower due to fouling
Fouling formation inside the heat exchangers are strongly dependent on the water quality in cooling tower
systems, which is related to the water consumption since fresh make-up water is usually added to dilute
the recycled water coming from the cooling tower. The mixing procedure reduces the fouling potential of
the water circulating through the condenser.
Fouling tests were conducted on BPHEs A1 and A2 with two corrugation angles and a smooth TTHE that
operated as refrigerant condensers. Water with low fouling potential was used in the initial stage of the
tests and charged to the system as make-up water. Because of the water evaporation in the cooling tower,
water in the system reached medium and high water fouling potentials in 1 to 2 weeks, see Figure 5-1. For
the case of high fouling potential (high FP) water, the water loss due to evaporation at the cooling tower
was about 88% of the entire water (the total amount of fresh make-up water and reclaimed water)
consumed in the cooling tower system at the end of two month period, as shown in Figure 6-14,. The
actual water losses in the system ranged from 84% to 93% depending on the geometry of the heat
exchanger and refrigerant saturation temperature in the condensers. For the case of medium fouling
potential (med FP) water, the water losses were about 83% of the entire water consumed in the cooling
tower system and this value was practically independent from the fouling formation. This can be
explained with the fact that, in medium fouling potential water application, the impact of fouling thermal
66
resistance on the water-side cooling capacity was not as significant as for the case of high fouling
potential water. In our tests, about 100 gallon of water were initially charged in the cooling tower system
and the evaporation rate was about 10 gal/day for medium fouling potential case and 15 gal/day for the
case of high fouling potential water. Due to evaporation in the cooling tower loop, minerals contained in
recycled water become concentrated and reached the solubility limits.
For the fouling test on a smooth TTHE condenser at high fouling potential water, due to water
evaporation in the cooling tower, the amount of Ca2+
in the water loop practically increased linearly with
time, shown in Figure 6-15. In two weeks without any water treatment, the Ca2+
concentration doubled,
and the water losses exceed 50% of the total water consumption in the system. After two months of
continuous operation, water losses due to evaporation reached about 85% of the total water consumption
and the Ca2+
concentration increased by more than 6 times. A dilution of the recycled water with more
fresh water might have relieved the fouling issues but it would have increased the fresh water usage.
Cycle of concentration provides a measure of the accumulation of dissolved minerals in the circulating
cooling water. It is defined in Eq. (6-3) and it is practically the ratio of concentration of chlorides in the
circulating water and in the make-up water (Beychok, 1952). High cycles of concentration mean high
fraction of recycled water from the cooling tower in the main stream that flows through the condenser.
(6-3)
In the present fouling experiments on BPHEs and on TTHE, in the case of condensation saturation
temperature of 105°F (41°C), the concentration cycles ranged from 4 to 7.3. An increase of condensation
temperature from 105°F to 120°F (41°C to 49°C) augmented the cycles of concentration to 14~16.1,
because the evaporation rate in the cooling tower was higher when the water temperature entering the
cooling tower increased.
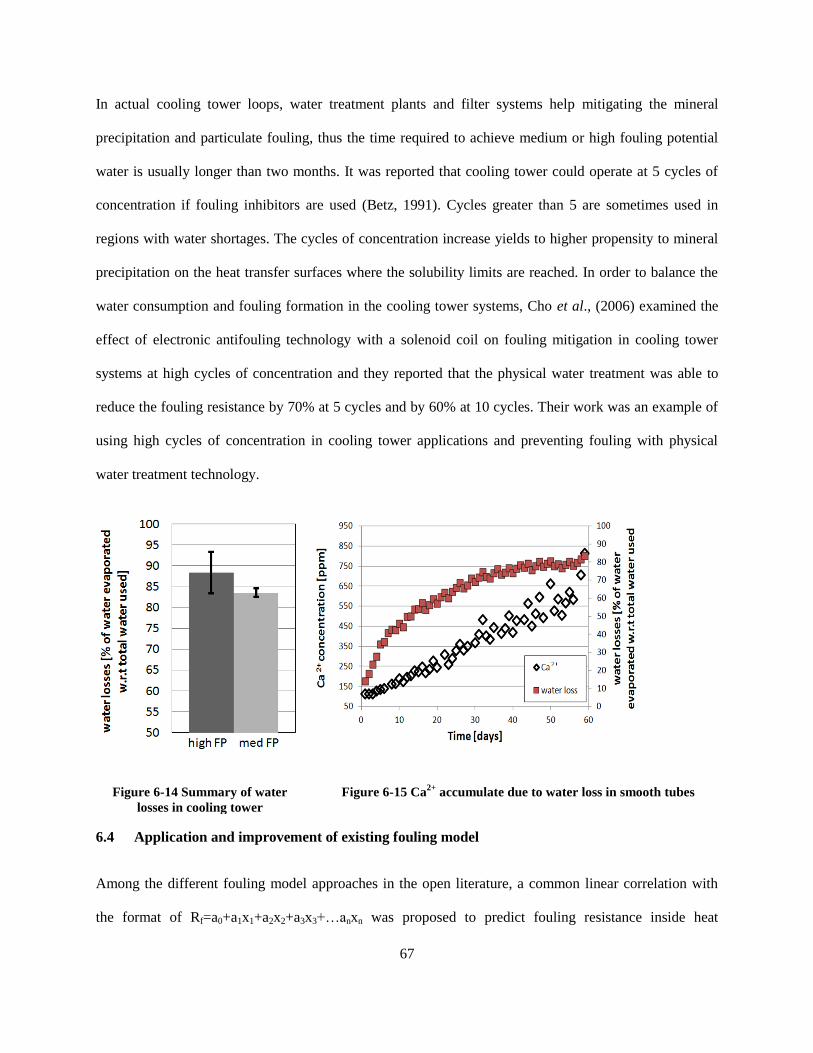
67
In actual cooling tower loops, water treatment plants and filter systems help mitigating the mineral
precipitation and particulate fouling, thus the time required to achieve medium or high fouling potential
water is usually longer than two months. It was reported that cooling tower could operate at 5 cycles of
concentration if fouling inhibitors are used (Betz, 1991). Cycles greater than 5 are sometimes used in
regions with water shortages. The cycles of concentration increase yields to higher propensity to mineral
precipitation on the heat transfer surfaces where the solubility limits are reached. In order to balance the
water consumption and fouling formation in the cooling tower systems, Cho et al., (2006) examined the
effect of electronic antifouling technology with a solenoid coil on fouling mitigation in cooling tower
systems at high cycles of concentration and they reported that the physical water treatment was able to
reduce the fouling resistance by 70% at 5 cycles and by 60% at 10 cycles. Their work was an example of
using high cycles of concentration in cooling tower applications and preventing fouling with physical
water treatment technology.
Figure 6-14 Summary of water
losses in cooling tower
Figure 6-15 Ca2+
accumulate due to water loss in smooth tubes
6.4 Application and improvement of existing fouling model
Among the different fouling model approaches in the open literature, a common linear correlation with
the format of Rf=a0+a1x1+a2x2+a3x3+…anxn was proposed to predict fouling resistance inside heat
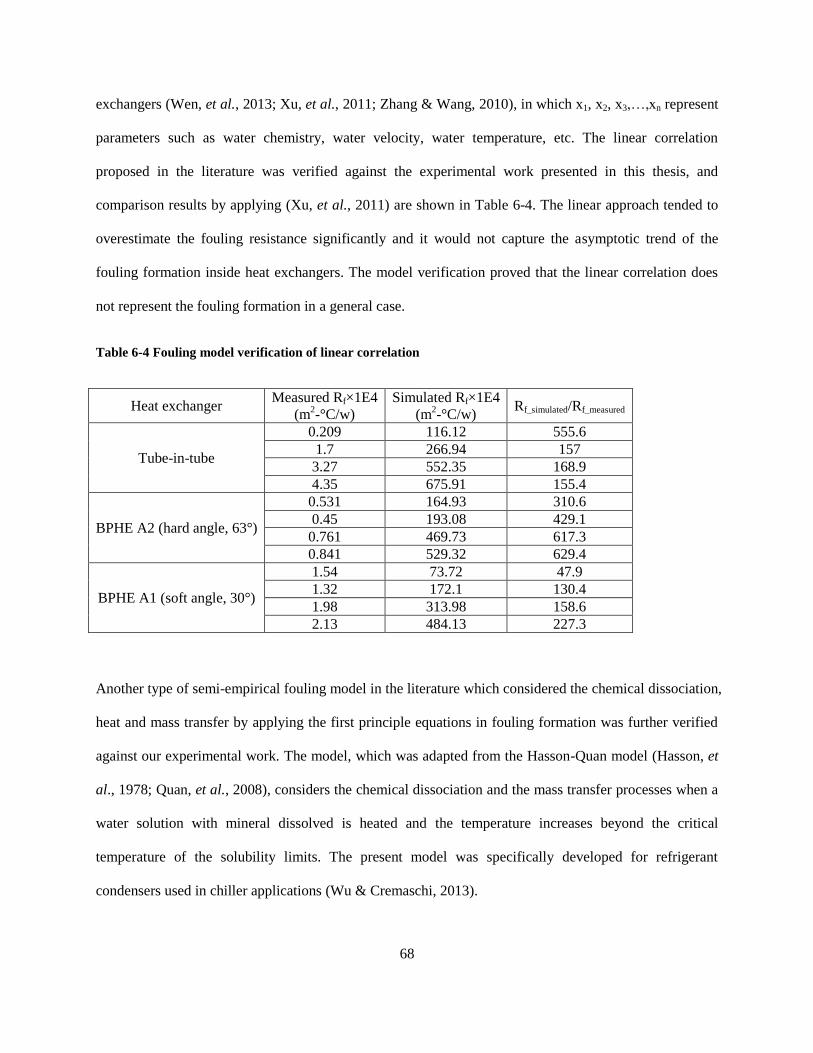
68
exchangers (Wen, et al., 2013; Xu, et al., 2011; Zhang & Wang, 2010), in which x1, x2, x3,…,xn represent
parameters such as water chemistry, water velocity, water temperature, etc. The linear correlation
proposed in the literature was verified against the experimental work presented in this thesis, and
comparison results by applying (Xu, et al., 2011) are shown in Table 6-4. The linear approach tended to
overestimate the fouling resistance significantly and it would not capture the asymptotic trend of the
fouling formation inside heat exchangers. The model verification proved that the linear correlation does
not represent the fouling formation in a general case.
Table 6-4 Fouling model verification of linear correlation
Heat exchanger Measured Rf×1E4
(m2-°C/w)
Simulated Rf×1E4
(m2-°C/w)
Rf_simulated/Rf_measured
Tube-in-tube
0.209 116.12 555.6
1.7 266.94 157
3.27 552.35 168.9
4.35 675.91 155.4
BPHE A2 (hard angle, 63°)
0.531 164.93 310.6
0.45 193.08 429.1
0.761 469.73 617.3
0.841 529.32 629.4
BPHE A1 (soft angle, 30°)
1.54 73.72 47.9
1.32 172.1 130.4
1.98 313.98 158.6
2.13 484.13 227.3
Another type of semi-empirical fouling model in the literature which considered the chemical dissociation,
heat and mass transfer by applying the first principle equations in fouling formation was further verified
against our experimental work. The model, which was adapted from the Hasson-Quan model (Hasson, et
al., 1978; Quan, et al., 2008), considers the chemical dissociation and the mass transfer processes when a
water solution with mineral dissolved is heated and the temperature increases beyond the critical
temperature of the solubility limits. The present model was specifically developed for refrigerant
condensers used in chiller applications (Wu & Cremaschi, 2013).
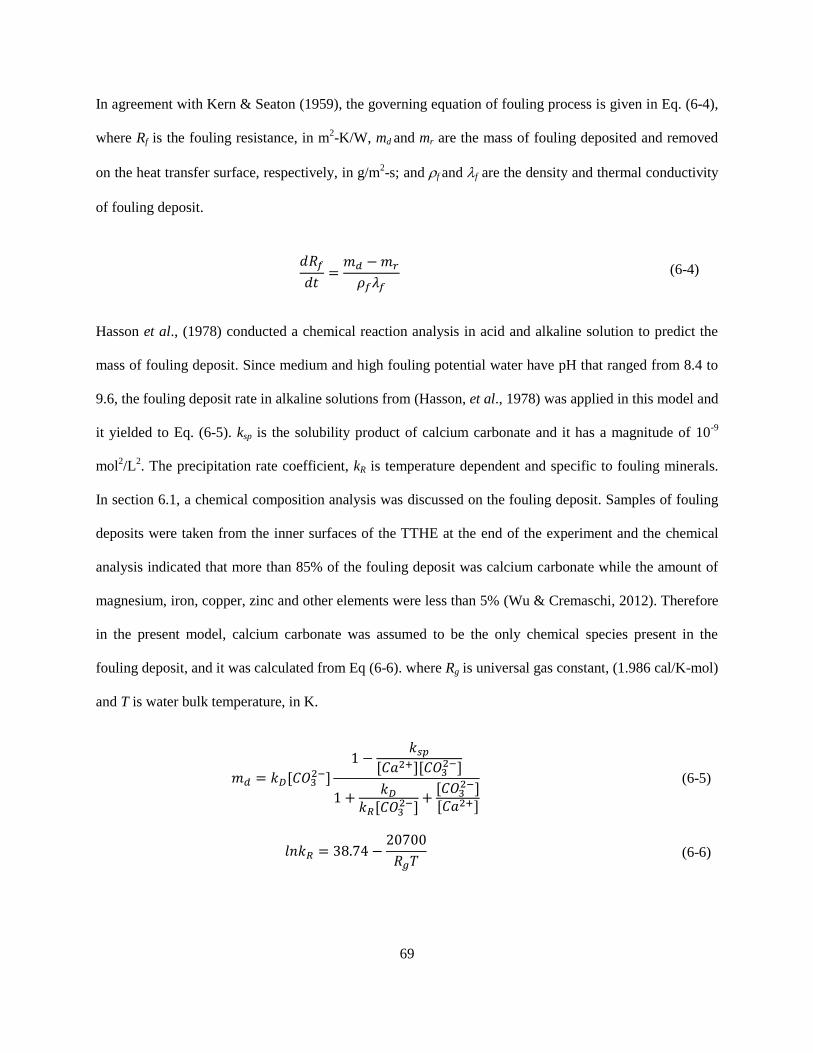
69
In agreement with Kern & Seaton (1959), the governing equation of fouling process is given in Eq. (6-4),
where Rf is the fouling resistance, in m2-K/W, md and mr are the mass of fouling deposited and removed
on the heat transfer surface, respectively, in g/m2-s; and f and f are the density and thermal conductivity
of fouling deposit.
(6-4)
Hasson et al., (1978) conducted a chemical reaction analysis in acid and alkaline solution to predict the
mass of fouling deposit. Since medium and high fouling potential water have pH that ranged from 8.4 to
9.6, the fouling deposit rate in alkaline solutions from (Hasson, et al., 1978) was applied in this model and
it yielded to Eq. (6-5). ksp is the solubility product of calcium carbonate and it has a magnitude of 10-9
mol2/L
2. The precipitation rate coefficient, kR is temperature dependent and specific to fouling minerals.
In section 6.1, a chemical composition analysis was discussed on the fouling deposit. Samples of fouling
deposits were taken from the inner surfaces of the TTHE at the end of the experiment and the chemical
analysis indicated that more than 85% of the fouling deposit was calcium carbonate while the amount of
magnesium, iron, copper, zinc and other elements were less than 5% (Wu & Cremaschi, 2012). Therefore
in the present model, calcium carbonate was assumed to be the only chemical species present in the
fouling deposit, and it was calculated from Eq (6-6). where Rg is universal gas constant, (1.986 cal/K-mol)
and T is water bulk temperature, in K.
(6-5)
(6-6)
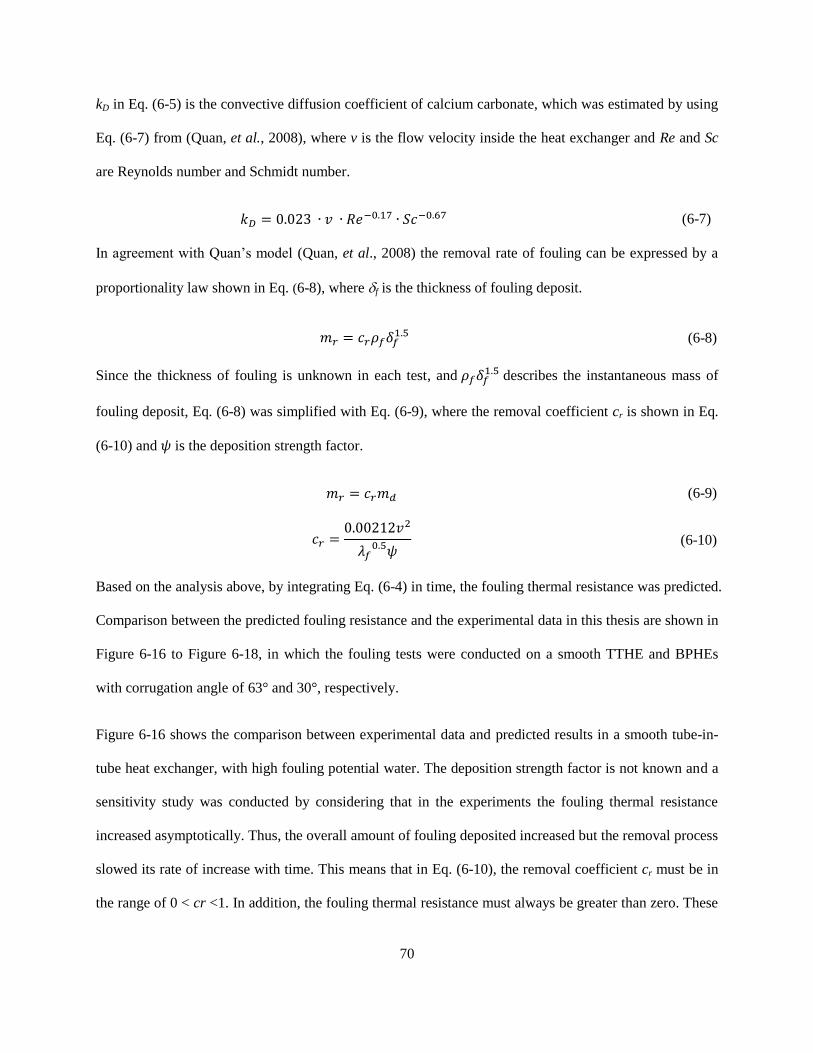
70
kD in Eq. (6-5) is the convective diffusion coefficient of calcium carbonate, which was estimated by using
Eq. (6-7) from (Quan, et al., 2008), where v is the flow velocity inside the heat exchanger and Re and Sc
are Reynolds number and Schmidt number.
(6-7)
In agreement with Quan’s model (Quan, et al., 2008) the removal rate of fouling can be expressed by a
proportionality law shown in Eq. (6-8), where f is the thickness of fouling deposit.
(6-8)
Since the thickness of fouling is unknown in each test, and describes the instantaneous mass of
fouling deposit, Eq. (6-8) was simplified with Eq. (6-9), where the removal coefficient cr is shown in Eq.
(6-10) and is the deposition strength factor.
(6-9)
(6-10)
Based on the analysis above, by integrating Eq. (6-4) in time, the fouling thermal resistance was predicted.
Comparison between the predicted fouling resistance and the experimental data in this thesis are shown in
Figure 6-16 to Figure 6-18, in which the fouling tests were conducted on a smooth TTHE and BPHEs
with corrugation angle of 63° and 30°, respectively.
Figure 6-16 shows the comparison between experimental data and predicted results in a smooth tube-in-
tube heat exchanger, with high fouling potential water. The deposition strength factor is not known and a
sensitivity study was conducted by considering that in the experiments the fouling thermal resistance
increased asymptotically. Thus, the overall amount of fouling deposited increased but the removal process
slowed its rate of increase with time. This means that in Eq. (6-10), the removal coefficient cr must be in
the range of 0 < cr <1. In addition, the fouling thermal resistance must always be greater than zero. These
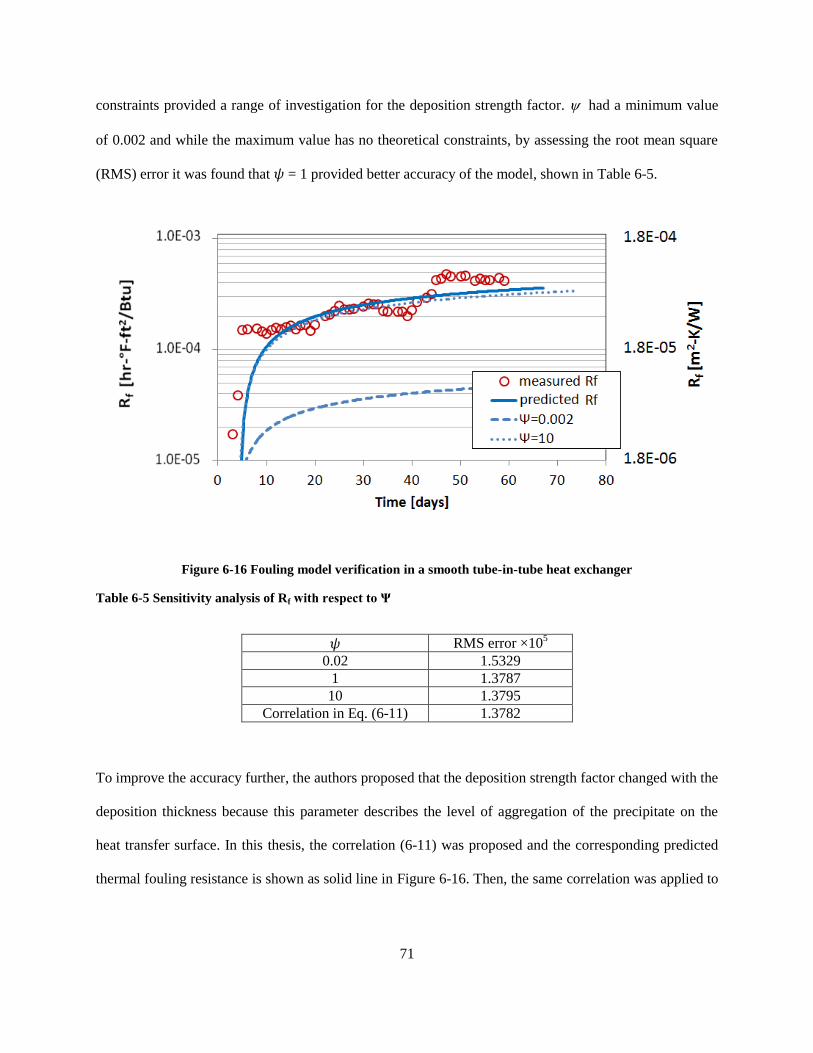
71
constraints provided a range of investigation for the deposition strength factor. had a minimum value
of 0.002 and while the maximum value has no theoretical constraints, by assessing the root mean square
(RMS) error it was found that = 1 provided better accuracy of the model, shown in Table 6-5.
Figure 6-16 Fouling model verification in a smooth tube-in-tube heat exchanger
Table 6-5 Sensitivity analysis of Rf with respect to Ψ
RMS error ×105
0.02 1.5329
1 1.3787
10 1.3795
Correlation in Eq. (6-11) 1.3782
To improve the accuracy further, the authors proposed that the deposition strength factor changed with the
deposition thickness because this parameter describes the level of aggregation of the precipitate on the
heat transfer surface. In this thesis, the correlation (6-11) was proposed and the corresponding predicted
thermal fouling resistance is shown as solid line in Figure 6-16. Then, the same correlation was applied to
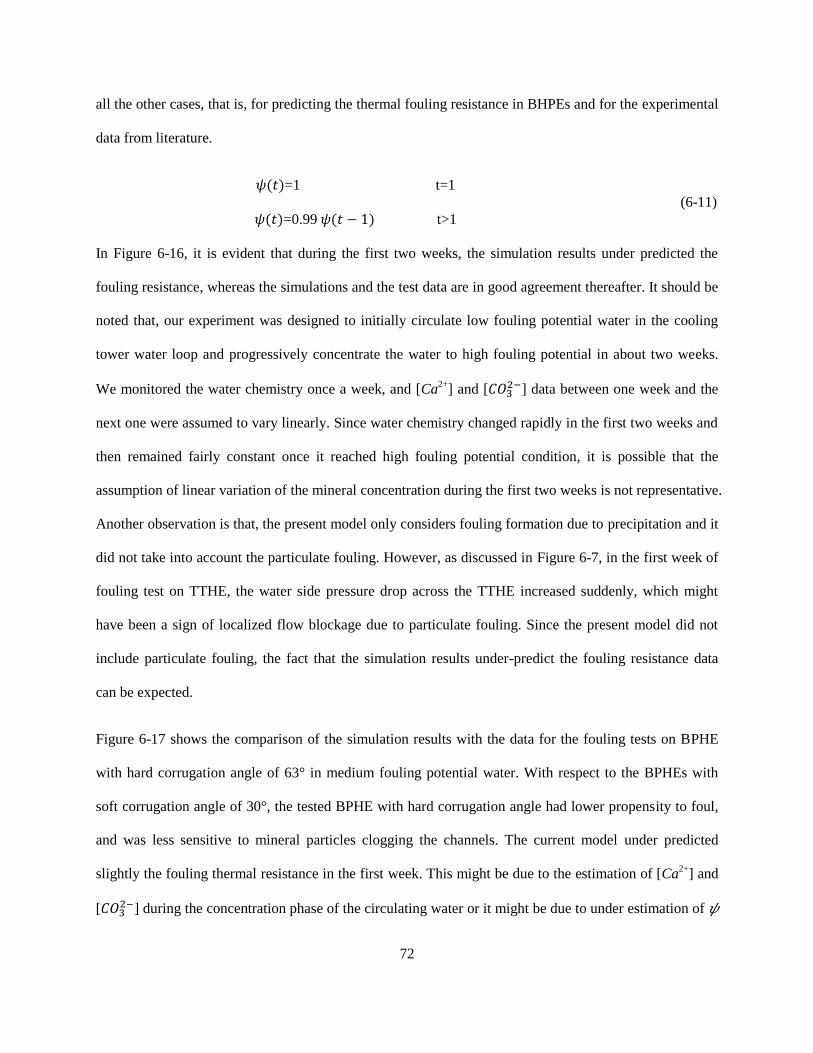
72
all the other cases, that is, for predicting the thermal fouling resistance in BHPEs and for the experimental
data from literature.
=1 t=1
=0.99 t>1
(6-11)
In Figure 6-16, it is evident that during the first two weeks, the simulation results under predicted the
fouling resistance, whereas the simulations and the test data are in good agreement thereafter. It should be
noted that, our experiment was designed to initially circulate low fouling potential water in the cooling
tower water loop and progressively concentrate the water to high fouling potential in about two weeks.
We monitored the water chemistry once a week, and [Ca2+
] and [ ] data between one week and the
next one were assumed to vary linearly. Since water chemistry changed rapidly in the first two weeks and
then remained fairly constant once it reached high fouling potential condition, it is possible that the
assumption of linear variation of the mineral concentration during the first two weeks is not representative.
Another observation is that, the present model only considers fouling formation due to precipitation and it
did not take into account the particulate fouling. However, as discussed in Figure 6-7, in the first week of
fouling test on TTHE, the water side pressure drop across the TTHE increased suddenly, which might
have been a sign of localized flow blockage due to particulate fouling. Since the present model did not
include particulate fouling, the fact that the simulation results under-predict the fouling resistance data
can be expected.
Figure 6-17 shows the comparison of the simulation results with the data for the fouling tests on BPHE
with hard corrugation angle of 63° in medium fouling potential water. With respect to the BPHEs with
soft corrugation angle of 30°, the tested BPHE with hard corrugation angle had lower propensity to foul,
and was less sensitive to mineral particles clogging the channels. The current model under predicted
slightly the fouling thermal resistance in the first week. This might be due to the estimation of [Ca2+
] and
[ ] during the concentration phase of the circulating water or it might be due to under estimation of
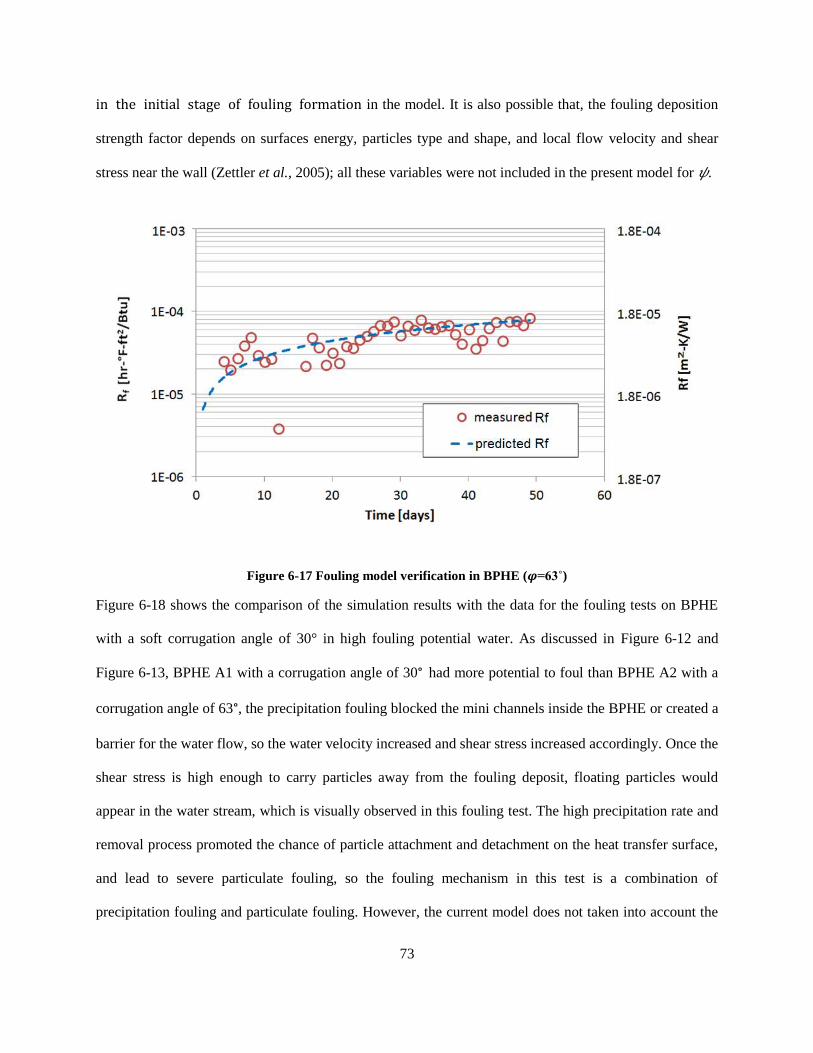
73
in the initial stage of fouling formation in the model. It is also possible that, the fouling deposition
strength factor depends on surfaces energy, particles type and shape, and local flow velocity and shear
stress near the wall (Zettler et al., 2005); all these variables were not included in the present model for .
Figure 6-17 Fouling model verification in BPHE ( =63˚)
Figure 6-18 shows the comparison of the simulation results with the data for the fouling tests on BPHE
with a soft corrugation angle of 30° in high fouling potential water. As discussed in Figure 6-12 and
Figure 6-13, BPHE A1 with a corrugation angle of 30° had more potential to foul than BPHE A2 with a
corrugation angle of 63°, the precipitation fouling blocked the mini channels inside the BPHE or created a
barrier for the water flow, so the water velocity increased and shear stress increased accordingly. Once the
shear stress is high enough to carry particles away from the fouling deposit, floating particles would
appear in the water stream, which is visually observed in this fouling test. The high precipitation rate and
removal process promoted the chance of particle attachment and detachment on the heat transfer surface,
and lead to severe particulate fouling, so the fouling mechanism in this test is a combination of
precipitation fouling and particulate fouling. However, the current model does not taken into account the
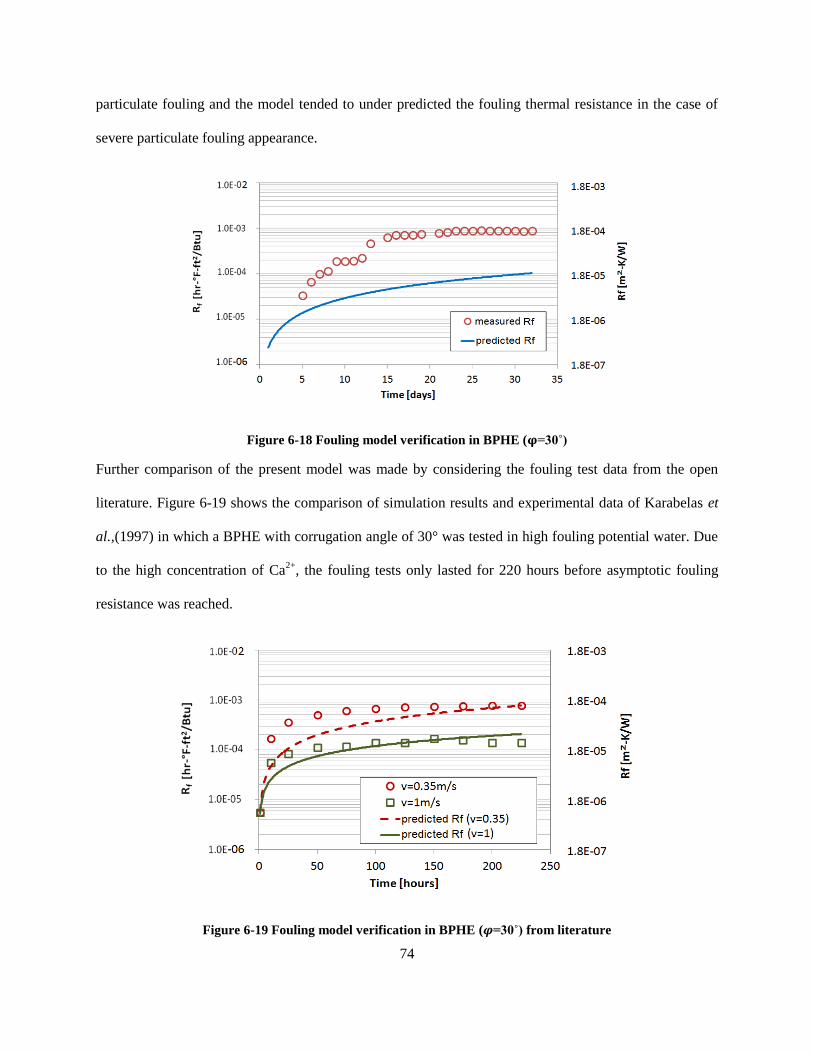
74
particulate fouling and the model tended to under predicted the fouling thermal resistance in the case of
severe particulate fouling appearance.
Figure 6-18 Fouling model verification in BPHE ( =30˚)
Further comparison of the present model was made by considering the fouling test data from the open
literature. Figure 6-19 shows the comparison of simulation results and experimental data of Karabelas et
al.,(1997) in which a BPHE with corrugation angle of 30° was tested in high fouling potential water. Due
to the high concentration of Ca2+
, the fouling tests only lasted for 220 hours before asymptotic fouling
resistance was reached.
Figure 6-19 Fouling model verification in BPHE ( =30˚) from literature
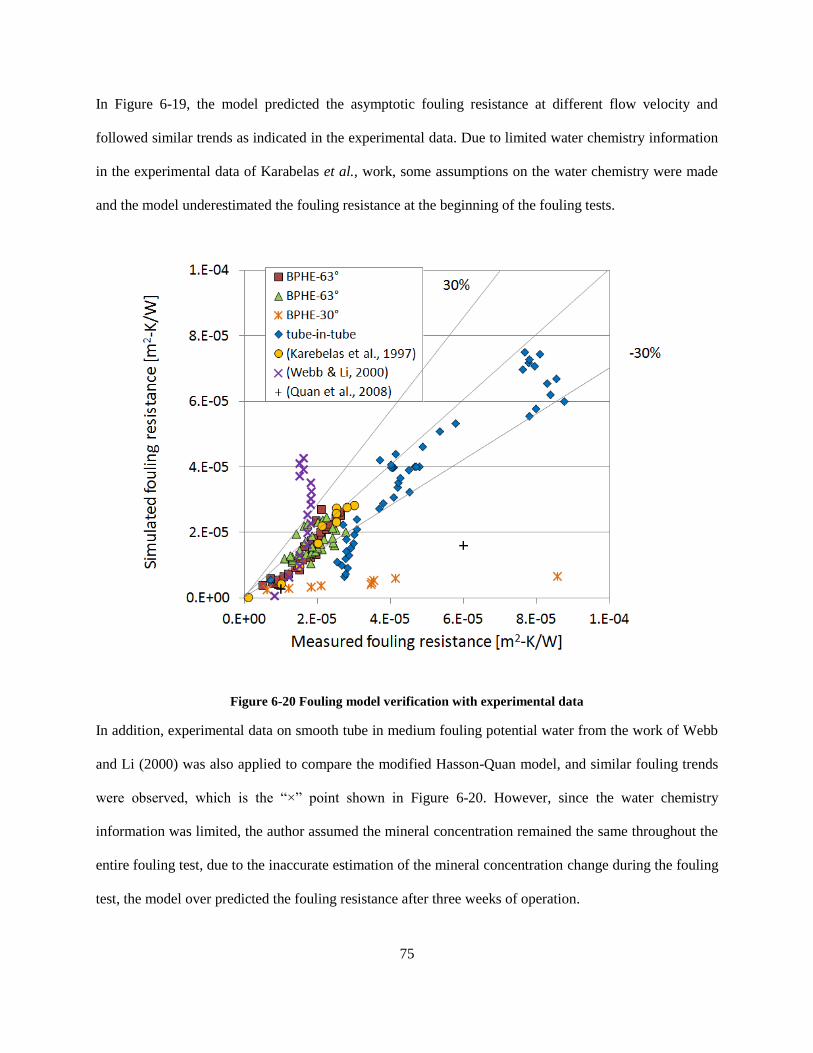
75
In Figure 6-19, the model predicted the asymptotic fouling resistance at different flow velocity and
followed similar trends as indicated in the experimental data. Due to limited water chemistry information
in the experimental data of Karabelas et al., work, some assumptions on the water chemistry were made
and the model underestimated the fouling resistance at the beginning of the fouling tests.
Figure 6-20 Fouling model verification with experimental data
In addition, experimental data on smooth tube in medium fouling potential water from the work of Webb
and Li (2000) was also applied to compare the modified Hasson-Quan model, and similar fouling trends
were observed, which is the “×” point shown in Figure 6-20. However, since the water chemistry
information was limited, the author assumed the mineral concentration remained the same throughout the
entire fouling test, due to the inaccurate estimation of the mineral concentration change during the fouling
test, the model over predicted the fouling resistance after three weeks of operation.
76
The experimental work from (Quan, et al., 2008) was finally included in the present comparison of the
predicted thermal fouling resistance by the semi-empirical model with data from the literature. The tested
fluid in Quan et al. had lower pH values and the fouling deposition model based on alkaline solution in
the present model tended to under estimate the fouling resistance by 30% to 50% in the first 10 hours and
over predicted the fouling resistance thereafter. The overall comparison between the simulation results of
the present model and the experiment data from the experimental work in this thesis and from the
literature is summarized in Figure 6-20. The present model predicted the fouling thermal resistance within
30% error in average. It generally under-predicted the fouling thermal resistance at the beginning stage of
fouling formation and in the case of severe particulate fouling. More detailed information on water
chemistry, type of mineral precipitation and local flow velocity near the wall of the heat exchangers might
help to improve the accuracy of the present model and further work is needed to incorporate particulate
fouling approach and more enhanced geometry into this model.
77
CHAPTER VII
7 CONCLUSION
7.1 Conclusion from this thesis work
Brazed plate heat exchanges (BPHEs) and tube-in-tube heat exchangers (TTHEs) are commonly used in
the refrigeration, air conditioning, and food industry as refrigerant-to-water condensers and they often
suffer from severe fouling issues.
In this thesis, two BPHEs with different corrugation angles and a smooth TTHE with the same heat
transfer area were experimentally investigated in a small scale 3 ton cooling tower system operating in
controlled environmental conditions in a laboratory. Their thermal and hydraulic performance in
fouling operating conditions was compared under similar operating conditions. The following
conclusions could be drawn from the experimental work discussed in this thesis.
i. Fouling resistance in BPHEs varies with different corrugation angles and this was due to
different local velocity and internal turbulence intensity of the water stream inside the
plates. Under the same test condition, the fouling resistance in TTHE was higher than
BPHE with a hard corrugation angle but lower than BPHEs with a soft corrugation angle.
The hydraulic performance of TTHE is more close to BPHEs with a hard corrugation angle
of 63°.
ii. Fouling deposits on the TTHE was sampled and chemical analysis revealed that more than
85% of the fouling was calcium carbonate while the amount of iron, copper and zinc were
within 5%. The mineral precipitation mass flux was practically the same for the entire
78
system and the analysis provided an order of magnitude of the mineral precipitation mass
flux for the case of high water fouling potential.
iii. The effects of refrigerant condensation were experimentally investigated and asymptotic
values of the fouling resistance were determined. Two refrigerant saturation temperatures
of 105.5 and 120.2F (41 and 49C) were set in extensive controlled laboratory fouling
experiments and they were representative of two heat flux conditions across the plates of
the brazed-plate type condensers. Both heat flux and wall plate surface temperature were
responsible for mineral scaling and particulate fouling of the BPHEs. Soft corrugation
angles (30°) of the plates were quite sensitive to these factors and an increase of the
condensation temperature critically impaired the operation. For BPHE with hard
corrugation angles (63°), the fouling resistance was still a function of refrigerant saturation
temperature but the degradation of the heat flux was only a few percents. We observed that
the fouling of the BPHEs affected the waterside pressure drops and might cause a severe
flow blockage of the mini channels formed within the plate stacked inside the heat
exchanger. Measured pressure drops in fouled conditions were from 10% to 11 times
higher than the corresponding pressure drops in clean conditions.
iv. Water quality, measured by the Langelier saturation index to define a fouling potential of
the cooling tower water, had a measurable effect on the fouling resistance of the BPHEs.
High fouling potential water, which is representative of strong to severe scaling conditions,
increased the asymptotic fouling resistance by as much as three times compared to
asymptotic fouling resistance derived for the cases of medium fouling potential of the
cooling tower water.
Fouling models in the literature were studied and verified against the experimental work in this thesis.
One common approach to predict fouling formation proposed in literature was applying linear
correlation with the format of Rf=a0+a1x1+a2x2+a3x3+…+anxn, in which x1, x2, x3… represent water
79
chemistry information, water temperature, water velocity, etc. The model validation proved that this
type of linear correlation does not represent fouling formation inside heat exchangers in the general
case.
A semi-empirical model for the species dissociation and mineral precipitation on the heat transfer
surfaces in the literature was further verified against the experimental work in this thesis as well as in
the literature. Since mineral solubility varies according to the pH of the solution, the chemical reaction
in the fouling model needs to be properly considered. Information on the type of mineral precipitation
and local flow velocity near the internal walls of the heat exchanger are keys to obtain an accurate
prediction on fouling resistance, thus this information needs to be intensively monitored, documented,
and reported in future fouling experiments.
Deposition strength factor is a parameter in computing the fouling removal rates in the present fouling
model. Very limited work exists in the literature and this parameter was estimated from one test in the
present work. By applying the same fouling deposition strength factor to all the other tests in this thesis
as well as in the literature, the semi-empirical model would be able to predict the fouling thermal
resistance with an average error of 30%. The present model can be considered simple but accurate
enough for engineering application. However, this model was not verified against more enhanced
geometries in tubular heat exchangers, and it tended to under estimate the fouling resistance in the case
of severe particulate fouling since it did not include particulate fouling approach in fouling formation,
thus these factors should be incorporated into the model in future work.
7.2 Recommendations for future work
During the fouling tests in this thesis work, floating particles were visually observed in the cooling
tower water loop. And the author speculated that the sudden increase in the measured fouling resistance
and pressure drop is due to severe particulate fouling and particle blockage inside the mini channels. In
order to verify this speculation, we can measure the size of the floating particles in the water stream,
80
and inject particles with similar size into low fouling potential water for future fouling studies. Since
slight or no precipitation fouling is expected in low fouling potential water, if the sudden increase in
fouling resistance and pressure drop could be replicated, the speculation would be verified. In addition,
for the test conducted on BPHEs with a hard corrugation angle of 63° with high fouling potential water,
a lot of scattered data was observed in the pressure drop for the first 20 days of operation, and some of
the pressure drop data was even lower than the initial value. The author speculated that it might be due
to the high uncertainty in the measurement or due to particle contamination coming from the rest of the
test set up at the beginning of the fouling test. Thus, its measured pressure drop in clean conditions
might have been a worst case estimate. For future reference, pressure drop measurement by applying a
differential pressure transducer with a smaller working range and better accuracy might help to confirm
this speculation.
Based on the experiences with the current fouling tests and results, some recommendations on the
experimental procedures are proposed. On the one hand, the procedure of fouling deposition mass flux
measurement needs to be improved. By assessing the amount of fouling deposit on the surface of the
cap located at the end of the smooth tube, the fouling precipitation mass flux inside the test heat
exchanger was estimated in this thesis. However, the cap is not heated up by refrigerant directly; the
fouling precipitation rate on the cap could be lower than that inside the heat exchanger. In future work,
it is suggested to weigh the test heat exchanger, water pumps, heaters, water tanks, copper pipes and
other necessary components in the cooling tower water loop before and after the fouling tests to
determine the amount of fouling deposition in each component.
On the other hand, more intensive monitor on the mineral concentration contained in the water is
required. During the fouling tests conducted in this thesis work, water was sample once a week to
measure the change of mineral concentration, and this information was applied as input values in
fouling model verification. Particularly, the mineral concentration change from one week to the next
81
was assumed to be linear and this assumption is not accurate enough in fouling resistance prediction. So,
it is recommended that the measurement of mineral concentration in future fouling tests should be more
intensive and the change of mineral concentration during the fouling tests needs to be reported together
with the data measurement.
In this thesis, LSI is applied to evaluate water fouling potential, which is a function of total dissolved
solid, water temperature, concentration of calcium ions and alkalinity. An observation was made during
the fouling tests: inside the cooling tower, due to aeration effect, more carbon dioxide was introduced
and the concentration of carbonate ions increased, leading to a localized increase in the fouling
deposition. However, the quantification of the carbonate concentration was not included in the current
water quality evaluation, and needs to be incorporated in the future work. Another short coming of LSI
is that, it uses total dissolved solid to represent the total amount of elemental ions dissolved in the water
solution instead of referring to the specific ions. If the LSI can be more specific to the involving ions, it
would be helpful to determine the corresponding anti-fouling agent, such as phosphate in the case of
calcium precipitation. In addition, water with and without corresponding anti-fouling agents could be
applied as control groups for future fouling tests to investigate the effect of fouling inhibitors.
Researchers proposed that the precipitation fouling has an induction period of 3-4 days, in which crystal
nucleation sites start to establish before mineral precipitation (Webb & Li, 2000; Zan, et al., 2009). And
the induction period is affected by the roughness of the surface (Hasson, 1997). Since the fouling
mechanism in the current work is a combination of precipitation and particulate fouling, no apparent
effects of induction period was observed in the fouling curve. In future fouling studies, the employment
of filtration system, might help to isolate precipitation fouling and particulate fouling; applying
different surface materials with and without coating would help determine the role of the surface on the
precipitation process.

82
Counter flow is commonly applied inside heat exchangers in industry to increase heat transfer rate.
However, the promotion of heat transfer rate would lead to a higher water temperature, which
ultimately leads to more fouling deposition. In future fouling studies, parallel flow can be included in
the control group, to seek a balance in heat transfer rate and fouling formation inside the heat
exchangers.
83
REFERENCE
AHRI. 1997. AHRI Guideline E - Fouling Factors: A Survey of Their Application in Today's Air Conditioning and Refrigeration Industry. Arlington, VA, USA: Air-Conditioning, Heating and Refrigeration Institute.
AHRI. 2007. AHRI Standard 450 - Performance rating of water-cooled refrigerant condensers. Arlington, VA, United States.
Al-Rawajfeh, A. E., & Al-Shamaileh, E. M., 2007. Assessment of tap water resources quality and its potential of scale formation and corrosivity in Tafila Province, South Jordan. Desalination, 206(1-3), 322-332.
Andritsos, N., & Karabelas, A. J., 2003. Calcium carbonate scaling in a plate heat exchanger in the presence of particles. International Journal of Heat and Mass Transfer, 46(Compendex), 4613-4627.
ASHRAE. 2007. 1345-RFP, Waterside fouling performance of brazed-plate type condensers in cooling tower applications - Request for Proposal: ASHRAE.
Awad, M. M., Gad, H. E., & Yousef, A., 2009. Effect of surface temperature on particulate and crystalline fouling. In: Proceedings of 13th Int. Water Technology Conference. vol. 1, Hurghada, Egypt, 1431-1442.
Ayub, Z. H., 2003. Plate heat exchanger literature survey and new heat transfer and pressure drop correlations for refrigerant evaporators. Heat Transfer Engineering, v(24), 3-16.
Bansal, B., & Mueller-Steinhagen, H., 1993. Crystallization fouling in plate heat exchangers. Journal of Heat Transfer, Transactions ASME, v(115), 584-591.
Bansal, B., Muller-Steinhagen, H., & Chen, X. D., 1997. Effect of suspended particles on crystallization fouling in plate heat exchangers. Journal of Heat Transfer, 119(Compendex), 568-574.
Bansal, B., Muller-Steinhagen, H., & Chen, X. D., 2001. Comparison of crystallization fouling in plate and double-pipe heat exchangers. Heat Transfer Engineering, v(22), 13-25.
Benzinger, W., Brandner, J. J., Schygulla, U., & Schubert, K., 2007. Influence of different surface materials on the fouling process in a microstructured heat exchanger under laminar regime. In: Proceedings of Heat Exchanger Fouling and Cleaning conference, July 1-6, 2007, Tomar, Portugal.
Betz. 1991. Handbook of industrial water conditioning, 9th ed. Trevose, PA, USA. Beychok, M. R., 1952. How to calculate cooling tower control variables. Petroleum Processing, v(7),
1452-1456. Brahi, F., Augustin, W., & Bohnet, M., 2003. Numerical simulation of the fouling on structured heat
transfer surfaces. In: Proceedings of Heat Exchanger Fouling and Cleaning conference, June 5-10, 2005, Kloster Irsee, Germany.
Chamra, L. M., 2007. Waterside Fouling Inside Smooth and Augmented Copper-Alloy Condenser Tubes in Cooling Tower Water Applications (1205-TRP): Mississippi State University.
Chamra, L. M., & Webb, R. L., 1993. Effect of particle size and size distribution on particulate fouling in enhanced tubes. Journal of Enhanced Heat Transfer, 1(1), 65-75.
Chamra, L. M., & Webb, R. L., 1994. Modeling liquid-side particulate fouling in enhanced tubes. International Journal of Heat and Mass Transfer, v(37), 571-579.
Cho, Y. I., Kim, W. T., & Cho, D., 2006. Fouling mitigation in a heat exchanger: High cycles of concentration for a cooling-tower application. Experimental Heat Transfer, 19(2), 113-128.
84
Cho, Y. I., Lee, S., & Kim, W., 2003. Physical water treatment for the mitigation of mineral fouling in cooling-tower water applications. In: Proceedings of 2003 ASHRAE Winter Meeting Technical paper, January 26, 2003 - January 29, 2003, Chicago, IL, United states.
Cremaschi, L., Barve, A., & Wu, X., 2012. Effect of condensation temperature and water quality on fouling of brazed-plate heat exchangers. ASHRAE Transactions, 118(PART 1), 1086-1100.
Cremaschi, L., Spitler, J. D., Lim, E., & Ramesh, A., 2011. Waterside fouling performance in brazed-plate-type condensers for cooling tower applications. HVAC & R Research, 17(2), 198-217.
Flynn, D. J., & Nalco, C. (2009). The Nalco water handbook. from http://www.knovel.com/knovel2/Toc.jsp?BookID=2799
Focke, W. W., Zachariades, J., & Olivier, I., 1985. Effect of the corrugation inclination angle on the thermohydraulic performance of plate heat exchangers. International Journal of Heat and Mass Transfer, v(28), 1469-1479.
Geddert, T., Bialuch, I., Augustin, W., & Scholl, S., 2009. Extending the induction period of crystallization fouling through surface coating. Heat Transfer Engineering, 30(10-11), 868-875.
Grace, S. 2007. The effect of orthophosphate as a copper corrosion inhibitor in high alkalinity drinking water systems (No. AFIT/GES/ENV/07-M2). . Air Force Inst of Tech Wright-Patterson AFB OH School of Engineering and Management.
Grandgeorge, S., Jallut, C., & Thonon, B., 1998. Particulate fouling of corrugated plate heat exchangers. Global kinetic and equilibrium studies. Chemical Engineering Science, 53(17), 3050-3071.
Haider, S. I., Webb, R. L., & Meitz, A. K., 1991. Survey of water quality and its effect on fouling in flooded water chiller evaporators. In: Proceedings of ASHRAE Winter Meeting - Technical Papers, January 19, 1991 - January 23, 1991, New York, NY, USA.
Hasson, D., 1997. Progress in precipitation fouling research -- a review. In: Proceedings of International Conference of Fouling Mitigation of Inudstrial Heat-Exchang Equipment, Begell House.
Hasson, D., Sherman, H., & Biton, M., 1978. Prediction of Calcium Carbonate Scaling Rates. v(2), 193-199.
Hasson, D., & Zahavi, J., 1970. Mechanism of Calcium Sulfate Scale Deposition on Heat-Tranfer Surfaces. v(9), 1-10.
Izadi, M. 2011. Experimental and numerical investigation of fouling in heat exchangers. Clarkson University.
Karabelas, A. J., Yiantsios, S. G., Thonon, B., & Grillot, J. M., 1997. Liquid-side fouling of heat exchangers. An integrated R D approach for conventional and novel designs. Applied Thermal Engineering, v(17), 727-737.
Kern, D. Q., & Seaton, R. E., 1959. A theoretical analysis of thermal surface fouling. British Chemical Engineering, 4(5), 258-262.
Kim, N.-H., & Webb, R. L., 1991. Particulate fouling of water in tubes having a two-dimensional roughness geometry. International Journal of Heat and Mass Transfer, 34(11), 2727-2738.
Knudsen, J. G., & Story, M., 1978. Effect of Heat Transfer Surface Temperature on the Scaling Behavior of Simulated Cooling Tower Water. AIChE Symposium Series, v(74), 25-30.
Langelier, W. F., 1936. The analytical control of anti-corrosion water treatment. Journal of American Water Works Association, 28(10), 1500-1521.
Lim, E. 2010. A preliminary investigation of fouling in brazed plate heat exchangers. Unpublished Master Thesis, Oklahoma State University, Stillwater, Oklahoma, US.
Luan, Z., Zhang, G., Tian, M., & Fan, M., 2008. Flow resistance and heat transfer characteristics of a new-type plate heat exchanger. Journal of Hydrodynamics, 20, 524-529.
85
Morse, R. W., & Knudsen, J. G., 1977. Effect of alkalinity on the scaling of simulated cooling tower water. Canadian Journal of Chemical Engineering, v(55), 272-278.
Muller-Steinhagen, H. M., & Branch, C. A., 1988. Influence of thermal boundary conditions on calcium carbonate fouling in double pipe heat exchangers. Chemical engineering and processing, v 24, 65-73.
Mwaba, M. G., Golriz, M. R., & Gu, J., 2006a. A semi-empirical correlation for crystallization fouling on heat exchange surfaces. Applied Thermal Engineering, 26(4), 440-447.
Mwaba, M. G., Rindt, C. C. M., Van Steenhoven, A. A., & Vorstman, M. A. G., 2006b. Validated numerical analysis of CaSO4 fouling. [Jour]. Heat Transfer Engineering, 27(7), 50-62.
Noda, S., Saito, T., Miya, K., Furukawa, S., Clarke, S. M., & Wilson, D. I., 2013. The influence of phosphate on calcium carbonate formation in hard water. In: Proceedings of 2013 Heat Exchanger Fouling and Cleaning Conference, June 09- June 16, 2013, Budapest, Hungary.
Ojamiemi, U., Manninen, M., Pattikangas, T., & Riihimaki, M., 2013. Effects of turbulence and thermophoresis on particulate fouling in heat exchangers modelled with CFD. In: Proceedings of 2013 Heat Exchanger Fouling and Cleaning Conference, June 09- June 16, 2013, Budapest, Hungary.
Palm, B., & Claesson, J., 2006. Plate heat exchangers: Calculation methods for singleand two-phase flow. In: Proceedings of.
Pearson. 2003. Basic Water Treatment Training Materail. Goldsboro, NC: Southeastern Laboratory, Inc. Quan, Z. H., Chen, Y. C., & Ma, C. F., 2008. Heat mass transfer model of fouling process of calcium
carbonate on heat transfer surface. Science in China Series E-Technological Sciences, 51(7), 882-889.
Ramesh, A. 2010. An experimental facility to measure fouling resistance in condensers. Unpublished Master Thesis, Oklahoma State University, Stillwater, OK, US.
Rother, H. J., Kuron, D., & Storp, S., 1985. Comparative investigations of corrosion inhibitors for copper. In: Proceedings of 6th European Symposium on Corrosion Inhibitors, 133rd Manifestation of the European Federation of Corrosion, Proceedings., Ferrara, Italy.
Somerscales, E. F. C., 1990. Fouling of heat transfer surfaces: an historical review. Heat Transfer Engineering, v(11), 19-36.
Stasiek, J., Collins, M. W., Ciofalo, M., & Chew, P. E., 1996. Investigation of flow and heat transfer in corrugated passages—I. Experimental results. International Journal of Heat and Mass Transfer, 39(1), 149-164.
Taborek, J., Aoki, T., Ritter, R. B., Palen, J. W., & Knudsen, J. G., 1972a. Fouling. The major unresolved problem in heat transfer. Chemical Engineering Progress, 68(Compendex), 59-67.
Taborek, J., Aoki, T., Ritter, R. B., Palen, J. W., & Knudsen, J. G., 1972b. Predictive methods for fouling behavior. Chemical Engineering progress. , 68(7), 69-78.
Taylor, B. N., & Kuyatt, C. E., 1994. Guidelines for evaluating and expressing the uncertainty of NIST measurements results. Washington, D. C.: National Institute of Standards and Technology.
TEMA. 2007. TEMA Standards 9th Edition - Tubular Exchanger Manufacturers Association, Recommended Good Practice - T-2 Fouling. Tarrytown, NY: TEMA.
Thonon, B., Grandgeorge, S., & Jallut, C., 1999. Effect of geometry and flow conditions on particulate fouling in plate heat exchangers. Heat Transfer Engineering, v(20), 12-24.
Walker, R., 1976. Corrosion Inhabition of Copper by Tolylriazole. Corrosion, v(32), 339-341. Webb, R. L., 1994. Principles of heat transfer. New York, N.Y: Wiley & Sons. Webb, R. L., & Li, W., 2000. Fouling in enhanced tubes using cooling tower water Part I: Long-term
fouling data. International Journal of Heat and Mass Transfer, v(43), 3567-3578.
86
Webb, R. L., Narayanamurthy, R., & Thors, P., 2000. Heat transfer and friction characteristics of internal helical-rib roughness. Journal of Heat Transfer-Transactions of the Asme, 122(1), 134-142.
Wen, X. Q., Xu, Z. M., Wang, J. G., & Sun, L. F., 2013. Forecasting and discussing of the fouling characteristic of the plain tube. Advanced Materials Research, 668(v), 949-953.
Wu, X., & Cremaschi, L., 2012. Thermal and chemical analysis of fouling phenomenon in condensers for cooling tower applications. In: Proceedings of 14th International Refrigeration and Air Conditioning conference at Purdue, Paper No.2198, July 16, 2012 - July 19, 2012, West Lafayette, Indiana, United States
Wu, X., & Cremaschi, L., 2013. Effect of fouling on the thermal performance of condensers and on the water consumption in cooling tower systems. In: Proceedings of 2013 Heat Exchanger Fouling and Cleaning Conference, June 09- June 16, 2013, Budapest, Hungary.
Xu, D., & Knudsen, J. G., 1986. Functional Correlation of Surface Temperature and Flow Velocity on Fouling of Cooling-Tower Water. Heat Transfer Engineering, 7(1-2), 63-71.
Xu, Z., Wen, X., Zheng, J., Guo, J., & Huang, X., 2011. Cooling water fouling resistance prediction of plate heat exchanger based on partial least-squares regression. Huagong Xuebao/CIESC Journal, 62(6), 1531-1536.
Zan, C., Shi, L., & Ou, H., 2009. Effects of temperature and velocity on fouling by municipal secondary effluent in plate heat exchangers. Qinghua Daxue Xuebao/Journal of Tsinghua University, 49(2), 240-243.
Zdaniuk, G. J., Chamra, L. M., & Mago, P. J., 2008. A survey of cooling tower water quality for condenser tube fouling potential. Proceedings of the Institution of Mechanical Engineers, Part A: Journal of Power and Energy, 222, 111-122.
Zettler, H. U., Wei, M., Zhao, Q., & Muller-Steinhagen, H., 2005. Influence of surface properties and characteristics on fouling in plate heat exchangers. Heat Transfer Engineering, 26(2), 3-17.
Zhang, Y., & Wang, Y., 2010. Prediction of condenser fouling based on locally weighted partial least squares regression algorithm. Yi Qi Yi Biao Xue Bao/Chinese Journal of Scientific Instrument, 31(2), 299-304.
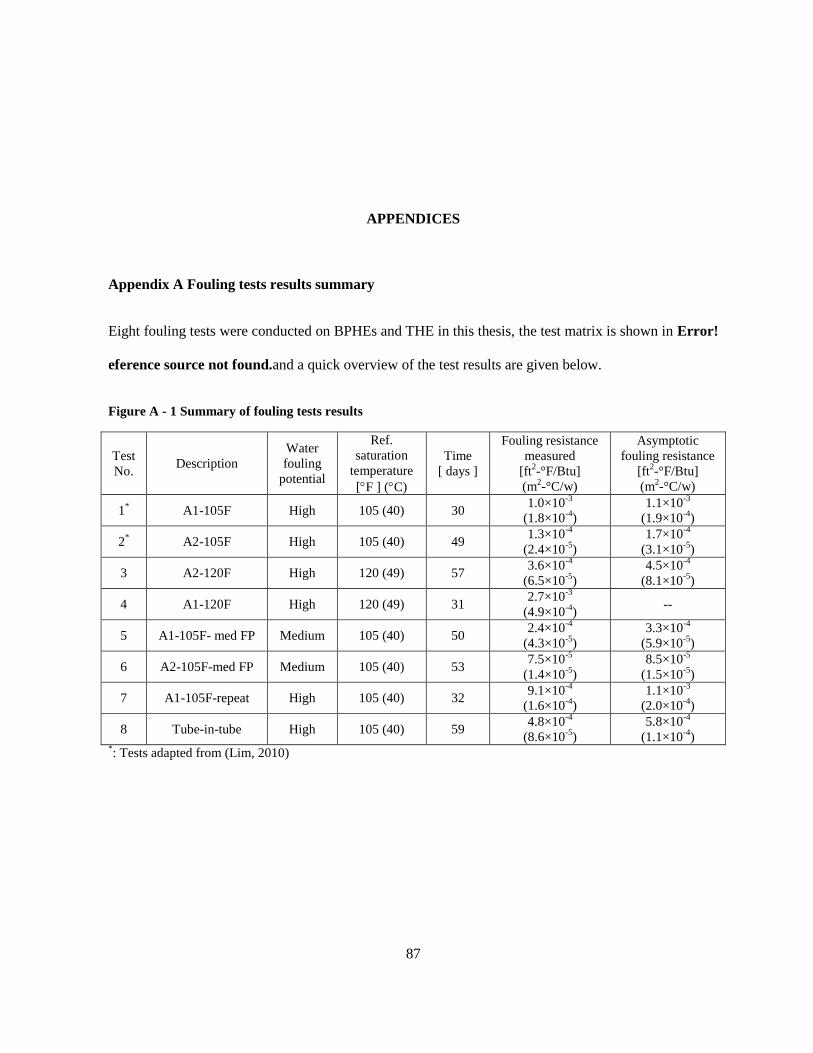
87
APPENDICES
Appendix A Fouling tests results summary
Eight fouling tests were conducted on BPHEs and THE in this thesis, the test matrix is shown in Error!
eference source not found.and a quick overview of the test results are given below.
Figure A - 1 Summary of fouling tests results
Test
No. Description
Water
fouling
potential
Ref.
saturation
temperature
[F ] (C)
Time
[ days ]
Fouling resistance
measured
[ft2-°F/Btu]
(m2-°C/w)
Asymptotic
fouling resistance
[ft2-°F/Btu]
(m2-°C/w)
1* A1-105F High 105 (40) 30
1.0×10⁻³
(1.8×10⁻⁴
)
1.1×10⁻³
(1.9×10⁻⁴
)
2* A2-105F High 105 (40) 49
1.3×10⁻⁴
(2.4×10⁻⁵
)
1.7×10⁻⁴
(3.1×10⁻⁵
)
3 A2-120F High 120 (49) 57 3.6×10
-4
(6.5×10⁻⁵
)
4.5×10⁻⁴
(8.1×10⁻⁵
)
4 A1-120F High 120 (49) 31 2.7×10
-3
(4.9×10⁻⁴
) --
5 A1-105F- med FP Medium 105 (40) 50 2.4×10
-4
(4.3×10⁻⁵
)
3.3×10⁻⁴
(5.9×10⁻⁵
)
6 A2-105F-med FP Medium 105 (40) 53 7.5×10
-5
(1.4×10⁻⁵
)
8.5×10⁻⁵
(1.5×10⁻⁵
)
7 A1-105F-repeat High 105 (40) 32 9.1×10
-4
(1.6×10⁻⁴
)
1.1×10⁻³
(2.0×10⁻⁴
)
8 Tube-in-tube High 105 (40) 59 4.8×10
-4
(8.6×10⁻⁵
)
5.8×10⁻⁴
(1.1×10⁻⁴
) *: Tests adapted from (Lim, 2010)
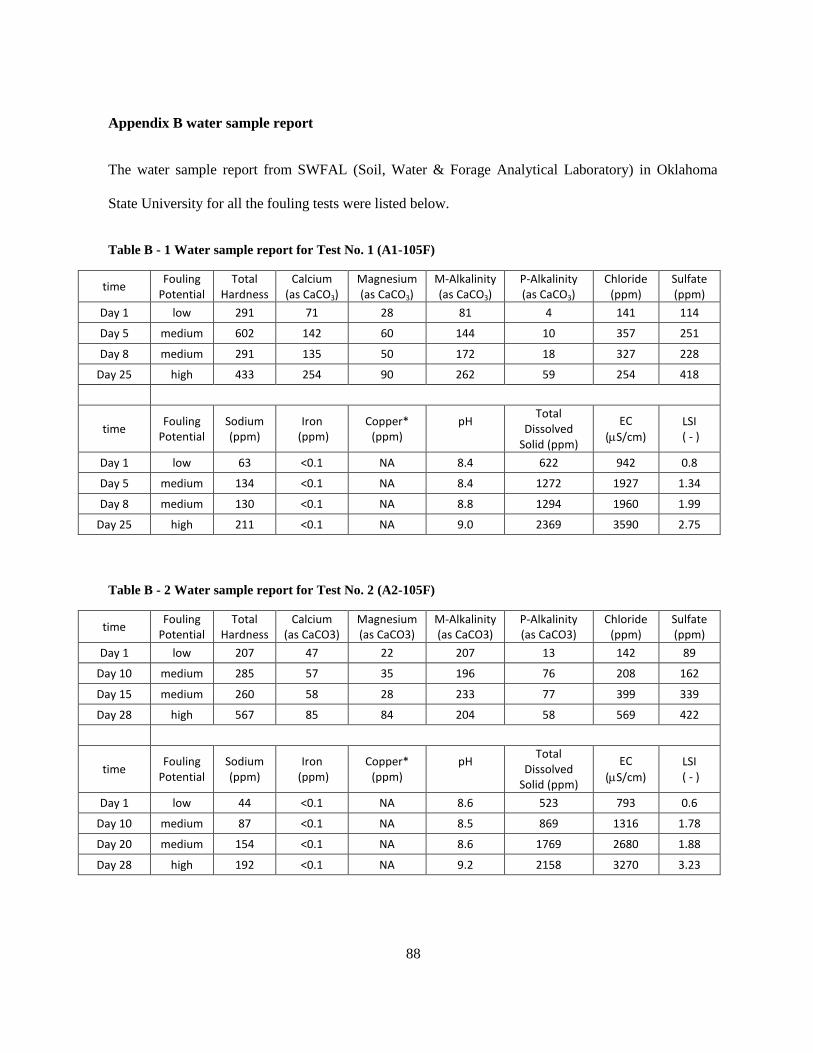
88
Appendix B water sample report
The water sample report from SWFAL (Soil, Water & Forage Analytical Laboratory) in Oklahoma
State University for all the fouling tests were listed below.
Table B - 1 Water sample report for Test No. 1 (A1-105F)
time Fouling
Potential Total
Hardness Calcium
(as CaCO3) Magnesium (as CaCO3)
M-Alkalinity (as CaCO3)
P-Alkalinity (as CaCO3)
Chloride (ppm)
Sulfate (ppm)
Day 1 low 291 71 28 81 4 141 114
Day 5 medium 602 142 60 144 10 357 251
Day 8 medium 291 135 50 172 18 327 228
Day 25 high 433 254 90 262 59 254 418
time Fouling
Potential Sodium (ppm)
Iron (ppm)
Copper* (ppm)
pH
Total Dissolved
Solid (ppm)
EC
(S/cm) LSI
( - )
Day 1 low 63 <0.1 NA 8.4 622 942 0.8
Day 5 medium 134 <0.1 NA 8.4 1272 1927 1.34
Day 8 medium 130 <0.1 NA 8.8 1294 1960 1.99
Day 25 high 211 <0.1 NA 9.0 2369 3590 2.75
Table B - 2 Water sample report for Test No. 2 (A2-105F)
time Fouling
Potential Total
Hardness Calcium
(as CaCO3) Magnesium (as CaCO3)
M-Alkalinity (as CaCO3)
P-Alkalinity (as CaCO3)
Chloride (ppm)
Sulfate (ppm)
Day 1 low 207 47 22 207 13 142 89
Day 10 medium 285 57 35 196 76 208 162
Day 15 medium 260 58 28 233 77 399 339
Day 28 high 567 85 84 204 58 569 422
time Fouling
Potential Sodium (ppm)
Iron (ppm)
Copper* (ppm)
pH
Total Dissolved
Solid (ppm)
EC
(S/cm)
LSI ( - )
Day 1 low 44 <0.1 NA 8.6 523 793 0.6
Day 10 medium 87 <0.1 NA 8.5 869 1316 1.78
Day 20 medium 154 <0.1 NA 8.6 1769 2680 1.88
Day 28 high 192 <0.1 NA 9.2 2158 3270 3.23
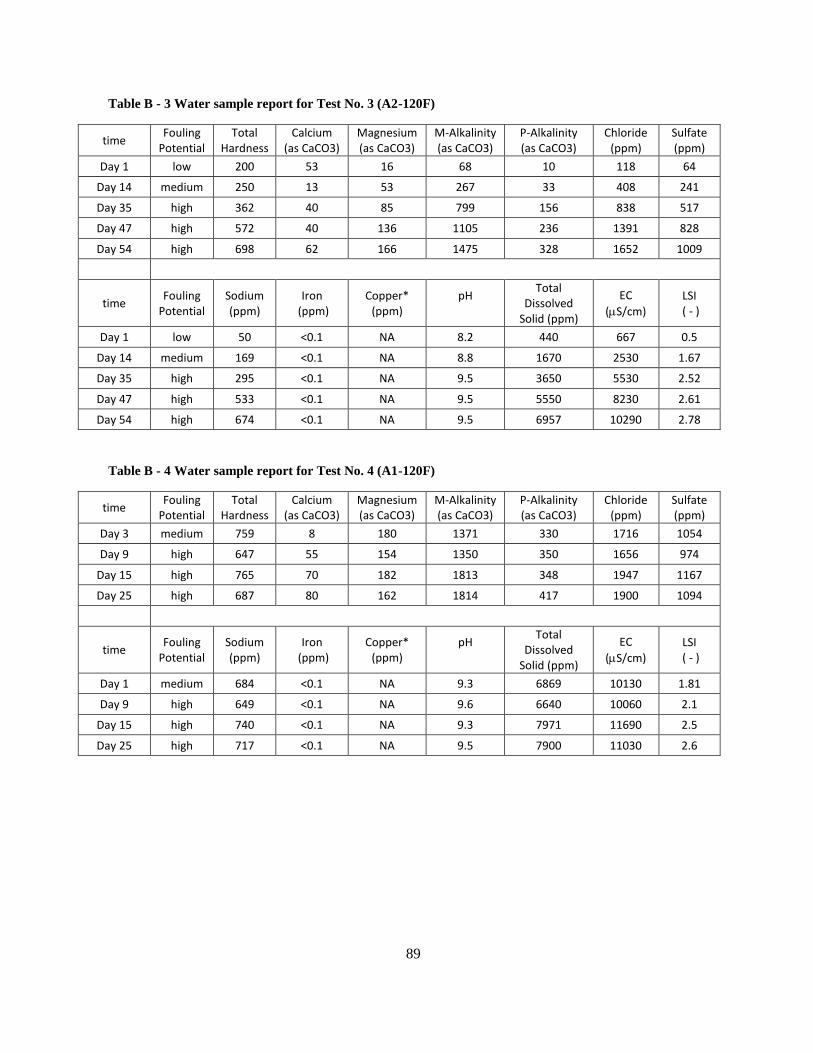
89
Table B - 3 Water sample report for Test No. 3 (A2-120F)
time Fouling
Potential Total
Hardness Calcium
(as CaCO3) Magnesium (as CaCO3)
M-Alkalinity (as CaCO3)
P-Alkalinity (as CaCO3)
Chloride (ppm)
Sulfate (ppm)
Day 1 low 200 53 16 68 10 118 64
Day 14 medium 250 13 53 267 33 408 241
Day 35 high 362 40 85 799 156 838 517
Day 47 high 572 40 136 1105 236 1391 828
Day 54 high 698 62 166 1475 328 1652 1009
time Fouling
Potential Sodium (ppm)
Iron (ppm)
Copper* (ppm)
pH
Total Dissolved
Solid (ppm)
EC
(S/cm)
LSI ( - )
Day 1 low 50 <0.1 NA 8.2 440 667 0.5
Day 14 medium 169 <0.1 NA 8.8 1670 2530 1.67
Day 35 high 295 <0.1 NA 9.5 3650 5530 2.52
Day 47 high 533 <0.1 NA 9.5 5550 8230 2.61
Day 54 high 674 <0.1 NA 9.5 6957 10290 2.78
Table B - 4 Water sample report for Test No. 4 (A1-120F)
time Fouling
Potential Total
Hardness Calcium
(as CaCO3) Magnesium (as CaCO3)
M-Alkalinity (as CaCO3)
P-Alkalinity (as CaCO3)
Chloride (ppm)
Sulfate (ppm)
Day 3 medium 759 8 180 1371 330 1716 1054
Day 9 high 647 55 154 1350 350 1656 974
Day 15 high 765 70 182 1813 348 1947 1167
Day 25 high 687 80 162 1814 417 1900 1094
time Fouling
Potential Sodium (ppm)
Iron (ppm)
Copper* (ppm)
pH
Total Dissolved
Solid (ppm)
EC
(S/cm)
LSI ( - )
Day 1 medium 684 <0.1 NA 9.3 6869 10130 1.81
Day 9 high 649 <0.1 NA 9.6 6640 10060 2.1
Day 15 high 740 <0.1 NA 9.3 7971 11690 2.5
Day 25 high 717 <0.1 NA 9.5 7900 11030 2.6
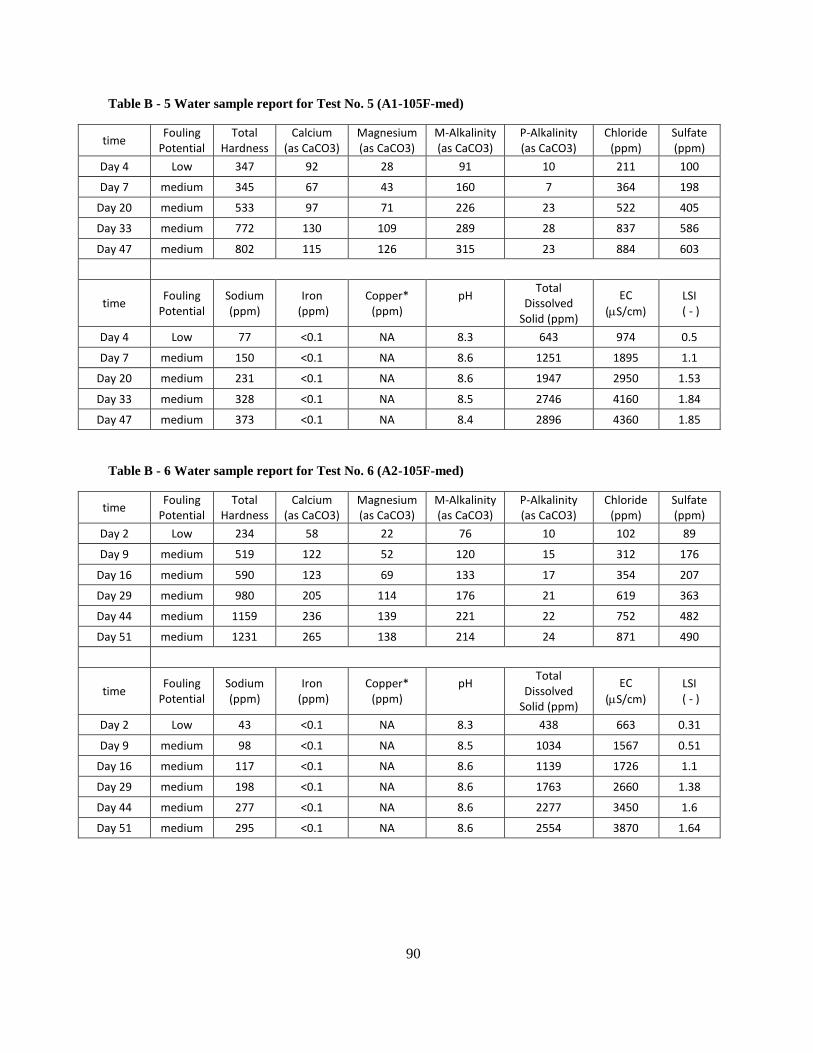
90
Table B - 5 Water sample report for Test No. 5 (A1-105F-med)
time Fouling
Potential Total
Hardness Calcium
(as CaCO3) Magnesium (as CaCO3)
M-Alkalinity (as CaCO3)
P-Alkalinity (as CaCO3)
Chloride (ppm)
Sulfate (ppm)
Day 4 Low 347 92 28 91 10 211 100
Day 7 medium 345 67 43 160 7 364 198
Day 20 medium 533 97 71 226 23 522 405
Day 33 medium 772 130 109 289 28 837 586
Day 47 medium 802 115 126 315 23 884 603
time Fouling
Potential Sodium (ppm)
Iron (ppm)
Copper* (ppm)
pH
Total Dissolved
Solid (ppm)
EC
(S/cm)
LSI ( - )
Day 4 Low 77 <0.1 NA 8.3 643 974 0.5
Day 7 medium 150 <0.1 NA 8.6 1251 1895 1.1
Day 20 medium 231 <0.1 NA 8.6 1947 2950 1.53
Day 33 medium 328 <0.1 NA 8.5 2746 4160 1.84
Day 47 medium 373 <0.1 NA 8.4 2896 4360 1.85
Table B - 6 Water sample report for Test No. 6 (A2-105F-med)
time Fouling
Potential Total
Hardness Calcium
(as CaCO3) Magnesium (as CaCO3)
M-Alkalinity (as CaCO3)
P-Alkalinity (as CaCO3)
Chloride (ppm)
Sulfate (ppm)
Day 2 Low 234 58 22 76 10 102 89
Day 9 medium 519 122 52 120 15 312 176
Day 16 medium 590 123 69 133 17 354 207
Day 29 medium 980 205 114 176 21 619 363
Day 44 medium 1159 236 139 221 22 752 482
Day 51 medium 1231 265 138 214 24 871 490
time Fouling
Potential Sodium (ppm)
Iron (ppm)
Copper* (ppm)
pH
Total Dissolved
Solid (ppm)
EC
(S/cm)
LSI ( - )
Day 2 Low 43 <0.1 NA 8.3 438 663 0.31
Day 9 medium 98 <0.1 NA 8.5 1034 1567 0.51
Day 16 medium 117 <0.1 NA 8.6 1139 1726 1.1
Day 29 medium 198 <0.1 NA 8.6 1763 2660 1.38
Day 44 medium 277 <0.1 NA 8.6 2277 3450 1.6
Day 51 medium 295 <0.1 NA 8.6 2554 3870 1.64
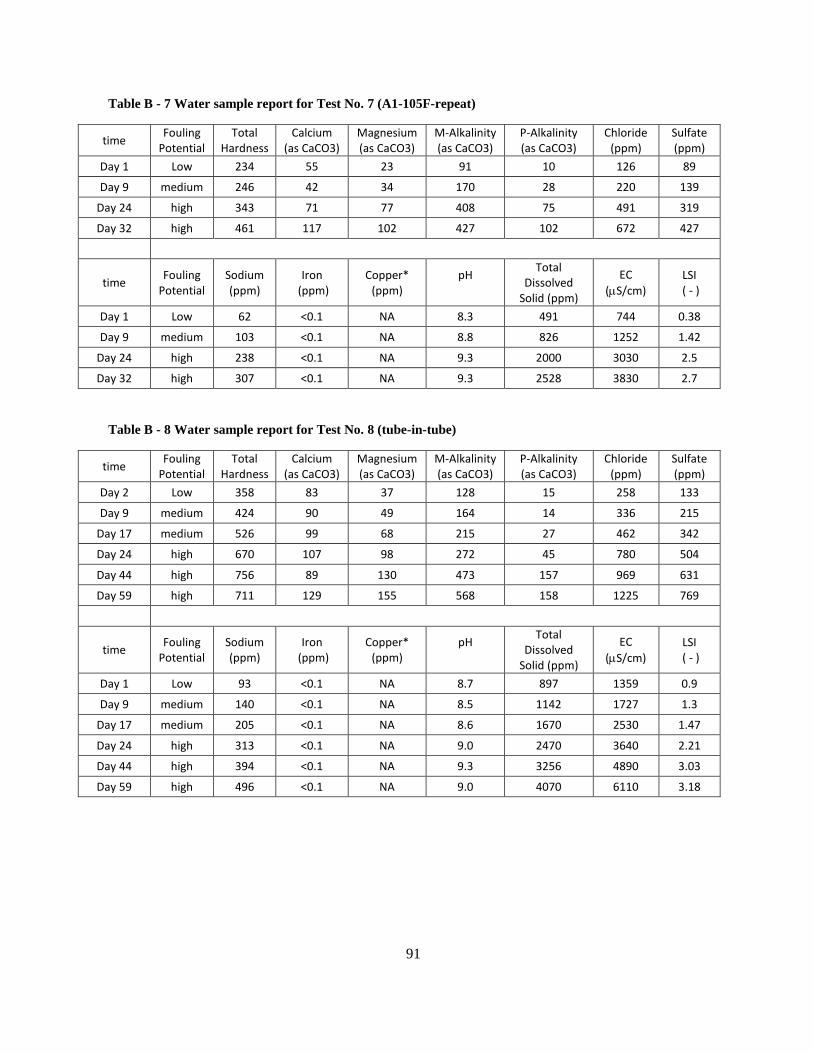
91
Table B - 7 Water sample report for Test No. 7 (A1-105F-repeat)
time Fouling
Potential Total
Hardness Calcium
(as CaCO3) Magnesium (as CaCO3)
M-Alkalinity (as CaCO3)
P-Alkalinity (as CaCO3)
Chloride (ppm)
Sulfate (ppm)
Day 1 Low 234 55 23 91 10 126 89
Day 9 medium 246 42 34 170 28 220 139
Day 24 high 343 71 77 408 75 491 319
Day 32 high 461 117 102 427 102 672 427
time Fouling
Potential Sodium (ppm)
Iron (ppm)
Copper* (ppm)
pH
Total Dissolved
Solid (ppm)
EC
(S/cm) LSI
( - )
Day 1 Low 62 <0.1 NA 8.3 491 744 0.38
Day 9 medium 103 <0.1 NA 8.8 826 1252 1.42
Day 24 high 238 <0.1 NA 9.3 2000 3030 2.5
Day 32 high 307 <0.1 NA 9.3 2528 3830 2.7
Table B - 8 Water sample report for Test No. 8 (tube-in-tube)
time Fouling
Potential Total
Hardness Calcium
(as CaCO3) Magnesium (as CaCO3)
M-Alkalinity (as CaCO3)
P-Alkalinity (as CaCO3)
Chloride (ppm)
Sulfate (ppm)
Day 2 Low 358 83 37 128 15 258 133
Day 9 medium 424 90 49 164 14 336 215
Day 17 medium 526 99 68 215 27 462 342
Day 24 high 670 107 98 272 45 780 504
Day 44 high 756 89 130 473 157 969 631
Day 59 high 711 129 155 568 158 1225 769
time Fouling
Potential Sodium (ppm)
Iron (ppm)
Copper* (ppm)
pH
Total Dissolved
Solid (ppm)
EC
(S/cm)
LSI ( - )
Day 1 Low 93 <0.1 NA 8.7 897 1359 0.9
Day 9 medium 140 <0.1 NA 8.5 1142 1727 1.3
Day 17 medium 205 <0.1 NA 8.6 1670 2530 1.47
Day 24 high 313 <0.1 NA 9.0 2470 3640 2.21
Day 44 high 394 <0.1 NA 9.3 3256 4890 3.03
Day 59 high 496 <0.1 NA 9.0 4070 6110 3.18
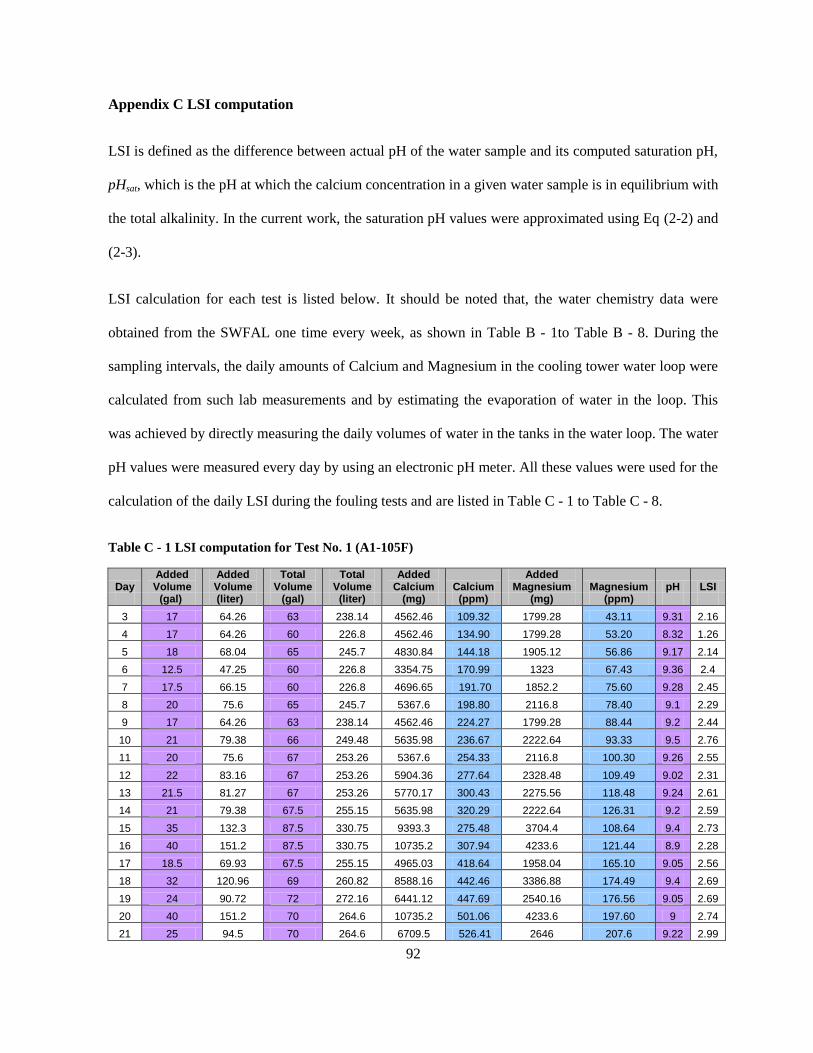
92
Appendix C LSI computation
LSI is defined as the difference between actual pH of the water sample and its computed saturation pH,
pHsat, which is the pH at which the calcium concentration in a given water sample is in equilibrium with
the total alkalinity. In the current work, the saturation pH values were approximated using Eq (2-2) and
(2-3).
LSI calculation for each test is listed below. It should be noted that, the water chemistry data were
obtained from the SWFAL one time every week, as shown in Table B - 1to Table B - 8. During the
sampling intervals, the daily amounts of Calcium and Magnesium in the cooling tower water loop were
calculated from such lab measurements and by estimating the evaporation of water in the loop. This
was achieved by directly measuring the daily volumes of water in the tanks in the water loop. The water
pH values were measured every day by using an electronic pH meter. All these values were used for the
calculation of the daily LSI during the fouling tests and are listed in Table C - 1 to Table C - 8.
Table C - 1 LSI computation for Test No. 1 (A1-105F)
Day Added Volume
Added Volume
Total Volume
Total Volume
Added Calcium Calcium
Added Magnesium Magnesium pH LSI
(gal) (liter) (gal) (liter) (mg) (ppm) (mg) (ppm)
3 17 64.26 63 238.14 4562.46 109.32 1799.28 43.11 9.31 2.16
4 17 64.26 60 226.8 4562.46 134.90 1799.28 53.20 8.32 1.26
5 18 68.04 65 245.7 4830.84 144.18 1905.12 56.86 9.17 2.14
6 12.5 47.25 60 226.8 3354.75 170.99 1323 67.43 9.36 2.4
7 17.5 66.15 60 226.8 4696.65 191.70 1852.2 75.60 9.28 2.45
8 20 75.6 65 245.7 5367.6 198.80 2116.8 78.40 9.1 2.29
9 17 64.26 63 238.14 4562.46 224.27 1799.28 88.44 9.2 2.44
10 21 79.38 66 249.48 5635.98 236.67 2222.64 93.33 9.5 2.76
11 20 75.6 67 253.26 5367.6 254.33 2116.8 100.30 9.26 2.55
12 22 83.16 67 253.26 5904.36 277.64 2328.48 109.49 9.02 2.31
13 21.5 81.27 67 253.26 5770.17 300.43 2275.56 118.48 9.24 2.61
14 21 79.38 67.5 255.15 5635.98 320.29 2222.64 126.31 9.2 2.59
15 35 132.3 87.5 330.75 9393.3 275.48 3704.4 108.64 9.4 2.73
16 40 151.2 87.5 330.75 10735.2 307.94 4233.6 121.44 8.9 2.28
17 18.5 69.93 67.5 255.15 4965.03 418.64 1958.04 165.10 9.05 2.56
18 32 120.96 69 260.82 8588.16 442.46 3386.88 174.49 9.4 2.69
19 24 90.72 72 272.16 6441.12 447.69 2540.16 176.56 9.05 2.69
20 40 151.2 70 264.6 10735.2 501.06 4233.6 197.60 9 2.74
21 25 94.5 70 264.6 6709.5 526.41 2646 207.6 9.22 2.99
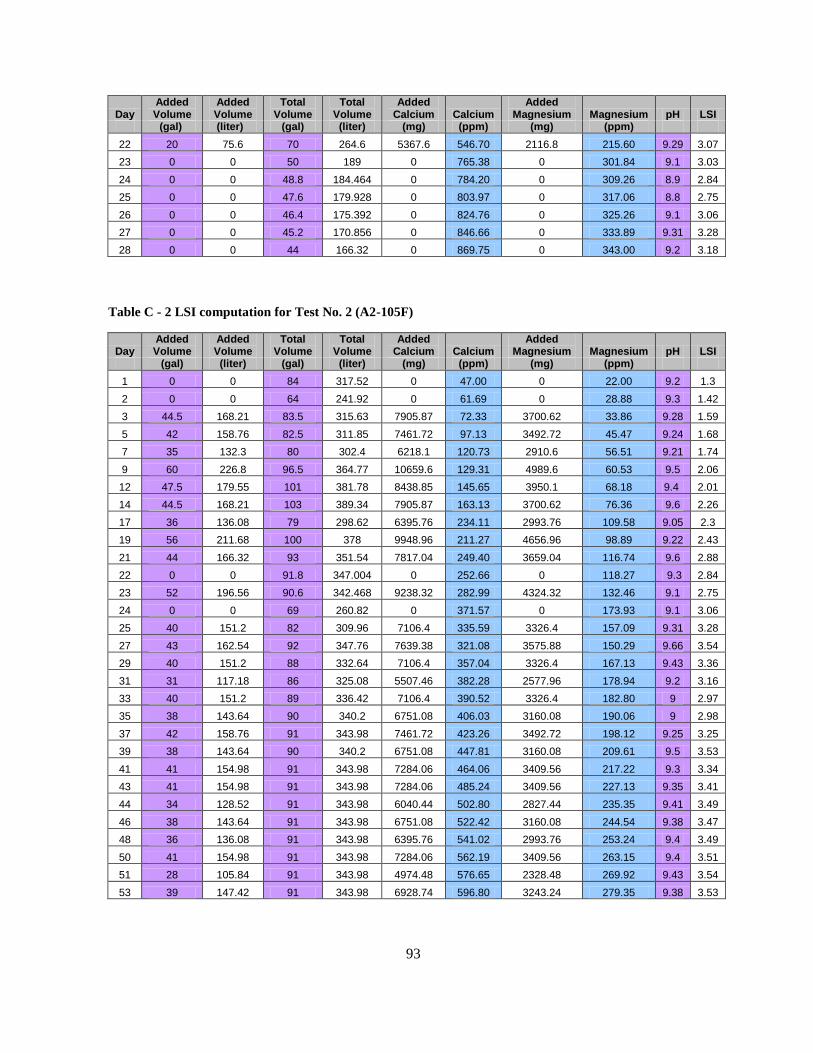
93
Day Added Volume
Added Volume
Total Volume
Total Volume
Added Calcium Calcium
Added Magnesium Magnesium pH LSI
(gal) (liter) (gal) (liter) (mg) (ppm) (mg) (ppm)
22 20 75.6 70 264.6 5367.6 546.70 2116.8 215.60 9.29 3.07
23 0 0 50 189 0 765.38 0 301.84 9.1 3.03
24 0 0 48.8 184.464 0 784.20 0 309.26 8.9 2.84
25 0 0 47.6 179.928 0 803.97 0 317.06 8.8 2.75
26 0 0 46.4 175.392 0 824.76 0 325.26 9.1 3.06
27 0 0 45.2 170.856 0 846.66 0 333.89 9.31 3.28
28 0 0 44 166.32 0 869.75 0 343.00 9.2 3.18
Table C - 2 LSI computation for Test No. 2 (A2-105F)
Day Added Volume
Added Volume
Total Volume
Total Volume
Added Calcium Calcium
Added Magnesium Magnesium pH LSI
(gal) (liter) (gal) (liter) (mg) (ppm) (mg) (ppm)
1 0 0 84 317.52 0 47.00 0 22.00 9.2 1.3
2 0 0 64 241.92 0 61.69 0 28.88 9.3 1.42
3 44.5 168.21 83.5 315.63 7905.87 72.33 3700.62 33.86 9.28 1.59
5 42 158.76 82.5 311.85 7461.72 97.13 3492.72 45.47 9.24 1.68
7 35 132.3 80 302.4 6218.1 120.73 2910.6 56.51 9.21 1.74
9 60 226.8 96.5 364.77 10659.6 129.31 4989.6 60.53 9.5 2.06
12 47.5 179.55 101 381.78 8438.85 145.65 3950.1 68.18 9.4 2.01
14 44.5 168.21 103 389.34 7905.87 163.13 3700.62 76.36 9.6 2.26
17 36 136.08 79 298.62 6395.76 234.11 2993.76 109.58 9.05 2.3
19 56 211.68 100 378 9948.96 211.27 4656.96 98.89 9.22 2.43
21 44 166.32 93 351.54 7817.04 249.40 3659.04 116.74 9.6 2.88
22 0 0 91.8 347.004 0 252.66 0 118.27 9.3 2.84
23 52 196.56 90.6 342.468 9238.32 282.99 4324.32 132.46 9.1 2.75
24 0 0 69 260.82 0 371.57 0 173.93 9.1 3.06
25 40 151.2 82 309.96 7106.4 335.59 3326.4 157.09 9.31 3.28
27 43 162.54 92 347.76 7639.38 321.08 3575.88 150.29 9.66 3.54
29 40 151.2 88 332.64 7106.4 357.04 3326.4 167.13 9.43 3.36
31 31 117.18 86 325.08 5507.46 382.28 2577.96 178.94 9.2 3.16
33 40 151.2 89 336.42 7106.4 390.52 3326.4 182.80 9 2.97
35 38 143.64 90 340.2 6751.08 406.03 3160.08 190.06 9 2.98
37 42 158.76 91 343.98 7461.72 423.26 3492.72 198.12 9.25 3.25
39 38 143.64 90 340.2 6751.08 447.81 3160.08 209.61 9.5 3.53
41 41 154.98 91 343.98 7284.06 464.06 3409.56 217.22 9.3 3.34
43 41 154.98 91 343.98 7284.06 485.24 3409.56 227.13 9.35 3.41
44 34 128.52 91 343.98 6040.44 502.80 2827.44 235.35 9.41 3.49
46 38 143.64 91 343.98 6751.08 522.42 3160.08 244.54 9.38 3.47
48 36 136.08 91 343.98 6395.76 541.02 2993.76 253.24 9.4 3.49
50 41 154.98 91 343.98 7284.06 562.19 3409.56 263.15 9.4 3.51
51 28 105.84 91 343.98 4974.48 576.65 2328.48 269.92 9.43 3.54
53 39 147.42 91 343.98 6928.74 596.80 3243.24 279.35 9.38 3.53
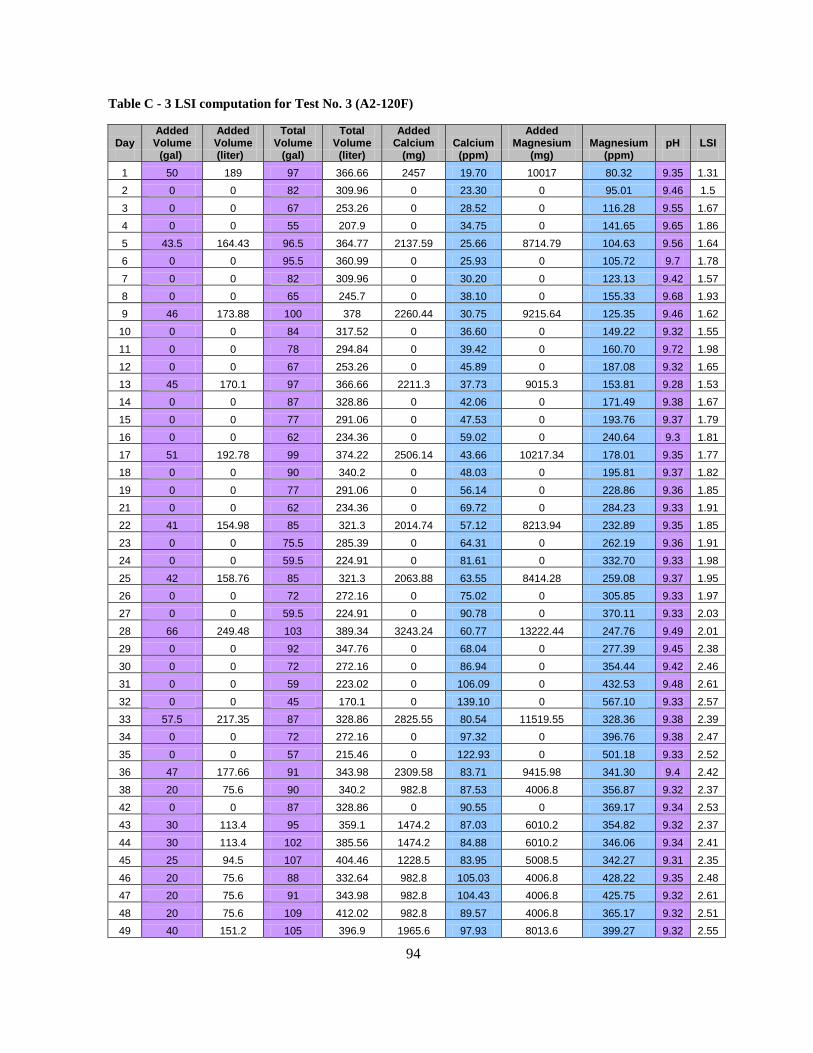
94
Table C - 3 LSI computation for Test No. 3 (A2-120F)
Day Added Volume
Added Volume
Total Volume
Total Volume
Added Calcium Calcium
Added Magnesium Magnesium pH LSI
(gal) (liter) (gal) (liter) (mg) (ppm) (mg) (ppm)
1 50 189 97 366.66 2457 19.70 10017 80.32 9.35 1.31
2 0 0 82 309.96 0 23.30 0 95.01 9.46 1.5
3 0 0 67 253.26 0 28.52 0 116.28 9.55 1.67
4 0 0 55 207.9 0 34.75 0 141.65 9.65 1.86
5 43.5 164.43 96.5 364.77 2137.59 25.66 8714.79 104.63 9.56 1.64
6 0 0 95.5 360.99 0 25.93 0 105.72 9.7 1.78
7 0 0 82 309.96 0 30.20 0 123.13 9.42 1.57
8 0 0 65 245.7 0 38.10 0 155.33 9.68 1.93
9 46 173.88 100 378 2260.44 30.75 9215.64 125.35 9.46 1.62
10 0 0 84 317.52 0 36.60 0 149.22 9.32 1.55
11 0 0 78 294.84 0 39.42 0 160.70 9.72 1.98
12 0 0 67 253.26 0 45.89 0 187.08 9.32 1.65
13 45 170.1 97 366.66 2211.3 37.73 9015.3 153.81 9.28 1.53
14 0 0 87 328.86 0 42.06 0 171.49 9.38 1.67
15 0 0 77 291.06 0 47.53 0 193.76 9.37 1.79
16 0 0 62 234.36 0 59.02 0 240.64 9.3 1.81
17 51 192.78 99 374.22 2506.14 43.66 10217.34 178.01 9.35 1.77
18 0 0 90 340.2 0 48.03 0 195.81 9.37 1.82
19 0 0 77 291.06 0 56.14 0 228.86 9.36 1.85
21 0 0 62 234.36 0 69.72 0 284.23 9.33 1.91
22 41 154.98 85 321.3 2014.74 57.12 8213.94 232.89 9.35 1.85
23 0 0 75.5 285.39 0 64.31 0 262.19 9.36 1.91
24 0 0 59.5 224.91 0 81.61 0 332.70 9.33 1.98
25 42 158.76 85 321.3 2063.88 63.55 8414.28 259.08 9.37 1.95
26 0 0 72 272.16 0 75.02 0 305.85 9.33 1.97
27 0 0 59.5 224.91 0 90.78 0 370.11 9.33 2.03
28 66 249.48 103 389.34 3243.24 60.77 13222.44 247.76 9.49 2.01
29 0 0 92 347.76 0 68.04 0 277.39 9.45 2.38
30 0 0 72 272.16 0 86.94 0 354.44 9.42 2.46
31 0 0 59 223.02 0 106.09 0 432.53 9.48 2.61
32 0 0 45 170.1 0 139.10 0 567.10 9.33 2.57
33 57.5 217.35 87 328.86 2825.55 80.54 11519.55 328.36 9.38 2.39
34 0 0 72 272.16 0 97.32 0 396.76 9.38 2.47
35 0 0 57 215.46 0 122.93 0 501.18 9.33 2.52
36 47 177.66 91 343.98 2309.58 83.71 9415.98 341.30 9.4 2.42
38 20 75.6 90 340.2 982.8 87.53 4006.8 356.87 9.32 2.37
42 0 0 87 328.86 0 90.55 0 369.17 9.34 2.53
43 30 113.4 95 359.1 1474.2 87.03 6010.2 354.82 9.32 2.37
44 30 113.4 102 385.56 1474.2 84.88 6010.2 346.06 9.34 2.41
45 25 94.5 107 404.46 1228.5 83.95 5008.5 342.27 9.31 2.35
46 20 75.6 88 332.64 982.8 105.03 4006.8 428.22 9.35 2.48
47 20 75.6 91 343.98 982.8 104.43 4006.8 425.75 9.32 2.61
48 20 75.6 109 412.02 982.8 89.57 4006.8 365.17 9.32 2.51
49 40 151.2 105 396.9 1965.6 97.93 8013.6 399.27 9.32 2.55
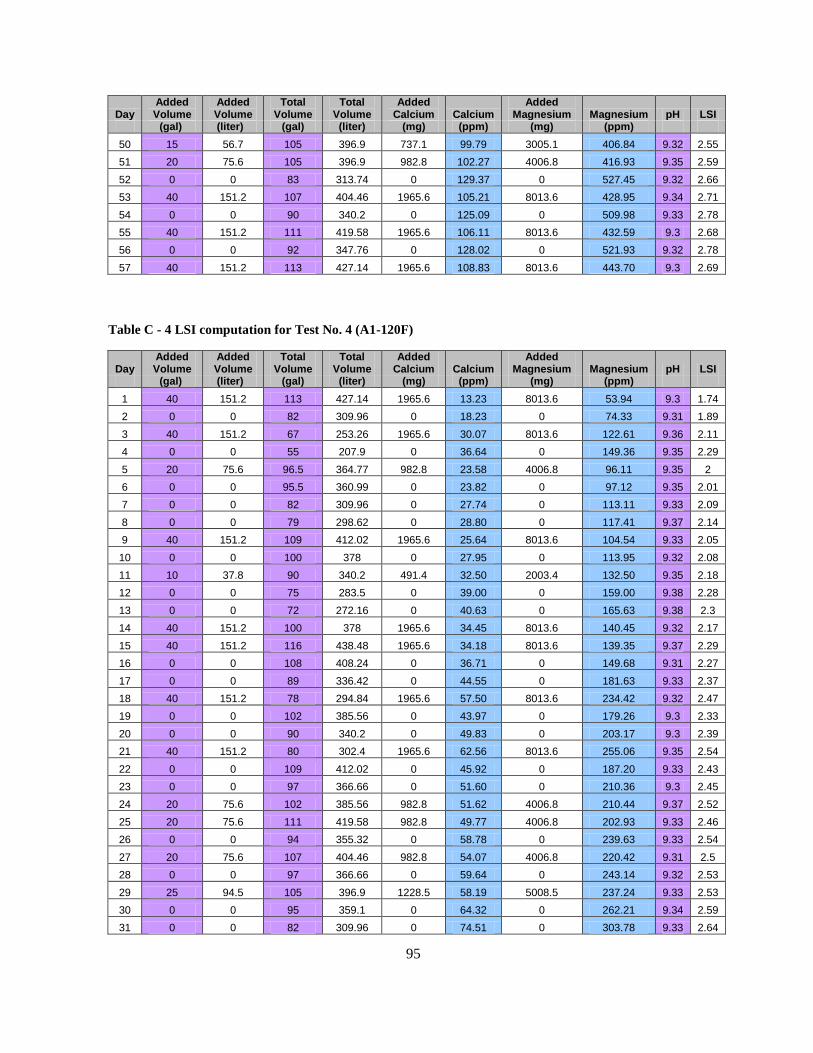
95
Day Added Volume
Added Volume
Total Volume
Total Volume
Added Calcium Calcium
Added Magnesium Magnesium pH LSI
(gal) (liter) (gal) (liter) (mg) (ppm) (mg) (ppm)
50 15 56.7 105 396.9 737.1 99.79 3005.1 406.84 9.32 2.55
51 20 75.6 105 396.9 982.8 102.27 4006.8 416.93 9.35 2.59
52 0 0 83 313.74 0 129.37 0 527.45 9.32 2.66
53 40 151.2 107 404.46 1965.6 105.21 8013.6 428.95 9.34 2.71
54 0 0 90 340.2 0 125.09 0 509.98 9.33 2.78
55 40 151.2 111 419.58 1965.6 106.11 8013.6 432.59 9.3 2.68
56 0 0 92 347.76 0 128.02 0 521.93 9.32 2.78
57 40 151.2 113 427.14 1965.6 108.83 8013.6 443.70 9.3 2.69
Table C - 4 LSI computation for Test No. 4 (A1-120F)
Day Added Volume
Added Volume
Total Volume
Total Volume
Added Calcium Calcium
Added Magnesium Magnesium pH LSI
(gal) (liter) (gal) (liter) (mg) (ppm) (mg) (ppm)
1 40 151.2 113 427.14 1965.6 13.23 8013.6 53.94 9.3 1.74
2 0 0 82 309.96 0 18.23 0 74.33 9.31 1.89
3 40 151.2 67 253.26 1965.6 30.07 8013.6 122.61 9.36 2.11
4 0 0 55 207.9 0 36.64 0 149.36 9.35 2.29
5 20 75.6 96.5 364.77 982.8 23.58 4006.8 96.11 9.35 2
6 0 0 95.5 360.99 0 23.82 0 97.12 9.35 2.01
7 0 0 82 309.96 0 27.74 0 113.11 9.33 2.09
8 0 0 79 298.62 0 28.80 0 117.41 9.37 2.14
9 40 151.2 109 412.02 1965.6 25.64 8013.6 104.54 9.33 2.05
10 0 0 100 378 0 27.95 0 113.95 9.32 2.08
11 10 37.8 90 340.2 491.4 32.50 2003.4 132.50 9.35 2.18
12 0 0 75 283.5 0 39.00 0 159.00 9.38 2.28
13 0 0 72 272.16 0 40.63 0 165.63 9.38 2.3
14 40 151.2 100 378 1965.6 34.45 8013.6 140.45 9.32 2.17
15 40 151.2 116 438.48 1965.6 34.18 8013.6 139.35 9.37 2.29
16 0 0 108 408.24 0 36.71 0 149.68 9.31 2.27
17 0 0 89 336.42 0 44.55 0 181.63 9.33 2.37
18 40 151.2 78 294.84 1965.6 57.50 8013.6 234.42 9.32 2.47
19 0 0 102 385.56 0 43.97 0 179.26 9.3 2.33
20 0 0 90 340.2 0 49.83 0 203.17 9.3 2.39
21 40 151.2 80 302.4 1965.6 62.56 8013.6 255.06 9.35 2.54
22 0 0 109 412.02 0 45.92 0 187.20 9.33 2.43
23 0 0 97 366.66 0 51.60 0 210.36 9.3 2.45
24 20 75.6 102 385.56 982.8 51.62 4006.8 210.44 9.37 2.52
25 20 75.6 111 419.58 982.8 49.77 4006.8 202.93 9.33 2.46
26 0 0 94 355.32 0 58.78 0 239.63 9.33 2.54
27 20 75.6 107 404.46 982.8 54.07 4006.8 220.42 9.31 2.5
28 0 0 97 366.66 0 59.64 0 243.14 9.32 2.53
29 25 94.5 105 396.9 1228.5 58.19 5008.5 237.24 9.33 2.53
30 0 0 95 359.1 0 64.32 0 262.21 9.34 2.59
31 0 0 82 309.96 0 74.51 0 303.78 9.33 2.64
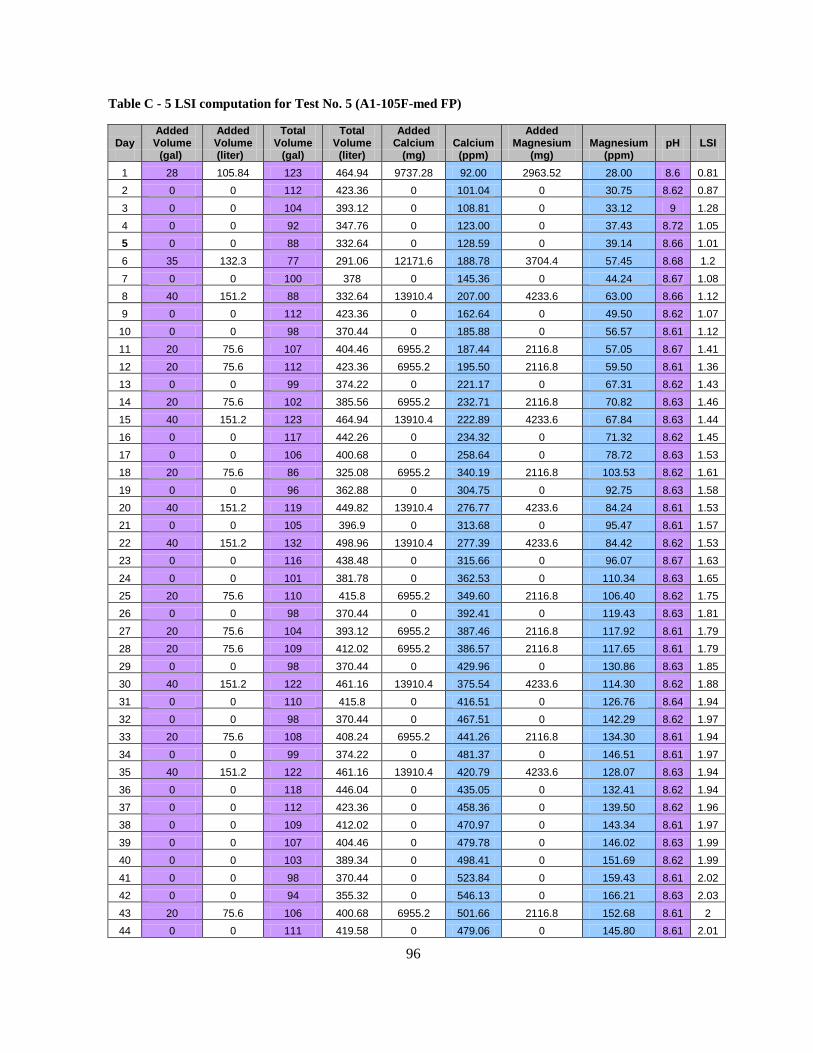
96
Table C - 5 LSI computation for Test No. 5 (A1-105F-med FP)
Day Added Volume
Added Volume
Total Volume
Total Volume
Added Calcium Calcium
Added Magnesium Magnesium pH LSI
(gal) (liter) (gal) (liter) (mg) (ppm) (mg) (ppm)
1 28 105.84 123 464.94 9737.28 92.00 2963.52 28.00 8.6 0.81
2 0 0 112 423.36 0 101.04 0 30.75 8.62 0.87
3 0 0 104 393.12 0 108.81 0 33.12 9 1.28
4 0 0 92 347.76 0 123.00 0 37.43 8.72 1.05
5 0 0 88 332.64 0 128.59 0 39.14 8.66 1.01
6 35 132.3 77 291.06 12171.6 188.78 3704.4 57.45 8.68 1.2
7 0 0 100 378 0 145.36 0 44.24 8.67 1.08
8 40 151.2 88 332.64 13910.4 207.00 4233.6 63.00 8.66 1.12
9 0 0 112 423.36 0 162.64 0 49.50 8.62 1.07
10 0 0 98 370.44 0 185.88 0 56.57 8.61 1.12
11 20 75.6 107 404.46 6955.2 187.44 2116.8 57.05 8.67 1.41
12 20 75.6 112 423.36 6955.2 195.50 2116.8 59.50 8.61 1.36
13 0 0 99 374.22 0 221.17 0 67.31 8.62 1.43
14 20 75.6 102 385.56 6955.2 232.71 2116.8 70.82 8.63 1.46
15 40 151.2 123 464.94 13910.4 222.89 4233.6 67.84 8.63 1.44
16 0 0 117 442.26 0 234.32 0 71.32 8.62 1.45
17 0 0 106 400.68 0 258.64 0 78.72 8.63 1.53
18 20 75.6 86 325.08 6955.2 340.19 2116.8 103.53 8.62 1.61
19 0 0 96 362.88 0 304.75 0 92.75 8.63 1.58
20 40 151.2 119 449.82 13910.4 276.77 4233.6 84.24 8.61 1.53
21 0 0 105 396.9 0 313.68 0 95.47 8.61 1.57
22 40 151.2 132 498.96 13910.4 277.39 4233.6 84.42 8.62 1.53
23 0 0 116 438.48 0 315.66 0 96.07 8.67 1.63
24 0 0 101 381.78 0 362.53 0 110.34 8.63 1.65
25 20 75.6 110 415.8 6955.2 349.60 2116.8 106.40 8.62 1.75
26 0 0 98 370.44 0 392.41 0 119.43 8.63 1.81
27 20 75.6 104 393.12 6955.2 387.46 2116.8 117.92 8.61 1.79
28 20 75.6 109 412.02 6955.2 386.57 2116.8 117.65 8.61 1.79
29 0 0 98 370.44 0 429.96 0 130.86 8.63 1.85
30 40 151.2 122 461.16 13910.4 375.54 4233.6 114.30 8.62 1.88
31 0 0 110 415.8 0 416.51 0 126.76 8.64 1.94
32 0 0 98 370.44 0 467.51 0 142.29 8.62 1.97
33 20 75.6 108 408.24 6955.2 441.26 2116.8 134.30 8.61 1.94
34 0 0 99 374.22 0 481.37 0 146.51 8.61 1.97
35 40 151.2 122 461.16 13910.4 420.79 4233.6 128.07 8.63 1.94
36 0 0 118 446.04 0 435.05 0 132.41 8.62 1.94
37 0 0 112 423.36 0 458.36 0 139.50 8.62 1.96
38 0 0 109 412.02 0 470.97 0 143.34 8.61 1.97
39 0 0 107 404.46 0 479.78 0 146.02 8.63 1.99
40 0 0 103 389.34 0 498.41 0 151.69 8.62 1.99
41 0 0 98 370.44 0 523.84 0 159.43 8.61 2.02
42 0 0 94 355.32 0 546.13 0 166.21 8.63 2.03
43 20 75.6 106 400.68 6955.2 501.66 2116.8 152.68 8.61 2
44 0 0 111 419.58 0 479.06 0 145.80 8.61 2.01
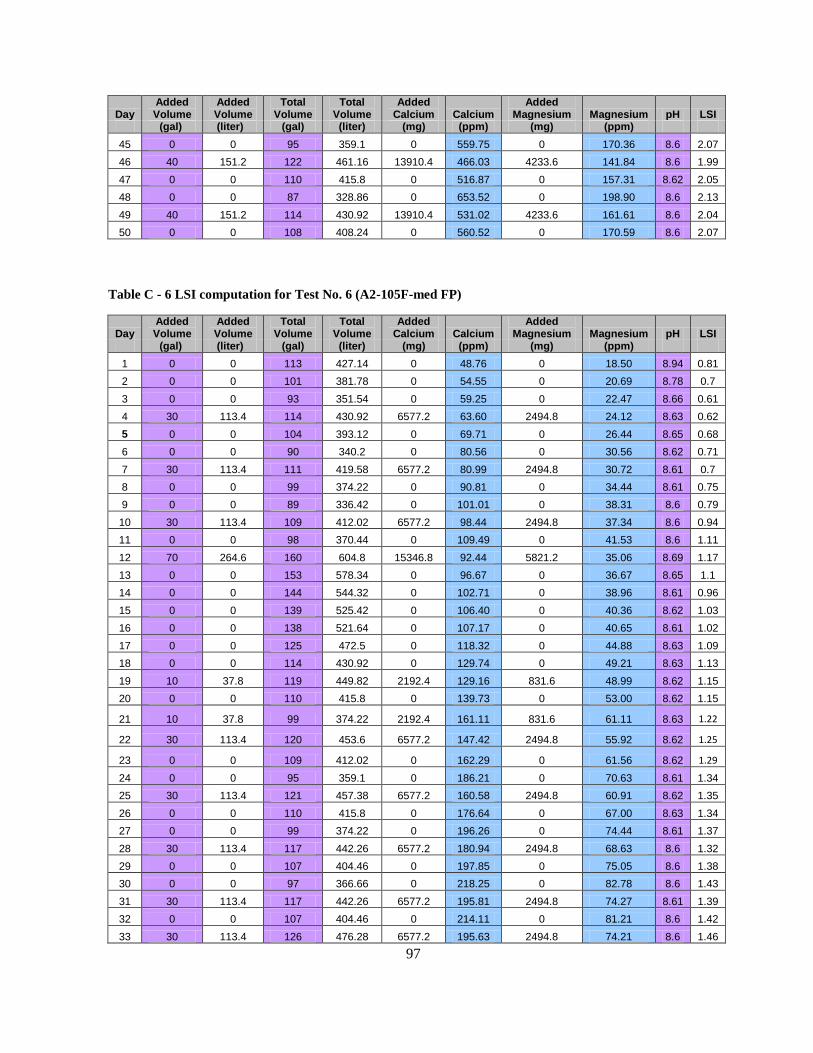
97
Day Added Volume
Added Volume
Total Volume
Total Volume
Added Calcium Calcium
Added Magnesium Magnesium pH LSI
(gal) (liter) (gal) (liter) (mg) (ppm) (mg) (ppm)
45 0 0 95 359.1 0 559.75 0 170.36 8.6 2.07
46 40 151.2 122 461.16 13910.4 466.03 4233.6 141.84 8.6 1.99
47 0 0 110 415.8 0 516.87 0 157.31 8.62 2.05
48 0 0 87 328.86 0 653.52 0 198.90 8.6 2.13
49 40 151.2 114 430.92 13910.4 531.02 4233.6 161.61 8.6 2.04
50 0 0 108 408.24 0 560.52 0 170.59 8.6 2.07
Table C - 6 LSI computation for Test No. 6 (A2-105F-med FP)
Day Added Volume
Added Volume
Total Volume
Total Volume
Added Calcium Calcium
Added Magnesium Magnesium pH LSI
(gal) (liter) (gal) (liter) (mg) (ppm) (mg) (ppm)
1 0 0 113 427.14 0 48.76 0 18.50 8.94 0.81
2 0 0 101 381.78 0 54.55 0 20.69 8.78 0.7
3 0 0 93 351.54 0 59.25 0 22.47 8.66 0.61
4 30 113.4 114 430.92 6577.2 63.60 2494.8 24.12 8.63 0.62
5 0 0 104 393.12 0 69.71 0 26.44 8.65 0.68
6 0 0 90 340.2 0 80.56 0 30.56 8.62 0.71
7 30 113.4 111 419.58 6577.2 80.99 2494.8 30.72 8.61 0.7
8 0 0 99 374.22 0 90.81 0 34.44 8.61 0.75
9 0 0 89 336.42 0 101.01 0 38.31 8.6 0.79
10 30 113.4 109 412.02 6577.2 98.44 2494.8 37.34 8.6 0.94
11 0 0 98 370.44 0 109.49 0 41.53 8.6 1.11
12 70 264.6 160 604.8 15346.8 92.44 5821.2 35.06 8.69 1.17
13 0 0 153 578.34 0 96.67 0 36.67 8.65 1.1
14 0 0 144 544.32 0 102.71 0 38.96 8.61 0.96
15 0 0 139 525.42 0 106.40 0 40.36 8.62 1.03
16 0 0 138 521.64 0 107.17 0 40.65 8.61 1.02
17 0 0 125 472.5 0 118.32 0 44.88 8.63 1.09
18 0 0 114 430.92 0 129.74 0 49.21 8.63 1.13
19 10 37.8 119 449.82 2192.4 129.16 831.6 48.99 8.62 1.15
20 0 0 110 415.8 0 139.73 0 53.00 8.62 1.15
21 10 37.8 99 374.22 2192.4 161.11 831.6 61.11 8.63 1.22
22 30 113.4 120 453.6 6577.2 147.42 2494.8 55.92 8.62 1.25
23 0 0 109 412.02 0 162.29 0 61.56 8.62 1.29
24 0 0 95 359.1 0 186.21 0 70.63 8.61 1.34
25 30 113.4 121 457.38 6577.2 160.58 2494.8 60.91 8.62 1.35
26 0 0 110 415.8 0 176.64 0 67.00 8.63 1.34
27 0 0 99 374.22 0 196.26 0 74.44 8.61 1.37
28 30 113.4 117 442.26 6577.2 180.94 2494.8 68.63 8.6 1.32
29 0 0 107 404.46 0 197.85 0 75.05 8.6 1.38
30 0 0 97 366.66 0 218.25 0 82.78 8.6 1.43
31 30 113.4 117 442.26 6577.2 195.81 2494.8 74.27 8.61 1.39
32 0 0 107 404.46 0 214.11 0 81.21 8.6 1.42
33 30 113.4 126 476.28 6577.2 195.63 2494.8 74.21 8.6 1.46
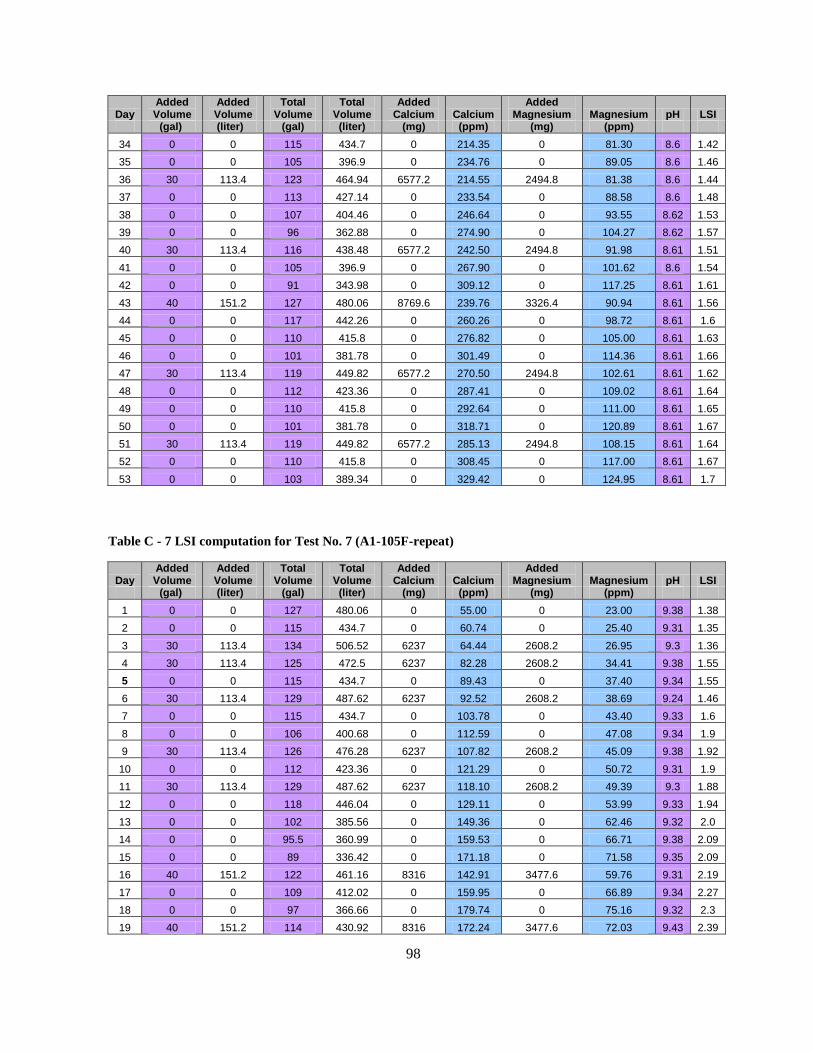
98
Day Added Volume
Added Volume
Total Volume
Total Volume
Added Calcium Calcium
Added Magnesium Magnesium pH LSI
(gal) (liter) (gal) (liter) (mg) (ppm) (mg) (ppm)
34 0 0 115 434.7 0 214.35 0 81.30 8.6 1.42
35 0 0 105 396.9 0 234.76 0 89.05 8.6 1.46
36 30 113.4 123 464.94 6577.2 214.55 2494.8 81.38 8.6 1.44
37 0 0 113 427.14 0 233.54 0 88.58 8.6 1.48
38 0 0 107 404.46 0 246.64 0 93.55 8.62 1.53
39 0 0 96 362.88 0 274.90 0 104.27 8.62 1.57
40 30 113.4 116 438.48 6577.2 242.50 2494.8 91.98 8.61 1.51
41 0 0 105 396.9 0 267.90 0 101.62 8.6 1.54
42 0 0 91 343.98 0 309.12 0 117.25 8.61 1.61
43 40 151.2 127 480.06 8769.6 239.76 3326.4 90.94 8.61 1.56
44 0 0 117 442.26 0 260.26 0 98.72 8.61 1.6
45 0 0 110 415.8 0 276.82 0 105.00 8.61 1.63
46 0 0 101 381.78 0 301.49 0 114.36 8.61 1.66
47 30 113.4 119 449.82 6577.2 270.50 2494.8 102.61 8.61 1.62
48 0 0 112 423.36 0 287.41 0 109.02 8.61 1.64
49 0 0 110 415.8 0 292.64 0 111.00 8.61 1.65
50 0 0 101 381.78 0 318.71 0 120.89 8.61 1.67
51 30 113.4 119 449.82 6577.2 285.13 2494.8 108.15 8.61 1.64
52 0 0 110 415.8 0 308.45 0 117.00 8.61 1.67
53 0 0 103 389.34 0 329.42 0 124.95 8.61 1.7
Table C - 7 LSI computation for Test No. 7 (A1-105F-repeat)
Day Added Volume
Added Volume
Total Volume
Total Volume
Added Calcium Calcium
Added Magnesium Magnesium pH LSI
(gal) (liter) (gal) (liter) (mg) (ppm) (mg) (ppm)
1 0 0 127 480.06 0 55.00 0 23.00 9.38 1.38
2 0 0 115 434.7 0 60.74 0 25.40 9.31 1.35
3 30 113.4 134 506.52 6237 64.44 2608.2 26.95 9.3 1.36
4 30 113.4 125 472.5 6237 82.28 2608.2 34.41 9.38 1.55
5 0 0 115 434.7 0 89.43 0 37.40 9.34 1.55
6 30 113.4 129 487.62 6237 92.52 2608.2 38.69 9.24 1.46
7 0 0 115 434.7 0 103.78 0 43.40 9.33 1.6
8 0 0 106 400.68 0 112.59 0 47.08 9.34 1.9
9 30 113.4 126 476.28 6237 107.82 2608.2 45.09 9.38 1.92
10 0 0 112 423.36 0 121.29 0 50.72 9.31 1.9
11 30 113.4 129 487.62 6237 118.10 2608.2 49.39 9.3 1.88
12 0 0 118 446.04 0 129.11 0 53.99 9.33 1.94
13 0 0 102 385.56 0 149.36 0 62.46 9.32 2.0
14 0 0 95.5 360.99 0 159.53 0 66.71 9.38 2.09
15 0 0 89 336.42 0 171.18 0 71.58 9.35 2.09
16 40 151.2 122 461.16 8316 142.91 3477.6 59.76 9.31 2.19
17 0 0 109 412.02 0 159.95 0 66.89 9.34 2.27
18 0 0 97 366.66 0 179.74 0 75.16 9.32 2.3
19 40 151.2 114 430.92 8316 172.24 3477.6 72.03 9.43 2.39
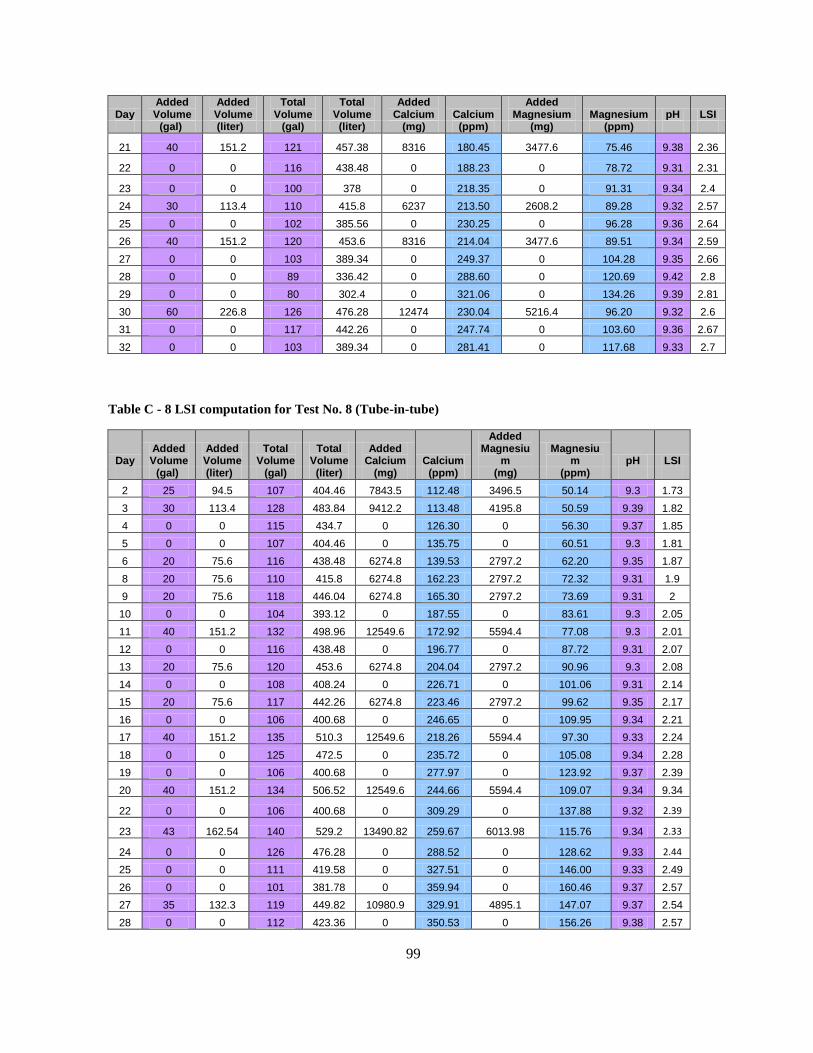
99
Day Added Volume
Added Volume
Total Volume
Total Volume
Added Calcium Calcium
Added Magnesium Magnesium pH LSI
(gal) (liter) (gal) (liter) (mg) (ppm) (mg) (ppm)
21 40 151.2 121 457.38 8316 180.45 3477.6 75.46 9.38 2.36
22 0 0 116 438.48 0 188.23 0 78.72 9.31 2.31
23 0 0 100 378 0 218.35 0 91.31 9.34 2.4
24 30 113.4 110 415.8 6237 213.50 2608.2 89.28 9.32 2.57
25 0 0 102 385.56 0 230.25 0 96.28 9.36 2.64
26 40 151.2 120 453.6 8316 214.04 3477.6 89.51 9.34 2.59
27 0 0 103 389.34 0 249.37 0 104.28 9.35 2.66
28 0 0 89 336.42 0 288.60 0 120.69 9.42 2.8
29 0 0 80 302.4 0 321.06 0 134.26 9.39 2.81
30 60 226.8 126 476.28 12474 230.04 5216.4 96.20 9.32 2.6
31 0 0 117 442.26 0 247.74 0 103.60 9.36 2.67
32 0 0 103 389.34 0 281.41 0 117.68 9.33 2.7
Table C - 8 LSI computation for Test No. 8 (Tube-in-tube)
Day Added Volume
Added Volume
Total Volume
Total Volume
Added Calcium Calcium
Added Magnesiu
m Magnesiu
m pH LSI (gal) (liter) (gal) (liter) (mg) (ppm) (mg) (ppm)
2 25 94.5 107 404.46 7843.5 112.48 3496.5 50.14 9.3 1.73
3 30 113.4 128 483.84 9412.2 113.48 4195.8 50.59 9.39 1.82
4 0 0 115 434.7 0 126.30 0 56.30 9.37 1.85
5 0 0 107 404.46 0 135.75 0 60.51 9.3 1.81
6 20 75.6 116 438.48 6274.8 139.53 2797.2 62.20 9.35 1.87
8 20 75.6 110 415.8 6274.8 162.23 2797.2 72.32 9.31 1.9
9 20 75.6 118 446.04 6274.8 165.30 2797.2 73.69 9.31 2
10 0 0 104 393.12 0 187.55 0 83.61 9.3 2.05
11 40 151.2 132 498.96 12549.6 172.92 5594.4 77.08 9.3 2.01
12 0 0 116 438.48 0 196.77 0 87.72 9.31 2.07
13 20 75.6 120 453.6 6274.8 204.04 2797.2 90.96 9.3 2.08
14 0 0 108 408.24 0 226.71 0 101.06 9.31 2.14
15 20 75.6 117 442.26 6274.8 223.46 2797.2 99.62 9.35 2.17
16 0 0 106 400.68 0 246.65 0 109.95 9.34 2.21
17 40 151.2 135 510.3 12549.6 218.26 5594.4 97.30 9.33 2.24
18 0 0 125 472.5 0 235.72 0 105.08 9.34 2.28
19 0 0 106 400.68 0 277.97 0 123.92 9.37 2.39
20 40 151.2 134 506.52 12549.6 244.66 5594.4 109.07 9.34 9.34
22 0 0 106 400.68 0 309.29 0 137.88 9.32 2.39
23 43 162.54 140 529.2 13490.82 259.67 6013.98 115.76 9.34 2.33
24 0 0 126 476.28 0 288.52 0 128.62 9.33 2.44
25 0 0 111 419.58 0 327.51 0 146.00 9.33 2.49
26 0 0 101 381.78 0 359.94 0 160.46 9.37 2.57
27 35 132.3 119 449.82 10980.9 329.91 4895.1 147.07 9.37 2.54
28 0 0 112 423.36 0 350.53 0 156.26 9.38 2.57
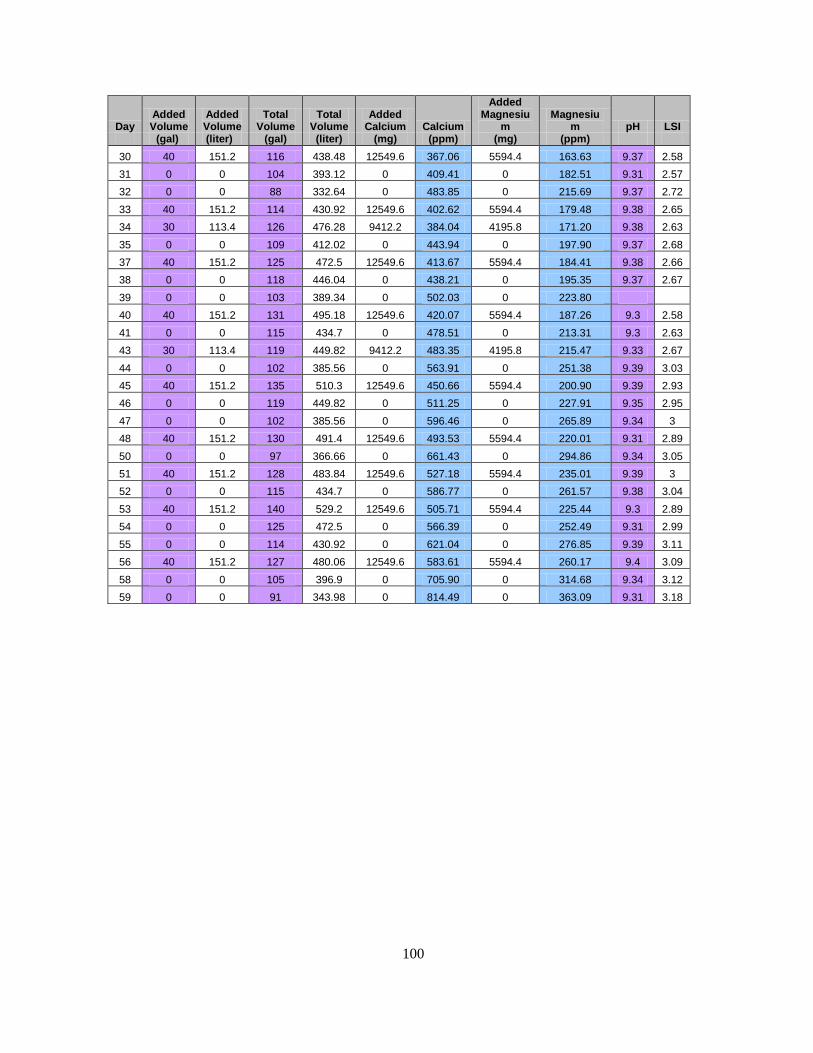
100
Day Added Volume
Added Volume
Total Volume
Total Volume
Added Calcium Calcium
Added Magnesiu
m Magnesiu
m pH LSI (gal) (liter) (gal) (liter) (mg) (ppm) (mg) (ppm)
30 40 151.2 116 438.48 12549.6 367.06 5594.4 163.63 9.37 2.58
31 0 0 104 393.12 0 409.41 0 182.51 9.31 2.57
32 0 0 88 332.64 0 483.85 0 215.69 9.37 2.72
33 40 151.2 114 430.92 12549.6 402.62 5594.4 179.48 9.38 2.65
34 30 113.4 126 476.28 9412.2 384.04 4195.8 171.20 9.38 2.63
35 0 0 109 412.02 0 443.94 0 197.90 9.37 2.68
37 40 151.2 125 472.5 12549.6 413.67 5594.4 184.41 9.38 2.66
38 0 0 118 446.04 0 438.21 0 195.35 9.37 2.67
39 0 0 103 389.34 0 502.03 0 223.80
40 40 151.2 131 495.18 12549.6 420.07 5594.4 187.26 9.3 2.58
41 0 0 115 434.7 0 478.51 0 213.31 9.3 2.63
43 30 113.4 119 449.82 9412.2 483.35 4195.8 215.47 9.33 2.67
44 0 0 102 385.56 0 563.91 0 251.38 9.39 3.03
45 40 151.2 135 510.3 12549.6 450.66 5594.4 200.90 9.39 2.93
46 0 0 119 449.82 0 511.25 0 227.91 9.35 2.95
47 0 0 102 385.56 0 596.46 0 265.89 9.34 3
48 40 151.2 130 491.4 12549.6 493.53 5594.4 220.01 9.31 2.89
50 0 0 97 366.66 0 661.43 0 294.86 9.34 3.05
51 40 151.2 128 483.84 12549.6 527.18 5594.4 235.01 9.39 3
52 0 0 115 434.7 0 586.77 0 261.57 9.38 3.04
53 40 151.2 140 529.2 12549.6 505.71 5594.4 225.44 9.3 2.89
54 0 0 125 472.5 0 566.39 0 252.49 9.31 2.99
55 0 0 114 430.92 0 621.04 0 276.85 9.39 3.11
56 40 151.2 127 480.06 12549.6 583.61 5594.4 260.17 9.4 3.09
58 0 0 105 396.9 0 705.90 0 314.68 9.34 3.12
59 0 0 91 343.98 0 814.49 0 363.09 9.31 3.18
VITA
Xiaoxiao Wu
Candidate for the Degree of
Master of Science
Thesis: EXPERIMENTAL AND THEORETICAL STUDY OF WATER SIDE
FOULING THERMAL PERFORMANCE OF REFRIGERANT TO WATER CONDENSERS
Major Field: Mechanical and Aerospace Engineering
Biographical: From the city of Changchun, China; daughter of Yi Wu and Xiaojuan Li
Education:
Completed the requirements for the Master of Science in Mechanical & Aerospace
Engineering at Oklahoma State University, Stillwater, Oklahoma in December, 2013
Completed the requirements for the Master of Engineering in Heating, Ventilation &
Air Conditioning at Donghua University, Shanghai, China in March, 2010
Completed the requirements for the Bachelor of Sciences in Heating, Ventilation & Air
Conditioning at Donghua University, Shanghai, China in July, 2007
Experience:
-Worked in Mechanical & Aerospace Engineering department at Oklahoma State
University as a graduate research assistant and teaching assistant
-Worked in Environmental Science & Engineering department at Donghua University
as graduate research assistant and counseling assistant
-Worked in Shanghai Research Institute of Building Science as engineering intern
Professional Memberships:
-American Society of Heating, Refrigeration and Air-conditioning (ASHRAE) student
member