Experimental and Theoretical Infrared Signatures of REMO3 ...
26
HAL Id: hal-01795854 https://hal.univ-lorraine.fr/hal-01795854 Submitted on 13 Jun 2019 HAL is a multi-disciplinary open access archive for the deposit and dissemination of sci- entific research documents, whether they are pub- lished or not. The documents may come from teaching and research institutions in France or abroad, or from public or private research centers. L’archive ouverte pluridisciplinaire HAL, est destinée au dépôt et à la diffusion de documents scientifiques de niveau recherche, publiés ou non, émanant des établissements d’enseignement et de recherche français ou étrangers, des laboratoires publics ou privés. Experimental and Theoretical Infrared Signatures of REMO3 (RE = La, Pr, Nd, Sm, and M = Co, Fe) Perovskites Émile Haye, Erwan André, Fabien Capon, Silvère Barrat, Marco de la Pierre, Roberto Dovesi, Cédric Carteret To cite this version: Émile Haye, Erwan André, Fabien Capon, Silvère Barrat, Marco de la Pierre, et al.. Experimental and Theoretical Infrared Signatures of REMO3 (RE = La, Pr, Nd, Sm, and M = Co, Fe) Perovskites. Journal of Physical Chemistry C, American Chemical Society, 2018, 122 (19), pp.10519 - 10525. 10.1021/acs.jpcc.8b01433. hal-01795854
Transcript of Experimental and Theoretical Infrared Signatures of REMO3 ...

HAL Id: hal-01795854https://hal.univ-lorraine.fr/hal-01795854
Submitted on 13 Jun 2019
HAL is a multi-disciplinary open accessarchive for the deposit and dissemination of sci-entific research documents, whether they are pub-lished or not. The documents may come fromteaching and research institutions in France orabroad, or from public or private research centers.
L’archive ouverte pluridisciplinaire HAL, estdestinée au dépôt et à la diffusion de documentsscientifiques de niveau recherche, publiés ou non,émanant des établissements d’enseignement et derecherche français ou étrangers, des laboratoirespublics ou privés.
Experimental and Theoretical Infrared Signatures ofREMO3 (RE = La, Pr, Nd, Sm, and M = Co, Fe)
PerovskitesÉmile Haye, Erwan André, Fabien Capon, Silvère Barrat, Marco de la Pierre,
Roberto Dovesi, Cédric Carteret
To cite this version:Émile Haye, Erwan André, Fabien Capon, Silvère Barrat, Marco de la Pierre, et al.. Experimentaland Theoretical Infrared Signatures of REMO3 (RE = La, Pr, Nd, Sm, and M = Co, Fe) Perovskites.Journal of Physical Chemistry C, American Chemical Society, 2018, 122 (19), pp.10519 - 10525.�10.1021/acs.jpcc.8b01433�. �hal-01795854�

1
Experimental and Theoretical Infrared Signatures of
REMO3 (RE = La, Pr, Nd, Sm and M = Co, Fe)
Perovskites
Emile HAYE1, Erwan ANDRE*
2, Fabien CAPON
1, Silvère BARRAT
1, Marco DE LA PIERRE
3,
Roberto DOVESI4, Cédric CARTERET
2
1Institut Jean Lamour, UMR 7198, CNRS-Université de Lorraine, Parc de Saurupt 54011 Nancy
Cedex, FRANCE.
2Laboratoire de Chimie Physique et Microbiologie pour les Matériaux et l’Environnement,
UMR7564, 405 Rue de Vandoeuvre, 54601 Villers-lès-Nancy, FRANCE.
3Curtin Institute for Computation, School of Molecular and Life Sciences, Curtin University,
P.O. Box U1987, Perth, WA 6845, AUSTRALIA.
4Dipartimento di Chimica, Università di Torino and NIS (Nanostructured Interfaces and
Surfaces) Center of Excellence, Via P. Giuria 7, 10125 Torino, ITALY.
Abstract
The aim of this work is to investigate the consequences of lattice distortion on the vibrational
features of rare earth perovskites. To this end, a series of REMO3 compounds has been
synthesized with different rare earths (RE = La, Pr, Nd, Sm) and different transition metals

2
(M=Fe, Co) in order to evaluate their respective role on lattice distortion. Thin films of these
materials have been deposited by magnetron co-sputtering in reactive mode and followed by an
annealing in air with the same experimental conditions. Characterizations including EDX
spectroscopy, X-Ray diffraction and FTIR have been completed by DFT periodic calculations in
order to investigate the octahedra tilt angles and to assign the vibrational spectra. The decrease of
RE radius enhances the distortion of the chains of octahedra that can be followed both through
the calculated mean tilt angle and experimentally by the profile of the M-O-M bending region.
The magnitude of the distortion depends on the dimension of the cuboctahedric site hosting the
RE that is controlled by the M radius.
Introduction The ABX3 perovskite structure is the subject of a huge number of studies firstly on inorganic
perovskites,1–4
and more recently on organic perovskites5–7
. The fascination with this structure is
explained by its incredible capacity to accommodate elements of different nature that allows
them to be used in numerous smart applications, as piezoelectric, dielectric, magnetic, catalytic
or thermochromic materials.
Among the perovskites family, rare-earth cobaltites and orthoferrites (RECoO3 and REFeO3
with RE = Rare Earth) have recently raised a large interest in the scientific community for their
application in water splitting and photocatalytic activity8–12
. Their structure and their electronic
properties can be tuned depending on the size of A-cations, and the electronic state of the
transition metal B, that will influence the bandgap and the photocatalytic properties. In addition,
they present a good stability, which make them promising candidate for future production of
hydrogen. By playing with the nature of A and B cations, it is possible to tune these properties.

3
The crystal structure of REMO3 systems (with RE = La, Pr, Nd, Sm and M = Fe, Co) presents
a distortion with respect to an ideal cubic perovskite. Almost all of these compounds crystallize
in an orthorhombic lattice (space group Pnma), except for LaCoO3, which presents a
rhombohedral lattice (space group R3̅c). All these systems can be seen as a stacking of MO6
octahedra surrounded by RE atoms in cuboctahedric sites (see Figure 1). As the size of RE is too
small to fill the site, octahedra stacking is affected. The resulting lattice distortion is correlated
with a decrease of the M-O-M mean angle α, which drives interatomic interactions of oxygen 2p
and iron or cobalt 3d electrons responsible of the electro-optical properties of these materials.
Figure 1. Representation of the orthorhombic structure of REMO3. α1 and α2 are the distortion
angles of the chains of octahedra.
In order to link the chemical properties of these materials to the perovskite structure, XRD
measurements are widely used. However, such method presents a limited use on nanomaterials
or thin films, which are their most common forms for energy applications. Infrared spectroscopy
ca
b
c
ab
α1
MO6
REα2

4
(IR) is a simple and widespread method that can be used to probe the structural features of a
system at different scales, by studying its vibrational signatures.
The vibrational properties (experimental and theoretical) of REFeO3 and RECoO3 systems
have been discussed over the years13–20
, but most of the work found in the literature focuses only
on one or two specific compounds. Only two studies explore the effect of lattice distortion
brought by the RE3+
cation on the vibrational features of these systems: Sudheendra et al.21
followed the thermal evolution of the infrared signatures of RECoO3 (RE=La, Pr, Nd) systems,
while Weber et al.22
focused on the attribution of the Raman signatures of REFeO3 (RE = La,
Sm, Eu, Gd, Tb, Dy) systems. However both of these studies focus only on the role of the A3+
cation and none of them considered that of the B3+
cation.
A previous work of some of the present authors23,24
has brought out the evolution of electrical
and optical properties in the RECoO3 (RE = La, Nd, Sm) and REFeO3 (RE = La, Pr, Nd, Sm)
series, respectively. Although the modification of the Infrared features has been highlighted in
these series, the complexity of the spectra (broad bands with multiple contributions) prevented a
full exploitation of the vibrational information.
In the present work, we aim to investigate by Infrared spectroscopy the influence of lattice
deformation brought by substitution in both A and B sites of REMO3 perovskite systems (RE =
La, Pr, Nd, Sm and M = Co, Fe). The experimental data will be complemented by the simulation
of theoretical spectra, calculated in the framework of density functional theory (DFT). This joint
approach will make it possible to put in relation the structural and the vibrational modifications.
Experimental details REMO3 (RE = La, Pr, Nd, Sm and M = Fe, Co) thin films were synthesized in a 40 dm
3
sputtering chamber in base vacuum of about 10-5
Pa, achieved by primary and turbomolecular
5
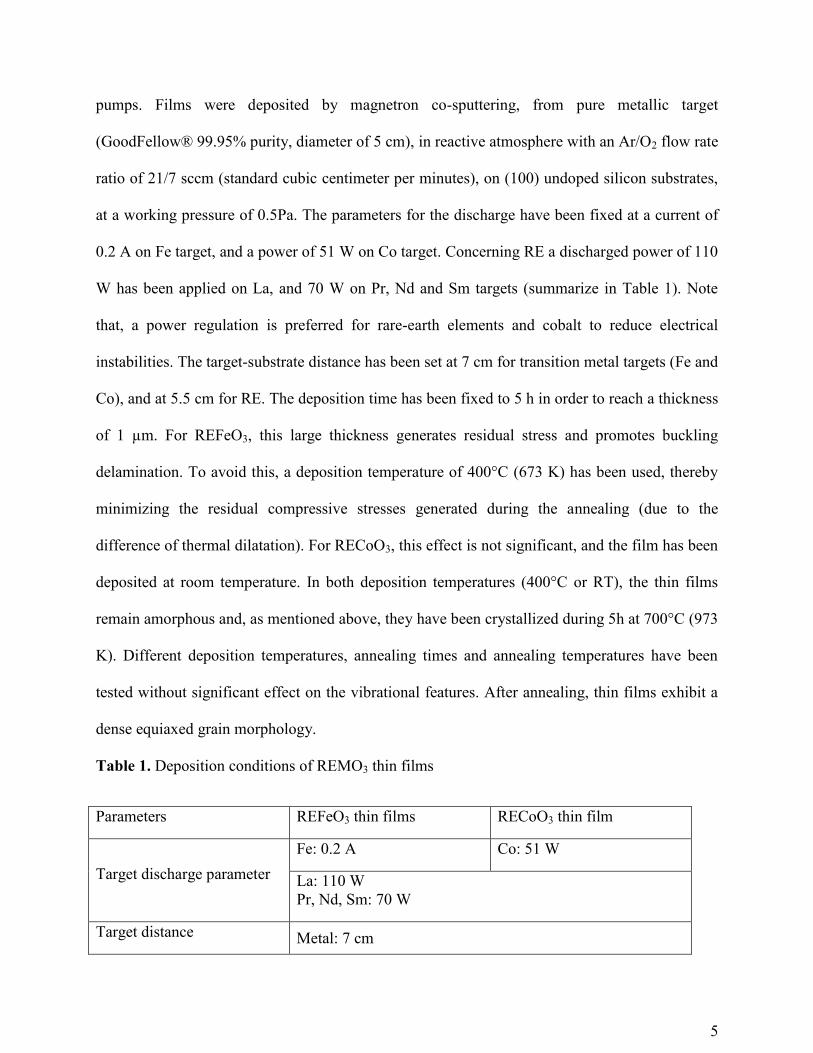
pumps. Films were deposited by magnetron co-sputtering, from pure metallic target
(GoodFellow® 99.95% purity, diameter of 5 cm), in reactive atmosphere with an Ar/O2 flow rate
ratio of 21/7 sccm (standard cubic centimeter per minutes), on (100) undoped silicon substrates,
at a working pressure of 0.5Pa. The parameters for the discharge have been fixed at a current of
0.2 A on Fe target, and a power of 51 W on Co target. Concerning RE a discharged power of 110
W has been applied on La, and 70 W on Pr, Nd and Sm targets (summarize in Table 1). Note
that, a power regulation is preferred for rare-earth elements and cobalt to reduce electrical
instabilities. The target-substrate distance has been set at 7 cm for transition metal targets (Fe and
Co), and at 5.5 cm for RE. The deposition time has been fixed to 5 h in order to reach a thickness
of 1 µm. For REFeO3, this large thickness generates residual stress and promotes buckling
delamination. To avoid this, a deposition temperature of 400°C (673 K) has been used, thereby
minimizing the residual compressive stresses generated during the annealing (due to the
difference of thermal dilatation). For RECoO3, this effect is not significant, and the film has been
deposited at room temperature. In both deposition temperatures (400°C or RT), the thin films
remain amorphous and, as mentioned above, they have been crystallized during 5h at 700°C (973
K). Different deposition temperatures, annealing times and annealing temperatures have been
tested without significant effect on the vibrational features. After annealing, thin films exhibit a
dense equiaxed grain morphology.
Table 1. Deposition conditions of REMO3 thin films
Parameters REFeO3 thin films RECoO3 thin film
Target discharge parameter
Fe: 0.2 A Co: 51 W
La: 110 W
Pr, Nd, Sm: 70 W
Target distance Metal: 7 cm
6
RE: 5.5 cm
Flow rate Ar/O2 21/7 sccm
Deposition pressure 0.5 Pa
Deposition time 5h
Deposition temperature 400°C Room temp.
Annealing 700°C – 5h, in air
The structure of the films has been analyzed by X-ray diffraction on a Bruker D8
diffractometer, with 2/2θ Bragg-Bentano geometry (Cu Kα = 1.54056 Å), at room temperature.
Due to a slight texturation of the film, a complete Rietveld refinement could not be performed.
However, precise lattice parameters could be obtained from the XRD measurement. Structure
refinement has been done using FullProf software, with 11 parameters, including background,
zero, scale, lattice parameter and peak shape coefficients.
The infrared spectra in the range 30-700 cm-1
was recorded in transmission mode by
accumulating 200 scans with a resolution of 4 cm-1
using a Nicolet 8700 Fourier transform
infrared spectrometer with a Globar source, a DTGS-PE detector and a solid substrate beam
splitterTM
. A Si wafer was used as reference sample.
Computational details Calculations were performed with the CRYSTAL14 periodic ab initio code,
25,26 by using the
hybrid PBE0 functional27
that has been shown to provide reliable results for the structural and
electronic properties of perovskites systems.28
All electron basis sets have been used to describe
non lanthanoids atoms with a contraction scheme of (8s)-(6411sp)-(411d)-(1f) for Fe and Co,
and (8s)-(51sp)-(1d) for O. The exponents (in bohr-2
) of the most diffuse functions are αsp = 0.60,
αd = 0.22, αf = 0.70 for Co, αsp = 0.55 and αd = 0.25, αf = 0.70 for Fe and αsp = 0.185 and αd =

7
0.50 for O. In the case of Lanthanoids, pseudopotentials29–32
have been used to describe core and
f electrons. They are combined with different basis sets that we have reoptimized for the purpose
of calculation in crystals. Contraction schemes for La, Pr, Nd and Sm valence electron basis sets
are the following: (311s)-(211p)-(21d). The exponents (in bohr-2
) of the most diffuse functions
are: αs = 0.17, αp = 0.25 and αd = 0.40 for La ; αs = 0.22, αp = 0.25 and αd = 0.32 for Pr ; αs =
0.29, αp = 0.25 and αd = 0.30 for Nd ; αs = 0.28, αp = 0.27 and αd = 0.32 for Sm.
The level of accuracy in evaluating the Coulomb and Hartree-Fock exchange series is
controlled by five parameters,25
for which the 8 8 8 10 20 values were used. The threshold on the
SCF energy (SCF: self-consistent field) was set to 10-8
Ha for the geometry optimization and 10-
10 Ha for the frequency calculation. The reciprocal space was sampled according to a sublattice
with shrinking factor set to 8 (along the 3 lattice vectors), corresponding to 170 independent k
vectors in the irreducible part of the Brillouin zone. The DFT exchange-correlation contribution
is evaluated by numerical integration through a (75,974) pruned grid (XLGRID keyword) over
the unit cell volume.
The presence of Fe(III) and Co(III) in the studied compounds raises the question of their spin
state, and at longer range, the question of spin ordering between M centers in those structures.
For the construction of all model structures in this work, we decided to only consider the low
temperature case (0 K). In this case, the preferred spin state of Fe (d5) is HS and the one of Co
(d6) is LS, the calculated atomic magnetic moments obtained after optimization for the different
compounds remain close to ideal values (4.24 μB for Fe and 0.00 μB for Co) and are not affected
by lattice distortion. To model different spin ordering in REFeO3, the lattice symmetry has been
reduced from Pnma (space group n°62) to P21/c (space group n°14). Different spin distributions
have been considered for Fe (FM, A-AFM, C-AFM and G-AFM). For all studied compounds,

8
the most stable structure is for a G-AFM ordering, which will be the only case presented in this
work. One should mention though that the structural parameters remain close to those calculated
in Pnma (<1 % difference).
The calculation of vibrational frequencies at the Γ point is performed within the harmonic
approximation. Integrated intensities for IR absorption are evaluated through the Berry phase
approach.33
Spectra are reconstructed from the calculated frequencies and intensities by
superposition of pseudo-Voigt functions with a constant FWHM of 10 cm-1
. To evaluate the
contributions of the different atoms to the normal modes, isotopic substitutions have also been
realized for LaFeO3: The mass of Fe and O atoms (at each Wyckoff position i.e 4c and 8d of the
Pnma space group) has been raised by 20% while the one of La has been increased from 139 to
10 000 u in order to remove all coupling with other modes and thus reveal its participation in
those modes. For each substitution, the IR spectrum is reconstructed from the same Hessian
matrix than the former calculation.
Results and discussion
Crystal structure of REMO3
The first step of this work is to construct reliable model structures from which the infrared data
will be calculated. The experimental XRD patterns are reported on Figure 2. Only peaks
corresponding to perovskite are detected in all REMO3 corresponding to orthorhombic crystal
structures except for LaCoO3, which crystallize in rhombohedral system. As the RE atomic
radius decreases (from La to Sm), peaks splitting is observed due to higher distortion of the
system. This effect is more visible on ferrite system, where 21 diffraction peaks are identified in
SmFeO3, while only 12 peaks are detected for LaFeO3 film.

9
Figure 2. Experimental XRD patterns of REFeO3 and RECoO3 thin films
As mentioned previously, a complete Rietveld refinement with atomic positions and angles
determination cannot be performed due to slight texturation of the film. Indeed, texturation
influences the peak intensity, which is used to determine the atomic peak positions. However,
since lattice parameters are only related to peak positions (in 2θ), their precise determination can
be performed. Experimental lattice parameters are reported in Table 2 and are compared to the
optimized crystal parameters calculated in DFT. For sake of comparison, selected data obtained
from the literature are also reported.
Table 2. Crystal parameters for ReMO3 perovskites in space group Pnma (n°62) except for
LaCoO3 (R�̅�c, n°167, hexagonal axes).

10
Lattice parameters (in Å), α mean distortion angle (in °), and extremum values of M-O
distances d(M-O) (in Å). (i), (j) and (k) are reported from ref 34
, 35
and 36
respectively.
A very good agreement between theoretical and experimental results is observed (about 1%
difference on average) except for LaCoO3, for which the c parameter is calculated shorter than
what has been measured. This parameter is known to be very sensitive to the temperature35
as the
spin state of Co undergo a spin transition from low to intermediate spin state (LS-IS) above 100
K. However it is not possible to model the IS state with a monodeterminental approach37
. This
limits our model to the LS case, corresponding to a structure at 0 K. The data from the neutron
diffraction study of Bull et al.35
reported in Table 2 are those measured at 300 K (to be
comparable to the other compounds), but the parameters have also been measured at 4 K (a =
5.42 Å and c = 12.98 Å) which are in good agreement with the calculated results.
In the Pnma space group, REMO3 structure contains two non-equivalent oxygen atoms located
in Wyckoff sites 4c and 8d that lead to two different M-O-M angles. However, calculated
differences between those two angles are never larger than 3°. Thus for the sake of clarity, only
the mean values of the distortion angle (α) are reported in Table 2. This angle is a good indicator
LaFeO3 PrFeO3 NdFeO3 SmFeO3 LaCoO3 PrCoO3 NdCoO3 SmCoO3
Theo 5.55 5.60 5.60 5.61 5.37 5.29 5.29 5.28
a Exp 5.57 5.61 5.60 5.62 5.38 5.36 5.33 5.31
Ref 5.56 (i) 5.57 (i) 5.59 (i) 5.59 (i) 5.44 (j) 5.34 (k) 5.33 (k) 5.35 (k)
Theo 7.83 7.79 7.79 7.73 - 7.53 7.53 7.50
b Exp 7.86 7.81 7.82 7.72 - 7.59 7.55 7.50
Ref 7.86 (i) 7.79 (i) 7.76 (i) 7.71 (i) - 7.58 (k) 7.55 (k) 7.50 (k)
Theo 5.57 5.51 5.50 5.44 13.00 5.38 5.38 5.32
c Exp 5.57 5.48 5.51 5.46 13.31 5.38 5.34 5.27
Ref 5.55 (i) 5.48 (i) 5.45 (i) 5.40 (i) 13.10 (j) 5.38 (k) 5.35 (k) 5.29 (k)
α Theo 159.5 154.2 154.0 151.0 169.2 162.0 161.8 158.1
d(M-O)min Theo 1.99 2.00 2.00 2.00 1.90 1.91 1.91 1.91
d(M-O)max Theo 1.99 2.01 2.01 2.02 1.90 1.91 1.91 1.91

11
of the lattice deformation: In a cubic system, α is equal to 180° and as its value diminishes, the
system becomes more and more distorted. As expected for both RECoO3 and REFeO3 systems, a
decrease of the RE ionic radius (from La to Sm) is correlated with a reduction of α calculated
values. On the contrary, when the M ionic radius decreases (from Fe to Co) an increase of α is
observed. As M-O bonds get shorter (from ~2 Å for Fe-O to ~1.9 Å for Co-O), the size of the
cuboctahedric site diminishes and it becomes more adapted to the RE. So by changing the nature
of RE and M cations, one can span over 19° of distortion, from the least distorted structure
LaCoO3 to the most distorted one SmFeO3.
Vibrational analysis of REFeO3
The first results presented here are the substitution of A cation in REFeO3. In the conditions
where experimental spectra have been recorded (298K, 1 atm) all the compounds of this series
are in the same spin state (HS state for Fe atoms with G-AFM ordering) and crystallize in the
same space group (Pnma). Their IR spectra will thus possess the same number of active normal
modes, which will ease their comparison.
In cubic (Pm3̅m) ABO3 perovskites there is only 3 IR active modes (Γ = 3 T1u) corresponding
to B-O stretching, B-O-B bending, and the displacement of A relative to B-O lattice. If cation A
is too small, the BO6 chains of octahedra are distorted, and the symmetry lowering from Oh to
D2h leads to a higher number of active modes. The selection rules for these orthorhombic
perovskites in Pnma symmetry38
give the irreducible representation: Γ = 9 B1u + 7 B2u + 9 B3u for
a total of 25 active modes in IR (calculated wavenumbers and intensities are reported in S.I, in
Table S1). In the experimental IR spectrum these vibration modes are not well separated and
form bands of complex shape, as can be seen in case of LaFeO3 reported in Figure 3. In order to
assign this spectrum, simulated spectra corresponding to cubic and orthorhombic structures are
also reported. To complete this figure, isotopic substitutions have been realized for the different

12
atoms of the Pnma cell (in which La, Fe, O1 and O2 occupy the Wyckoff sites 4c, 4b, 4c and 8d
respectively). The bands influenced by the isotopic substitution have been assigned accordingly
(the simulated spectra corresponding to these isotopic substitutions can be found in S.I. in Figure
S1). The general agreement between the experimental and the theoretical spectra is good. For
this reason the description of the vibrational features (and in particular the mentioned
wavenumbers) will focus mainly on the experimental data, while the theoretical data will be used
to refine the attribution.
Figure 3. Infrared spectra of LaFeO3. Comparison between experimental (a) spectra and those
calculated for orthorhombic (b) and cubic (c) structures. Modes are labelled according to their
type and to the main atom involved.
The three groups of vibration modes are affected quite differently by the lattice deformation.
The Fe-O stretching group is redshifted. It is split into two main contributions (although only one
100 200 300 400 500 600 700
100 50 33 25 20 17 14
Wavelength (µm)
IR a
bso
rptio
n
Wavenumber (cm-1)
(b)
(a)
La
Fe + O8d
Fe + O4c + O8dO8d
Fe + O4c
La + O4c + Fe
La
translations
Fe-O-Fe
bending
Fe-O
stretching(c)
O4c + O8d

13
band is resolved on the experimental spectrum), depending on the nature of the Fe-O elongation
considered: in the (a,c) plane (main contribution of O8d) for the highest wavenumbers
(�̅� > 550 cm-1
) and along b direction (main contribution of O4c) for the lowest wavenumbers
(�̅� < 550 cm-1
). No coupling with La or Fe atoms is observed for these modes, we can then
consider them as almost “pure modes”. The group of La “translations” is more affected by the
deformation with a splitting (∆�̅�~52 cm-1
) between in phase or antiphase La - La motions, with
the band corresponding to in phase modes (�̅� = 164 cm-1
) being the most intense. Finally, the
group of modes that is most affected by the lattice deformation is the group corresponding to
combinations of Fe-O-Fe bending modes that split into a band of complex shape, spread over
200 cm-1
. The 3 resolved bands observed in the experimental spectrum correspond to 14
vibrational modes, grouped in 7 bands in the theoretical spectrum. The most intense signal
(measured at 270 cm-1
) is similar to the T1u bending mode of a cubic perovskite; it corresponds to
vibration modes where Fe-O-Fe deformations of the different octahedra are all in phase. These
deformations can be considered as “internal mode”. On the contrary in the bands located at
higher wavenumbers (322 cm-1
to 400 cm-1
), the deformations of the different octahedra are not
in phase. These modes can be considered as sort of “external mode” and be described as
deformations of the chains of octahedra.
In order to follow the modifications of the vibrational features of this system as the lattice
deformation increases, experimental and theoretical IR spectra of the REFeO3 series are
displayed in Figure 4a and 4c respectively. Theoretical spectra reproduce correctly the evolutions
of experimental spectra along the REFeO3 series, allowing the characterization of the spectral
modifications. As mentioned in the previous section, numerical values correspond to the
experimental data (unless specified otherwise). In Figure 4a, almost no modification is observed

14
for the Fe-O stretching modes (500 - 600 cm-1
). A small shift toward the low wavenumbers
(∆�̅�~10 cm-1
) is observed as well as a decrease in intensity of the Fe-O8d stretching modes.
Focusing now on the group of RE translations, one can observe that in phase translation modes
(150 - 200 cm-1
) are slightly blueshifted (∆�̅�~8 cm-1
). For these modes, two competing effects
are in play as RE evolves from La to Sm : (i) The increase of RE mass should induce a redshift,
while (ii) the decrease of the cation’s radius give it more freedom of movement in the
cuboctahedric site that should induce a blueshift. Hence the trend observed in the experimental
spectra reveals that the second effect (ii) is dominant here. This is not the case for the calculated
spectra where a slight redshift (∆�̅�~8 cm-1
) is predicted. This highlights the tendency, in the
computational model, to underestimate the interactions between RE and its surrounding cage. As
a final comment for this region, a shoulder is observed at �̅�~155 cm-1
in the SmFeO3 spectrum.
This band corresponds to an out-of-phase translation mode of FeO6 octahedra planes collinear to
(a,c) directions. Its position is not influenced by the nature of RE, but in LaFeO3 it overlaps with
the band corresponding to La in phase translation modes.
The spectral region corresponding to Fe-O-Fe bending modes (220 - 420 cm-1
) is, as expected,
the most sensitive to lattice deformations. As they increase along the series from La to Sm, the
intense band corresponding to “internal” deformation modes is split in two contributions. Modes
corresponding to motion in the (a,c) plane shift from 270 cm-1
in LaFeO3 to 240 cm-1
in SmFeO3,
while the mode corresponding to Fe translation in the b direction remains essentially at the same
position (slight blueshift ∆�̅�~5 cm-1
). But the most visible effect of the lattice deformation is
observed for the “external” deformation modes of the octahedra strings (300 - 420 cm-1
). All
these modes are up shifted (∆�̅�~15 cm-1
from LaFeO3 to SmFeO3) and they become more and

15
more resolved in the experimental spectra, until every band present in the corresponding
calculated spectrum is resolved.
Figure 4. Infrared spectra of REMO3. Comparison between experimental (a,b) and simulated
(c,d) data.
Fe or Co in B site
SmFeO3 is the most distorted system considered in this study. It can be used as a reference
compound to study the influence of B cation on REMO3 vibrational signature. Changing the
100 200 300 400 500 600 700
100 50 33 25 20 17 14Wavelength (µm)
Wavenumber (cm-1)
IR a
bsorp
tion
100 200 300 400 500 600 700
100 50 33 25 20 17 14Wavelength (µm)
IR a
bsorp
tion
Wavenumber (cm-1)
100 200 300 400 500 600 700
100 50 33 25 20 17 14
Wavelength (µm)
IR a
bso
rptio
n
Wavenumber (cm-1)
100 200 300 400 500 600 700
100 50 33 25 20 17 14
Wavelength (µm)
IR a
bso
rptio
n
Wavenumber (cm-1)
LaCoO3
PrCoO3
NdCoO3
SmCoO3
LaFeO3
PrFeO3
NdFeO3
SmFeO3
b)a)
d)c)
LaCoO3
PrCoO3
NdCoO3
SmCoO3
LaFeO3
PrFeO3
NdFeO3
SmFeO3

16
transition-metal Fe by Co in SmMO3, the lattice distortion will decrease without changing the
system symmetry or the number of active modes (and their nature). The shifts calculated for
these different modes when passing from SmFeO3 to SmCoO3 are shown in Figure 5.
Figure 5. Relations between modes calculated of SmFeO3 and SmCoO3.
Only small modifications are observed in the M-O stretching region (450 - 600 cm-1
). Since
Co-O bonds are shorter than the Fe-O ones, this band is blueshifted (by 20 cm-1
in the theoretical
spectrum, and 30 cm-1
in the experimental one in Figure 4b). As the α deformation angle is
getting closer to 180° in SmCoO3, the difference between O8d and O4c is reduced and the two
bands calculated for SmFeO3 merge in SmCoO3 (bandwidths in the experimental spectra, Figure
4b, do not allow to observe this phenomenon). In the region corresponding to Sm translation
modes (100 - 200 cm-1
) the main modification is a blueshift of the two bands (~20 cm-1
for both
theoretical and experimental spectra) that is due to the smaller size of the cuboctahedric site and
100 200 300 400 500 600 700
100 50 33 25 20 17 14Wavelength (µm)
IR a
bsorb
ption
Wavenumber (cm-1)
SmFeO3
SmCoO3
Sm
O4c + O8d + Co
Sm + Co
O4c + Co
O8d + Co

17
hence a stronger coupling with the cage of MO6 octahedra. The region corresponding to M-O-M
bending modes is simplified as the α angle increases. Modes with a strong M contribution
(almost all “internal modes”) form a group of three bands located between 300 cm-1
and 400 cm-1
while modes corresponding to deformations of the chains of octahedra (“external modes”) merge
into a separate group that is upshifted close the stretching mode region (490 and 497 cm-1
in the
theoretical and the experimental spectra respectively). The position of this last band is the most
sensitive to the lattice deformation as it can also be seen in the spectra of the RECoO3 series
reported Figure 4b and 4d. The trends described for the different spectral region in the REFeO3
series are still valid for RECoO3 whose spectrum is even more sensitive to RE substitution. In
particular, the band corresponding to chains deformation in the experimental spectra is redshifted
over 100 cm-1
between SmCoO3 and LaCoO3, compared to only 10 - 15 cm-1
along the iron
series. However, the interpretation of RECoO3 vibrational spectra is complicated by the presence
of a spin transition, for some of these compounds, near the temperature of analysis (298 K).
Indeed, it is known that LaCoO3, PrCoO3 and NdCoO3 undergo a LS-HS (or IS for LaCoO3) spin
transition around 100 K, 200 K and 300 K respectively.21,35,39
This means that if the experimental
IR spectrum of NdCoO3 can be considered as purely the one of LS, those of PrCoO3 and LaCoO3
are a mix of contributions coming from different spin states. In particular, the splitting of the Co-
O stretching region in LaCoO3 has been explained by Sudheendra et al.21
as a sum of
contributions coming from LS and IS states. From these results, one can assign the shoulder
observed (at ~600 cm-1
) in the stretching region of PrCoO3 and LaCoO3, to modes belonging to
higher spin states. This assignment is consistent with the fact that its relative intensity, with
respect to the other stretching modes, is higher in LaCoO3 than in PrCoO3. And finally, this band
is not present in the calculated spectra, for which only the fundamental spin state has been

18
considered. The position and the trend of the band corresponding to LS state (measured at 560
cm-1
in SmCoO3 and down shifting to 547 cm-1
in LaCoO3) are correctly modeled.
Conclusion In this work, thin films of REMO3 perovskites (RE=La, Pr, Nd, Sm; M= Co, Fe) have been
synthesized and characterized with the same experimental conditions. The crystallographic
parameters obtained from XRD refinement for the series are in good agreement with data present
in the literature and with data obtained by DFT calculations. The computational models of
REMO3 series give access to other indicators of the lattice deformation such as α, the mean angle
of chains distortion. It has been shown that this angle decreases along with the RE radius (from
LaMO3 to SmMO3) and highlights an increase of the lattice distortion. However when the M
radius decreases (from REFeO3 to RECoO3), the α angle increases and reveals a decrease of the
size of the cuboctahedric site. These structural modifications appear clearly on the vibrational
features of REMO3 and their assignment has been done by relying on comparison with simulated
spectra obtained from DFT periodic calculations. Lattice deformations due to the decrease of RE
size are characterized by a modification of bands corresponding to RE translation modes and
bands corresponding to M-O-M bending modes, both due to the bending of the MO6 chains of
octahedra. Symmetry lowering of RE environment creates a splitting of out-of-phase and in
phase translations modes, which is more important than the redshift due to the mass increase of
RE. The splitting of the M-O-M bending region is controlled by interactions between the chains
of octahedra, in phase modes are redshifted while out-of-phase modes are blueshifted. By
adjusting the dimensions of the cage of octahedra around RE, substitution of Fe3+
by Co3+
cations decreased the splitting of the perturbed regions, but amplified the influence of RE
substitution. The modes that are the most sensitive to RE substitution in RECoO3 systems are
19
antiphase bending of the chains of octahedra. Finally, comparison between experimental and
theoretical data made it possible in LaCoO3 and PrCoO3 to assign bands corresponding to excited
spin states.
ASSOCIATED CONTENT
Supporting Information. A file named Supporting_Informations.pdf is provided. It contains the
vibrational information (wavenumber, intensity, symmetry) calculated for the different REMO3
systems, as well as a figure picturing the effect of isotopic substitutions on LaFeO3 calculated IR
spectrum.
AUTHOR INFORMATION
Corresponding Author
Author Contributions
The manuscript was written through contributions of all authors. All authors have given approval
to the final version of the manuscript.
ACKNOWLEDGMENT
REFERENCES
(1) Zener, C. Interaction between the d -Shells in the Transition Metals. II. Ferromagnetic
Compounds of Manganese with Perovskite Structure. Phys. Rev. 1951, 82, 403–405.
(2) Kanamori, J. Superexchange Interaction and Symmetry Properties of Electron Orbitals. J.
Phys. Chem. Solids 1959, 10, 87–98.

20
(3) Cohen, R. E. Origin of Ferroelectricity in Perovskite Oxides. Nature 1992, 358, 136–138.
(4) Peña, M. A.; Fierro, J. L. G. Chemical Structures and Performance of Perovskite Oxides.
Chem. Rev. 2001, 101, 1981–2018.
(5) Kojima, A.; Teshima, K.; Shirai, Y.; Miyasaka, T. Organometal Halide Perovskites as
Visible-Light Sensitizers for Photovoltaic Cells. J. Am. Chem. Soc. 2009, 131, 6050–6051.
(6) Lee, M. M.; Teuscher, J.; Miyasaka, T.; Murakami, T. N.; Snaith, H. J. Efficient Hybrid
Solar Cells Based on Meso-Superstructured Organometal Halide Perovskites. Science 2012, 338,
643–647.
(7) Xing, G.; Mathews, N.; Sun, S.; Lim, S. S.; Lam, Y. M.; Gratzel, M.; Mhaisalkar, S.;
Sum, T. C. Long-Range Balanced Electron- and Hole-Transport Lengths in Organic-Inorganic
CH3NH3PbI3. Science 2013, 342, 344–347.
(8) Tijare, S. N.; Joshi, M. V.; Padole, P. S.; Mangrulkar, P. A.; Rayalu, S. S.; Labhsetwar,
N. K. Photocatalytic Hydrogen Generation through Water Splitting on Nano-Crystalline LaFeO3
Perovskite. Int. J. Hydrog. Energy 2012, 37, 10451–10456.
(9) Tijare, S. N.; Bakardjieva, S.; Subrt, J.; Joshi, M. V.; Rayalu, S. S.; Hishita, S.;
Labhsetwar, N. Synthesis and Visible Light Photocatalytic Activity of Nanocrystalline PrFeO3
Perovskite for Hydrogen Generation in Ethanol–Water System. J. Chem. Sci. 2014, 126, 517–
525.
(10) Meziani, D.; Reziga, A.; Rekhila, G.; Bellal, B.; Trari, M. Hydrogen Evolution under
Visible Light over LaCoO3 Prepared by Chemical Route. Energy Convers. Manag. 2014, 82,
244–249.

21
(11) Yu, Q.; Meng, X.; Wang, T.; Li, P.; Liu, L.; Chang, K.; Liu, G.; Ye, J. A Highly Durable
P-LaFeO3 /n-Fe2O3 Photocell for Effective Water Splitting under Visible Light. Chem Commun
2015, 51, 3630–3633.
(12) Emery, A. A.; Saal, J. E.; Kirklin, S.; Hegde, V. I.; Wolverton, C. High-Throughput
Computational Screening of Perovskites for Thermochemical Water Splitting Applications.
Chem. Mater. 2016, 28, 5621–5634.
(13) Romero, M.; Gómez, R. W.; Marquina, V.; Pérez-Mazariego, J. L.; Escamilla, R.
Synthesis by Molten Salt Method of the AFeO3 System (A=La, Gd) and Its Structural,
Vibrational and Internal Hyperfine Magnetic Field Characterization. Phys. B Condens. Matter
2014, 443, 90–94.
(14) Zhou, S.; Shi, L.; Zhao, J.; He, L.; Yang, H.; Zhang, S. Ferromagnetism in LaCoO3
Nanoparticles. Phys. Rev. B 2007, 76, 172407.
(15) Janaki, J.; Nithya, R.; Ganesamoorthy, S.; Sairam, T. N.; Ravindran, T. R.; Vinod, K.;
Bharathi, A. Study of Thermally Induced Spin State Transition in NdCoO3 Single Crystal AIP
Conf. Proc. 2013, 1512, 838–839.
(16) Chanda, S.; Saha, S.; Dutta, A.; Sinha, T. P. Raman Spectroscopy and Dielectric
Properties of Nanoceramic NdFeO3. Mater. Res. Bull. 2013, 48, 1688–1693.
(17) Saha, S.; Chanda, S.; Dutta, A.; Sinha, T. P. Dielectric Relaxation of PrFeO3
Nanoparticles. Solid State Sci. 2016, 58, 55–63.
(18) Kozlenko, D. P.; Golosova, N. O.; Jirák, Z.; Dubrovinsky, L. S.; Savenko, B. N.; Tucker,
M. G.; Le Godec, Y.; Glazkov, V. P. Temperature- and Pressure-Driven Spin-State Transitions
in LaCoO3. Phys. Rev. B 2007, 75, 064422.
22
(19) Coutinho, P. V.; Cunha, F.; Barrozo, P. Structural, Vibrational and Magnetic Properties
of the Orthoferrites LaFeO3 and YFeO3: A Comparative Study. Solid State Commun. 2017, 252,
59–63.
(20) Gryaznov, D.; Evarestov, R. A.; Maier, J. Hybrid Density-Functional Calculations of
Phonons in LaCoO3. Phys. Rev. B 2010, 82, 224301.
(21) Sudheendra, L.; Motin Seikh, M.; Raju, A. R.; Narayana, C. An Infrared Spectroscopic
Study of the Low-Spin to Intermediate-Spin State (1A1–3T1) Transition in Rare Earth
Cobaltates, LnCoO3 (Ln=La, Pr and Nd). Chem. Phys. Lett. 2001, 340, 275–281.
(22) Weber, M. C.; Guennou, M.; Zhao, H. J.; Íñiguez, J.; Vilarinho, R.; Almeida, A.;
Moreira, J. A.; Kreisel, J. Raman Spectroscopy of Rare-Earth Orthoferrites RFeO3 ( R =La, Sm,
Eu, Gd, Tb, Dy). Phys. Rev. B 2016, 94, 214103.
(23) Capon, F.; Boileau, A.; Carteret, C.; Martin, N.; Boulet, P.; Pierson, J. F. Cation Size
Effect on the Thermochromic Properties of Rare Earth Cobaltites RECoO3 (RE : La, Nd, Sm). J.
Appl. Phys. 2013, 114, 113510.
(24) Haye, E.; Capon, F.; Barrat, S.; Boulet, P.; Andre, E.; Carteret, C.; Bruyere, S. Properties
of Rare-Earth Orthoferrites Perovskite Driven by Steric Hindrance. J. Alloys Compd. 2016, 657,
631–638.
(25) Dovesi, R.; Orlando, R.; Erba, A.; Zicovich-Wilson, C. M.; Civalleri, B.; Casassa, S.;
Maschio, L.; Ferrabone, M.; De La Pierre, M.; D’Arco, P.; et al. CRYSTAL14: A Program for
the Ab Initio Investigation of Crystalline Solids. Int. J. Quantum Chem. 2014, 114, 1287–1317.
(26) Dovesi, R.; Saunders, V. R.; Roetti, C.; Orlando, R.; Zicovich-Wilson, C. M.; Pascale, F.;
Civalleri, B.; Doll, K.; Harrison, N. M.; Bush, I. J.; et al. CRYSTAL14 User’s Manual; Università
di Torino, Torino, 2014.

23
(27) Adamo, C.; Barone, V. Toward Reliable Density Functional Methods without Adjustable
Parameters: The PBE0 Model. J. Chem. Phys. 1999, 110, 6158–6170.
(28) Franchini, C. Hybrid Functionals Applied to Perovskites. J. Phys. Condens. Matter 2014,
26, 253202.
(29) Dolg, M.; Stoll, H.; Savin, A.; Preuss, H. Energy-Adjusted Pseudopotentials for the Rare
Earth Elements. Theor. Chim. Acta 1989, 75, 173–194.
(30) Dolg, M.; Stoll, H.; Preuss, H. A Combination of Quasirelativistic Pseudopotential and
Ligand Field Calculations for Lanthanoid Compounds. Theor. Chim. Acta 1993, 85, 441–450.
(31) Yang, J.; Dolg, M. Valence Basis Sets for Lanthanide 4f-in-Core Pseudopotentials
Adapted for Crystal Orbital Ab Initio Calculations. Theor. Chem. Acc. 2005, 113, 212–224.
(32) Weigand, A.; Cao, X.; Yang, J.; Dolg, M. Quasirelativistic F-in-Core Pseudopotentials
and Core-Polarization Potentials for Trivalent Actinides and Lanthanides: Molecular Test for
Trifluorides. Theor. Chem. Acc. 2010, 126, 117–127.
(33) Pascale, F.; Zicovich-Wilson, C. M.; López Gejo, F.; Civalleri, B.; Orlando, R.; Dovesi,
R. The Calculation of the Vibrational Frequencies of Crystalline Compounds and Its
Implementation in the CRYSTAL Code. J. Comput. Chem. 2004, 25, 888–897.
(34) Morales, L.; Sierra-Gallego, G.; Barrero, C. A.; Arnache, O. Relative Recoilless F-
Factors in REFeO3 (RE=Rare-Earth La, Pr, Nd and Sm) Orthoferrites Synthesized by Self-
Combustion Method. Mater. Sci. Eng. B 2016, 211, 94–100.
(35) Bull, C. L.; Knight, K. S. Low-Temperature Structural Behaviour of LaCoO3 – A High-
Resolution Neutron Study. Solid State Sci. 2016, 57, 38–43.

24
(36) Knížek, K.; Jirák, Z.; Hejtmánek, J.; Veverka, M.; Maryško, M.; Maris, G.; Palstra, T. T.
M. Structural Anomalies Associated with the Electronic and Spin Transitions in LnCoO3. Eur.
Phys. J. B 2005, 47, 213–220.
(37) Křápek, V.; Novák, P.; Kuneš, J.; Novoselov, D.; Korotin, D. M.; Anisimov, V. I. Spin
State Transition and Covalent Bonding in LaCoO3. Phys. Rev. B 2012, 86, 195104.
(38) Smirnova, I. S. Normal Modes of the LaMnO3 Pnma Phase: Comparison with La2CuO4
Cmca Phase. Phys. B Condens. Matter 1999, 262, 247–261.
(39) Yan, J.-Q.; Zhou, J.-S.; Goodenough, J. B. Bond-Length Fluctuations and the Spin-State
Transition in LCoO3 ( L = La , Pr, and Nd). Phys. Rev. B 2004, 69, 134409.

25
TABLE OF CONTENTS:
TOC Graphic