Experimental and numerical modelling of nasal spray … · · 2012-09-13Experimental and...
6
Ninth International Conference on CFD in the Minerals and Process Industries CSIRO, Melbourne, Australia 10-12 December 2012 Copyright © 2012 CSIRO Australia 1 Experimental and numerical modelling of nasal spray atomisation Man Chiu Fung 1 , Kiao Inthanvong 1 , William Yang 2 and Jiyuan Tu 1 1 School of Aerospace, Mechanical and Manufacturing Engineering, RMIT University, AUSTRALIA 2 CSIRO Process Science and Engineering, Clayton, Victoria 3169, AUSTRALIA ABSTRACT Spray atomization is a common process found in different industries, where sprays under high injection pressure are widely recorded in the literature. Nonetheless, research on spray breakup mechanism under low pressure in pharmaceutical industry is still relatively rare. Numerical model in the Lagrangian approach was modified for simulating the spray formation from a nasal spray device in the current study. The Linear Instability Sheet Atomization (LISA) was applied to model the formation of spray droplets of a continuous spray from a pressure swirl atomizer. The secondary breakup of spray droplets was simulated by the Taylor Analogy Breakup (TAB) model. Two way momentum coupling was applied to handle the interaction between the gas and liquid phases. The droplet size distribution from numerical solution agreed with experimental result in literature. The external spray characteristics was also studied for comparison. Experimental work of unsteady spray was also performed to study the spray atomization from a nasal spray device. High speed camera and Particle/Droplet Image Analysis (PDIA) were used to determine the spray external characteristics. The atomization stages were defined into pre-stable, stable and post-stable stages, based on the spray cone width. The spray intensity and spray cone dimension were used to evaluate the drug delivery efficiency in different stages. The experimental data is a stepping stone for the validation of a numerical model for unsteady application. NOMENCLATURE Symbols a 1 , a 2, a 3 drag coefficient constants applied to smooth spherical droplets over several ranges of droplet Reynolds number d, D droplet diameter d0 volume median diameter D30 volume mean diameter D32 Sauter mean diameter Additional acceleration term g gravitational acceleration h liquid sheet thickness k turbulent kinetic energy kw atomization wave number, defined as ̇ mass flow rate M mass M p momentum exchange between droplets and air Oh Ohnesorge number, defined as √ P pressure q spread parameter Re Reynolds number r droplet radius r0 the radial distance from the axial line to the mid-line of liquid sheet at atomizer exit t time u, U velocity Vslip slip velocity velocity vector of air We Weber number defined as Greek characters ε turbulent dissipation θ spray half cone angle σ liquid surface tension σg geometric standard deviation ρ density η0 initial wave amplitude μ dynamic viscosity ω complex growth rate, defined as ω= ωr+ iωi Superscript/subscripts d droplet phase g gas phase i, j, k tensor coordinates l liquid n nozzle INTRODUCTION Nasal spray is a relatively new drug delivery method in the pharmaceutical industry. The vascularised mucosa and blood vessels network in nasal cavity has provided a quick delivery route for systemically acting drugs. Other traditional ways, such as oral delivery and intravenous often lead to drug formulation degradation or patient non- compliance related to injection pain. Since nasal spray has advantages over traditional methods, it is worth to investigate the drug delivery mechanism and its applications.
-
Upload
trinhxuyen -
Category
Documents
-
view
223 -
download
2
Transcript of Experimental and numerical modelling of nasal spray … · · 2012-09-13Experimental and...

Ninth International Conference on CFD in the Minerals and Process Industries
CSIRO, Melbourne, Australia
10-12 December 2012
Copyright © 2012 CSIRO Australia 1
Experimental and numerical modelling of nasal spray
atomisation
Man Chiu Fung1, Kiao Inthanvong
1, William Yang
2 and Jiyuan Tu
1
1
School of Aerospace, Mechanical and Manufacturing Engineering, RMIT University, AUSTRALIA 2 CSIRO Process Science and Engineering, Clayton, Victoria 3169, AUSTRALIA
ABSTRACT
Spray atomization is a common process found in different
industries, where sprays under high injection pressure are
widely recorded in the literature. Nonetheless, research on
spray breakup mechanism under low pressure in
pharmaceutical industry is still relatively rare. Numerical
model in the Lagrangian approach was modified for
simulating the spray formation from a nasal spray device
in the current study. The Linear Instability Sheet
Atomization (LISA) was applied to model the formation
of spray droplets of a continuous spray from a pressure
swirl atomizer. The secondary breakup of spray droplets
was simulated by the Taylor Analogy Breakup (TAB)
model. Two way momentum coupling was applied to
handle the interaction between the gas and liquid phases.
The droplet size distribution from numerical solution
agreed with experimental result in literature. The external
spray characteristics was also studied for comparison.
Experimental work of unsteady spray was also performed
to study the spray atomization from a nasal spray device.
High speed camera and Particle/Droplet Image Analysis
(PDIA) were used to determine the spray external
characteristics. The atomization stages were defined into
pre-stable, stable and post-stable stages, based on the
spray cone width. The spray intensity and spray cone
dimension were used to evaluate the drug delivery
efficiency in different stages. The experimental data is a
stepping stone for the validation of a numerical model for
unsteady application.
NOMENCLATURE
Symbols
a1, a2, a3 drag coefficient constants applied to smooth spherical
droplets over several ranges of droplet Reynolds
number
d, D droplet diameter
d0 volume median diameter
D30 volume mean diameter
D32 Sauter mean diameter
Additional acceleration term
g gravitational acceleration
h liquid sheet thickness
k turbulent kinetic energy
kw atomization wave number, defined as
mass flow rate
M mass
Mp momentum exchange between droplets and air
Oh Ohnesorge number, defined as √
P pressure
q spread parameter
Re Reynolds number
r droplet radius
r0 the radial distance from the axial line to the mid-line
of liquid sheet at atomizer exit
t time
u, U velocity
Vslip slip velocity
velocity vector of air
We Weber number defined as
Greek characters
ε turbulent dissipation
θ spray half cone angle
σ liquid surface tension
σg geometric standard deviation
ρ density
η0 initial wave amplitude
μ dynamic viscosity
ω complex growth rate, defined as ω= ωr+ iωi
Superscript/subscripts
d droplet phase
g gas phase
i, j, k tensor coordinates
l liquid
n nozzle
INTRODUCTION
Nasal spray is a relatively new drug delivery method in the
pharmaceutical industry. The vascularised mucosa and
blood vessels network in nasal cavity has provided a quick
delivery route for systemically acting drugs. Other
traditional ways, such as oral delivery and intravenous
often lead to drug formulation degradation or patient non-
compliance related to injection pain. Since nasal spray has
advantages over traditional methods, it is worth to
investigate the drug delivery mechanism and its
applications.

Copyright © 2012 CSIRO Australia 2
In vivo and in vitro studies of nasal spray are available
extensively in literatures. For in vivo study, Suman et al.
(2002) applied gamma scientigraphy imaging to study the
effect of varying droplet size and spray plume shapes on
the deposition pattern. Cheng et al. (2001) has also
determined the deposition of spray droplets from nasal
spray device in human nasal cavity replica. The spray
angle and droplet size were found to be important factors
in influencing the deposition pattern. For in vitro testing,
Suman et al. (2002) compared the spray properties of two
spray bottles by automated actuation system. It was found
that the differences in spray pattern, plume geometry and
droplet size did not translate to differences in deposition
pattern in nose. Dayal et al. (2004) undertook a parametric
study to determine the relationship between actuation
force, rheological properties of the drug formulation,
actuation distance, nasal spray design with droplet size
distribution. Guo and Doub (2006) performed a similar
study, but they related spray characteristics with actuation
velocity and acceleration. Cheng et al. (2001) studied the
spray droplet size distribution and cone angle by laser
diffraction and still photographic images. A recent
research by Inthavong et al. (2012) studied the external
characteristics and droplet size of continuous spray from
nasal spray device by particle image velocimetry (PIV)
and Particle/Droplet Image Analysis (PDIA) and it is the
used to validate the numerical model in this study.
Due to the advancement of computational power and
numerical modelling techniques, computational fluid
dynamics (CFD) was also widely applied for the
prediction of spray droplets deposition in nasal cavity
(Inthavong et al. 2006; Kimbell et al. 2007). In both of
these studies, spray droplet breakup models were not
included in simulations. The droplets' size were predefined
and being injected at a release point. In order to predict
the trajectories and dispersion of spray, the spray cone
angle and initial injection velocity were defined.
In current study, the external characteristics and spray
droplet size distribution of continuous spray from nasal
spray was determined by numerical modelling. The
experimental work for unsteady spray was also included
herein to provide data for the validation of the current
numerical model for unsteady spray in the future.
EXPERIMENTAL SETUP
Spray bottle
A commercially available nasal spray kindly provided by
GlaxoSmithKline was used in current study. The volume
of the spray bottle has the capacity to provide 200 sprays
as shown on the product label. A water tank filled with
distilled water was attached to the nasal spray bottle, thus
the spray bottle was kept fully filled during the
experiment.
Automated Actuation and Image Acquisition
The automated actuation system comprised of a spray
bottle holder, a programmable logic control unit (PLC),
pneumatic valves and a pneumatic actuator (Figure 1). The
spray bottle was fixed on a stand, thus the undesired
lateral motion was avoided during actuation. The pressing
and releasing motion on nasal spray bottle was executed
by a pneumatic actuator. The actuation speed of pressing
and releasing was managed by two speed controllers on
the pressure line. The PLC unit was used to control the
open and close motion of the pneumatic valves, and thus
the motion of the actuator. The internal timers and
counters of the PLC manipulate the time between
actuations and the number of actuations. The strength of
actuation force varies with the pressure of compressed air
and was controlled by a pressure regulator which limits
the pressure levels at 3, 4 and 5 bars. The nasal spray
bottle was held in its initial position for 2.5 seconds before
extending, and applying a compression force on the spray
bottle. The actuator will retract to the initial position
immediately after the nasal spray bottle nozzle reached its
bottom position. The motion cycle was repeated for 200
cycles for image acquisition. A time of 2.5 seconds
between each actuation was determined by Particle and
Droplet Image Analysis (PDIA) for sufficient settling of
suspended spray droplets from the previous injection.
Figure 1: Experimental Setup
For high speed camera filming, a powerful light source
was provided by ARRI 1000W plus a manual spotlight to
retain short exposure time to capture bright images. Spray
images were captured by Phantom V210 digital high-
speed camera. The frame rate and exposure time were
2200 per second and 6μs respectively. The motion of the
spray bottle nozzle (pressing, holding and releasing) and
the development of spray plume were captured for
qualitative and quantitative analysis. Three sets of images
were recorded under different back pressure (3, 4, 5 bar)
to minimize the variance in analysis.
For PDIA, a long distance microscope lens with
magnification of 2.46 was attached to SensiCam 128 bit
cooled imaging camera. The light source was replaced by
Nd: Yag laser. Field of View (FOV) of 3.85 mm 3.08
mm with resolution of 3.01 μm/pixel was obtained at close
to nozzle region at 11 different locations to cover the first
12 mm downstream of spray plume. 100 image pairs were
obtained in each FOV for analysis.
NUMERICAL MODEL
The governing equations for the fluid phase are:
(
) (1)
[
]
(2)
The Realizable k-ε turbulence model is used in current
study and its turbulence transport equations are given as:

Copyright © 2012 CSIRO Australia 3
( )
( )
[(
)
]
(3)
( )
( )
[(
)
]
√
(4)
Primary breakup model
The primary breakup was simulated by the Linear
Instability Sheet Atomization (LISA) model. The model
assumes that a two-dimensional, viscous, incompressible
liquid sheet of thickness 2h moving with a relative
velocity U through an inviscid, incompressible gas
medium. A spectrum of infinitesimal disturbance of the
form
(5)
is imposed on the initially steady motion. The total
velocity U is obtained by the relation with injection
pressure
√
(6)
where kv is the velocity coefficient calculated by
[
√
] (7)
The thickness of the initial film is determined by the
correlation between mass flow rate ( ) nozzle exit
diameter , liquid density and axial velocity of liquid
film, .
( ) (8)
The breakup length L is given by
(
)
(9)
A volume median diameter is produced and is given by
( ) (10)
where dl is the diameter of ligament formed at the point of
breakup
The resultant droplet diameter is incorporated with a
Rosin-Rammler distribution function (R-R) to provide the
droplet size distribution as
( )
{ [
]
} (11)
Where
( )
(12)
Additional details of the model is available in Senecal et
al. (1999).
Secondary breakup model
The model used herein is the Taylor Analogy Breakup
(TAB) model, which is responsible to the breakup of
parent droplets formed by LISA model. There are five
distinct breakup regime determined by the Weber number
of parent droplets. The details are available in Pilch and
Erdman (1987).The model equations of TAB model can
also be found in ANSYS software manual. (Ansys 2009)
Droplet Modelling
The spray droplets (disperse phase) are simulated in
Lagrangian approach. Two-way coupling is applied in the
model, so there is momentum exchange between disperse
phase and fluid phase. The force balance equations is:
( )
( )
(13)
FD is the drag force defined as
(14)
The drag coefficient, based on Morsi and Alexander
(1972) is given as
(15)
NUMERICAL SETUP
The computational domain was cylindrical in shape with
1m diameter and 1m height. The geometry was meshed
with 2.16 million quad and hexa elements with an O-grid
in the centre to get a fine mesh around the spray region,
after grid independence test, which is based on spray
penetration. (Figure 2)
Figure 2: Geometry mesh and boundary conditions.
The CFD code, ANSYS Fluent v12.1 was used to
calculate the continuity and the momentum equations for
both gas phase and liquid phase. Third order accurate
QUICK scheme was applied for the discretisation of these
equations, while a second order upwind scheme was used
for the turbulent kinetic energy and dissipation rate. The
pressure-velocity coupling was solved by SIMPLE scheme
and a Runge-Kutta scheme was used for the integration of
droplet trajectories. The properties of the liquid and gas
phase and injection conditions are based on the study case
by Inthavong et al. (2012)
Table 1: properties of liquid and gas phase and injection
conditions are based on the research by Inthavong et
al.(2012)
Properties of spray
Density 998.2 kg/m3
Viscosity 0.001003 kg/m.s
Surface Tension 0.072 N/m
Injection pressure 5 bar
Mass Flow Rate 0.00145 kg/s
Spray Cone Angle 25o
Nozzle diameter 0.5 mm
Liquid sheet constant 1

Copyright © 2012 CSIRO Australia 4
Spread parameter 2.2
Dispersion Angle 3o
Properties of Air Density (kgm-3) 1.225 kg/m3
Viscosity (kg/m-s) 1.789e-5 kg/m.s
Temperature 298.15 K
RESULTS
Spray model validation
The spread parameter, q in R-R distribution function
(Eqn. (11)) is related to the uniformity of size distribution.
Smaller value implies a more widely spread distribution.
By comparing with experimental droplet size data across
eight local regions closed to injection point from
Inthavong et al. (2012), it shows that the model provided
the best fit when q=2.2 (Figure 3).
Figure 3: Comparison of volume log-normal distribution
of spray droplets from experimental result and the
corresponding Rosin Rammler distribution with spread
parameter: 2.2.
The liquid sheet constant, (
) in the LISA model
controls the breakup length of liquid sheet, which also
influences the liquid sheet thickness and ligament size. For
high pressure applications, this value is commonly set to
12. (Gao et al. 2005; Park et al. 2009; Schmidt et al.
1999). By varying the liquid sheet constant and comparing
Sauter Mean Diameter (S.M.D.) with experimental data, it
was found that the sheet constant 1 provides a good
approximation. The original value, 12, gives an
exceptionally small droplet size (0.5 µm), which is
inaccurate, therefore it is not applicable in low pressure
applications (Figure 4). The measurement location and
external characteristics of numerical result are illustrated
in Figure 5.
Figure 4: Sauter mean diameter (SMD) of droplets at
differnt radial location with various liquid sheet constant
at downstream distance between y = 9.246 mm and y =
12.33 mm.
Figure 5: The measurement location and external
characteristics of numerical result.
The Mean Volume Diameter (D30) and Sauter mean
diameter (D32) were also used for validation. The general
form of the system is shown as follow:
( )
∫ (
)
∫ (
)
(16)
where N is the number of drops, D0 is the minimum
droplet diameter and Dm is the maximum droplet
diameter.
The Mean Volume Diameter is the ratio of volume of a
sphere to the spheres’ number. A larger Mean Volume
Diameter indicates a higher dose of delivered liquid with a
specific spray droplet number. Sauter Mean Diameter is
defined as a sphere with the same volume to surface area
ratio. A smaller value represents a higher surface area to
volume ratio which implies that the spray droplets provide
a larger contact surface area with constant amount of
liquid. Lefebvre (1989) stated that this parameter is used
for evaluating the performance of mass transfer and
reaction, when surface area is the determining factor.
Hence, it is useful to evaluate the absorption efficiency of
nasal spray in nasal cavity. The comparison of the
numerical result with experimental data is shown in
Figure 6. It was found that the simulation can accurately
predict the amount of water delivered at different locations
close to nozzle exit. The comparison of Sauter Mean
Diameter also has a good agreement. Generally, large
droplets are located at the central area along the axial axis
of nozzle exit, while small droplets are driven to
peripheral regions by turbulence induced flow from the
spray itself.

Copyright © 2012 CSIRO Australia 5
(a)
(b)
Figure 6: Comparison of SMD and D30 with
experimental data from Inthavong et al. (2012)for
downstream locations between (a) y = 6.164 mm and y =
9.246 mm (b) y = 9.246 mm and y = 12.33 mm from
orifice.
Experimental result
The continuous spray measurement is used for the
validation of numerical models. It is not practical in real
life, since the operation of a nasal spray device is a pulsing
motion. The mass flow rate of liquid passing through
atomizer varies during the atomization process. Hence it is
worth investigating the external characteristics of the spray
to provide data for validating current numerical models.
By the application of a high speed camera, the spray
propagation was recorded. For low pressure spray, the
spray development can be classified into 4 stages:
distorted pencil, onion stage, tulip stage and fully
developed spray (Figure 7).
Figure 7: Spray development stages of nasal spray device
under 5 bar compression pressure: distorted pencil, onion
stage, tulip stage and fully developed.
Formation of pre-spray
At the initial stage of spray, the injection pressure is
underdeveloped. The insufficient pressure causes the
formation of a pre-spray. The interaction between liquid
and gas phase causes aerodynamic instability which leads
to early disintegration of the spray ligament and formation
of large water blobs. The size of these blobs range
between 0.93 mm and 1.13 mm for 3 and 5 bar
compression pressure respectively (Figure 8).
According to the nasal cavity geometry studied by Wen
et al. (2008), the cross-sectional area of the nasal valve is
about 0.7 cm2 where it is located at 20 mm from the
anterior tip of the nose for a 25 years old, healthy Asian
male. The width of the nasal valve can be as narrow as 7.8
mm. This means that the exceptionally large size of
droplets prevents them from entering the nasal cavity.
Thus, the spray droplets from the initial period of
atomization have low drug delivery efficiency.
Figure 8: The maximum width of the last water blob
formed by pre-spray under different compression pressure
varies between 0.93 mm and 1.13 mm
Definition of Spray Stages
In the pharmaceutical industry, the spraying stages are
defined by the spray droplet size. The "Stable stage" is
defined as the period when spray droplet size is constant
and at smallest in the size range. Since the size
measurement is not included in this paper, determination
of the stable stage is defined by the spray cone width.
According to the numerical simulation by Snyder et al
(2004), the spray droplet size is inversely proportional to
the spray cone angle. In the other words, spray cone width
is a valid criteria for defining spray stages. The "Stable
stage" can be defined as the period with widest spray cone
width. The stages before and after this are termed "Pre-
stable stage" and "Post stable stage" respectively.
Figure 9: The variation of spray width at 4.4 mm
downstream from injection point under different injection
pressure. (a) 3 bar (b) 4 bar (c) 5 bar. The stable stage is
defined at 70% of the moving average peak.
The spray cone width was determined by the utilisation
of image processing tool in MATLAB at 9.22 mm
downstream from the injection point. The photos were
converted to binary image based on greyscale threshold
criteria for analysis. By scanning each pixel per row and
column of each image, the total number of columns with
Copyright © 2012 CSIRO Australia 6
white pixels (filled with water) can be converted to the
spray cone width. The value at 70% of the peak of the
moving average value for the spray width is defined herein
as a threshold for the stable stage of spray. The result was
further validated with PDIA data for consistency and
repeatability (Figure 9).
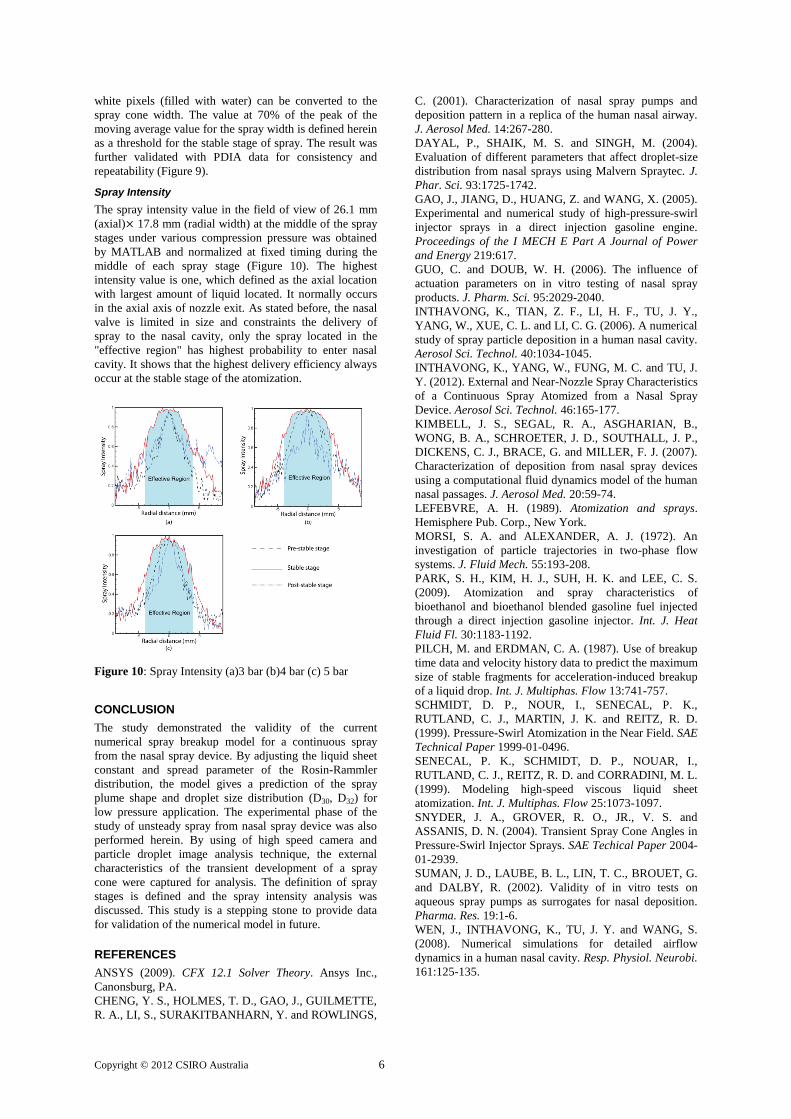
Spray Intensity
The spray intensity value in the field of view of 26.1 mm
(axial) 17.8 mm (radial width) at the middle of the spray
stages under various compression pressure was obtained
by MATLAB and normalized at fixed timing during the
middle of each spray stage (Figure 10). The highest
intensity value is one, which defined as the axial location
with largest amount of liquid located. It normally occurs
in the axial axis of nozzle exit. As stated before, the nasal
valve is limited in size and constraints the delivery of
spray to the nasal cavity, only the spray located in the
"effective region" has highest probability to enter nasal
cavity. It shows that the highest delivery efficiency always
occur at the stable stage of the atomization.
Figure 10: Spray Intensity (a)3 bar (b)4 bar (c) 5 bar
CONCLUSION
The study demonstrated the validity of the current
numerical spray breakup model for a continuous spray
from the nasal spray device. By adjusting the liquid sheet
constant and spread parameter of the Rosin-Rammler
distribution, the model gives a prediction of the spray
plume shape and droplet size distribution (D30, D32) for
low pressure application. The experimental phase of the
study of unsteady spray from nasal spray device was also
performed herein. By using of high speed camera and
particle droplet image analysis technique, the external
characteristics of the transient development of a spray
cone were captured for analysis. The definition of spray
stages is defined and the spray intensity analysis was
discussed. This study is a stepping stone to provide data
for validation of the numerical model in future.
REFERENCES
ANSYS (2009). CFX 12.1 Solver Theory. Ansys Inc.,
Canonsburg, PA.
CHENG, Y. S., HOLMES, T. D., GAO, J., GUILMETTE,
R. A., LI, S., SURAKITBANHARN, Y. and ROWLINGS,
C. (2001). Characterization of nasal spray pumps and
deposition pattern in a replica of the human nasal airway.
J. Aerosol Med. 14:267-280.
DAYAL, P., SHAIK, M. S. and SINGH, M. (2004).
Evaluation of different parameters that affect droplet-size
distribution from nasal sprays using Malvern Spraytec. J.
Phar. Sci. 93:1725-1742.
GAO, J., JIANG, D., HUANG, Z. and WANG, X. (2005).
Experimental and numerical study of high-pressure-swirl
injector sprays in a direct injection gasoline engine.
Proceedings of the I MECH E Part A Journal of Power
and Energy 219:617.
GUO, C. and DOUB, W. H. (2006). The influence of
actuation parameters on in vitro testing of nasal spray
products. J. Pharm. Sci. 95:2029-2040.
INTHAVONG, K., TIAN, Z. F., LI, H. F., TU, J. Y.,
YANG, W., XUE, C. L. and LI, C. G. (2006). A numerical
study of spray particle deposition in a human nasal cavity.
Aerosol Sci. Technol. 40:1034-1045.
INTHAVONG, K., YANG, W., FUNG, M. C. and TU, J.
Y. (2012). External and Near-Nozzle Spray Characteristics
of a Continuous Spray Atomized from a Nasal Spray
Device. Aerosol Sci. Technol. 46:165-177.
KIMBELL, J. S., SEGAL, R. A., ASGHARIAN, B.,
WONG, B. A., SCHROETER, J. D., SOUTHALL, J. P.,
DICKENS, C. J., BRACE, G. and MILLER, F. J. (2007).
Characterization of deposition from nasal spray devices
using a computational fluid dynamics model of the human
nasal passages. J. Aerosol Med. 20:59-74.
LEFEBVRE, A. H. (1989). Atomization and sprays.
Hemisphere Pub. Corp., New York.
MORSI, S. A. and ALEXANDER, A. J. (1972). An
investigation of particle trajectories in two-phase flow
systems. J. Fluid Mech. 55:193-208.
PARK, S. H., KIM, H. J., SUH, H. K. and LEE, C. S.
(2009). Atomization and spray characteristics of
bioethanol and bioethanol blended gasoline fuel injected
through a direct injection gasoline injector. Int. J. Heat
Fluid Fl. 30:1183-1192.
PILCH, M. and ERDMAN, C. A. (1987). Use of breakup
time data and velocity history data to predict the maximum
size of stable fragments for acceleration-induced breakup
of a liquid drop. Int. J. Multiphas. Flow 13:741-757.
SCHMIDT, D. P., NOUR, I., SENECAL, P. K.,
RUTLAND, C. J., MARTIN, J. K. and REITZ, R. D.
(1999). Pressure-Swirl Atomization in the Near Field. SAE
Technical Paper 1999-01-0496.
SENECAL, P. K., SCHMIDT, D. P., NOUAR, I.,
RUTLAND, C. J., REITZ, R. D. and CORRADINI, M. L.
(1999). Modeling high-speed viscous liquid sheet
atomization. Int. J. Multiphas. Flow 25:1073-1097.
SNYDER, J. A., GROVER, R. O., JR., V. S. and
ASSANIS, D. N. (2004). Transient Spray Cone Angles in
Pressure-Swirl Injector Sprays. SAE Techical Paper 2004-
01-2939.
SUMAN, J. D., LAUBE, B. L., LIN, T. C., BROUET, G.
and DALBY, R. (2002). Validity of in vitro tests on
aqueous spray pumps as surrogates for nasal deposition.
Pharma. Res. 19:1-6.
WEN, J., INTHAVONG, K., TU, J. Y. and WANG, S.
(2008). Numerical simulations for detailed airflow
dynamics in a human nasal cavity. Resp. Physiol. Neurobi.
161:125-135.


![[Product Monograph Template - Standard] - GSK.caPage 1 of 47. PRODUCT MONOGRAPH . PrAVAMYS® fluticasone furoate nasal spray . 27.5 mcg/metered spray . Corticosteroid for nasal use](https://static.fdocuments.in/doc/165x107/5a7278307f8b9aac538d86c9/product-monograph-template-standard-gskcapage-1-of-47-product-monograph.jpg)