
Experimental and numerical investigation of two-phase ...
32
HAL Id: hal-00537675 https://hal.archives-ouvertes.fr/hal-00537675 Submitted on 19 Nov 2010 HAL is a multi-disciplinary open access archive for the deposit and dissemination of sci- entific research documents, whether they are pub- lished or not. The documents may come from teaching and research institutions in France or abroad, or from public or private research centers. L’archive ouverte pluridisciplinaire HAL, est destinée au dépôt et à la diffusion de documents scientifiques de niveau recherche, publiés ou non, émanant des établissements d’enseignement et de recherche français ou étrangers, des laboratoires publics ou privés. Experimental and numerical investigation of two-phase pressure drop in vertical cross-flow over a horizontal tube bundle Khalid Bamardouf, David A Mcneil To cite this version: Khalid Bamardouf, David A Mcneil. Experimental and numerical investigation of two-phase pressure drop in vertical cross-flow over a horizontal tube bundle. Applied Thermal Engineering, Elsevier, 2009, 29 (7), pp.1356. 10.1016/j.applthermaleng.2008.04.011. hal-00537675
Transcript of Experimental and numerical investigation of two-phase ...
HAL Id: hal-00537675https://hal.archives-ouvertes.fr/hal-00537675
Submitted on 19 Nov 2010
HAL is a multi-disciplinary open accessarchive for the deposit and dissemination of sci-entific research documents, whether they are pub-lished or not. The documents may come fromteaching and research institutions in France orabroad, or from public or private research centers.
L’archive ouverte pluridisciplinaire HAL, estdestinée au dépôt et à la diffusion de documentsscientifiques de niveau recherche, publiés ou non,émanant des établissements d’enseignement et derecherche français ou étrangers, des laboratoirespublics ou privés.
Experimental and numerical investigation of two-phasepressure drop in vertical cross-flow over a horizontal
tube bundleKhalid Bamardouf, David A Mcneil
To cite this version:Khalid Bamardouf, David A Mcneil. Experimental and numerical investigation of two-phase pressuredrop in vertical cross-flow over a horizontal tube bundle. Applied Thermal Engineering, Elsevier,2009, 29 (7), pp.1356. �10.1016/j.applthermaleng.2008.04.011�. �hal-00537675�

Accepted Manuscript
Experimental and numerical investigation of two-phase pressure drop in vertical
cross-flow over a horizontal tube bundle
Khalid Bamardouf, David A McNeil
PII: S1359-4311(08)00200-7
DOI: 10.1016/j.applthermaleng.2008.04.011
Reference: ATE 2486
To appear in: Applied Thermal Engineering
Received Date: 5 November 2007
Revised Date: 10 April 2008
Accepted Date: 10 April 2008
Please cite this article as: K. Bamardouf, D.A. McNeil, Experimental and numerical investigation of two-phase
pressure drop in vertical cross-flow over a horizontal tube bundle, Applied Thermal Engineering (2008), doi:
10.1016/j.applthermaleng.2008.04.011
This is a PDF file of an unedited manuscript that has been accepted for publication. As a service to our customers
we are providing this early version of the manuscript. The manuscript will undergo copyediting, typesetting, and
review of the resulting proof before it is published in its final form. Please note that during the production process
errors may be discovered which could affect the content, and all legal disclaimers that apply to the journal pertain.

ACCEPTED MANUSCRIPT
1
Experimental and numerical investigation of two-phase pressure drop in vertical cross-flow over a
horizontal tube bundle
Khalid Bamardouf and David A McNeil *
Department of Mechanical Engineering, Heriot-Watt University, Riccarton, Edinburgh UK EH14 4AS,
*e-mail: [email protected]
Abstract
Experimental pressure-drop data for vertical two-phase air-water flow across horizontal tubes is presented
for gas mass fractions in the range 0.0005-0.6 and mass fluxes in the range 25-700 kg/m2s. The square in-
line tube bundle had one column containing ten tubes and two columns of half tubes attached to the walls.
The tubes had a diameter of 38 mm and a pitch to diameter ratio of 1.32. This data and air-water and
R113 vapour-liquid data available in the literature are compared with the predictions from two kettle
reboiler models, the one-dimensional model and a one-dimensional formulation of the two-fluid model.
The one-dimensional model was implemented with three separate void fraction correlations and one two-
phase friction multiplier correlation. The results show that the two-fluid model predicts air-water void
fraction data well but R113 data poorly with pressure drop predictions for both being unsatisfactory. The
one-dimensional model is shown to predict pressure-drop and void fraction data reasonably well,
provided a careful choice is made for the void fraction correlation.
Keywords: kettles, re-boilers, two-phase, two-dimensional, pressure-drop
1 Introduction
Shell and tube heat exchangers are widely used in the process industry with the kettle reboiler being one
of the most common. A kettle reboiler consists of a tube bundle placed in a shell. The heating fluid flows
inside the tubes while the heated fluid boils outside the tubes, figure 1. The difference in densities
between the two-phase mixture flowing in the bundle and the liquid flowing between the bundle and the
shell wall causes natural circulation to occur. To determine the circulation flow rate, different modelling
approaches have been proposed.
ACCEPTED MANUSCRIPT
2
The simplest approach is the one-dimensional model, where the liquid is assumed to enter the bundle
from the bottom and evaporate while it moves vertically upwards. The two-phase pressure drop in the
tube bundle is assumed equal to the static head of the liquid between the bundle and the shell. Since the
two-phase pressure drop has gravity, acceleration and friction components, the void fraction and a two-
phase friction multiplier are required to complete the model. Several investigators have proposed void
fraction correlations, e.g. Schrage et al. [1], Dowlati et al. [2] and Feenstra et al. [3]. For the two-phase
multiplier, various investigators have applied the Lockhart and Martinelli [4] method, represented by a
simple correlation designed by�Chisholm and Laird [5]. The one-dimensional model provides satisfactory
prediction at low heat flux. However, at heat fluxes greater than 20 kW/m2, the flow becomes two-
dimensional, Burnside et al. [6].
Attempts to model the two-dimensional flow have been made using the algebraic slip model and the two-
fluid model. The former assumes that the two phases move in the same direction but with different
velocities and was used by Burnside [7]. The two-fluid model is a more advanced approach to modelling
the two-phase flow in a complex geometry. The model assumes that each phase has its own conservation
equations describing mass, momentum and energy. These are solved together with closure equations
used to define the interaction between the phases and between the phases and the tubes in the bundle. The
interfacial drag coefficient allows the drag force between the phases to be found and is one of the most
important closure equations because it strongly affects the void fraction and consequently influences the
pressure drop.
Edwards and Jensen [8]�produced a 2-D model for the kettle reboiler using the two-fluid approach.
However, due to the absence of information on the interfacial momentum force at that time, the authors
assumed a constant drag coefficient for the whole flow field. The value used allowed the experimental
void fraction results to be approached, but convergence problems appeared when they got within 30% of
the experimental values.

ACCEPTED MANUSCRIPT
3
Rahman et al. [9] were the first to model the interfacial drag coefficient for vertical two-phase flow across
a horizontal tube bundle. The drag coefficient was developed from experimental data with the assumption
of negligible resistance between the tube walls and the gas or vapour flow, arguing that only the liquid
phase was in contact with the tubes in the bundle. The drag coefficient was correlated as a power law
function of the Reynolds number.
Stosic and Stevanovic [10], Stevanovic et al. [11], Stevanovic et al. [12] and Pezo et al. [13] proposed
two correlations for the drag coefficient, one for the bubbly flow regime and the other for the churn flow
regime. They derived their coefficients from the air-water void fraction measurements reported by
Dowlati et al. [14]. The details are given in Simovic et al. [15]. The two-fluid model, with these drag
coefficient correlations, was used to model boiling flows in horizontal steam generators and kettle
reboilers.
The aim of this study is to investigate the reliability of modelling methods for kettle reboilers in
reproducing one-dimensional flow data. This is accomplished by obtaining two-phase pressure-drop data
from a test bundle and comparing these, and other data, with predictions from the two-fluid model and the
one-dimensional model implemented with three different void fraction correlations.
2 The two-fluid model
A one-dimensional version of the two-fluid model, similar to that used by Simovic et al. [15], was derived
for adiabatic, steady state, fully developed flow. Thus, the conservation equations for energy were
omitted and the mass equations reduced a constant velocity for each phase. The model was developed
using the porous media approach, which assumes that the volume of the domain consists of a solid
fraction, sε , a liquid fraction, lε , and a gas fraction, gε , so that the total volume fraction is
1=++ gls εεε ( 1)
The volume fraction available for flow, i.e. the porosity, φ , is
slg εεεφ −=+= 1 ( 2)

ACCEPTED MANUSCRIPT
4
For the square in-line tube bundles considered in this study, the porosity can be obtained from
2
41 �
�
���
�−=PDπφ ( 3)
where D is the tube diameter and P is the tube pitch. The volume fraction of the gas and liquid phases
are given by
φε
α gg = and
φεα l
l = ( 4, 5)
The momentum equation for the liquid phase can be written as
slgllll FFgyp ++−=
∂∂ ρεε ( 6)
where glF is the force on the liquid by the gas per unit volume of domain and slF is the force on the
liquid by the solid per unit volume of domain. The momentum equation for the gas phase is given by
sgggg FFgyp ++−=
∂∂
lgρεε ( 7)
where lgF is the force on gas by the liquid per unit volume of domain and sgF is the force on the gas by
the solid per unit volume of domain. Equating pressure gradients form equations (6) and (7), with
lgFFgl −= , gives
0)1()1(
1)( =−−
+��
�
�
��
�
�
−+−− sgsl
g
ggl
g
gglg FFFg
αα
αα
ρρφα ( 8)
The force on the liquid by the gas per unit volume, glF , is related to the gas velocity gu and the liquid
velocity lu through
lglggllDgl uu)uu(AC21
F −−ρ= ( 9)
where DC is the drag coefficient and the area of the gas bubbles, glA , is the cross sectional area of all N
bubbles of diameter pD that occupy a unit volume of domain. Thus

ACCEPTED MANUSCRIPT
5
6
3p
gD
Nπ
ε = ( 10)
so that
lglgp
Dglgl uu)uu(
DC
43
F −−αφρ= ( 11)
To close the model, the force on the gas by the tubes, sgF , the force on the liquid by the tubes, slF , and
the drag coefficient must be specified. For bubbly flow, the drag coefficient is obtained from the
correlation of Ishii and Zuber [16], as adapted by Stevanovic et al. [11], i.e.
( )( )
2
2/3
7/95.0
167.18
167.171267.0
��
�
�
��
�
�
−
−+��
���
� ∆=
εε
σρg
DC pD ( 12)
For churn flow, the equation proposed by Stevanovic et al. [11] is used, i.e.
( ) ( )235.0
75.011487.1 εεσ
ρ−−�
�
���
� ∆=
gDC pD ( 13)
The force per unit volume on the liquid and on the gas by the solid are calculated respectively from
)1(2
2gll
lsl j
fF αρ −= ( 14)
and
gggg
gl jf
F αρ 2
2= ( 15)
where Dk
f ii = , in which ik ( gli ,= ) is the single-phase loss coefficients obtained from ESDU [17] and
D is the tube diameter. The single-phase loss coefficient is a function of Reynolds number based on the
minimum superficial velocity, given for the liquid phase by
)1()1( min
gll
Gxj
αρ −−
= ( 16)
And for the gas phase by

ACCEPTED MANUSCRIPT
6
ggg
xGj
αρmin= ( 17)
in which x is the gas mass fraction . It should be noted that the porosity is not mentioned in equations 14
or 15 because it is included implicitly in the single-phase loss coefficient correlation.
3 The one-dimensional model
For a fully-developed flow, the momentum equation for the one-dimensional model is given by
sftp Fgyp
+−=∂∂ ρ ( 18)
where tpρ is the two-phase density, given by
llggtp ραραρ += ( 19)
and sfF is the force on the fluid by the tubes and is given by
22lsf llol
j�2f
F φ= (20)
where lo
j is the liquid velocity when it flows alone and φl2 is the two-phase multiplier, given by
22 18
1tttt
lXX
++=φ ( 21)
[18], in which ttX is the Martinlli parameter, given by
1.05.09.01��
�
�
��
�
�
��
�
�
��
�
���
���
� −=g
l
l
gtt x
xX
µµ
ρρ
( 22)
4 Experimental apparatus and procedure
In the present work, an in-line tube bundle has been designed and constructed to obtain pressure-drop data
for air-water flows. The flow loop and the corresponding test section are illustrated in figures 2 and 3
respectively. Compressed air was supplied to the test section and was measured and adjusted using
magnetically-coupled rotameters and manual valves. Three flow meters with ranges of 0-0.0039, 0-0.034
ACCEPTED MANUSCRIPT
7
and 0-0.35 kg/s were used in a parallel arrangement. The accuracy of the flow meters was ±1.6%. Water
from the supply tank was measured using one of four different orifice plates, placed in parallel,
downstream of the positive displacement pump. These were accurate to ±1%. The water flow from the
pump could pass to the test section or be returned to the supply tank through the re-circulation line.
Adjustment of the manual valve placed in the re-circulation line gave the required water flow rate.
The test section consisted of five separable sections including a bubble generator, a convergent section, a
settling length, the tube bundle and a second converging section, as shown in figure 3. These parts were
fabricated from Perspex sheet 12 mm thick and joined together by bolts to provide a transparent view of
the flow.
The bubble generator consisted of two pieces of porous tube 110 mm long and 50.0 mm in outside
diameter placed in a rectangular Perspex box 224 mm in height × 100 mm in depth ×100 mm in width.
The porous tube was manufactured by GKN Sinter Metals and had a small effective pore size of 206
microns (SIKA-B). Water entered the Perspex box from below. The air was fed to the porous tubes from
both sides to produce a reasonably even two-phase flow that passed through the first convergent section
and the 224 mm settling length before entering the tube bundle.
The tube bundle consisted of ten rows of tubes 38.0 mm in outside diameter with one full central column
of tubes and two columns of half tubes placed on the walls to reduce bypass leakage. The tubes were 50
mm in length and were arranged in an in-line configuration with a pitch to diameter ratio of 1.32. The
flow from the tube bundle passed through the second convergent section and into an air-water separator,
where the air was released to the atmosphere and the water was returned to the supply tank.
Eleven pressure taps were placed across the rows to allow pressure drops across each tube to be
measured. However, in this study, only the two-phase pressure drops between pressure taps 3 through to
10 are reported. The first two tubes and the last tube were excluded to avoid entrance and exit effects.
The pressure drops were measured using a smart pressure transducer so that the pressure drop range could
be adjusted. The upper range value was set to accommodate the expected pressure drop and thus

ACCEPTED MANUSCRIPT
8
maximize the measurement accuracy. The pressure drop data were collected through a data logger
connected to a PC controlled by Labview software. Before pressure drop readings were taken, all lines in
the pressure-drop measurement system were purged with water to remove any air. The two-phase
pressure drop measurements were conducted at approximately atmospheric pressure with 0.00047 < x <
0.57 and 25 ≤ G ≤ 688 kg/m2s. Each experiment was repeated to ensure repeatability. The pressure
transducer was accurate to ± 0.25%
5 Model comparisons
5.1 Single Phase Pressure Drop
To test the experimental approach, air tests were undertaken at Reynolds numbers of 8920 and 19400.
The loss coefficient for each row was determined from
2
2
u
Pf
ρ∆= ( 23)
where P∆ is the pressure drop across each row, ρ is the density of the air, calculated from the ideal gas
law with the absolute pressure taken from the first pressure tap, and u is the air velocity based on the
largest flow area. The measured loss coefficients are compared with the correlation of ESDU [17] in
figure 4. The figure reveals very large loss coefficients on the first row followed by increasing
coefficients to about row 4, with constant values thereafter, indicating that fully developed flow exists
from about row 4 onwards. The ESDU correlation agrees reasonably well with the measured fully-
developed flow values. This indicates that the approach produces data comparable with previous
researchers and justifies the use of the ESDU correlation for finding values to the single-phase loss
coefficient used in the one-dimensional and two-fluid flow models.
5.2 Two-phase air-water pressure drop
The measured pressure drops were compared with predictions from the two-fluid model and the one-
dimensional model. The one-dimensional model was used with three different void fraction correlations:
Schrage et al. [1], Dowlati et al. [2] and Feenstra et al. [3]. The two-phase friction multiplier was obtained
from Ishihara et al. [18], with the single-phase loss coefficient found from ESDU [17].
ACCEPTED MANUSCRIPT
9
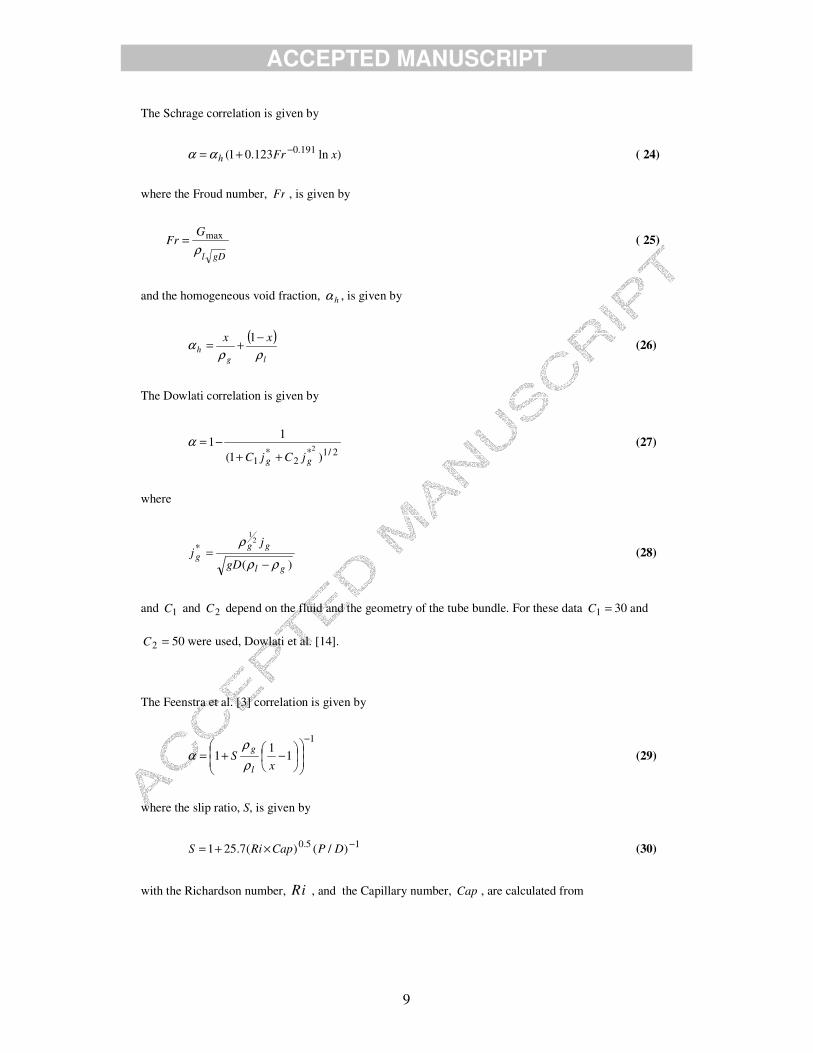
The Schrage correlation is given by
)ln123.01( 191.0 xFrh−+= αα ( 24)
where the Froud number, Fr , is given by
gDl
GFr
ρmax= ( 25)
and the homogeneous void fraction, hα , is given by
( )
lgh
xxρρ
α −+= 1 (26)
The Dowlati correlation is given by
2/1*2
*1 )1(
11
2
gg jCjC ++−=α (27)
where
)(
21
*
gl
ggg
gD
jj
ρρ
ρ
−= (28)
and 1C and 2C depend on the fluid and the geometry of the tube bundle. For these data =1C 30 and
=2C 50 were used, Dowlati et al. [14].
The Feenstra et al. [3] correlation is given by
1
11
1−
��
�
�
��
�
���
���
� −+=x
Sl
g
ρρ
α (29)
where the slip ratio, S, is given by
15.0 )/()(7.251 −×+= DPCapRiS (30)
with the Richardson number, Ri , and the Capillary number, Cap , are calculated from

ACCEPTED MANUSCRIPT
10
2max
2 /)( GDPgRi −∆= ρ and σµµ glCap = (31, 32)
respectively, with the gas-phase velocity determined from
gg
xGu
αρmax= (33)
Figures 5-8 show the predicted pressure drops divided by the measured values varying with the gas mass
fraction, or quality. The two-fluid model, figure 5, is shown to predict the pressure drop data to within
%20± if the mass flux lies between 312 and 688 kg/m2s. However, for mass fluxes out-with this range,
the predictions are poor, particularly for gas mass fractions above 1%. The one-dimensional model, with
the void fractions obtained from the Feenstra et al. [3] correlation, figure 6, or the Dowlati et al. [2],
figure 7, predicts the measured data reasonably well for most mass fluxes. However, for the lower mass
fluxes the predictions are less reliable. In contrast, the one-dimensional model with the Schrage et al. [1]
correlation, figure 8, over-predicts most of the data for mass fluxes between 156 and 688 kg/m2s and is
particularly poor for gas mass fractions above 2%.
5.3 Air-water data of Dowlati
Void-fraction and pressure-drop data were obtained by Dowlati et al. [2]. The experiments were
performed in an in-line tube bundle with 20 rows and 5 columns of tubes with an outside diameter of 19
mm on a pitch to diameter ratio of 1.3. The experimental pressure drops presented were obtained from the
single-phase frictional pressure drops, calculated from the correlation of Zukauskas [19], and the
experimental two-phase multipliers. Figures 9 and 10 show a comparison of void fraction and pressure
drop data for a range of gas mass fractions at mass fluxes of 96 and 503 kg/m2s with predictions from the
two-fluid model and the one-dimensional model with the Feenstra et al [3] correlation, figure 9. The two-
fluid and the one-dimensional model with the Feenstra et al. [3] correlation predict the void fraction data
very well. However, the pressure drop results, figure 10, reveal that both models predict the pressure drop
at a mass flux of 503 kg/m2s reasonably well but at the mass flux of 96 kg/m2s, both models significantly
under predicts the data.
5.4 R113 vapour-liquid data of Dowlati

ACCEPTED MANUSCRIPT
11
Experimental data obtained with R113 as the working fluid were reported by Dowlati et al. [20]. The
experiments were carried out on an in-line tube bundle consisting of five columns and twenty rows of
tubes, 12.7 mm in outside diameter on a 1.3 pitch to diameter ratio. The working fluid was boiled by
feeding heated oil inside the tubes to generate uniform heating on all tubes. Figures 11 and 12 show the
comparison of the two-fluid model predictions with the void fraction measurements at three different
mass fluxes and a range of gas mass fractions. Also included in the figures are the predictions of the one-
dimensional model with he correlations of Feenstra et al. [3] and Dowlati et al. [2]. For these predictions
=1C 10 and =2C 1 were used, Dowlati et al. [20]. The two-fluid model does not predict the measured
void fraction data very well, particularly at low mass flux, figure 11. It over predicts the experimental
data over the range of mass fluxes by an average of 20%. The one-dimensional model with the correlation
of Dowlati et al. [2] under predicts the data at low mass flux and over predicts it at higher values. The
one-dimensional model with the correlation of Feenstra et al. [3] shows reasonable agreement with the
measured data.
Dowlati et al. [20] reported that the two-phase friction multiplier correlation suggested by Ishihara et al.
[18], predicted their experimental friction pressure drop data reasonably well for mass fluxes greater than
100 kg/m2 s. The two-fluid model is compared to this in figure 13 for a range of gas mass fractions. The
two-fluid model substantially under-predicts the data at low gas mass fraction and over-predicts it at
higher values.
6. Discussion
The predictions from the two-fluid model with the interfacial gas-liquid drag coefficient determined from
the correlations proposed by Stevanovic et al. [11] have been compared to several experimental data sets.
The comparison with the pressure-drop measurements from this study is poor, figure 5. The air-water
void fraction data of Dowlati et al. [2] is predicted very well, figure 9. This is not surprising since these
were part of the data set used in the formulation of the drag coefficient correlations. At first sight, the
failure of the model to predict the corresponding pressure drop data is surprising, figure 10. However, the
drag coefficient data were deduced by Simovic et al. [15] from equations 8 and 11, with the forces on the
fluid by the tubes, Fsl and Fsg, determined similarly to the method given in Section 2. Thus, the

ACCEPTED MANUSCRIPT
12
experimental pressure drops were not used in the formulation of the drag coefficient correlations. The
poor agreement in figures 5 and 10 is therefore indicative that the modelling of these forces does not
capture the actual pressure drop characteristics. The drag coefficient correlations were deduced using only
air-water data. The failure to predict the R113 void fraction data of Dowlati et al. [20], figures 11 and 12,
suggests that the scaling parameters used in the formulation of the drag coefficient correlations may not
allow them to be extrapolated to other fluids. Further work is needed to understand the forces on the fluid
by the tubes so that more general drag coefficient correlations can be produced.
For most mass fluxes, the one-dimensional model compares reasonably well with the pressure drop data
from the present study provided either the Dowlati et al. [2] or the Feenstra et al. [3] correlation is used to
determine the void fraction, and the two-phase friction multiplier suggested by Ishihara et al. [18] is used
to predict the frictional pressure drop, figures 6 and 7. The deviation at lower mass fluxes probably results
from failings in the correlation for the two-phase friction multiplier, which has been reported to be
inaccurate at these conditions, Dowlati et al. [2,14,20]. The failure of the model to predict the pressure
drop data of Dowlati et al. [2], figure 10, is again indicative of the failings of the frictional pressure drop
method at low mass fluxes. Dowlati et al. [2] reported that equation 21 predicted the experimental friction
pressure drop data at mass fluxes above 260 kg/m2s. Below this, the model under predicted the data. The
poorer agreement between the R113 void fraction data of Dowlati et al. [20] and the correlation of
Dowlati et al. [2] suggests that it is not as effective for a range of fluids as the correlation of Feenstra et
al. [3]. The over-prediction in pressure drop by the one-dimensional model when the Schrage correlation
is used to predict the void fraction, figure 8, is indicative of the failure of this method to predict air-water
void fractions. Dowlati et al. [2] found that the Schrage et al. [1] correlation underestimated their void
fraction measurements by up to 50%. Feenstra et al. [3] found that their model agreed very well with data
from several investigators, except that of Schrage et al. [1]. Consequently, the higher pressure-drop
predictions observed in figure 8 are probably caused by this void fraction correlation giving a higher
gravity pressure drop than actually occurred. The under-predictions are again due to the low mass flux
shortcomings of the frictional pressure drop method. Further work is therefore required to investigate the
frictional pressure drop at low mass fluxes.

ACCEPTED MANUSCRIPT
13
Most of the experiments reported are for controlled forced convection flows. In a kettle reboiler, the
recirculation results from density differences between the in-bundle flow and the liquid flow between the
bundle and the shell wall. These flows are one-dimensional at heat fluxes below 10 kW/m2, Burnside et al
[6]. To show the consequences of the modelling approaches, a 17 tube column bundle of tubes, 19 mm in
diameter on a 25 mm square pitch array was simulated to boil R113 at atmospheric pressure at a heat flux
of 10 kW/m2. The pressure head was fixed as the hydrostatic head of liquid, which is a common design
practice. A mass flux of 151 kg/m2s was predicted by the two-fluid model while 138 kg/m2s was
predicted by the one-dimensional model using the Feenstra et al [3] correlation. This is not significantly
different. However, the void fraction predictions are compared in figure 14, where the two-fluid model is
shown to significantly over-predict the void fraction.
7. Conclusions
This study has investigated the modelling of one-dimensional data with one-dimensional methods. Of
those investigated, the most accurate modelling method is the one-dimensional model with the Feenstra et
al. [3] correlation used to find the void fraction and the Ishihara correlation [18] used to determine the
two-phase multiplier and this is the best design method for kettle reboilers at low heat fluxes, less than
10 kW/m2. However, kettle reboilers at higher heat fluxes have a two-dimensional flow field, Burnside et
al. [6]. Further work is therefore required to extend the one-dimensional models to two-dimensions. These
methods should reduce to the one-dimensional flow model at low heat flux and therefore could be based
on some form of extrapolation of them.
8. Nomenclature
pA Cross sectional area of the bubble S Slip ratio
Cap Capillary number u Velocity
DC Drag coefficient x Quality
D Tube diameter ttX Martinelli parameter
pD Bubble diameter Greek
ACCEPTED MANUSCRIPT
14
Fr Froude number φ Porosity
glF Force on the liquid by the gas per unit volume ρ Density
slF Force on liquid by the solid per unit volume ε Volume fraction
sgF Force on the gas by the solid per unit volume α Void fraction
G Mass flux σ Surface tension
g Gravity acceleration 2lφ Two phase friction multiplier
j Superficial velocity µ Viscosity
*gj Dimensionless gas velocity Subscripts
k Single loss coefficient l Liquid
N Number of bubbles g Gas
P Tube pitch min Minimum
Q Volume liquid flow rate max maximum
8. References
[1]. Schrage, D. S., Hsu, J. T. and Jensen, M. K., 1988, Two-Phase Pressure Drop in Vertical Crossflow
across a Horizontal Tube Bundle, AIChE Journal, Vol. 34(1), pp. 107-115.
[2]. Dowlati, R., Kawaji, M. and Chan, A. M. C., 1990, Pitch-to-Diameter Effect on Two-Phase Flow
across an in-Line Tube Bundle, AIChE Journal, Vol. 36(5), pp. 765-772.
[3]. Feenstra, P. A., Weaver, D. S. and Judd, R. L., 2000, Improved Void Fraction Model for Two-Phase
Cross-Flow in Horizontal Tube Bundles, International Journal of Multiphase Flow, Vol. 26(11), pp.
1851-1873.
[4]. Lockhart, R. W. and Martinelli, R. C., 1949, Proposed Correlation of Data for Isothermal Two-Phase,
Two-Component Flow in Pipes, Chemical Engineering Progress, Vol. 45(1), pp. 39-48.
[5]. Chisholm, D. and Laird, A. D. K., 1958, Two-Phase Flow in Rough Tubes, Trans. ASME, Vol. 80(2),
pp. 276–286.
[6]. Burnside, B. M., Miller, K. M., McNeil, D. A. and Bruce, T., 2001a, Heat Transfer Coefficient
Distributions in an Experimental Kettle Reboiler Thin Slice, Chemical Engineering Research and Design,

ACCEPTED MANUSCRIPT
15
Vol. 79(4), pp. 445-452.7.
[7]. Burnside, B. M., 1999, 2-D Kettle Reboiler Circulation Model, International Journal of Heat and
Fluid Flow, Vol. 20(4), pp. 437-445.
[8]. Edwards, D. P. and Jensen, M. K., 1991, Two-Dimensional Numerical Model of Two-Phase Heat
Transfer and Fluid Flow in a Kettle Reboiler, American Society of Mechanical Engineers, Heat Transfer
Division, (Publication) HTD, Minneapolis, MN, USA, Vol. 159, pp. 9-16
[9]. Rahman, F. H., Gebbie, J. G. and Jensen, M. K., 1996, Interfacial Friction Correlation for Shell-Side
Vertical Two-Phase Cross-Flow Past Horizontal in-Line and Staggered Tube Bundles, International
Journal of Multiphase Flow, Vol. 22(4), pp. 753-766.
[10]. Stosic, Z. V. and Stevanovic, V. D., 2002, Advanced Three-Dimensional Two-Fluid Porous Media
Method for Transient Two-Phase Flow Thermal-Hydraulics in Complex Geometries, Numerical Heat
Transfer, Part B: Fundamentals, Vol. 41(3-4), pp. 263-289.
[11]. Stevanovic, V. D., Stosic, Z. V., Kiera, M. and Stoll, U., 2002a, Horizontal Steam Generator
Thermal-Hydraulics at Various Steady-State Power Levels, International Conference on Nuclear
Engineering, Proceedings, ICONE, Arlington, VA, United States, Vol. 3, pp. 767-779
[12]. Stevanovic, V. D., Stosic, Z. V., Kiera, M. and Stoll, U., 2002b, Numerical Simulation and Analyses
of the Loss of Feedwater Transient at the Unit 4 of Kola Npp, International Conference on Nuclear
Engineering, Proceedings, ICONE, Arlington, VA, United States, Vol. 3, pp. 781-792
[13]. Pezo, M., Stevanovic, V. D. and Stevanovic, Z., 2006, A Two-Dimensional Model of the Kettle
Reboiler Shell Side Thermal-Hydraulics, International Journal of Heat and Mass Transfer, Vol. 49(7-8),
pp. 1214-1224.
[14]. Dowlati, R., Chan, A. M. C. and Kawaji, M., 1992a, Hydrodynamics of Two-Phase Flow across
Horizontal in-Line and Staggered Rod Bundles, Journal of Fluids Engineering, Transactions of the
ASME, Vol. 114(3), pp. 450-456.
[15]. Simovic, Z. R., Ocokoljic, S. and Stevanovic, V. D., 2007, Interfacial Friction Correlations for the
Two-Phase Flow across Tube Bundle, International Journal of Multiphase Flow, Vol. 33(2), pp. 217-226.
[16]. Ishii, M. and Zuber, N., 1979, Drag Coefficient and Relative Velocity in Bubbly, Droplet or
Particulate Flows, AIChE Journal, Vol. 25(5), pp. 843-855.
[17]. ESDU, 1979, Crossflow Pressure Loss over Banks of Plain Tubes in Square and Triangular Arrays

ACCEPTED MANUSCRIPT
16
Including Effects of Flow Direction, Engineering Sciences Data Unit, Vol.(79034), pp. 17.
[18]. Ishihara, K., Palen, J. W. and Taborek, J., 1980, Critical Review of Correlations for Predicting Two-
Phase Flow Pressure Drop across Tube Banks, Heat Transfer Engineering, Vol. 1(3), pp. 23-32.
[19]. Zukauskas, A., 1972, Heat Transfer from Tubes in Crossflow (Heat Transfer and Hydraulic
Resistance of Single Banks and Systems of Tubes in Cross Flow of Gases and Viscous Liquids),
Advances in heat transfer., Vol. 8, pp. 93-160.
[20]. Dowlati, R., Kawaji, M. and Chan, A. M. C., 1996, Two-Phase Crossflow and Boiling Heat Transfer
in Horizontal Tube Bundles, Journal of Heat Transfer, Transactions ASME, Vol. 118(1), pp. 124-131.
Figure captions
Figure 1: typical kettle reboiler, Pezo et al., [13]
Figure 2: In-bundle flow loop
Figure 3: Test section
Figure 4: Variation of the air-only loss coefficient with row number
Figure 5: Variation of predicted to measured pressure drop with quality for the two-fluid model
Figure 6: Variation of predicted to measured pressure drop with quality for the one-dimensional model with the Feenstra correlation
Figure 7: Variation of predicted to measured pressure drop with quality for the one-dimensional model with the Dowlati correlation
Figure 8: Variation of predicted to measured pressure drop with quality for the one-dimensional model with the Shrage correlation
Figure 9: Variation of void fraction with quality
Figure 10: Variation of pressure drop with quality
Figure 11: Variation of void fraction with quality
Figure 12: Variation of void fraction with quality
Figure 13: Variation of two-phase frictional pressure drop with quality
Figure 14: Variation of void fraction with row number for a tube bundle boiling atmospheric R113
at 10 kW/m2

ACCEPTED MANUSCRIPT
Liquid inlet
Liquid outlet
Liquid inlet
Hot fluid outlet
Liquid recirculation Weir Tube
bundle Baffles
Hot fluid inlet
Vapour outlet
Vapour outlet
Figure 1: typical kettle reboiler, Pezo et al., [13]

ACCEPTED MANUSCRIPT
Figure 2: In-bundle flow loop

ACCEPTED MANUSCRIPT
Figure 3: Test section

ACCEPTED MANUSCRIPT
Figure 4: Variation of the air-only loss coefficient with row number
-10.0
0.0
10.0
20.0
30.0
40.0
0 1 2 3 4 5 6 7 8 9 10 11
Row number
Loss
Coe
ffici
ent
test 1 at Re=19400test 2 at Re=19400ESDU at Re=19400test 1 at Re=8920test 2 at Re=8920ESDU at Re=8920

ACCEPTED MANUSCRIPT
Figure 5: Variation of predicted to measured pressure drop with quality for the two-fluid model
0
0.2
0.4
0.6
0.8
1
1.2
1.4
1.6
1.8
2
0.0001 0.001 0.01 0.1 1
Quality
Pred
icte
d / m
easu
red
pres
sure
dro
p
25 65
105 156
208 312
416 541
688
+20%
-20%

ACCEPTED MANUSCRIPT
Figure 6: Variation of the predicted to measured pressure drop with quality for the one-dimensional model with the Feenstrcorrelation
0
0.2
0.4
0.6
0.8
1
1.2
1.4
1.6
1.8
2
0.0001 0.001 0.01 0.1 1
Quality
Pred
icte
d / m
easu
red
pres
sure
dro
p
25 65
105 156
208 312
416 541
688+20%
-20%

ACCEPTED MANUSCRIPT
Figure 7: Variation of the predicted to measured pressure drop with quality for the one-dimensional model with the Dowlacorrelation
0
0.2
0.4
0.6
0.8
1
1.2
1.4
1.6
1.8
2
0.0001 0.001 0.01 0.1 1
Quality
Pred
icte
d / m
easu
red
pres
sure
dro
p
25 65
105 156
208 312
416 541
688
+20%
-20%

ACCEPTED MANUSCRIPT
Figure 8: Variation of the predicted to measured pressure drop with quality for the one-dimentional model with the Shragcorrelation
0
0.2
0.4
0.6
0.8
1
1.2
1.4
1.6
1.8
2
0.0001 0.001 0.01 0.1 1
Quality
Pred
icte
d / m
easu
red
pres
sure
dro
p
25 65105 156208 312416 541688
+20%
-20%

ACCEPTED MANUSCRIPT
Figure 9: Variation of void fraction with quality
0
0.2
0.4
0.6
0.8
1
0.0001 0.001 0.01 0.1 1
Quality
Void
frac
tion
96 kg/m2s
503 kg/m2s
two-fluid model
one-dimensional model with Feenstra

ACCEPTED MANUSCRIPT
Figure 10: Variation of pressure drop with quality
0
100
200
300
400
500
600
700
0.0001 0.001 0.01 0.1 1
Quality
Pres
sure
dro
p (P
a)
96 kg/m2s
50 kg/m2s
two-fluid model
one-dimentional model with Feenstra

ACCEPTED MANUSCRIPT
Figure 11: Variation of void fraction with quality
0
0.2
0.4
0.6
0.8
1
0.001 0.01 0.1 1Quality
Void
frac
tion
two-fluid modelone-dimensional model with Feenstraone-dimensional model with Dowlati90 kg/m2s910 kg/m2s

ACCEPTED MANUSCRIPT
Figure 12: Variation of void fraction with quality
0
0.2
0.4
0.6
0.8
1
0.001 0.01 0.1
Quality
Void
frac
tion
one-dimensional model with Feenstratwo-fluid modelone-dimensional model with Dowlati520 kg/m2s

ACCEPTED MANUSCRIPT
Figure 13: Variation of two-phase frictional pressure drop with quality
0
100
200
300
400
500
600
700
0.001 0.01 0.1
Quality
Two-
phas
e fr
ictio
n pr
essu
re d
rop
(Pa)
two-fluid model
one-dimensional model
Gmax=910 kg/m2s
Gmax=520 kg/m2s

ACCEPTED MANUSCRIPT
Figure 14: Variation of void fraction with row number for a tube bundle boiling atmospheric R113 at 10 kW/m 2
0.0
0.1
0.2
0.3
0.4
0.5
0.6
0.7
0 2 4 6 8 10 12 14 16 18
Row number
Voi
d fr
actio
n
two-fluid model
one-dimensional model with Feenstra