Experimental and numerical investigation of buckling in rectangular steel plates with groove
12
Mohtaram et al. / J Zhejiang Univ-Sci A (Appl Phys & Eng) 2012 13(6):469-480 469 Experimental and numerical investigation of buckling in rectangular steel plates with groove-shaped cutouts Y. Faradjian MOHTARAM 1 , J. Taheri KAHNAMOUEI †‡1 , M. SHARIATI 2 , B. BEHJAT 3 ( 1 Mechanical Department, Islamic Azad University, Bostan Abad Branch, Iran) ( 2 Mechanical Department, Shahrood University of Technology, Shahrood, Iran) ( 3 Mechanical Department, Sahand University of Technology, Tabriz, Iran) † E-mail: [email protected] Received Oct. 18, 2011; Revision accepted Dec. 21, 2011; Crosschecked May 9, 2012 Abstract: Steel plates are widely used in various structures, such as the deck and bodies of ships and bridges, and in the aero- space industry. In many instances, these plates are subjected to axial compression loads that predispose the sheets to instability and buckling. In this study, we investigate the buckling and post-buckling behaviors of steel plates having groove-shaped cutouts of various dimensions and angles using finite element method (FEM) (by ABAQUS software) and experimental tests (by an Instron servohydraulic machine). Boundary conditions were clamped by supports at upper and lower ends and free supports at the other edges. The results of both numerical and experimental analyses are compared, which show a very good agreement between them. Finally, based on the experimental findings, formulas are presented for the determination of the buckling load of such plates. Key words: Buckling, Steel plates, Cutout, Experimental analysis, Finite element method (FEM) doi:10.1631/jzus.A1100226 Document code: A CLC number: O343 1 Introduction Steel plates are widely used in various structures, such as parts of ships and bridges, and in the aero- space industries. In many cases, these structures are exposed to compressive stresses, which predispose the plates to instability and buckling. The problem of the buckling of rectangular plates with four simple supports was first considered by Timoshenko and Gere (1961) and modified by Gerstle (1967) and Brush and Almorth (1975). El-Sawy and Nazmy (2001) used the finite element method (FEM) to determine the buck- ling load of plates. They assumed simple boundary conditions for all four edges and investigated aspect ratios of 1–4 to determine the impact of this parameter on the buckling load. They studied two cutouts geo- metries, including circular and rectangular cutouts with rounded corners, with cutouts’ center located in different coordinates of the plate. Furthermore, El- Sawy et al. (2004) used the FEM for determination of the buckling load of plates with circular cutouts. They obtained curves for elastic and elastic-plastic stresses according to the thickness ratio of the plate (b/t) for various steel materials. In their study, the location of the cutout was changed along the longitudinal direc- tion of the plate to determine the effect of cutout lo- cations on the buckling load. Narayanan and Chow (1984) studied the final strength of plates with cutouts under axial compression loads. They used an ap- proximate method to determine the buckling load and verified their theoretical work using empirical results. Shanmugam et al. (1999) studied the buckling and post-buckling behaviors of hole-bearing plates with various boundary conditions under uniaxial and biaxial compression loadings. They used the FEM analysis software ABAQUS to investigate the buck- ling behaviors of square-shaped plates with circular Journal of Zhejiang University-SCIENCE A (Applied Physics & Engineering) ISSN 1673-565X (Print); ISSN 1862-1775 (Online) www.zju.edu.cn/jzus; www.springerlink.com E-mail: [email protected] ‡ Corresponding author © Zhejiang University and Springer-Verlag Berlin Heidelberg 2012
Transcript of Experimental and numerical investigation of buckling in rectangular steel plates with groove

Mohtaram et al. / J Zhejiang Univ-Sci A (Appl Phys & Eng) 2012 13(6):469-480 469
Experimental and numerical investigation of buckling in
rectangular steel plates with groove-shaped cutouts
Y. Faradjian MOHTARAM1, J. Taheri KAHNAMOUEI†‡1, M. SHARIATI2, B. BEHJAT3 (1Mechanical Department, Islamic Azad University, Bostan Abad Branch, Iran)
(2Mechanical Department, Shahrood University of Technology, Shahrood, Iran)
(3Mechanical Department, Sahand University of Technology, Tabriz, Iran) †E-mail: [email protected]
Received Oct. 18, 2011; Revision accepted Dec. 21, 2011; Crosschecked May 9, 2012
Abstract: Steel plates are widely used in various structures, such as the deck and bodies of ships and bridges, and in the aero-space industry. In many instances, these plates are subjected to axial compression loads that predispose the sheets to instability and buckling. In this study, we investigate the buckling and post-buckling behaviors of steel plates having groove-shaped cutouts of various dimensions and angles using finite element method (FEM) (by ABAQUS software) and experimental tests (by an Instron servohydraulic machine). Boundary conditions were clamped by supports at upper and lower ends and free supports at the other edges. The results of both numerical and experimental analyses are compared, which show a very good agreement between them. Finally, based on the experimental findings, formulas are presented for the determination of the buckling load of such plates.
Key words: Buckling, Steel plates, Cutout, Experimental analysis, Finite element method (FEM) doi:10.1631/jzus.A1100226 Document code: A CLC number: O343
1 Introduction
Steel plates are widely used in various structures,
such as parts of ships and bridges, and in the aero-space industries. In many cases, these structures are exposed to compressive stresses, which predispose the plates to instability and buckling. The problem of the buckling of rectangular plates with four simple supports was first considered by Timoshenko and Gere (1961) and modified by Gerstle (1967) and Brush and Almorth (1975). El-Sawy and Nazmy (2001) used the finite element method (FEM) to determine the buck-ling load of plates. They assumed simple boundary conditions for all four edges and investigated aspect ratios of 1–4 to determine the impact of this parameter on the buckling load. They studied two cutouts geo-metries, including circular and rectangular cutouts
with rounded corners, with cutouts’ center located in different coordinates of the plate. Furthermore, El- Sawy et al. (2004) used the FEM for determination of the buckling load of plates with circular cutouts. They obtained curves for elastic and elastic-plastic stresses according to the thickness ratio of the plate (b/t) for various steel materials. In their study, the location of the cutout was changed along the longitudinal direc-tion of the plate to determine the effect of cutout lo-cations on the buckling load. Narayanan and Chow (1984) studied the final strength of plates with cutouts under axial compression loads. They used an ap-proximate method to determine the buckling load and verified their theoretical work using empirical results.
Shanmugam et al. (1999) studied the buckling and post-buckling behaviors of hole-bearing plates with various boundary conditions under uniaxial and biaxial compression loadings. They used the FEM analysis software ABAQUS to investigate the buck-ling behaviors of square-shaped plates with circular
Journal of Zhejiang University-SCIENCE A (Applied Physics & Engineering)
ISSN 1673-565X (Print); ISSN 1862-1775 (Online)
www.zju.edu.cn/jzus; www.springerlink.com
E-mail: [email protected]
‡ Corresponding author © Zhejiang University and Springer-Verlag Berlin Heidelberg 2012
Mohtaram et al. / J Zhejiang Univ-Sci A (Appl Phys & Eng) 2012 13(6):469-480 470
and quadrangular cutouts. Roberts and Azizian (1984) also used the FEM to investigate the elasto- plastic buckling of plates with cutouts. They modeled the plates using triangular elements with three nodes, where each node had five degrees of freedom. Fur-thermore, Mignot et al. (1980) proposed that the in-vestigation of the buckling of plates having cutouts could be reduced to investigate the buckling of plates without cutouts using a method called homogeniza-tion. Maiorana et al. (2008a; 2008b) analyzed the linear buckling of perforated plates subjected to lo-calized symmetrical load, with circular and rectan-gular holes. They also investigated the linear buckling of unstiffened plates under interacting patch loading and bending moment. They focused on estimation of the elastic critical load due to patch load, and con-comitant linearly variable compressive stress in the normal direction, with analysis of mechanisms of plate instability.
Yettram and Brown (1985) studied the stability of square plates using a direct matrix method. They believed that the precision of determination of stress distribution in the plate was an essential factor in the accuracy of the buckling load prediction. Brown (1986)’s analysis results show a good degree of compatibility with Roberts and Azizian (1984)’s re-sults for small cutouts. On the other hand, the mag-nitude of discrepancy is high for large cutouts, and more investigations for determination of the reasons for these discrepancies are needed. Brown and Yet-tram (1986), Brown et al. (1987) and Brown (1990) used the conjugate load/displacement method (CLDM) to predict the elastic buckling load of per-forated square plates with centrally located rectan-gular holes under different types of loads. Maan et al. (2007) used the fixed grid finite element analysis (FGFEA) method to solve the buckling problem. They conduct a detailed analysis of the FGFEA me-thod to generalize it for the solution of eigenvalue problems like the natural frequency and buckling. Singh and Tanveer (2006) studied the buckling ei-genvalue for double joint plates. They used rectan-gular plates with central cutouts, and calculated the buckling coefficient and compared it with the existing findings and FEM results. The elastic buckling be-havior of rectangular perforated plates was studied using the FEM by Komur and Sonmez (2008). They chose circular cutouts at different locations along the
principal x-axis of plates subjected to linearly varying loading to evaluate the effect of cutout location on the buckling behavior of plates. Their results show that the center of a circular hole should not be placed at the end half of the outer panel for all loading patterns. Furthermore, the presence of a circular hole always causes a decrease in the elastic buckling load of plates. Rahai et al. (2008) formulated a new ap-proximate procedure using an energy method based on modified buckling mode shapes for buckling analysis of simply supported rectangular stepped or perforated plates subjected to uniform edge stresses. Eccher et al. (2008; 2009) introduced the general theory of the isoparametric spline finite strip method for buckling of perforated plates. They applied this method to the elastic buckling analysis of perforated folded plate structures. The reliability of their method was also demonstrated by applying it to classical nonlinear complex plate and shell problems, as well as the geometric nonlinear analysis of perforated flat and stiffened plates. Maiorana et al. (2009) studied the linear buckling analyses of square and rectangular plates with circular and rectangular holes in various positions subjected to axial compression and bending moment. They aimed to give some practical indica-tions on the best position of the circular hole and the best position and orientation of rectangular holes in steel plates, when axial compression and bending moment act together. Moen and Schafer (2009) pre-sented closed-form expressions to approximate the influence of multiple holes on the critical elastic buckling stress of plates in bending or compression. The forms of the expressions were founded on clas-sical plate stability approximations, and were devel-oped and validated in parametric studies employing shell finite element (FE). Paik (2008) studied the ultimate strength of perforated steel plates under axial compressive loading along short edges using FEM. The plates were considered to be simply supported along all (four) edges, keeping them straight, and the cutout was circular and located at the center of the plate. Shariati and Rokhi (2010) studied the numerical simulation and analysis of steel cylindrical shells with various diameters and lengths having an elliptical cutout, subjected to axial compression systematically. They examined the influence of the cutout size, cutout angle, and the shell aspect ratios L/D and D/t (D, L and t are the diameter, length and thickness of the

Mohtaram et al. / J Zhejiang Univ-Sci A (Appl Phys & Eng) 2012 13(6):469-480 471
cylindrical shell, respectively) on pre-buckling, buck-ling, and post-buckling responses of the cylindrical shells. Also, Shariati et al. (2011) investigated the effects of length, sector angle, and different boundary conditions on the buckling load and post buckling behavior of cylindrical panels using experimental and numerical methods. Tsavdaridis and D′Mello (2011) studied the behaviors of perforated steel beams with closely spaced web openings and effect of the web opening depth/web thickness to investigate the stabil-ity of the web-post subjected to vertical shear load.
2 Experimental tests
2.1 Mechanical properties of plates
To determine the mechanical characteristics of the specimens, a simple tensile test was performed according to the standard specimen ASTM-E8 using a servohydraulic Instron 8802 machine, and the Young’s modulus, yield stress, and plastic properties were determined. The stress-strain curve produced by the standard tensile test is shown in Fig. 1. Plastic characteristics of material are also required for non-linear analysis using the ABAQUS software. The plastic strain is computed using the following relationship:
realpl real ,
E
(1)
real engln(1 ), (2)
real eng eng(1 ), (3)
where εpl, εreal, and εeng are the plastic strain, real strain, and engineering strain, respectively; σreal and σeng are the real stress and engineering stress, respectively.
Based on the linear section of the stress-strain curve, the Young’s modulus was calculated as E=217 GPa and the yield stress was computed as σy=350 MPa. Furthermore, the Poisson’s ratio was assumed to be ν=0.33.
2.2 Geometry of specimens
In this study, we used plates with a width of 100 mm, length of 150 mm, and thickness of 2.07 mm. The cutouts were grooves with a width of 10 mm. It is notable that in all specimens, the center of the groove
coincides with the center of the plate. Specimen was named as ‘pls-150-100-C-10-θ-2.07’, where 150 and 100 show the length and width (mm) of the rectan-gular plate, respectively; C is the length of groove (mm); 10 is the groove width (mm); θ is the angle between the direction of groove and the longitudinal direction of plate; and, 2.07 is the plate thickness (mm). In this paper, all the specimens’ names are based on this principle, but in some cases the groove width is not exactly the same as the diameter of the end semi-circle of groove, so in those cases we added the dif-ferent value of the real groove width between C and 10 (diameter of the end semicircle of groove) in the names of specimens to show the difference, such as pls-150- 100.2-50-10.3-10-90-2.09. A schematic representation for a specimen pls-150-100-C-10-θ with a groove- shaped cutout is shown in Fig. 2.
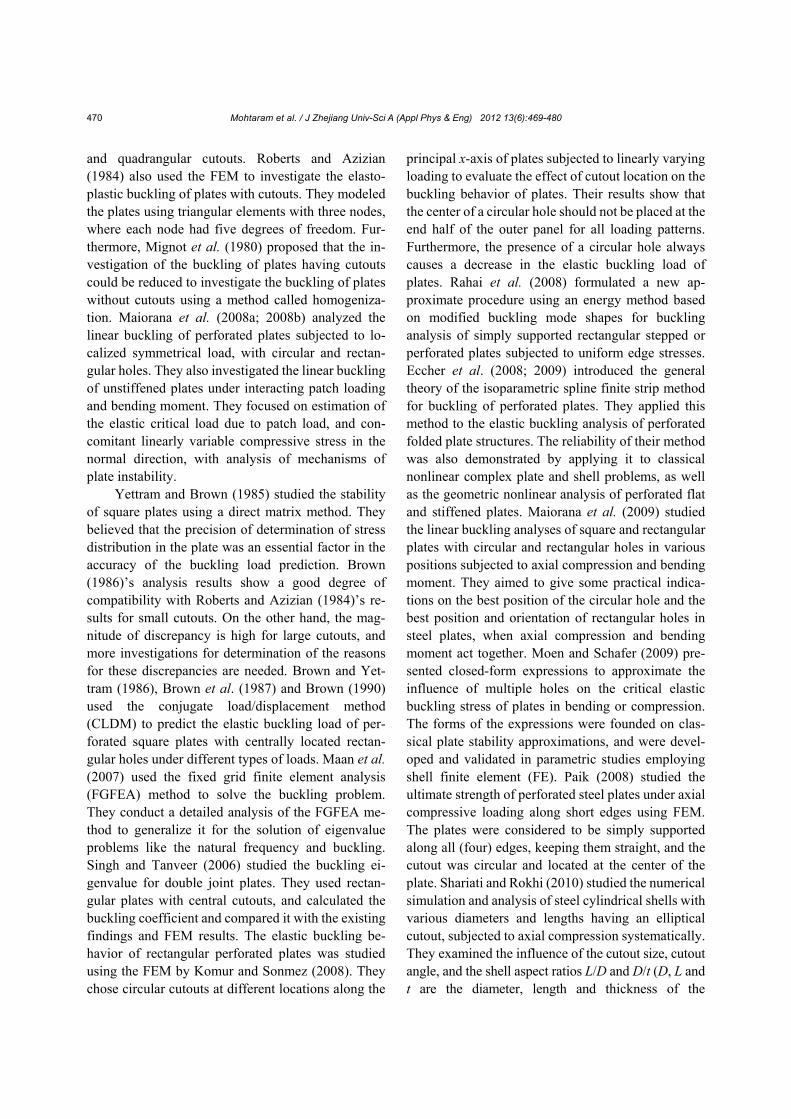
2.3 Test setup
For experimental testing of the buckling of rec-tangular plates, tests were taken from an Instron ser-vohydraulic machine under displacement control. The hydraulic grips of the machine hold the upper and lower edges of the specimens with clamped boundary condition. Also, the lateral edges were free. Therefore, a clamped-free-clamped-free (CFCF) boundary con-dition is created for the plate (Fig. 3).
0
100
200
300
400
500
600
0.00 0.05 0.10 0.15 0.20 0.25
Str
ess
(MP
a)
Strain
Engineering diagram Actual diagram
Fig. 1 Stress-strain curve of tested materials
Fig. 2 Geometry of grooved specimen pls-150-100-C-10-θ
Mohtaram et al. / J Zhejiang Univ-Sci A (Appl Phys & Eng) 2012 13(6):469-480 472
3 Numerical analysis
3.1 Boundary conditions
In the numerical analysis, we modeled two solid planes attached to upper and lower ends of the plates for application of the boundary conditions to the edges of the rectangular plates. The load was applied in concentric form upon the center of the upper solid plane, and resulted in an extensive compression loading on both clamped edges of the plate. All de-grees of freedom of the lower plane and the upper plane were constrained except for movement in the direction of the z axis (the longitudinal direction of the plate). Accordingly, the boundary conditions were free for the side edges (vertical edges) and clamped for the upper and lower edges, which were represented as CFCF.
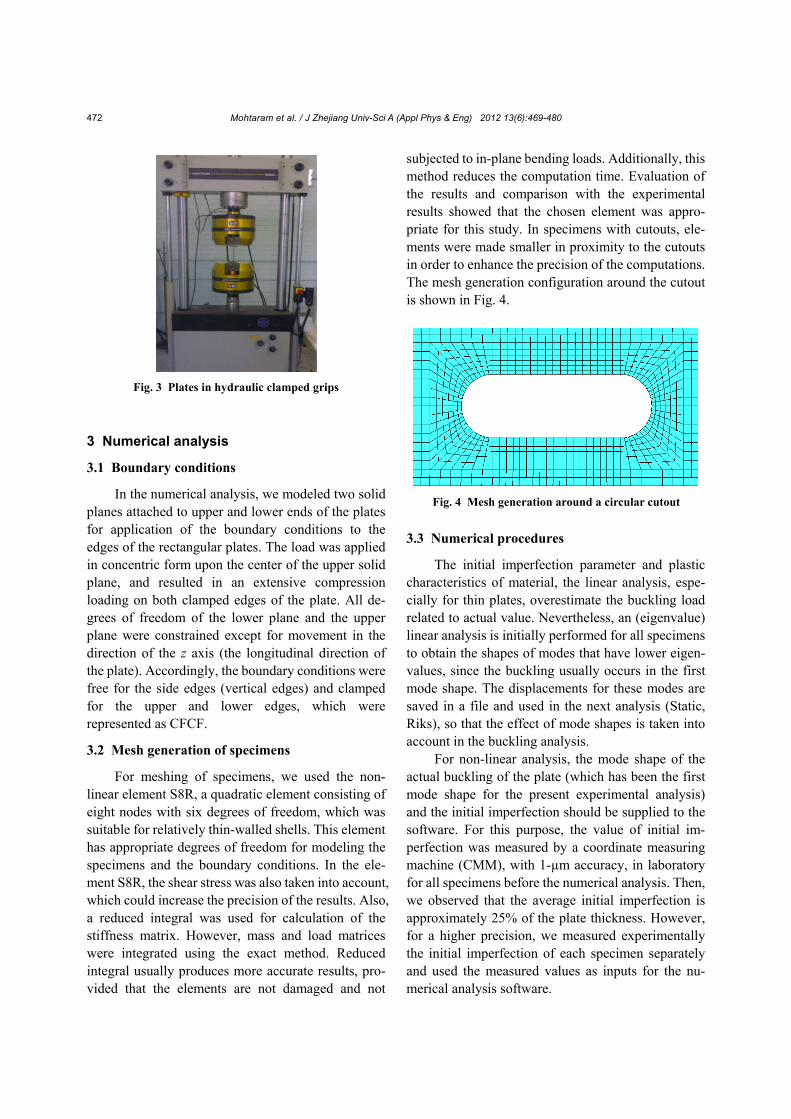
3.2 Mesh generation of specimens
For meshing of specimens, we used the non- linear element S8R, a quadratic element consisting of eight nodes with six degrees of freedom, which was suitable for relatively thin-walled shells. This element has appropriate degrees of freedom for modeling the specimens and the boundary conditions. In the ele-ment S8R, the shear stress was also taken into account, which could increase the precision of the results. Also, a reduced integral was used for calculation of the stiffness matrix. However, mass and load matrices were integrated using the exact method. Reduced integral usually produces more accurate results, pro-vided that the elements are not damaged and not
subjected to in-plane bending loads. Additionally, this method reduces the computation time. Evaluation of the results and comparison with the experimental results showed that the chosen element was appro-priate for this study. In specimens with cutouts, ele-ments were made smaller in proximity to the cutouts in order to enhance the precision of the computations. The mesh generation configuration around the cutout is shown in Fig. 4.
3.3 Numerical procedures
The initial imperfection parameter and plastic characteristics of material, the linear analysis, espe-cially for thin plates, overestimate the buckling load related to actual value. Nevertheless, an (eigenvalue) linear analysis is initially performed for all specimens to obtain the shapes of modes that have lower eigen-values, since the buckling usually occurs in the first mode shape. The displacements for these modes are saved in a file and used in the next analysis (Static, Riks), so that the effect of mode shapes is taken into account in the buckling analysis.
For non-linear analysis, the mode shape of the actual buckling of the plate (which has been the first mode shape for the present experimental analysis) and the initial imperfection should be supplied to the software. For this purpose, the value of initial im-perfection was measured by a coordinate measuring machine (CMM), with 1-µm accuracy, in laboratory for all specimens before the numerical analysis. Then, we observed that the average initial imperfection is approximately 25% of the plate thickness. However, for a higher precision, we measured experimentally the initial imperfection of each specimen separately and used the measured values as inputs for the nu-merical analysis software.
Fig. 3 Plates in hydraulic clamped grips
Fig. 4 Mesh generation around a circular cutout

Mohtaram et al. / J Zhejiang Univ-Sci A (Appl Phys & Eng) 2012 13(6):469-480 473
4 Results
4.1 Results of finite element analysis with groove- shaped cutouts
The numerical analysis results are presented as the buckling mode shapes of the specimens, load- displacement curves, and the relationship between the buckling load and the initial imperfection of speci-mens. The maximum point of the load-displacement curve shows the critical buckling load.
Fig. 5 shows the first mode shape of a buckled specimen. The buckling loads obtained by the nu-merical analysis according to the initial imperfection of specimens with cutout angles of 0°, 30°, 45°, 60°, and 90° are shown in Table 1.
Fig. 6 shows the load-displacement curves of the numerical analysis performed with ABAQUS soft-ware for specimens with groove-shaped cutouts and angles of 0°, 30°, 45°, 60°, and 90°.
Table 1 Results of numerical and experimental analyses for plates with groove-shaped cutouts
Pexp/PnumPexp (N)
Pnum (N)
Imperfection (mm)
Groove angle (°)
Groove length (mm)
Specimen designation
0.98721 604.76 21 876.0 0.50 0 19.94 pls-150-100-19.94-10-0-2.07 1.00422 249.17 22 158.5 0.42 0 30.14 pls-150-100-30.14-10-0-2.07 1.00222 083.04 22 031.6 0.40 0 50.00 pls-150-100-50-10-0-2.07 0.99021 467.37 21 672.6 0.45 0 70.13 pls-150-100-70.13-10-0-2.07 0.99822 495.04 22 546.5 0.35 0 90.15 pls-150-100-90.15-10-0-2.07 1.00123 536.93 23 497.0 0.30 30 20.00 pls-150-100-20-10-30-2.07 0.99421 542.65 21 667.6 0.43 30 29.70 pls-150-100-29.7-10-30-2.07 1.00122 961.96 22 937.4 0.25 30 39.80 pls-150-100-39.8-10-30-2.07 1.00622 308.60 22 166.5 0.30 30 49.60 pls-150-100-49.6-10-30-2.07 0.99319 903.56 20 034.1 0.50 30 59.70 pls-150-100-59.7-10-30-2.07 0.99323 127.08 23 286.8 0.30 45 19.70 pls-150-100-19.7-10-45-2.07 1.00224 409.77 24 344.7 0.15 45 29.70 pls-150-100-29.7-10-45-2.07 0.96120 306.26 21 122.6 0.35 45 39.70 pls-150-100-39.7-10-45-2.07 0.98622 331.68 22 645.3 0.15 45 49.70 pls-150-100-49.7-10-45-2.07 0.99920 583.13 20 602.8 0.25 45 59.70 pls-150-100-59.7-10-45-2.07 1.01523 320.16 22 962.4 0.30 60 19.70 pls-150-100-19.7-10-60-2.07 1.00921 523.59 21 330.0 0.35 60 29.70 pls-150-100-29.7-10-60-2.07 0.97817 996.40 18 388.4 0.55 60 39.70 pls-150-100-39.7-10-60-2.07 0.99718 347.03 18 403.5 0.40 60 49.70 pls-150-100-49.7-10-60-2.07 0.99117 683.40 17 834.4 0.30 60 59.70 pls-150-100-59.7-10-60-2.07 0.99823 126.91 23 166.2 0.25 90 20.00 pls-150-100-20-10-90-2.07 0.99821 082.67 21 123.1 0.30 90 30.00 pls-150-100-30-10-90-2.07 0.99319 081.13 19 203.7 0.30 90 40.00 pls-150-100-40-10-90-2.07 0.98117 496.85 17 825.2 0.25 90 50.00 pls-150-100-50-10-90-2.07 0.98314 401.54 14 649.1 0.38 90 60.00 pls-150-100-60-10-90-2.07
Pexp: experimental buckling load; Pnum: numerical analysis buckling load
Fig. 5 The first mode shape of the specimen pls-150-100-59.7-10-30

Mohtaram et al. / J Zhejiang Univ-Sci A (Appl Phys & Eng) 2012 13(6):469-480 474
4.2 Results of experimental analysis for specimens with groove-shaped cutouts
Fig. 7 shows the modes shapes of several dif-ferent specimens. Furthermore, the experimental load-displacement curves of several specimens are shown in Fig. 8.
5 Comparisons of numerical and experi-mental results
In this section, the experimental and numerical load-displacement curves and buckling modes of some specimens are compared. Finally, formulas are proposed for the calculation of the buckling load of plates with groove-shaped cutouts based on the ex-perimental results.
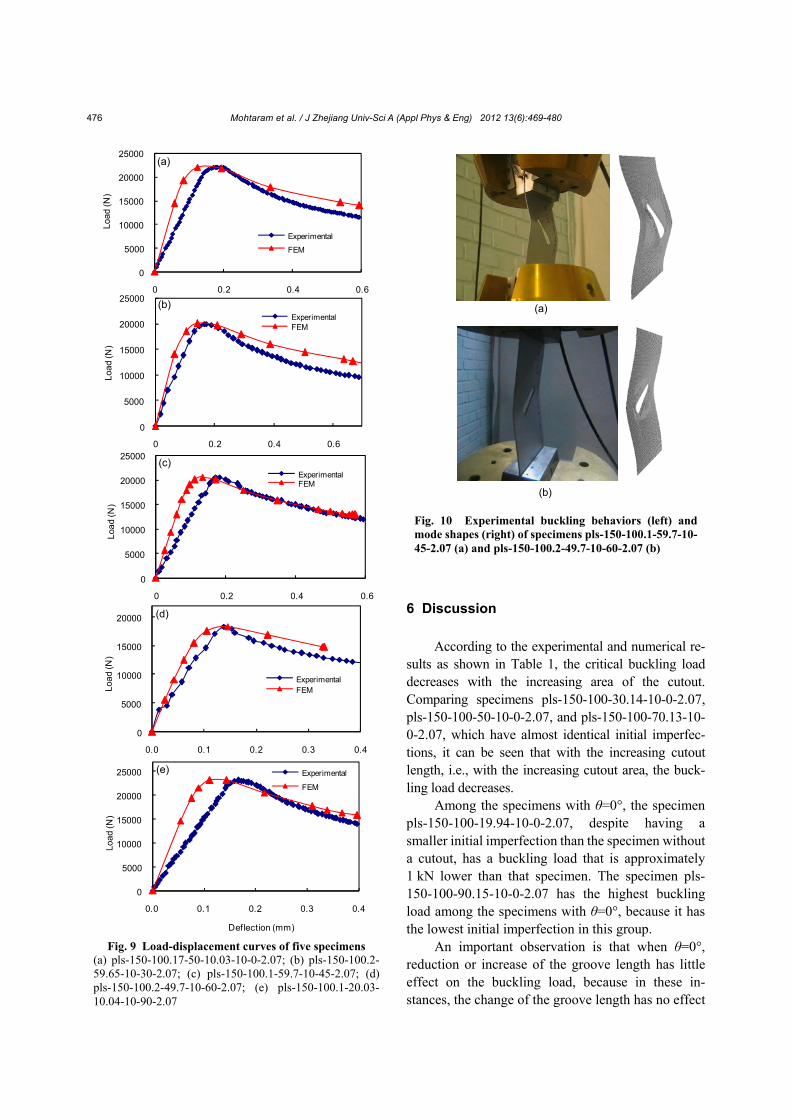
In Fig. 9, the load-displacement curves obtained by FEM are shown with the experimental results for five specimens. In Fig. 10, the experimental buckling modes of two specimens are displayed accompanied by the buckling modes obtained by numerical analysis using ABAQUS software.
Furthermore, Table 1 shows the buckling loads of experimental and numerical analyses and initial im-perfection values for specimens with groove-shaped cutouts with θ=0°, 30°, 45°, 60°, and 90°, respectively.
As is evident from all load-displacement curves, the slope of the elastic part of load-displacement curves is slightly higher for the numerical analysis than the experimental analysis; in most cases, the experi-mental buckling loads are lower than the numerical values. In reality, since the material is not perfectly homogeneous and there are impurities in the bulk of the plate and micro-structural defects, the buckling load is usually lower than the value predicted for the ideal material. In other words, these defects are not taken into account in the numerical analysis.
In all specimens having groove-shaped cutouts with θ=30°, the difference between the experimental and numerical results is less than 0.6%. The average difference between the experimental and numerical results for all specimens is 0.4%. This is a reason for the validity of FEM using ABAQUS software.
Additionally, as can be observed in Fig. 10, the experimental and numerical buckling mode shapes are quite similar. The results of both methods closely fit with each other and therefore, the experimental results confirm the validity of FEM.
Fig. 6 Numerical load-displacement curves of specimens include groove-shaped cutouts with different lengths at θ=0° (a), θ=30° (b), θ=45° (c), θ=60° (d), and θ=90° (e)
0
5000
10000
15000
20000
25000
0 0.2 0.4 0.6 0.8
Load
(N
)
pls-150-99.92-49.6-10-30-2.07
pls-150-100.2-20-10-10-30-2.07
pls-150-100.2-29.7-10-10-30-2.07
pls-150-100.2-59.65-10-30-2.07
pls-150-100.15-39.8-10.02-10-30-2.07
0
5000
10000
15000
20000
25000
0 0.2 0.4 0.6 0.8
Load
(N)
pls-150-100.1-19.94-10.03-10-0-2.07pls-150-100.12-90.15-10-10-0-2.07pls-150-100.16-70.13-10.02-10-0-2.09pls-150-100.17-50-10.03-10-0-2.07pls-150-100.22-30.14-10.04-10-0-2.07
(a)
(b)
0
5000
10000
15000
20000
25000
0.0 0.2 0.4 0.6 0.8 1.0
Load
(N)
Deflection (mm)
pls-150-100.1-20.03-10.04-10-90-2.07pls-150-100.2-50-10.3-10-90-2.07pls-150-100.2-60-10.04-10-90-2.07pls-150-100.03-40.15-10.1-10-90-2.07pls-150-100.07-30.1-10.06-10-90-2.07
(e)
0
5000
10000
15000
20000
25000
0 0.1 0.2 0.3 0.4 0.5 0.6
Load
(N)
pls-150-100.1-19.67-10-60-2.07
pls-150-100.1-39.7-10-60-2.07
pls-150-100.2-49.7-10-60-2.07
pls-150-100.08-29.65-10-60-2.07
pls-150-100.08-59.65-10-60-2.07
(d)
0
5000
10000
15000
20000
25000
0 0.1 0.2 0.3 0.4 0.5 0.6
Load
(N)
pls-150-100.1-29.7-10-45-2.07
pls-150-100.1-39.7-10-45-2.07
pls-150-100.1-59.7-10-45-2.07
pls-150-100.18-49.7-10.05-45-2.07
pls-150-100.25-19.7-10-45-2.07
(c)

Mohtaram et al. / J Zhejiang Univ-Sci A (Appl Phys & Eng) 2012 13(6):469-480 475
pls-150-100.03-40.15-10.1-10-90
Fig. 7 Mode shapes and buckling behaviors of some groove-shaped specimens (thickness 2.07 mm)
pls-150-100-30.14-10-0 pls-150-100-90.15-10-0
pls-150-100-59.65-10-30 pls-150-100-49.6-10-30
pls-150-100-49.7-10-45 pls-150-100-39.7-10-45
pls-150-100-49.7-10-60 pls-150-100-29.65-10-60
pls-150-100.2-50-10.3-10-90
Fig. 8 Experimental load-displacement curves of speci-mens include groove-shaped cutouts with different lengths at θ=0° (a), θ=30° (b), θ=45°(c), θ=60°(d), and θ=90° (e)
0
5000
10000
15000
20000
25000
30000
0 0.4 0.8 1.2 1.6
Lo
ad
(N)
pls-150-100.1-29.7-10-45-2.07pls-150-100.1-39.7-10-45-2.07pls-150-100.1-59.7-10-45-2.07pls-150-100.18-49.7-10.05-45-2.07pls-150-100.25-19.7-10-45-2.07
0
5000
10000
15000
20000
25000
0 0.1 0.2 0.3 0.4 0.5 0.6 0.7
Load
(N)
pls-150-100.1-19.94-10.03-10-0-2.07pls-150-100.12-90.15-10-10-0-2.07pls-150-100.16-70.13-10.02-10-0-2.09pls-150-100.17-50-10.03-10-0-2.07pls-150-100.22-30.14-10.04-10-0-2.07
0
5000
10000
15000
20000
25000
0.0 0.4 0.8 1.2 1.6
Loa
d (N
)
pls-150-99.92-49.6-10-30-2.07pls-150-100.2-20-10-10-30-2.07pls-150-100.2-29.7-10-10-30-2.07pls-150-100.2-59.65-10-30-2.07pls-150-100.15-39.8-10.02-10-30-2.07
0
5000
10000
15000
20000
0 0.4 0.8 1.2 1.6
Lo
ad (N
)
pls-150-100.1-19.67-10-60-2.07pls-150-100.1-39.7-10-60-2.07pls-150-100.2-49.7-10-60-2.07pls-150-100.08-29.65-10-60-2.07pls-150-100.08-59.65-10-60-2.07
0
5000
10000
15000
20000
0.0 0.4 0.8 1.2 1.6
Lo
ad
(N)
Deflection (mm)
pls-150-100.1-20.03-10.04-10-90-2.07pls-150-100.2-50-10.3-10-90-2.07pls-150-100.2-60-10.04-10-90-2.07pls-150-100.03-40.15-10.1-10-90-2.07pls-150-100.07-30.1-10.06-10-90-2.07
(b)
(a)
(c)
(d)
(e)
Mohtaram et al. / J Zhejiang Univ-Sci A (Appl Phys & Eng) 2012 13(6):469-480 476
6 Discussion
According to the experimental and numerical re-
sults as shown in Table 1, the critical buckling load decreases with the increasing area of the cutout. Comparing specimens pls-150-100-30.14-10-0-2.07, pls-150-100-50-10-0-2.07, and pls-150-100-70.13-10- 0-2.07, which have almost identical initial imperfec-tions, it can be seen that with the increasing cutout length, i.e., with the increasing cutout area, the buck-ling load decreases.
Among the specimens with θ=0°, the specimen pls-150-100-19.94-10-0-2.07, despite having a smaller initial imperfection than the specimen without a cutout, has a buckling load that is approximately 1 kN lower than that specimen. The specimen pls- 150-100-90.15-10-0-2.07 has the highest buckling load among the specimens with θ=0°, because it has the lowest initial imperfection in this group.
An important observation is that when θ=0°, reduction or increase of the groove length has little effect on the buckling load, because in these in-stances, the change of the groove length has no effect
Fig. 10 Experimental buckling behaviors (left) and mode shapes (right) of specimens pls-150-100.1-59.7-10- 45-2.07 (a) and pls-150-100.2-49.7-10-60-2.07 (b)
(a)
(b)
Fig. 9 Load-displacement curves of five specimens (a) pls-150-100.17-50-10.03-10-0-2.07; (b) pls-150-100.2-59.65-10-30-2.07; (c) pls-150-100.1-59.7-10-45-2.07; (d) pls-150-100.2-49.7-10-60-2.07; (e) pls-150-100.1-20.03-10.04-10-90-2.07
0
5000
10000
15000
20000
25000
0.0 0.1 0.2 0.3 0.4
Lo
ad
(N)
Deflection (mm)
Experimental
FEM
(e)
0
5000
10000
15000
20000
0.0 0.1 0.2 0.3 0.4
Load
(N)
ExperimentalFEM
(d)
(c)
0
5000
10000
15000
20000
25000
0 0.2 0.4 0.6
Loa
d (N
)
ExperimentalFEM
0
5000
10000
15000
20000
25000
0 0.2 0.4 0.6
Loa
d (N
)
ExperimentalFEM
(b)
0
5000
10000
15000
20000
25000
0 0.2 0.4 0.6
Lo
ad
(N)
Experimental
FEM
(a)

Mohtaram et al. / J Zhejiang Univ-Sci A (Appl Phys & Eng) 2012 13(6):469-480 477
on the projection of the groove on the transverse di-rection of the plate. After examination of the other values of θ, it becomes evident that the greater the change in the projection of the groove on the trans-verse direction, the bigger the reduction in the buck-ling load.
In specimens with θ=30°, by examining the specimens pls-150-100-20-10-30-2.07 and pls-150- 100-49.6-10-30-2.07 with identical initial imperfec-tions, we observe that with the increase of the groove length, the buckling load decreases in the specimen pls-150-100-49.6-10-30-2.07 by 5% compared with the specimen pls-150-100-20-10-30-2.07. The spe-cimen pls-150-100-39.8-10-30-2.07 has the highest buckling load among the specimens with θ=30°, be-cause it has the lowest initial imperfection in this group; the specimen pls-150-100-59.65-10-30-2.07 has the lowest buckling load, because it has the longest groove and the highest initial imperfection. In specimens with θ=45°, by examining the specimens pls-150-100-29.7-10-45-2.07 and pls-150-100-49.7- 10-45-2.07, we observe that the buckling load in the specimen pls-150-100-49.7-10.05-45-2.07 decreased by 7% in comparison with the specimen pls-150- 100-29.7-10-45-2.07. Moreover, the lowest buckling load among the specimens with θ=45° is found in the specimen pls-150-100-59.7-10-45-2.07 which has the longest groove-shaped cutout.
In specimens with θ=60°, the buckling load de-creased by 22% from the specimen pls-150-100- 19.67-10-60-2.07 to pls-150-100-59.65-10-60-2.07, i.e., from the specimen with the lowest groove length to the specimen with the highest groove length. In specimens with θ=90°, the effect of changing the groove length is more pronounced than the specimens with lower values of θ, because the groove is com-pletely parallel to the transverse direction of the plate in this group,, and therefore, the projection of the groove on the transverse line has the highest value (in fact, in this instance, the length of the projection is equal to the length of groove). As can be seen, the buckling load in the specimen pls-150-100-20.03- 10-90-2.07 is 23% higher than that of the specimen pls-150-100-50-10-90-2.07, even though both of them have identical initial imperfections. Also the specimen pls-150-100-40.15-10-90-2.07 shows a 10% reduction in the buckling load in relation to the specimen pls-150-100-30.1-10-90-2.07.
The yield load for the steel used in this analysis can be easily computed by multiplying the yield stress obtained from the standard tensile test by the cross section area of the plate. This load is 72 kN. Since the buckling load is much lower than this value in all specimens, it is evident that in all specimens, buckling has occurred in the elastic state.
6.1 Effect of groove angle on buckling load
In this section, we study the effect of the groove angle in specimens with the groove of an equal length. In Fig. 11, the critical load is shown against the groove angle θ for specimens with groove lengths of 20, 30, and 50 mm, respectively. Comparing the re-sults of the buckling load in specimens with the same groove length and identical initial imperfections, we see that with the increase of the angle from 0° to 90°, the buckling load decreases.
Based on these findings, it is observed that in specimens with identical values of the groove angle θ, the buckling load decreases with increasing the length of the groove, and this effect is most prominent when θ=90°. By increasing θ from 0° to 90°, while the groove length is kept constant, the buckling load decreases, and the effect of the change in the groove angle is more pronounced in specimens with longer grooves. For example, the difference in the buckling loads between the specimens with the groove angle θ of 0° and 90° is 5% when the groove length is 30 mm, but 19% when groove length is 50 mm.
Fig. 11 Critical buckling load vs. groove angle for spe-cimens with groove lengths of 20, 30, and 50 mm

Mohtaram et al. / J Zhejiang Univ-Sci A (Appl Phys & Eng) 2012 13(6):469-480 478
6.2 Discussion and analysis of the experimental results
The experimental results in Table 1 clearly show that the buckling load decreases when the cutout area increases. Comparing specimens pls-150-100.22- 30.14-10.04-10-0-2.07, pls-150-100.17-50-10.03-10- 0-2.07, and pls-150-100.16-70.13-10.02-10-0-2.09, which have identical initial imperfections, it can be seen that with an increase in the groove length, i.e., with an increase in the cutout area, the buckling load decreases. The highest buckling load in the group with a groove angle θ=0° is seen with the specimen pls-150-100.12-90.15-10-10-0-2.07 that has the lowest initial imperfection.
In specimens with θ=30°, by comparing speci-mens pls-150-100.2-20-10-10-30-2.07 and pls-150- 99.92-49.6-10-30-2.07, which have identical initial imperfections, we find that with increasing the length of the groove, the buckling load in the specimen pls-150-99.92-49.6-10-30-2.07 is 5% lower than that in the specimen pls-150-100.2-20-10-10-30-2.07. Amongst specimens with θ=30°, pls-150-100.15- 39.8-10.02-10-30-2.07, with the smallest initial im-perfection, has the highest buckling load, and pls-150-100.2-59.65-10-30-2.07, with the highest amount of initial imperfection and longest groove, has the lowest buckling load. In specimens with θ=45°, when comparing specimens pls-150-100.1-29.7-10- 45-2.07 and pls-150-100.18-49.7-10.05-45-2.07, the buckling load in the specimen pls-150-100.18-49.7- 10.05-45-2.07 is 9% lower than that in pls-150-100.1- 29.7-10-45-2.07. In specimens with θ=60°, the buckling load decreases by 24% from the specimens pls-150-100.1-19.67-10-60-2.07 to pls-150-100.08- 59.65-10-60-2.07, i.e., from the shortest to the longest grooves. In specimens with θ=90°, the effect of changing the groove length on the buckling load is bigger than the specimens with smaller values of the angle θ, because in this instance, the groove is com-pletely parallel to the transverse direction of the plate, and consequently, the projection of the groove on the transverse direction of the plate is longer than in other angles. It can be observed that the buckling load for the specimen pls-150-100.1-20.03-10.04-10-90-2.07 is 24% higher than the specimen pls-150-100.2-50-10.3- 10-90-2.07, while both of them have equal initial im-perfections. Also, the buckling load for the specimen pls-150-100.03-40.15-10.1-10-90-2.07 is 9% lower
than that in the specimen pls-150-100.07-30.1-10.06- 10-90-2.07.
An important observation is that when θ=0°, reduction or increase of the groove length has little effect on the buckling load, because in these instances, the change of the groove length has no effect on the projection of the groove on the transverse direction of the plate. After examination of the other values of θ, it becomes evident that the greater the change in the projection of the groove on the transverse direction, the bigger the reduction in the buckling loads. An examination of the results reveals that with the in-creasing of the groove length, the buckling load in-creases in specimens with identical values of θ, and this effect is most pronounced for the specimens with θ=90°. When the groove length is constant, the buckling load decreases when the angle θ increases from 0° to 90°, and this effect is more prominent for specimens with longer grooves.
6.3 Experimental formulas for calculating the buckling loads in plates with groove-shaped cutouts
In this section, we present two equations for calculation of the critical buckling load in plates with groove-shaped cutouts under axial compression load using Lagrange polynomials and the obtained expe-rimental results.
For grooves angles θ between 30° and 90°, the critical bucking load can be obtained by
Pcr=1.261 466 255C4+2 685 423.799
−0.658 774 283 0×10−5C4θ3
+0.001 242 519 265C4θ2−0.072 588 922 05C4θ +0.001 077 229 964C3θ3+11.894 122 89C3θ −0.063 366 503 17C2θ3−304 370.2980C −0.203 354 876 8C3θ2+11.964 008 88C2θ2
−700.037 820 2C2θ+1.580 630 449Cθ3
−298.165 682 2Cθ2+17 429.528 88Cθ +12 215.581 87C2−152 414.4978θ +2611.066 205θ2−207.191 445 7C3
−13.859 292 53θ3. (4)
For groove angle θ=0°, the critical bucking load
can be obtained by
Pcr=0.000 090 597 631 00C4+0.021 858 235 23C3
−5.235 863 804C2+278.814 696 2C +17 933.450 10. (5)

Mohtaram et al. / J Zhejiang Univ-Sci A (Appl Phys & Eng) 2012 13(6):469-480 479
Eqs. (4) and (5) are valid for rectangular plates with a aspect ratio of 1.5, width of 100 mm, and thickness of 2 mm, of which the center coincides with the center of the cutout, the width of the groove is 10 mm, and the initial imperfection is approximately 15%–20% of the plate thickness. Eq. (4) predicts the buckling load for a plate with a groove-shaped cutout where the groove length C is from 20 to 60 mm, and the angle θ is from 30° to 90°. For specimens with θ=0° and variable groove length, Eq. (5) can be used, which is valid for calculation of the buckling load in specimens with a groove length of 20 to 90 mm. It is notable that these formulas are only applicable to plates made of a steel type comparable to the material used for this study. 7 Conclusions
We investigated the buckling of rectangular plates with a thickness ratio of b/t=50, under the clamped boundary conditions for the loaded edges and free boundary conditions for the unloaded edges (CFCF) using FEM and experimental tests. The ef-fects of changing the location and area of the cutout were studied. The experimental results showed very small discrepancies with the numerical results, and therefore, confirmed the validity of the method used for analysis of rectangular plates with groove-shaped cutouts. The conclusions of this study are as follows:
1. Comparison of the curves obtained by the numerical and experimental analyses shows that these two sets of curves are closely fit with each other.
2. The difference between the buckling load obtained by experimental analysis and that calculated by the numerical method is less than 2% in most specimens.
3. The buckling and post-buckling behavior ob-tained by the FEM and the experimental tests are quite similar.
4. The buckling load in all specimens is much lower than the yield load, and elastic buckling occurs in all specimens.
5. The amount of initial imperfection has no ef-fect on the post-buckling of the rectangular plates, but has a high effect on the buckling of the plates.
6. With an increase in the length of the groove, the buckling load increases in specimens with iden-
tical θ, and this effect of decreasing the buckling load is most distinct when θ=90°.
7. In specimens with equal groove lengths, an increase in the value of the groove angle θ decreases the buckling load, and this effect is more obvious in the plates with longer grooves.
8. In plates with a groove angle θ=0°, changing the length of the groove has no effect on the buckling load, because no change happens in the projection of the groove on the transverse direction of the plate. Examination of the other values of θ reveals that the buckling load decreases with an increase in the length of the groove projection on the transverse (horizontal) direction of the plate.
References Brown, C.J., 1990. Elastic buckling of perforated plates sub-
jected to concentrated loads. Computers & Structures, 36(6):1103-1109. [doi:10.1016/0045-7949(90)90218-Q]
Brown, C.J., Yettram, A.L., 1986. The elastic stability of square perforated plates under combination of bending, shear and direct load. Thin-Walled Structures, 4(3):239- 246. [doi:10.1016/0263-8231(86)90005-4]
Brown, C.J., Yettram, A.L., Burnett, M., 1987. Stability of plates with rectangular holes. Journal of Structural En-gineering, 113(5):1111-1116. [doi:10.1061/(ASCE)0733- 9445(1987)113:5(1111)]
Brush, D.O., Almorth, B.O., 1975. Buckling of Bars, Plates, and Shells. McGraw-Hill, New York, USA.
Eccher, G., Rasmussen, K.J.R., Zandonini, R., 2008. Elastic buckling analysis of perforated thin-walled structures by the isoparametric spline finite strip method. Thin-Walled Structures, 46(2):165-191. [doi:10.1016/j.tws.2007.08.030]
Eccher, G., Rasmussen, K.J.R., Zandonini, R., 2009. Geome-tric nonlinear isoparametric spline finite strip analysis of perforated thin-walled structures. Thin-Walled Structures, 47(2):219-232. [doi:10.1016/j.tws.2008.05.013]
El-Sawy, K.M., Nazmy, A.S., 2001. Effect of aspect ratio on the elastic buckling of uniaxially loaded plates with ec-centric holes. Thin-Walled Structures, 39(12):983-998. [doi:10.1016/S0263-8231(01)00040-4]
El-Sawy, K.M., Nazmy, A.S., Martini, M.I., 2004. Elasto- plastic buckling of perforated plates under uniaxial com-pression. Thin-Walled Structures, 42(8):1083-1101. [doi: 10.1016/j.tws.2004.03.002]
Gerstle, K.H., 1967. Basic Structural Design. McGraw-Hill, New York, USA, p.88-90.
Komur, M.A., Sonmez, M., 2008. Elastic buckling of rectan-gular plates under linearly varying in-plane normal load with a circular cutout. Mechanics Research Communica-tions, 35(6):361-371. [doi:10.1016/j.mechrescom.2008. 01.005]
Maan, F.S., Querin, O.M., Barton, D.C., 2007. Extension of the fixed grid finite element method to eigenvalue prob-lems. Advances in Engineering Software, 38(8-9): 607-617. [doi:10.1016/j.advengsoft.2006.08.026]
Mohtaram et al. / J Zhejiang Univ-Sci A (Appl Phys & Eng) 2012 13(6):469-480 480
Maiorana, E., Pellegrino, C., Modena, C., 2008a. Linear buckling analysis of perforated plates subjected to loca-lised symmetrical load. Engineering Structures, 30(11): 3151-3158. [doi:10.1016/j.engstruct.2008.04.024]
Maiorana, E., Pellegrino, C., Modena, C., 2008b. Linear buckling analysis of unstiffened plates subjected to both patch load and bending moment. Engineering Structures, 30(12):3731-3738. [doi:10.1016/j.engstruct.2008.07.002]
Maiorana, E., Pellegrino, C., Modena, C., 2009. Elastic sta-bility of plates with circular and rectangular holes sub-jected to axial compression and bending moment. Thin- Walled Structures, 47(3):241-255. [doi:10.1016/j.tws. 2008.08.003]
Mignot, F., Puel, J.P., Suquet, P.M., 1980. Homogenization and bifurcation of perforated plates. Engineering Science, 18(2):409-414. [doi:10.1016/0020-7225(80)90060-9]
Moen, C.D., Schafer, B.W., 2009. Elastic buckling of thin plates with holes in compression or bending. Thin-Walled Struc-tures, 47(12):1597-1607. [doi:10.1016/j.tws.2009.05.001]
Narayanan, R., Chow, F.Y., 1984. Ultimate capacity of uniax-ially compressed perforated plates. Thin-Walled Structures, 2(3):241-264. [doi:10.1016/0263-8231(84)90021-1]
Paik, J.K., 2008. Ultimate strength of perforated steel plates under combined biaxial compression and edge shear loads. Thin-Walled Structures, 46(2):207-213. [doi:10. 1016/j.tws.2007.07.010]
Rahai, A.R., Alinia, M.M., Kazemi, S., 2008. Buckling anal-ysis of stepped plates using modified buckling mode shapes. Thin-Walled Structures, 46(5):484-493. [doi:10. 1016/j.tws.2007.10.012]
Roberts, T.M., Azizian, Z.G., 1984. Strength of perforated plates subjected to in-plane loading. Thin-Walled Struc-tures, 2(2):153-164. [doi:10.1016/0263-8231(84)90009-0]
Shanmugam, N.E., Thevendran, V., Tan, Y.H., 1999. Design formula for axially compressed perforated plates. Thin- Walled Structures, 34(1):1-20. [doi:10.1016/S0263-8231 (98)00052-4]
Shariati, M., Rokhi, M.M., 2010. Buckling of steel cylindrical shells with an elliptical cutout. International Journal of Steel Structures, 10(2):193-205. [doi:10.1007/BF032 15830]
Shariati, M., Sedighi, M., Saemi, J., Poorfar, A.K., 2011. Numerical analysis and experimental study of buckling behavior of steel cylindrical panels. Steel Research In-ternational, 82(3):202-212. [doi:10.1002/srin.201000071]
Singh, A.V., Tanveer, M., 2006. Eigenvalue analysis of doubly connected plates with different configurations. Journal of Sound and Vibration, 295(1-2):76-93. [doi:10.1016/j.jsv. 2005.12.044]
Timoshenko, S.P., Gere, J.M., 1961. Theory of Elastic Stabil-ity, 2nd Edition. McGraw-Hill, New York, USA.
Tsavdaridis, K.D., D′Mello, C., 2011. Web buckling study of the behaviour and strength of perforated steel beams with different novel web opening shapes. Journal of Con-structional Steel Research, 67(10):1605-1620. [doi:10. 1016/j.jcsr.2011.04.004]
Yettram, A.L., Brown, C.J., 1985. The elastic stability of square perforated plates. Computer & Structures, 21(6): 1267-1272. [doi:10.1016/0045-7949(85)90180-4]


![THERMAL BUCKLING OF FUNCTIONALLY GRADED RECTANGULAR PLATES · 3 investigated thermal buckling behaviour of the FGM plates. Ferreira et al. [12, 13] performed static and dynamic analysis](https://static.fdocuments.in/doc/165x107/5b894e327f8b9a851a8d4dc4/thermal-buckling-of-functionally-graded-rectangular-plates-3-investigated-thermal.jpg)
![Modeling and Buckling Analysis of Rectangular Plates in ANSYSijeas.akdeniz.edu.tr/wp-content/uploads/2019/05/310-329.pdf · For buckling analysis, Swamy [9] presented buckling of](https://static.fdocuments.in/doc/165x107/5fa5d3b4836cc632da4cc815/modeling-and-buckling-analysis-of-rectangular-plates-in-for-buckling-analysis-swamy.jpg)