Experimental and Numerical Behavior of Shallow … A: Civil Engineering Vol. 17, No. 1, pp. 1{10 c...
10
Transcript of Experimental and Numerical Behavior of Shallow … A: Civil Engineering Vol. 17, No. 1, pp. 1{10 c...

Transaction A: Civil EngineeringVol. 17, No. 1, pp. 1{10c Sharif University of Technology, February 2010
Experimental and Numerical Behavior ofShallow Foundations on Sand Reinforced with
Geogrid and Grid Anchor Under Cyclic Loading
N. Hataf1;�, A.H. Boushehrian1 and A. Ghahramani1
Abstract. There are many cases where the foundations of structures are subjected to cyclic loadingin addition to static loading. Oil reservoir foundations with frequent discharges and �lling or roadembankments under repeatable tra�c loads are examples of such foundations. Although the amplitudesof the cyclic load is usually less than the permissible static load, the concern still exists for the amountof uniform and non uniform settlement of such structures. The soil under such foundations may bereinforced with geosynthetics to improve their engineering properties. This paper deals with the e�ectsof using the new generation of reinforcements, grid-anchor, for the purpose of reducing the permanentsettlement of these foundations under the in uence of di�erent proportions of the ultimate load. Otheritems, such as the type and number of reinforcements, as well as the number of loading cycles, are studiedexperimentally. In all cases, the foundation is �rst under the in uence of a �xed static load equal tothe weight of the structure itself and, then, the cyclic load in di�erent proportions of the ultimate load isapplied to it. The results show that by using grid-anchor and increasing the number of their layers in thesame proportion as that of the cyclic load applied, the amounts of permanent settlements are reduced andthe numbers of loading cycles to reach it are decreased. For comparison with the experimental �ndings,similar to the conditions of the tests conducted, numerical models were made using a 3-D �nite elementsoftware. The numerical results showed good agreement with the test results.
Keywords: Reinforced soil; Shallow footing; Cyclic loading; Grid-anchor; Geogrid.
INTRODUCTION
More than 40 years have elapsed since reinforcementswere used for the �rst time to improve the mechanicalproperties of soils. Since then, the type and quality ofreinforcements have been changed dramatically and theuse of polymeric reinforcements, such as geotextiles [1],geogrids [2], geocells [3,4] and tire shreds [5], has beenincreasingly expanding.
Up to now, many experimental and numericalstudies have been made to determine the loading capac-ity of shallow foundations on di�erent soils reinforcedby di�erent elements, such as metal strips, metalrods and geosynthetics. Figure 1 shows the classicalscheme of a system of reinforced soil for a square
1. Department of Civil Engineering, Shiraz University, Shiraz,P.O. Box 71955-683, Iran.
*. Corresponding author. E-mail: [email protected]
Received 4 April 2009; received in revised form 13 September2009; accepted 3 November 2009
Figure 1. Shallow square foundation supported bygeogrid-reinforced sand.
foundation with B�B dimensions and N reinforcementlayers. The dimensions of reinforcements are b � band the distance between their �rst layer and thefoundation bottom is denoted by u. The depth of thereinforcement area can be found using the following

2 N. Hataf, A.H. Boushehrian and A. Ghahramani
equation:
d = u+ (N � 1)h: (1)
Previous studies have given di�erent optimal values forthe ratios u=B, b=B and h=B for optimizing the bearingcapacity of shallow foundations. Binquet and Lee [6]and Guido et al. [7] showed that the ratio, u=B, forthe most suitable state possible under the in uence ofusing reinforcement must be chosen as less than 0.67.Also, they provided the values of (b=B)cr and (d=B)crfor a square foundation on sandy soil reinforced by thegeogrid as follows:
(b=B)cr = 2 to 3; (d=B)cr = 1:25:
Yetimoglu et al. [8] found that the critical value ofu=B, h=B and b=B were equal to 0.25, 0.2 and 4.5,respectively. Adams and Collin [9] also conducted acomprehensive study on geogrid and geocell reinforcedfoundations on 34 large-scale models. The bearingcapacity ratio (BCR = qr=qur), which is de�ned asthe ratio of the bearing capacity of the reinforced soil(qr) to that of the unreinforced soil (qur), was reportedto be 2.63 for the geogrid reinforced foundations, whileBCR equals 1.27 for the geocell-reinforced founda-tions. Das and Shin [10] investigated the behaviorof strip footing on geogrid reinforced sand. Theyfound that full depth geogrid reinforcement may reducethe permanent settlement of a foundation by about20% to 30% compared to one without reinforcement.Unnikrishnan et al. [11] conducted laboratory triaxialtests to investigate the behavior of reinforced clayunder monotonic and cyclic loading. They found thatdue to the provision of sand layers on either side of thereinforcement (sandwich technique) within reinforcedclay soils, the response of the reinforced clay soil byway of an enhanced interfacial bond was improved.Boushehrian and Hataf [12] studied experimentally andnumerically the e�ect of depth to the �rst layer ofreinforcement (u), the spacing between reinforcements(z) and reinforcement sti�ness (EA) on the bearingcapacity of circular and ring foundations on sand.
Chang and Cascante [13] have shown that acritical zone between 0:3B and 0:5B is identi�ed formaximizing the bene�ts of soil reinforcement [13].They found that if the reinforcements are placed withinone footing width (B) below the foundation, BCRand the low strain sti�ness of the reinforced systemare increased by transferring the foundation load todeeper soil layers and, thus, reducing the stresses andstrains underneath the foundation. Mosallanezhad etal. [14] deal with the in uence of a new generationof reinforcement (named by them Grid-Anchor) on anincrease in the bearing capacity of a square foundation.This new reinforcement layer can be put in place andcovered with a compacted soil layer. Therefore, in the
laboratory or in practice, each layers of grid-anchorcan be assembled beforehand in a speci�c dimension(not in roll shape) and then put in place. Therefore,there is no di�erence between the placing time of thissystem of reinforcing and an ordinary geogrid, whilethe production cost of this type is only about 20%more than a conventional geogrid. They found thatthe critical values of u=B, h=B and b=B were equal to0.25, 0.25 and 4.5, respectively. They also showed thatthe BCR for this system was greater than an ordinarygeogrid and equal to 3.0. Table 1 shows the result oftheir research. Shin et al. [15] showed that for the samemaximum depth of reinforcement under a cyclic loadingtest, the shear modulus increases with the number oflayers in depth.
As revealed by previous studies, little research hasbeen performed to obtain the cyclic behavior of shallowfootings on reinforced soils. Most studies have beendone on reinforced soil under static loads. Although anumber of theoretical approaches have been presentedby researchers, there are few cyclic loading experimentson reinforced soils.
In this study, the e�ect of various factors, suchas the amplitude of the cyclic load applied, type andnumber of reinforcements on the amount of permanentsettlement of square foundations and the number of cy-cles required to achieve such an amount of settlement,was examined experimentally.
EXPERIMENTAL MODEL
A steel foundation with a dimension of 200 � 200 mmand a thickness of 25 mm in a metal box with dimen-sions of 1:0� 1:0� 1:0 m and a well graded sand (SW )with the grading as shown in Figure 2 was used.
All tests were conducted on sand with a relativedensity of 70� 5 percent. Reinforcement of the soil wasundertaken in two states: once using common geogridsand then using the grid-anchor system.
The grid-anchor is a 3-dimensional reinforcementsystem that is made adding anchors at an angle of45� with a plastic belt material ending at two polymercubes with dimensions of 10� 10� 10 mm (Figure 3),to an ordinary geogrid sheet according to the patternshown in Figure 4. The system was used for the �rsttime by Mosallanezhad et al. [14]. The characteristics
Table 1. Summary of experimental results [14].
Characteristic Value
h=B 0.25
u=B 0.25
b=B 5.0
c=B 4.0
N 4

Behavior of Shallow Foundations Under Cyclic Loading 3
Figure 2. Grain-size distribution curve for sand.
of the materials used in this study are shown in Tables2, 3 and 4.
The bottom of the foundation was chosen appro-priately rough using a thin sandpaper sheet glued to itusing aquarium glue. The sand was poured in 70 mmlayers into the box by the raining technique and afterthe surface of each layer was leveled, the sand wascompacted by tempering with a smooth wooden boarddropped from 300 mm height, 20 times. To makesure of achieving the concentration degree in question,a small metal vessel with a given volume was placedrandomly in di�erent layers. The geogrids and grid-anchors were placed based on the values obtained fromthe studies of Mosallanezhad et al. [14] on the samesoil with fully similar characteristics. For all testsconducted, the values of u=B = (h=B)cr, (b=B)cr and
Figure 3. Grid-anchor layout.
(d=B)cr were taken as 0.25, 5.0 and 1.25, respectively.The load application system is in the form of
a hydraulic jack, as shown in Figure 5, with thepossibility of applying a controlled pressure stepwiseup to 95 kN. The details of the loading system thatconsists of a jack and its hydraulic unit are shown inFigure 6.
The amount of settlement due to load applica-tion was measured using gauges with an accuracy of0.01 mm, connected to the box body using a magneticbase. The amount of settlement due to load applica-tion was measured using gauges with an accuracy of0.01 mm connected to the box body using a magneticbase.
TEST PROCEDURE
The procedure of the tests was as follows: In the �rststep, the initial �xed load, in the form of a metalcylinder (with a weight of 125 N) with a load per
Figure 4. Arrangement of anchor elements on ordinary geogrid [14].

4 N. Hataf, A.H. Boushehrian and A. Ghahramani
Table 2. Soil parameters.
Parameter Value
Friction angle (degree) 43.0
Cohesion (kPa) 0.0
Maximum dry unit weight (kN/m3) 18.8
Minimum dry weigh (kN/m3) 13.9
Coe�cient of uniformity (Cu) 7.8
Coe�cient of curvature (Cc) 1.8
D60 (mm) 3.5
D30 (mm) 1.5
E�ective grain size (mm) 0.35
Table 3. Properties of reinforcement.
Parameter Value
Elastic axial sti�ness (kN/m) 7.80
Axial sti�ness of anchors (kN) 0.18
Geogrid opening size (mm) 27*27
Length of anchors (mm) 50.00
Table 4. Properties of model foundation.
Parameter Value
Thickness (mm) 25.0
Width and length (mm) 200.0
Figure 5. Test box and hydraulic jack.
area unit of 4 kN/m2 that represents the weight ofthe structure and its accessories, was applied to thefoundation (qs). In the second step, the cyclic load,in the form of a percentage of the ultimate load onthe unreinforced condition, was added to the previous�xed load (qd). The two-above mentioned steps wererepeated for both reinforcement types with a di�erentnumber of layers. Table 5 shows the details of testsconducted in the laboratory. The selected percentagesare 6, 20 and 33 percent (with respect to allowablebearing capacity), respectively.
NUMERICAL MODELING
For comparison with the experimental �ndings, similarto the conditions of the tests conducted, numerical
Figure 6. Schematic of laboratory test setup, loading and reaction system.

Behavior of Shallow Foundations Under Cyclic Loading 5
Table 5. Details of experiments in the laboratory.
Test Series Reinforcement Condition Percent of AppliedLoad (qd=qur)
N
A-1 to A-3 Unreinforced 6,20,33 -
B-1 to B-3 Reinforced with geogrid 6,20,33 1
B-4 to B-6 Reinforced with geogrid 6,20,33 2
B-7 to B-9 Reinforced with geogrid 6,20,33 3
B-10 to B-12 Reinforced with geogrid 6,20,33 4
C-1 to C-3 Reinforced with G-A 6,20,33 1
C-4 to C-6 Reinforced with G-A 6,20,33 2
C-7 to C-9 Reinforced with G-A 6,20,33 3
C-10 to C-12 Reinforced with G-A 6,20,33 4
models were made using the PLAXIS 3-D TUNNEL�nite element software. The software can modeland analyze most geotechnical problems in 3-D form.Among other features of the software, one can mentionthe modeling of the geogrid sheets and anchors con-nected to them in the grid-anchor system by assigningthem axial sti�ness. Figure 7 shows one of the modelsmade using this software.
Another feature of the software is its ability tosimulate the testing process, such as the application oftwo groups of load, one in static form (load systemA) and the other in cyclic form (load system B)with amplitudes equal to selected percentages of theultimate bearing capacity of an unreinforced condi-tion. The number of load cycles is speci�ed bystaged construction modeling. The hypotheses usedin the numerical modeling are given in Table 6. Ahardening soil model was chosen based on two di�erentmodels, which provide a reasonable prediction by the
Figure 7. 3-D modeling created with PLAXIS 3-DTUNNEL.
Table 6. Material set and parameters used in thenumerical modeling.
Characteristic Value
Material model Hardening soil model
Material type Drained
Eref50 10e3 (kN/m2)
Erefur 30e3 (kN/m2)
Erefode 7000 (kN/m2)
�ur 0.2
Power 0.5Eref
50 : Reference secant sti�ness modulus for mobilization of50% of the maximum shear strength.
Erefur : Unloading-reloading modulus of elasticity.
Erefode: Odeometric modulus of elasticity.
code, namely the Mohr-Coulomb (elastic-ideal plasticmodel) and hardening soil model. The parameters inthe hardening soil model were obtained from severalattempts to match the laboratory data to the computermodel. There are many phases in the analysis whichare as follows:
Phase 0: The initial stress �eld through which theinitial stresses, due to soil self weight, arecomputed;
Phase 1: Activation of grid-anchors and a load ap-plication up to a certain level (e.g., 20%ultimate load);
Phase 2: Unloading;Phase 3: Loading up to a certain level;Phase 4: Unloading.
The analyses phases were continued to reach a reason-ably constant settlement at the �nal stage of loadingand unloading. Therefore, the number of phases wasa bit di�erent for di�erent analyses under di�erentloading conditions, number of reinforcement layers and

6 N. Hataf, A.H. Boushehrian and A. Ghahramani
other parameters. Standard �xities, i.e. a horizontal�xity for vertical boundaries and a total �xity forthe bottom boundary of the model, were chosen asthe boundary conditions for the analyses. To modelthe reinforcements, the standard geogrid elements ofPLAXIS were used, which are elastic elements, and theelastic axial sti�ness of geogrids per unit length waschosen in accordance with the manufacturer's manualof the product.
To evaluate these hypotheses and to determineparameters, a laboratory small scale load test wasperformed over the desirable material and the test wasmodeled simultaneously with the program. After that,the results were calibrated in such a way that actualhardening soil model parameters were obtained.
TEST RESULTS AND DISCUSSION
Unreinforced Sand (Series A)
The bearing capacity of foundations on unreinforcedsoil was calculated by the tangent method depictedin Figure 8. By this method, the bearing capacityis determined at the intersecting point of two tangentlines that pass through the beginning and end of theload-settlement curve (Figure 8).
The bearing capacity was found to be 220 kPaby this method. In test results, the �nal settlementdue to the cyclic load, is denoted by (Sd)f . This isthe permanent settlement, due to the sum of �xed andcyclic loads. Figure 9 provides variations of (Sd=B)with the number of cycles for Series A (Unreinforcedsoil) tests in di�erent load percentages.
Soil Reinforced by Grid-Anchor and Geogrid(Series B and Series C):
Figures 10 through 13 show the variations of the di-mensionless settlement with the number of load cycles
Figure 8. Load settlement curve for unreinforced soil.
for soils reinforced by common geogrids with di�erentnumbers of layers, and Figures 14 through 17 show thesame for grid-anchors with up to 4 reinforcement layers.
Figure 18 illustrates that by using the grid-anchor system to reach a constant value of the amount
Figure 9. Variations of (Sd=B) with the number of loadcycles for Series A tests.
Figure 10. Variations of (Sd=B) with the number of loadcycles for Series B1-B3 tests.
Figure 11. Variations of (Sd=B) with the number of loadcycles for Series B4-B6 tests.

Behavior of Shallow Foundations Under Cyclic Loading 7
of dimensionless settlement, it decreases up to 17%relative to ordinary reinforcements and up to 50%relative to an unreinforced condition depending onthe number of reinforcement layers and the percent ofapplied load. Also by using the grid-anchor system, the
Figure 12. Variations of (Sd=B) with the number of loadcycles for Series B7-B9 tests.
Figure 13. Variations of (Sd=B) with the number of loadcycles for Series B10-B12 tests.
Figure 14. Variations of (Sd=B) with the number of loadcycles for Series C1-C3 tests.
number of loading cycles to reach a constant value ofdimensionless settlement decreases up to 33% relativeto ordinary reinforcements and up to 57% relative toan unreinforced condition depending on the number ofreinforcement layers and the percent of applied load
Figure 15. Variations of (Sd=B) with the number of loadcycles for Series C4-C6 tests.
Figure 16. Variations of (Sd=B) with the number of loadcycles for Series C7-C9 tests.
Figure 17. Variations of (Sd=B) with the number of loadcycles for Series C10-C12 tests.
8 N. Hataf, A.H. Boushehrian and A. Ghahramani
Figure 18. Variations of settlement reduction factor(experimental result) with the number of reinforcementlayers.
(Figures 9 and 17).A careful examination of the �gures reveals that
more than 50% of settlement occurs in the initial cyclesof loading. By increasing loading cycles due to thesoil beneath the foundation getting more compact and,consequently, more engagement of soil grains with thereinforcements, the settlement is reduced. An increasein loading cycles more than by a given number, denotedby ncr, will have no e�ect on reducing the settlement.
Figures 19 and 20 indicate a variation of numberof load cycles with a number of reinforcement layers forcommon reinforcements and the grid-anchor system,respectively. Comparing the �ndings provided in these�gures, one can conclude the higher ability of the grid-anchor system in reducing the settlement. This e�ectis more noticeable for higher values of cyclic load. Thereason is more engagement of this 3-D system with the
Figure 19. Variations of the number of load cycles withthe number of reinforcement layers (geogrid).
Figure 20. Variations of the number of load cycles withthe number of reinforcement layers (grid-anchor).
soil and their further involvement against a pull-out ofreinforcement layers.
The optimal number is found from Mosallanezhadet al. [14]. Tests were limited to 4 layers. They foundthat if more than 4 reinforcement layers were used, noimprovement in the BCR ratio would follow.
As revealed by the �gures, by increasing thenumber of reinforcements, due to the soil sti�nessgetting higher, the number of loading cycles neededto achieve a constant permanent settlement is reduced.
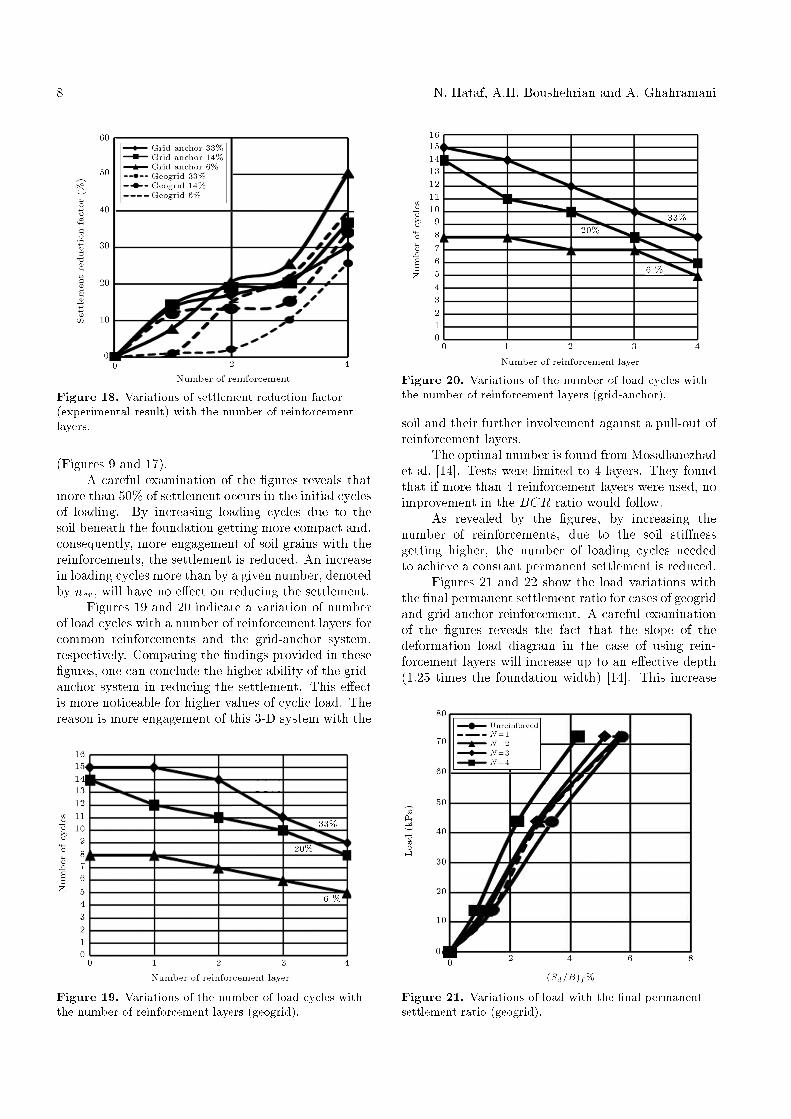
Figures 21 and 22 show the load variations withthe �nal permanent settlement ratio for cases of geogridand grid-anchor reinforcement. A careful examinationof the �gures reveals the fact that the slope of thedeformation load diagram in the case of using rein-forcement layers will increase up to an e�ective depth(1.25 times the foundation width) [14]. This increase
Figure 21. Variations of load with the �nal permanentsettlement ratio (geogrid).

Behavior of Shallow Foundations Under Cyclic Loading 9
Figure 22. Variations of load with the �nal permanentsettlement ratio (grid-anchor).
would be higher in cycles with more amplitude due tothe mobilization of more tensile force in the anchors(Figures 21 and 22).
Figure 23 shows the variation of load with a �nalpermanent settlement ratio for grid-anchor reinforcedsoil based on test results and numerical analysis. Asillustrated in the �gures, the value of (Sd=B) remainsconstant after a given number of loading cycles.
Soil Reinforced by Grid-Anchor and Geogrid(Series B and C)
Figure 24 shows variations in the settlement ratio withthe number of load cycles based on test results andnumerical analysis. Figures 25 and 26 show variations
Figure 23. Variations of load with the �nal permanentsettlement ratio (grid-anchor), experimental andnumerical results.
Figure 24. Variations of (Sd=B) with the number of loadcycles for Series C10-C12, experimental and numerical.
Figure 25. Variations of (Sd=B) with the number ofreinforcement layers (geogrid), experimental andnumerical results.
in the settlement ratio with the number of geogrid re-inforcement and grid-anchor layers, respectively, basedon test results and numerical analysis. Test resultsshow a good agreement with the numerical results.
CONCLUSIONS
According to the test results and numerical analysis,one can mention the following:
1. For a given initial �xed load, the dimensionlesssettlement of the foundation increases with thecyclic load amplitude.
2. For a given initial �xed load, the number of loadingcycles needed to reach a constant value of dimen-sionless settlement decreases with an increase in thenumber of reinforcement layers.

10 N. Hataf, A.H. Boushehrian and A. Ghahramani
Figure 26. Variation of (Sd=B) with number ofreinforcement layers (grid-anchor), experimental andnumerical results.
3. By using the grid-anchor system, the amount ofdimensionless settlement needed to reach its con-stant value decreases up to 17% relative to ordi-nary reinforcements and up to 50% relative to anunreinforced condition, depending on the numberof reinforcement layers and the percent of appliedload.
4. Also, by using the grid-anchor system, the numberof loading cycles to reach a constant value of dimen-sionless settlement decreases up to 33% relative toordinary reinforcements and up to 57% relative toan unreinforced condition depending on the numberof reinforcement layers and the percent of appliedload.
REFERENCES
1. Basudhar, P.K., Santanu S. and Deb, K. \Circularfootings resting on geotextile-reinforced sand bed",Geotextiles and Geomembranes, 25(6), pp. 377-384(2007).
2. Boushehrian, A.H. and Hataf, N. \Bearing capacity ofring footings on reinforced clay", in Proc. 12th. Conf.of Int. Assoc. for Computer Methods and Advances inGeomechanics (IACMAG), Goa, India, pp. 3546-3551(2008).
3. Dash, S.K., Krishnaswamy, N.R. and Rajagopal, K.\Bearing capacity of strip footings supported on
geocell-reinforced sand", Geotextiles and Geomem-branes, 19(4), pp. 235-256 (2001).
4. Sireesh, S., Sitharam, T.G. and Dash, S.K. \Bearingcapacity of circular footing on geocell-sand mattressoverlying clay bed with void", Geotextiles and Ge-omembranes, 27(2), pp. 89-98 (2001).
5. Hataf, N. and Rahimi, M. \Experimental investigationof bearing capacity of sand reinforced with randomlydistributed tire shreds", Construction and BuildingMaterials, 20(10), pp. 910-916 (2006).
6. Binquet, J. and Lee, K.L. \Bearing capacity testson reinforced earth slabs", Journal of GeotechnicalEngineering ASCE, 101(12), pp. 1241-1255 (1975).
7. Guido, V.A., Chang, D.K. and Sweeny, M.A. \Com-parison of geogrid and geotextile reinforced slabs",Canadian Geotechnical Journal, 23, pp. 435-40 (1986).
8. Yetimoglu, T., Wu, J.T.H. and Saglamer, A. \Bearingcapacity of rectangular footings on geogrid-reinforcedsand", Journal of Geotechnical Engineering, 120(12),pp. 2083-2099 (1994).
9. Adams, M.T. and Collin, J.G. \Large model spreadfooting load tests on geosynthetic reinforced soil foun-dations", Journal of Geotechnical and Geoenvironmen-tal Engineering, 123(1), pp. 66-72 (1997).
10. Das, B.M. and Shin, E.C. \Strip footing on geogridreinforced clay: behaviour under cyclic loading",Geotextiles and Geomembranes, 13(10), pp. 657-667(1994).
11. Unnikrishnan, N., Rajagopal, K. and Krishnaswamy,N.R. \Behavior of reinforced clay under monotonic andcyclic loading", Geotextile and Geomembranes, 20(2),pp. 117-133 (2002).
12. Boushehrian, J.H. and Hataf, N. \Experimental andnumerical investigation of the bearing capacity ofmodel circular and ring footings on reinforced sand",Journal of Geotextiles and Geomembranes, 21(4), pp.241-256 (2003).
13. Chung, W. and Cascante G. \Experimental and nu-merical study of soil-reinforcement e�ects on the low-strain sti�ness and bearing capacity of shallow foun-dations", Geotechnical and Geological Engineering, 25,pp. 265-281 (2007).
14. Mosallanezhad, M., Hataf, N. and Ghahramani, A.\Experimental study of bearing capacity of granularsoils, reinforced with innovative grid-anchor system",Geotechnical and Geological Engineering, 25(1), pp.123-137 (2007).
15. Shin, E.C., Das, B.M. and Atalar, C. \Cyclic plate loadtest on geogrid-reinforced granular pad" (in press).