
Experimental and dynamic response analysis of cable-stayed ...
11
Journal of Structural Engineering Vol.62A (March 2016) JSCE Experimental and dynamic response analysis of cable-stayed bridge due to sudden cable loss Vu Hoang † , Osamu Kiyomiya*, Tongxiang An** † M. of Eng., PhD Student., Dept. of Civil and Environmental Eng., Waseda University, Shinjuku-ku, Tokyo 169-8555 * Dr. of Eng., Professor, Dept. of Civil and Environmental Eng., Waseda University, Shinjuku-ku, Tokyo 169-8555 ** Dr. of Eng., Guest Professor, Faculty of Sc. and Eng., Waseda University, Shinjuku-ku, Tokyo 169-8555 Cable-stayed bridges are generally designed with sufficient redundancy which provides the capacity to maintain stability under effect of one cable loss. In such event, factor for impact force of 2.0 is specified by Post-Tensioning Institute’s recommendations. This study aims to evaluate the factor provided by the PTI and confirm the structural response of a cable-stayed bridge model encounter sudden cable rupture. An experimental program was performed to simulate the cable rupture event, with specimen being chosen strictly based on the rule of similarity. The obtained strain – time wave forms were used to calculate important parameter such as impact force factor, rupture time, strain velocity, and vibration frequency. The dynamic response analysis method using the strain wave form from the experimental program was suggested and showed its advantage over the static analysis recommended by PTI. Keywords: cable-stayed bridge, cable loss, wire breaking test, dynamic response analysis 1. INTRODUCTION Cable element plays a crucial role in cable structures including cable supported long span bridges such as cable-stayed bridge, suspension bridge and extradosed bridge. Due to its importance, cable in cable-stayed bridge is generally designed with sufficient redundancy and well-protected against fatigue, corrosion or other external causes especially in aggressive conditions 1) . However, the cable rupture event cannot be completely avoided. A number of structural accidents in which the cables were ruptured and lost their stresses have been latterly reported. On 28th January 2005, one of the cables’ links of the Charilaos Trikoupis Bridge (Greece) felled from the top of one of the pylons due to lightning strike; the bridge had been closed for more than one week until the restoration of the cable being completed. On 17th July 2010, during a typhoon, 3 large cargo ships’ anchors were broken; the ships then crashed into the Binh Bridge (Vietnam), causing heavy damage to the main steel girder and six of the cables; the bridge is under operation but its loading capacity has to be reduced 2) . The latest accident occurred in China, the Chi Shi Bridge have several cables ruptured just before the PC stiffness girder closure at the span center due to a fire (Fig. 1), the substance amount at the closure position was more than 1.0 m, which made the closure unable to complete. The concerns on the sudden cable breakage because of critical scenarios are arising. In recent years, a number of studies of cable breakage in cable-stayed bridge have been carried out. Starossek (2007) 3) is the first who addressed zipper-type collapse phenomenon in cable-stayed structures. Dynamic numerical studies on cable rupture events were also conducted by Wolff and Starossek (2010) 4) , by Mozos and Aparicio (2010) 5)6) , and by Zhou and Chen (2014) 7) . All of the published papers shared one thing in common, they referred “Recommendations for Stay Cable Design, Testing and Installation” 8) , issued by Post-Tensioning Institute (PTI) from the United States, as the main guideline. These recommendations require all cable-stayed bridges to be capable of withstanding the loss of one cable without leading to structural instability. Furthermore, in order to calculate the responses of the structure due to sudden cable loss, the document also suggested that a force which is the real force in the cable multiplied by a factor of 2.0 (hereafter this factor is called impact force or IF) acting in the opposite direction should be applied at both the top and the bottom anchorage locations for design. The PTI’s statement was accepted and adopted in all of the mentioned † Corresponding author E-mail: [email protected] -50-
Transcript of Experimental and dynamic response analysis of cable-stayed ...

Journal of Structural Engineering Vol.62A (March 2016) JSCE
Experimental and dynamic response analysis of cable-stayed bridge due to sudden cable loss
Vu Hoang†, Osamu Kiyomiya*, Tongxiang An**
† M. of Eng., PhD Student., Dept. of Civil and Environmental Eng., Waseda University, Shinjuku-ku, Tokyo 169-8555 * Dr. of Eng., Professor, Dept. of Civil and Environmental Eng., Waseda University, Shinjuku-ku, Tokyo 169-8555
** Dr. of Eng., Guest Professor, Faculty of Sc. and Eng., Waseda University, Shinjuku-ku, Tokyo 169-8555
Cable-stayed bridges are generally designed with sufficient redundancy which provides the capacity to maintain stability under effect of one cable loss. In such event, factor for impact force of 2.0 is specified by Post-Tensioning Institute’s recommendations. This study aims to evaluate the factor provided by the PTI and confirm the structural response of a cable-stayed bridge model encounter sudden cable rupture. An experimental program was performed to simulate the cable rupture event, with specimen being chosen strictly based on the rule of similarity. The obtained strain – time wave forms were used to calculate important parameter such as impact force factor, rupture time, strain velocity, and vibration frequency. The dynamic response analysis method using the strain wave form from the experimental program was suggested and showed its advantage over the static analysis recommended by PTI. Keywords: cable-stayed bridge, cable loss, wire breaking test, dynamic response analysis
1. INTRODUCTION
Cable element plays a crucial role in cable structures
including cable supported long span bridges such as cable-stayed bridge, suspension bridge and extradosed bridge. Due to its importance, cable in cable-stayed bridge is generally designed with sufficient redundancy and well-protected against fatigue, corrosion or other external causes especially in aggressive conditions1). However, the cable rupture event cannot be completely avoided.
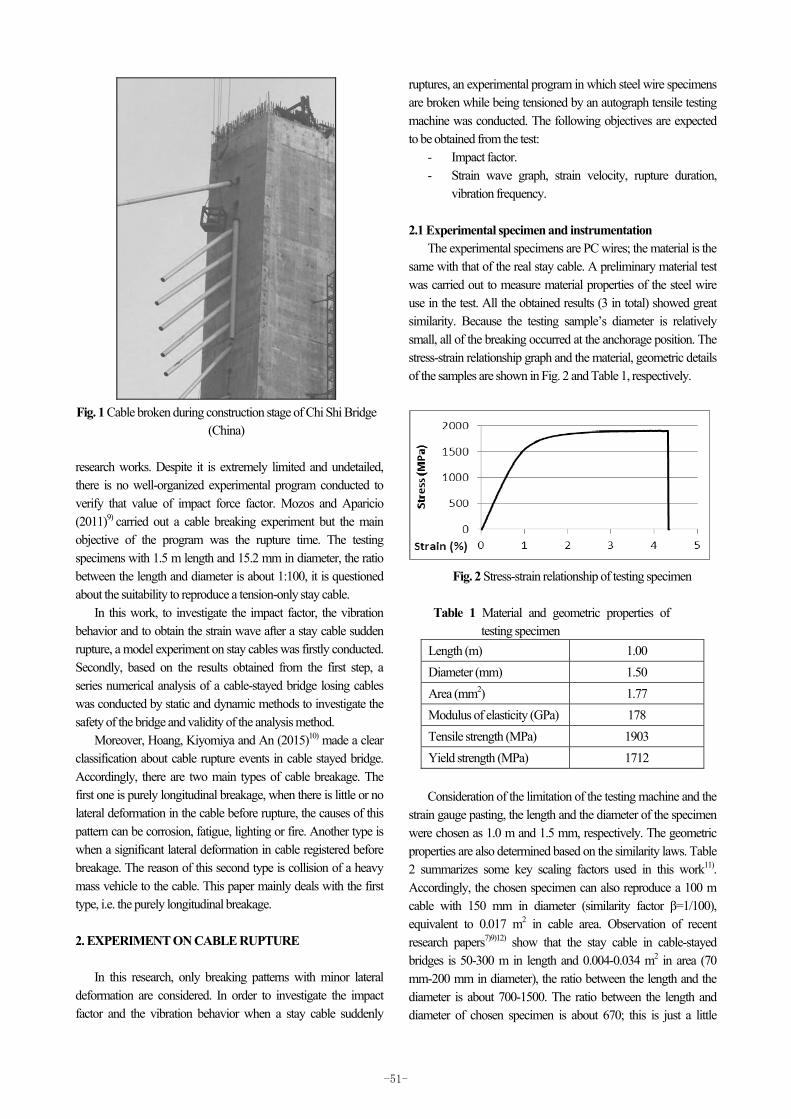
A number of structural accidents in which the cables were ruptured and lost their stresses have been latterly reported. On 28th January 2005, one of the cables’ links of the Charilaos Trikoupis Bridge (Greece) felled from the top of one of the pylons due to lightning strike; the bridge had been closed for more than one week until the restoration of the cable being completed. On 17th July 2010, during a typhoon, 3 large cargo ships’ anchors were broken; the ships then crashed into the Binh Bridge (Vietnam), causing heavy damage to the main steel girder and six of the cables; the bridge is under operation but its loading capacity has to be reduced2). The latest accident occurred in China, the Chi Shi Bridge have several cables ruptured just
before the PC stiffness girder closure at the span center due to a fire (Fig. 1), the substance amount at the closure position was more than 1.0 m, which made the closure unable to complete. The concerns on the sudden cable breakage because of critical scenarios are arising.
In recent years, a number of studies of cable breakage in cable-stayed bridge have been carried out. Starossek (2007)3) is the first who addressed zipper-type collapse phenomenon in cable-stayed structures. Dynamic numerical studies on cable rupture events were also conducted by Wolff and Starossek (2010)4), by Mozos and Aparicio (2010)5)6), and by Zhou and Chen (2014)7). All of the published papers shared one thing in common, they referred “Recommendations for Stay Cable Design, Testing and Installation”8), issued by Post-Tensioning Institute (PTI) from the United States, as the main guideline. These recommendations require all cable-stayed bridges to be capable of withstanding the loss of one cable without leading to structural instability. Furthermore, in order to calculate the responses of the structure due to sudden cable loss, the document also suggested that a force which is the real force in the cable multiplied by a factor of 2.0 (hereafter this factor is called impact force or IF) acting in the opposite direction should be applied at both the top and the bottom anchorage locations for design. The PTI’s statement was accepted and adopted in all of the mentioned
† Corresponding author E-mail: [email protected]
-50-
research works. Despite it is extremely limited and undetailed, there is no well-organized experimental program conducted to verify that value of impact force factor. Mozos and Aparicio (2011)9) carried out a cable breaking experiment but the main objective of the program was the rupture time. The testing specimens with 1.5 m length and 15.2 mm in diameter, the ratio between the length and diameter is about 1:100, it is questioned about the suitability to reproduce a tension-only stay cable.
In this work, to investigate the impact factor, the vibration behavior and to obtain the strain wave after a stay cable sudden rupture, a model experiment on stay cables was firstly conducted. Secondly, based on the results obtained from the first step, a series numerical analysis of a cable-stayed bridge losing cables was conducted by static and dynamic methods to investigate the safety of the bridge and validity of the analysis method.
Moreover, Hoang, Kiyomiya and An (2015)10) made a clear classification about cable rupture events in cable stayed bridge. Accordingly, there are two main types of cable breakage. The first one is purely longitudinal breakage, when there is little or no lateral deformation in the cable before rupture, the causes of this pattern can be corrosion, fatigue, lighting or fire. Another type is when a significant lateral deformation in cable registered before breakage. The reason of this second type is collision of a heavy mass vehicle to the cable. This paper mainly deals with the first type, i.e. the purely longitudinal breakage. 2. EXPERIMENT ON CABLE RUPTURE
In this research, only breaking patterns with minor lateral
deformation are considered. In order to investigate the impact factor and the vibration behavior when a stay cable suddenly
ruptures, an experimental program in which steel wire specimens are broken while being tensioned by an autograph tensile testing machine was conducted. The following objectives are expected to be obtained from the test:
- Impact factor. - Strain wave graph, strain velocity, rupture duration,
vibration frequency.
2.1 Experimental specimen and instrumentation The experimental specimens are PC wires; the material is the
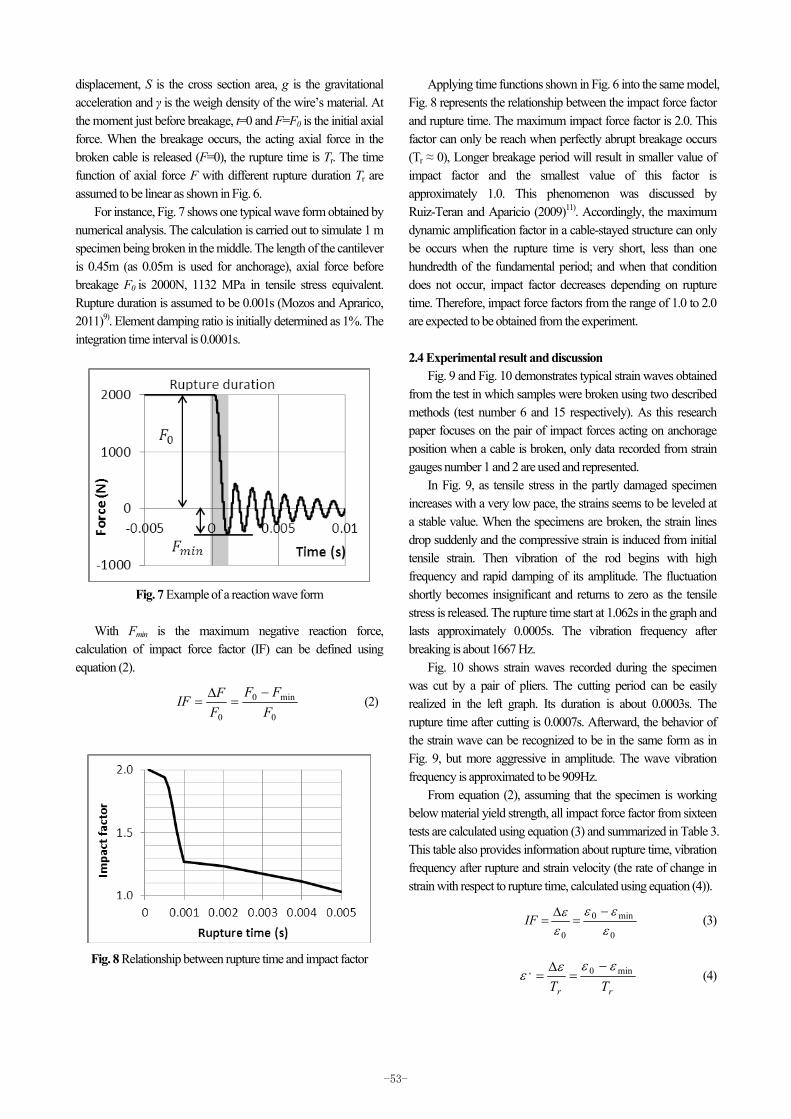
same with that of the real stay cable. A preliminary material test was carried out to measure material properties of the steel wire use in the test. All the obtained results (3 in total) showed great similarity. Because the testing sample’s diameter is relatively small, all of the breaking occurred at the anchorage position. The stress-strain relationship graph and the material, geometric details of the samples are shown in Fig. 2 and Table 1, respectively.
Fig. 2 Stress-strain relationship of testing specimen
Table 1 Material and geometric properties of
testing specimen Length (m) 1.00 Diameter (mm) 1.50 Area (mm2) 1.77 Modulus of elasticity (GPa) 178 Tensile strength (MPa) 1903 Yield strength (MPa) 1712 Consideration of the limitation of the testing machine and the
strain gauge pasting, the length and the diameter of the specimen were chosen as 1.0 m and 1.5 mm, respectively. The geometric properties are also determined based on the similarity laws. Table 2 summarizes some key scaling factors used in this work11). Accordingly, the chosen specimen can also reproduce a 100 m cable with 150 mm in diameter (similarity factor β=1/100), equivalent to 0.017 m2 in cable area. Observation of recent research papers7)9)12) show that the stay cable in cable-stayed bridges is 50-300 m in length and 0.004-0.034 m2 in area (70 mm-200 mm in diameter), the ratio between the length and the diameter is about 700-1500. The ratio between the length and diameter of chosen specimen is about 670; this is just a little
Fig. 1 Cable broken during construction stage of Chi Shi Bridge
(China)
-51-

smaller than that value of the real stay cable. Four strain gauges were attached to the positions near both
the ends and the cutting location of the specimen. Fig. 3 presents the arrangement of the strain gauges. Longitudinal strains of the wire during the experiment were recorded.
The tensile test was carried out by the universal testing machine (Shimadzu Autograph AGS-X 100). The maximum tensile capacity is 100kN and the maximum length of the specimen is about 1.0 m. Fig. 4 represents the image of the machine with one specimen being tested.
2.2 Experimental description
Two cable breaking ways are performed in this experimental program to simulate the sudden rupture of cable. The first one is to reduce the cross section area of a testing specimen then tension it until it is broken. This method is to reproduce a real stay cable damaged by corrosion. Fig. 5 shows one testing specimen with reduced cross section area
The second method is to tension the sample to a determined tensile stress of 1500N, equivalent to 0.47% in longitudinal strain, stop the testing machine and break the sample with a pair of pliers. This simulates a working cable in cable-stayed bridge broken due to an aggressive external shearing force.
With each breaking method, eight tests are conducted. The total number of tests in this program is sixteen.
In term of breaking position, Mozos and Aprarico (2011)9) decided the damaged cross section to be near anchorage position. However, there is a fact that the breaking accident in stay cable can happen at any position. In this experiment, breakage positions are chosen to be at 250 mm and 500 mm from one end (8 tests for each variation).
More details about breaking method and rupture position of all sixteen experiment cases are shown on Table 3.
In this experiment, the strain tensioning velocity is set at 3% per minutes, similar to a quasi-static tensile test. During each test, the change in specimen’s longitudinal deformation was recorded entirely with sampling interval of 100 microseconds. 2.3 Numerical simulation
To evaluate the result obtained from the test, numerical method is suggested. Considering the test specimen as a two-fixed-end steel cable with uniform circular cross section, after being broken, each specimen become 2 separated cantilevers and freely vibrates in the longitudinal direction. Assuming that the length of each cantilever is fairly long compared to its diameter, the effect of lateral motion can be literately neglected. Basic equation of motion for longitudinal vibration over time t of one half is shown as equation (1).
2
2
tu
gS
xF
∂∂
=∂∂ γ (1)
In which, x is the coordinate of cross section, u is the sectional
Table 2 Scaling factor between prototype model and testing specimen
Length, L β Diameter, φ β Strain, ε 1 Stress, σ 1 Time, t β1/2
1000
Cutting position
100SG01
100SG02
250-50050
(Unit: mm)SG: Strain gauge
SG03 SG0450 50
Fig. 3 Arrangement of strain gauges
Fig. 4 Autograph tensile testing device
Fig. 5 Reduction of testing specimen’s area
Fig. 6 Time history of axial force in cable rupture event
-52-
displacement, S is the cross section area, g is the gravitational acceleration and γ is the weigh density of the wire’s material. At the moment just before breakage, t=0 and F=F0 is the initial axial force. When the breakage occurs, the acting axial force in the broken cable is released (F=0), the rupture time is Tr. The time function of axial force F with different rupture duration Tr are assumed to be linear as shown in Fig. 6.
For instance, Fig. 7 shows one typical wave form obtained by numerical analysis. The calculation is carried out to simulate 1 m specimen being broken in the middle. The length of the cantilever is 0.45m (as 0.05m is used for anchorage), axial force before breakage F0 is 2000N, 1132 MPa in tensile stress equivalent. Rupture duration is assumed to be 0.001s (Mozos and Aprarico, 2011)9). Element damping ratio is initially determined as 1%. The integration time interval is 0.0001s.
Fig. 7 Example of a reaction wave form
With Fmin is the maximum negative reaction force,
calculation of impact force factor (IF) can be defined using equation (2).
0
min0
0 FFF
FFIF
−=
Δ= (2)
Fig. 8 Relationship between rupture time and impact factor
Applying time functions shown in Fig. 6 into the same model, Fig. 8 represents the relationship between the impact force factor and rupture time. The maximum impact force factor is 2.0. This factor can only be reach when perfectly abrupt breakage occurs (Tr ≈ 0), Longer breakage period will result in smaller value of impact factor and the smallest value of this factor is approximately 1.0. This phenomenon was discussed by Ruiz-Teran and Aparicio (2009)11). Accordingly, the maximum dynamic amplification factor in a cable-stayed structure can only be occurs when the rupture time is very short, less than one hundredth of the fundamental period; and when that condition does not occur, impact factor decreases depending on rupture time. Therefore, impact force factors from the range of 1.0 to 2.0 are expected to be obtained from the experiment.
2.4 Experimental result and discussion
Fig. 9 and Fig. 10 demonstrates typical strain waves obtained from the test in which samples were broken using two described methods (test number 6 and 15 respectively). As this research paper focuses on the pair of impact forces acting on anchorage position when a cable is broken, only data recorded from strain gauges number 1 and 2 are used and represented.
In Fig. 9, as tensile stress in the partly damaged specimen increases with a very low pace, the strains seems to be leveled at a stable value. When the specimens are broken, the strain lines drop suddenly and the compressive strain is induced from initial tensile strain. Then vibration of the rod begins with high frequency and rapid damping of its amplitude. The fluctuation shortly becomes insignificant and returns to zero as the tensile stress is released. The rupture time start at 1.062s in the graph and lasts approximately 0.0005s. The vibration frequency after breaking is about 1667 Hz.
Fig. 10 shows strain waves recorded during the specimen was cut by a pair of pliers. The cutting period can be easily realized in the left graph. Its duration is about 0.0003s. The rupture time after cutting is 0.0007s. Afterward, the behavior of the strain wave can be recognized to be in the same form as in Fig. 9, but more aggressive in amplitude. The wave vibration frequency is approximated to be 909Hz.
From equation (2), assuming that the specimen is working below material yield strength, all impact force factor from sixteen tests are calculated using equation (3) and summarized in Table 3. This table also provides information about rupture time, vibration frequency after rupture and strain velocity (the rate of change in strain with respect to rupture time, calculated using equation (4)).
0
min0
0 εεε
εε −=
Δ=IF (3)
rr TTmin0, εεεε
−=
Δ= (4)
-53-

Fig. 9 Strain time history when a damaged specimen tensioned by autograph machine (test number 6)
Fig. 10 Strain time history when a specimen is cut by a pair of pliers (test number 15)
Table 3 Experimental result
Test number
Breaking method
Breaking position
IF 01* IF 02* Rupture time (s)
Strain velocity (s-1)
Frequency (Hz)
1 1.20 1.11 0.0006 12.95 2000 2 250 mm 1.13 1.09 0.0006 12.37 2000 3 n/a n/a n/a n/a n/a 4 Tensioning 1.1 1.33 0.0005 10.15 1000 5 1.14 1.29 0.0006 14.15 833
**6 500 mm 1.36 1.11 0.0005 18.54 1667 7 1.16 1.22 0.0008 4.73 667 8 1.01 1.47 0.0005 20.56 909 9 1.17 1.1 0.0006 8.11 1250 10 250 mm 1.07 1.26 0.0009 4.45 1000 11 1.02 1.37 0.0006 4.64 769 12 Cut 1.05 1.34 0.0015 8.38 833 13 1.2 1.08 0.0010 7.30 1111 14 500 mm 1.17 1.14 0.0007 6.29 1000
**15 1.33 1.12 0.0007 7.98 909 16 1.13 1.35 0.0006 6.69 769 * IF01, IF02: Impact force factor calculated through strain wave recorded by strain gauge number 1 and 2 respectively
** Strain wave recorded from test number 6 and 15 are represented in Fig.9 and Fig.10 respectively
The summarized results show the fact that despite of different breaking methods and positions, all calculated impact force factors are recorded at diverse values, between 1.0 and 2.0. These values are suitable with discussion in previous sub-section. Large values of impact force can be recognized in testing case 4th, 6th, 8th, 11th and 16th, but none
of them exceeds 1.5. All these highest values are obtained from testing cases in which the rupture periods are registered as the shortest (0.0005-0.0006s).
The estimated frequencies after breakage time are registered from 667-2000 Hz (for frequency). These values are discrete and no relationship with other parameter can be recognized. In term
-54-

Fig. 11 Experiment and simulation comparison for test number 6 (strain gauge 1)
Fig. 12 Experiment and simulation comparison for test number 8 (strain gauge 2)
Fig. 13 Experiment and simulation comparison for test number 11 (strain gauge 2)
Fig. 14 Experiment and simulation comparison for test number 16 (strain gauge 2)
of strain velocity, in general, test results obtained from the tensioning method have higher values than those from the test that specimens were cut by a pair of plier (13.35 s-1 and 6.73 s-1 on average respectively). This phenomenon is reasonable because, eventually, the motion of cable after cutting is affected by the pliers. Nevertheless, all of the obtained values are
relatively high and have the same characteristic as shockwaves. The next step is to use suggested numerical method to
valuate experiment results. Fig. 11 to Fig. 14 represents the wave forms in which greatest impact factors are calculated: cases 6th, 8th, 11th and 16th. Along with them are several numerical results generated by using the same initial axial force and rupture time as
-55-

input data. Damping constant of 1% is generally used in modeling cable elements in cable-stayed structures (Zhou and Chen, 2014)7). However, it is believed that the cable element after broken will have much greater damping constant because the tensioning force is released. Elemental damping of 50% and 90% were shown in these figure, along with the value of 1% adopted from existing research papers, for comparison purpose.
Generally, data obtained from testing cases with tension breaking method shows better comparability with numerical simulation results (Fig. 11 and Fig. 12). When the input element damping ratio is very small (1%), the numerical method can simulate the strain velocity of real test case. While the wave generated with larger element damping constant provide similarity in impact factor criteria. However, no numerical wave can completely replicate the wave obtained from experiment.
On the other hand, Fig. 13 and Fig. 14 show that the other results (from experiment with cutting method) seem abnormal compare to numerical results. It is believed that the cause of this phenomenon is the inevitable minor lateral movement when cutting by a pair of pliers. In other words, the experiment results are affected by noisy data from bending effect, which is not considered in this research paper.
In summary, these experimental results confirm the impact factor of 2.0 recommended by the PTI to be appropriate. It is recommended that, because of aggressive characteristic, to deal with cable sudden rupture event in cable-stayed bridge structures, dynamic approach with small period integration step must be considered. Numerical analysis can partly simulate the experiment result but it is very difficult to decide the damping specification. Wave forms obtained from tests with tension breaking method are believed to be more reliable than those obtained from the cutting method.
3. ANALYSIS OF A CABLE-STAYED BRIDGE
MODEL
A long span cable-stayed bridge was numerically modeled. Both static and dynamic response analyses were performed and the similarities and the differences between them were compared. The impact force wave forms used in the calculations are determined by the results of experimental section. The tensile stresses of cables and the bending moment of girders are
calculated. As a consequence, structural behaviors of the bridge due to cable loss are investigated.
3.1 Description of the bridge model
The prototype model used in this analysis is a cable-stayed bridge with four approach spans (two on each side). This bridge is located at south part of Vietnam. The span arrangement is (40 + 40 +230 + 550 + 230 + 40 + 40) m, making up to the total length of 1170 m. The elevation view of the bridge is shown in Fig. 15.
Typically, the primary girder is a pre-stressed concrete box girder (26 m wide and 2.7 m high), that can accommodate four traffic lanes. For proper balance and cost saving, the girder was designed to have a 210 m steel box girder in the middle of the primary span.
The cable towers are inverted Y-shaped pylons consisting of reinforced concrete with the height of 169 m. Two cable planes are placed into a semi fan arrangement with 108 cables in each vertical plane. At the deck level, the spacing between two consecutive cable anchorages is 8 m (for reinforced concrete girder) or 12 m (for steel girder).
A two-dimensional model of the bridge was generated in TDAP III software, using the finite element method. The pylons and girders were modeled with beam elements. The cables were treated as truss elements with acting tensile axial forces.
Table 4 Material properties of stay cable
Tensile strength (MPa) 1860 Yield strength (MPa) 1674 Young modulus (GPa) 195 Table 5 Sectional properties of bridge system
Area (m2)
Moment of inertia (m4)
Pylon 28.00 - 63.40 15.30 – 36.20 Supporting pier 17.44 7.85 Concrete girder 19.90 17.70 Steel girder 1.07 1.24 Approach pier 10.32 1.56 Approach girder 6.14 2.46
Fig. 15 Elevation view of cable-stayed bridge prototype
-56-

Table 4 shows the material details of cables used in the model. The material properties were determined to satisfy the minimum requirements described in the Post-Tensioning Institute’s document. The geometric properties of the pylons, piers and girders’ cross sections are shown in Table 5.
3.3 Analysis progress
After geometric modeling, the bridge’s loads are applied. The structure is designed under effect of the Strength IV limit state, recommended by AASHTO LRFD bridge design specifications (2010)14). The load combination of this state is described as equation (3).
1.5DC + 1.5DW + 0.5(CR+SH) + 1.0PS (3) In which, DC is dead load of structural components; DW is
dead load of wearing surface; CR and SH relatively stand for creep and shrinkage; and PS is adjustment of cable stress during construction stage. The complete numerical model under the effect of this combination of loads is used as initial condition.
Next, both static and dynamic calculations due to cable loss
were executed. In this research work, events of losing one cable at several positions were put under inspection. This paper also investigates in situations which more than two cables broken at the same time.
Respect to the statement in PTI’s recommendation, a factor of 2.0 was determined for calculation in static analysis. The calculated impact forces were applied to the model through two static steps. Firstly, the cable was removed from the model, thus, internal tensile force was release. Then the companion forces were applied to the anchorage positions of losing cable with opposite direction to cable axial force.
As for the history response dynamic analysis of this structure, strain wave forms obtained from tension breakage test with largest impact factor recorded (test number 6 and 8) are considered for calculation. Because the impact factor from test number 8 is fairly higher than the rest in Table 3 and there is no other testing case recorded that big value, the wave form obtained from test number 6, strain gauge 1, (Fig. 11) is believed to be more typical and chosen to carry out the analysis. According to
Fig. 16 Response of maximum cable’s tensile stress due to one cable loss
(a) Loss of cable 01, (b) Loss of cable 27, (c) Loss of cable 54
-57-

the similarity law (Table 2), a time scale factor of β1/2 was applied to correct the vibration frequency after losing one cable. Because the cable is working within yield strength limit, the relationship between strain and axial force is linear. Therefore, the strain wave form can be simply transformed in to the axial force wave form using F=ԑEA. The initial tensile force of input wave was also corrected to be equal to designed cable tension force. Damping factors of 1% for under tensioning condition cable truss elements were used, according to Zhou and Chen (2014)7). For each case of cable loss, the cable was deleted completely from the model and scaled force wave were applied to the anchorage positions, time history response analysis was calculated with 20000 integration steps with time interval of 1 ms. Values of maximum tensile stress at the cables and maximum and minimum bending moment at the girder due to impact loading were calculated.
3.4 Result and discussion
Fig. 16 represents the behaviors of the cable system in the prototype bridge under the effect of losing one cable at position 1,
27 and 54, respectively. The parameter here is tensile stress and the unit is MPa.
At the bridge’s abutment position, the cable with identification number 1 is one of the longest cables of the bridge. Therefore, the loss of this cable causes 5%-10% raise in axial force to the nearby ones. Regardless, the stresses of all cables do not surpass the yield strength of 1674 MPa. While the dynamic response analysis result also shows further influence on the middle span and even right side span, the static calculation narrows its impact to the bound of left side span (Fig. 16.a).
When the cables at position 27 near the pylons are abruptly broken, the effect is minor as shown in Fig. 16.b. Both static and dynamic approach shows this event has some impacts, more or less, on the stresses of the remaining cables. Even though, all of those effects are very minor, no more than ten pairs of cables register detectable raise in tensile stress.
Regarding the middle span, the Fig. 16.c clearly shows that the sudden rupture of the most extensive cable (number 54) significantly affects the rest parts. For every cable, tensile stress is
Fig. 17 Response of maximum positive and negative change in girder’s bending moment due to one cable loss
(a) Loss of cable 01, (b) Loss of cable 27, (c) Loss of cable 54
-58-

increased. Particularly, cables number 50 and 53 increasing at least 100 MPa. Although the static analysis can trace the peak of these cables, the procedure is incapable of capturing the effect of abruptly losing cable number 54 to further cables located near the pylons.
Fig. 17 consequently shows the change of bending moment in stiff girder when one cable is sudden ruptured in three investigating situations. As expected, both static and dynamic response analysis shows that sudden cable loss event occurred in cable-stayed spans does not affect the bending moment at approach bridges under any circumstance. Nonetheless, fairly large bending moment responses in cable-supported spans can be recognized. Both static and dynamic calculation results show the change of about 40-80 MN·m in the bending moment diagrams. The dynamic response analysis can show both maximum positive and maximum negative bending moment values that a particular cross section is calculated. From the figures, it can be noticed that a cable breakage occurs in the middle of the main span has more noticeable influence on major cross sections in the cable-stayed bridge.
As the cable rupture event occurs in the middle of main span has the most effect on remaining elements, the loss of several adjacent cables occurs at the same time is also investigated.
Fig. 18 Maximum tensile stress in remaining cables due to
multiple cable loss
Fig. 19 Maximum of positive bending moment change in
main girder due to multiple cable loss
Fig. 20 Maximum vertical deflection in main girder due to
multiple cable loss
Fig. 21 Time history of positive bending moment change at
the middle of main girder when 5 cables loss at the same time
Fig. 22 Time history of vertical deflection at the middle of
main girder when 5 cables loss at the same time
Fig. 18 show the maximum tensile stress in the remaining cables after multiple cables loss. As the number of broken cables increase, the maximum tensile stress appear in cable system become closer to 1400 MPa. However, even the number of consecutive cables broken is 5, all of the remaining cables’ stress stay below the yield strength limit. Fig. 19 and Fig. 20 represent the effect of losing multiple cable on the main girder. Fig. 21 and Fig. 22 show the time history of positive bending moment and vertical deflection at the middle of main girder, respectively, when 5 adjacent cables (number 50-54) loss at the same time.
The long span cable-stayed bridges are usually designed with sufficient redundancy; this bridge is likely to maintain the enough stability when five cable is abruptly lost due to cable corrosion or fatigue, when no or minor lateral vibration occurs before the rupture. The progressive collapse, which was addressed by
-59-

Starossek (2007)3), is unlikely to happen because the stress of adjacent cable did not exceed yield strength.
Dynamic response analysis considered real strain wave of the broken cable gave significant tension force at other cables and also large bending moment at the girder. On the other hand, the static analysis with impact factor of 2.0, significantly larger than that value obtained from the experiment, can be also useful in some certain situation. However, the proposed dynamic approach shows great advantage to capture extended range of effect on the girder and the cable system.
5. CONCLUSION
Main conclusions obtained by both experimental program
and the dynamic response analysis are described as follows. 1) A circular steel wire with parameter respected to the
similarity rule was broken under tensioning condition with initial tension force to confirm the relevance of the impact of factor of 2.0 specified by the PTI’s “Recommendations for Stay Cable Design, Testing and Installation”. The data obtained from wire cutting experiment showed that strain velocity ranged from 4.73 to 20.56(1/s) and impact factors ranged from 1.02 to 1.47. These results showed tensioning cut for partial loss of wire area and cut with a plier did not gave impact phenomena that produced impact factor of 2.0.
2) To understand the effect of losing one or more cables on cable-stayed bridges’ superstructure, dynamic response numerical analysis using impact wave form obtained by experiment was carried out. The loss of the outer cable in the main span gave a bigger and wider region of effect both on cable axial force and girder bending moment. On the other hand, the loss of the cable near a pylon gave an effect on the adjacent cables and the girder of the pylon side. Nevertheless, zipper-type collapse phenomenon (Starossek, 2007) 3) did not occur even up to five consecutive cables were broken at the same time.
3) The static analysis presented by the PTI can give greater peak values in all calculation cases. However, dynamic response analysis showed the extended range of effect on the girder bending moment and remaining cable’s tensile stress. When number of cable loss increased, maximum bending moment at the girder, deflection of the girder and adjacent cable tensile stress increased. When number of cable loss was 4 or 5, bending moment of the girder reached yield moment and deflection of the girder was more than 1.5m. These calculation results show the damage of the cable-stayed bridge is serious.
References 1) Leonhardt, F., and Zellner, W., Past, Present and Future of
Cable-Stayed Bridges, Cable-Stayed Bridges - Recent Developments and their Future, Yokohama, Japan, 1991.
2) Nguyen, V. T., Nguyen, T. T., and Dao, D. L., Dynamic Analysis of Stayed-Cable in Binh Bridge after the Collision Incident in 2010 by Vibration Measurement, Testing and Verification in Civil Engineering, Vietnam, 2011. (In Vietnamese)
3) Starossek, U., Typology of Progressive Collapse, Engineering Structures. 29(9), pp.2302-2307, 2007.
4) Wolff, M., and Starossek, U., Cable-loss analyses and collapse behavior of cable-stayed bridges, IABMAS2010, The Fifth International Conference on Bridge Maintenance, Safety and Management, July 11-15, 2010, Philadelphia, USA
5) Mozos, C. M., and Aparico, A. C., Parametric study on the dynamic response of cable stayed bridges to the sudden failure of a stay, Part I: Bending moment acting on the deck, Engineering Structures 32, pp.3288-3300, 2010.
6) Mozos, C. M., and Aparico, A. C., Parametric study on the dynamic response of cable stayed bridges to the sudden failure of a stay, Part II: Bending moment acting on the pylons and stress on the stays, Engineering Structures 32, pp.3301-3312, 2010.
7) Zhou, Y., and Chen, S., Time-Progressive Dynamic Assessment of Abrupt Cable-Breakage Events on Cable-Stayed Bridges, J. Bridge Eng., 19(2), pp.159–171, 2014.
8) Post-Tensioning Institute, Recommendations for Stay Cable Design, Testing and Installation 6th edition, 2012.
9) Mozos, C. M., and Aparico, A. C., Numerical and experimental study on the interaction cable structure during the failure of a stay in a cable stayed bridge, Engineering Structures 33(8), pp.2330-2341, 2011.
10)Hoang, V., Kiyomiya, O., An, T., Experimental Study on Impact Force Factor during Sudden Cable Loss in Cable-Stayed Bridges, IABSE Workshop Helsinki 2015: Safety, Robustness and Condition Assessment of Structures, pp. 252-259(8), 2015.
11)Kishi, N., Practical Methods for Impact Test and Analysis, Structure Engineering Series 15, 2014. (In Japanese)
12)Hoang, V., Kiyomiya, O., An, T., Stability Analysis of a Cable-Stayed Bridge in Mekong River Delta due to Soil Settlement, Long Span Bridges and Roofs - Development, Design and Implementation - 36th IABSE Symposium, Kolkata, India, 2013.
13)An, T. and Kiyomiya, O., Impact on Structural Behavior of a Steel Cable-Stayed Bridge with Low-Rise Pylons due to the Cable Stress Loss, The Fourth International Symposium on Life-Circle Engineering, Tokyo, Japan, 2014.
14)American Association of State Highway and Transportation Officials, AASHTO LRFD Bridge Design Specifications, 2010.
(Received September 25, 2015) (Accepted February 1, 2016)
-60-


![[TECH]Cable Stayed Bridges](https://static.fdocuments.in/doc/165x107/544cd985b1af9f3a0b8b4c5b/techcable-stayed-bridges.jpg)


