Experimental Analysis and Behaviour Modelling of the ...
18
HAL Id: hal-03042931 https://hal-mines-albi.archives-ouvertes.fr/hal-03042931 Submitted on 7 Dec 2020 HAL is a multi-disciplinary open access archive for the deposit and dissemination of sci- entific research documents, whether they are pub- lished or not. The documents may come from teaching and research institutions in France or abroad, or from public or private research centers. L’archive ouverte pluridisciplinaire HAL, est destinée au dépôt et à la diffusion de documents scientifiques de niveau recherche, publiés ou non, émanant des établissements d’enseignement et de recherche français ou étrangers, des laboratoires publics ou privés. Experimental Analysis and Behaviour Modelling of the Deformation Mechanisms of a Ti-6242S Alloy under Hot and Superplastic Forming Conditions Longqiu Song, Anzu Ii, Laurie Despax, Hatsumi Onishi, Hiroaki Matsumoto, Vincent Velay, Vanessa Vidal To cite this version: Longqiu Song, Anzu Ii, Laurie Despax, Hatsumi Onishi, Hiroaki Matsumoto, et al.. Experi- mental Analysis and Behaviour Modelling of the Deformation Mechanisms of a Ti-6242S Alloy under Hot and Superplastic Forming Conditions. Metals, MDPI, 2020, 10 (12), pp.1-17/1599. 10.3390/met10121599. hal-03042931
Transcript of Experimental Analysis and Behaviour Modelling of the ...
HAL Id: hal-03042931https://hal-mines-albi.archives-ouvertes.fr/hal-03042931
Submitted on 7 Dec 2020
HAL is a multi-disciplinary open accessarchive for the deposit and dissemination of sci-entific research documents, whether they are pub-lished or not. The documents may come fromteaching and research institutions in France orabroad, or from public or private research centers.
L’archive ouverte pluridisciplinaire HAL, estdestinée au dépôt et à la diffusion de documentsscientifiques de niveau recherche, publiés ou non,émanant des établissements d’enseignement et derecherche français ou étrangers, des laboratoirespublics ou privés.
Experimental Analysis and Behaviour Modelling of theDeformation Mechanisms of a Ti-6242S Alloy under Hot
and Superplastic Forming ConditionsLongqiu Song, Anzu Ii, Laurie Despax, Hatsumi Onishi, Hiroaki Matsumoto,
Vincent Velay, Vanessa Vidal
To cite this version:Longqiu Song, Anzu Ii, Laurie Despax, Hatsumi Onishi, Hiroaki Matsumoto, et al.. Experi-mental Analysis and Behaviour Modelling of the Deformation Mechanisms of a Ti-6242S Alloyunder Hot and Superplastic Forming Conditions. Metals, MDPI, 2020, 10 (12), pp.1-17/1599.10.3390/met10121599. hal-03042931
metals
Article
Experimental Analysis and Behaviour Modelling of theDeformation Mechanisms of a Ti-6242S Alloy underHot and Superplastic Forming Conditions
Longqiu Song 1,2, Anzu Ii 1,2, Laurie Despax 1, Hatsumi Onishi 1,2, Hiroaki Matsumoto 2,Vincent Velay 1,* and Vanessa Vidal 1
1 Institut Clément Ader (ICA), Université de Toulouse, CNRS, IMT Mines Albi, UPS, INSA, ISAE-SUPAERO,Campus Jarlard, 81013 Albi CT CEDEX 09, France; [email protected] (L.S.);[email protected] (A.I.); [email protected] (L.D.); [email protected] (H.O.);[email protected] (V.V.)
2 Department of Advanced Materials Science, Faculty of Engineering, Kagawa University, 2217-20 Hayashi-cho,Takamatsu, Kagawa 761-0396, Japan; [email protected]
* Correspondence: [email protected]; Tel.: +33-563-493-085
Received: 28 October 2020; Accepted: 25 November 2020; Published: 29 November 2020
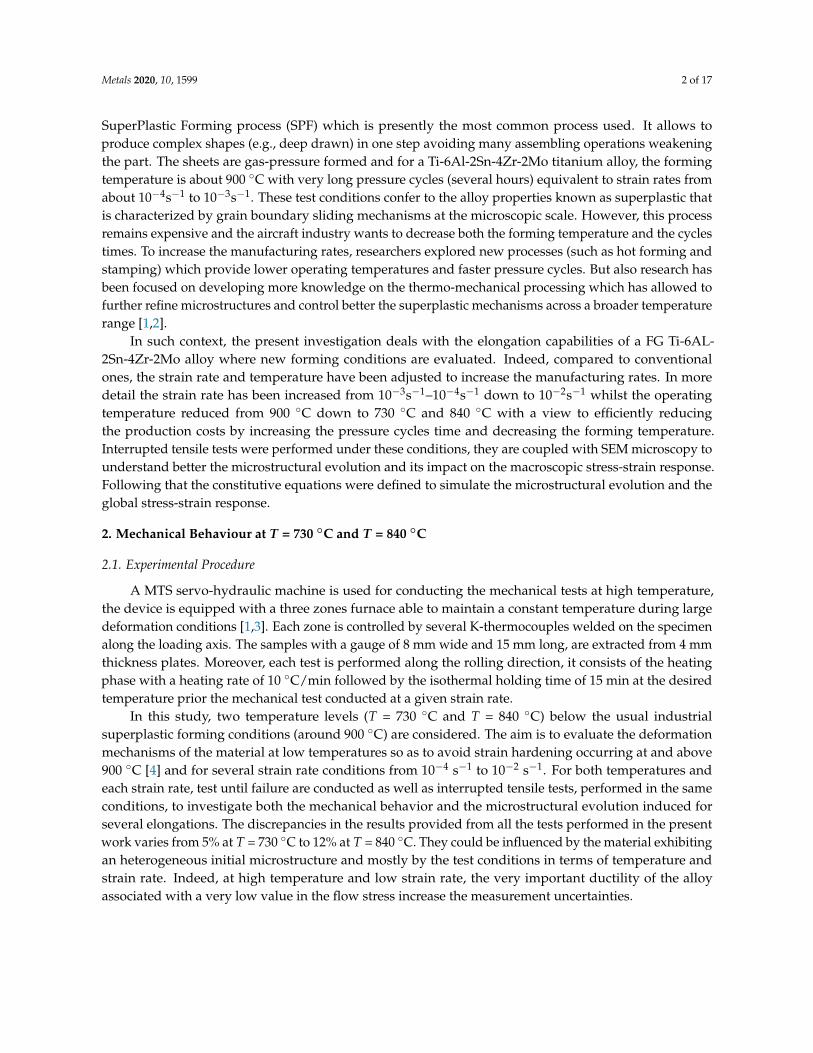
Abstract: In this work, the hot deformation characteristics of a near-α Ti-Al-2SnZr-2Mo alloy (Ti6242 alloy)with a Fine-Grained (FG) microstructure (dα = 2.86 µm) were investigated at two levels of temperature,T = 730 C and T = 840 C. The initial microstructure consists of equiaxed nodules of the α phaseas well as some α lamellae sparsely distributed and separated by thin layers of the BCC β phase.For both temperatures, three strain rates (10−4, 10−3, 10−2 s−1) were analysed during loading. Moreover,the microstructural evolution (α size and morphology) was also evaluated by conducting interruptedtensile tests. The different tensile testing conditions greatly influence the stress-strain response of thematerial as well as the microstructure evolution. Indeed, various phenomena can take place such aselongation of the grain structure, globularization, dynamic recrystallization and grain growth of theequiaxed areas depending on the temperature, the strain rate and the strain level. The FG Ti6242 alloyexhibits interesting superplastic ductility at T = 840 C. At this temperature either a very gradual flowsoftening (at higher strain rate) or flow hardening (at lower strain rate) can be observed and are relatedrespectively to one or more of the following mechanisms: lamellae globularization, DRX and grain growth.At the intermediate strain rate, both mechanisms, strain hardening and softening, coexist. At T = 730 C,the onset of the α lamellae globularization was only promoted at low strain rate. A mechanical behaviormodel was developed in the temperature range of 730–840 C, which was able to take into account all theobserved phenomena: viscosity, softened behavior and strain hardening. Constitutive equations werecalibrated from the stress-strain responses and microstructural observations, and the computed resultswere in good agreement with the experiments.
Keywords: Ti-6Al-2Sn-4Zr-2Mo titanium alloy; hot forming conditions; microstructural observations;softening mechanisms; unified viscoplastic constitutive equations
1. Introduction
Titanium alloys, namely Ti-6Al-4V or Ti-6AL-2Sn-4Zr-2Mo alloys are widely used in the aircraftindustry. They are typically used in sheet form to manufacture pylon or engine parts by utilising
Metals 2020, 10, 1599; doi:10.3390/met10121599 www.mdpi.com/journal/metals
Metals 2020, 10, 1599 2 of 17
SuperPlastic Forming process (SPF) which is presently the most common process used. It allows toproduce complex shapes (e.g., deep drawn) in one step avoiding many assembling operations weakeningthe part. The sheets are gas-pressure formed and for a Ti-6Al-2Sn-4Zr-2Mo titanium alloy, the formingtemperature is about 900 C with very long pressure cycles (several hours) equivalent to strain rates fromabout 10−4s−1 to 10−3s−1. These test conditions confer to the alloy properties known as superplastic thatis characterized by grain boundary sliding mechanisms at the microscopic scale. However, this processremains expensive and the aircraft industry wants to decrease both the forming temperature and the cyclestimes. To increase the manufacturing rates, researchers explored new processes (such as hot forming andstamping) which provide lower operating temperatures and faster pressure cycles. But also research hasbeen focused on developing more knowledge on the thermo-mechanical processing which has allowed tofurther refine microstructures and control better the superplastic mechanisms across a broader temperaturerange [1,2].
In such context, the present investigation deals with the elongation capabilities of a FG Ti-6AL-2Sn-4Zr-2Mo alloy where new forming conditions are evaluated. Indeed, compared to conventionalones, the strain rate and temperature have been adjusted to increase the manufacturing rates. In moredetail the strain rate has been increased from 10−3s−1–10−4s−1 down to 10−2s−1 whilst the operatingtemperature reduced from 900 C down to 730 C and 840 C with a view to efficiently reducingthe production costs by increasing the pressure cycles time and decreasing the forming temperature.Interrupted tensile tests were performed under these conditions, they are coupled with SEM microscopy tounderstand better the microstructural evolution and its impact on the macroscopic stress-strain response.Following that the constitutive equations were defined to simulate the microstructural evolution and theglobal stress-strain response.
2. Mechanical Behaviour at T = 730 C and T = 840 C
2.1. Experimental Procedure
A MTS servo-hydraulic machine is used for conducting the mechanical tests at high temperature,the device is equipped with a three zones furnace able to maintain a constant temperature during largedeformation conditions [1,3]. Each zone is controlled by several K-thermocouples welded on the specimenalong the loading axis. The samples with a gauge of 8 mm wide and 15 mm long, are extracted from 4 mmthickness plates. Moreover, each test is performed along the rolling direction, it consists of the heatingphase with a heating rate of 10 C/min followed by the isothermal holding time of 15 min at the desiredtemperature prior the mechanical test conducted at a given strain rate.
In this study, two temperature levels (T = 730 C and T = 840 C) below the usual industrialsuperplastic forming conditions (around 900 C) are considered. The aim is to evaluate the deformationmechanisms of the material at low temperatures so as to avoid strain hardening occurring at and above900 C [4] and for several strain rate conditions from 10−4 s−1 to 10−2 s−1. For both temperatures andeach strain rate, test until failure are conducted as well as interrupted tensile tests, performed in the sameconditions, to investigate both the mechanical behavior and the microstructural evolution induced forseveral elongations. The discrepancies in the results provided from all the tests performed in the presentwork varies from 5% at T = 730 C to 12% at T = 840 C. They could be influenced by the material exhibitingan heterogeneous initial microstructure and mostly by the test conditions in terms of temperature andstrain rate. Indeed, at high temperature and low strain rate, the very important ductility of the alloyassociated with a very low value in the flow stress increase the measurement uncertainties.

Metals 2020, 10, 1599 3 of 17
2.2. Stress-Strain Responses
Figures 1 and 2 illustrate the stress-plastic strain curves for each condition of strain rate, elongationand temperature. Except for the condition with the highest temperature (840 C) and the lowest strainrate 10−4s−1, which shows a continuous slight hardening, the stress-strain curves are characterized bythree steps: (i) an initial work hardening until a critical strain (peak stress) followed by (ii) a regime of nearsteady-state flow, flow hardening or flow softening.
+ o
+ o+ o
0 0.1 0.2 0.3 0.4 0.5 0.6 0.7 0.8 0.9 1
0
50
100
150
200
250
300
350
400
450
500
0 0.1 0.2 0.3 0.4 0.5 0.6 0.7 0.8 0.9 1
0
50
100
150
200
250
300
350
400
450
500
0 0.1 0.2 0.3 0.4 0.5 0.6 0.7 0.8 0.9 1
0
50
100
150
200
250
300
350
400
450
500
Figure 1. Plastic Stress-Strain curves performed at 730 C for several strain rate conditions and elongations.
+ o
+
+ o
0 0.5 1 1.5 2
0
25
50
75
100
125
150
175
200
0 0.5 1 1.5 2
0
25
50
75
100
125
150
175
200
0 0.5 1 1.5 2
0
25
50
75
100
125
150
175
200
Figure 2. Plastic Stress-Strain curves performed at 840 C for several strain rate conditions and elongations.
The mechanical properties can be evaluated through the values given in Table 1. It provides theevolution of the maximal stress and the associated plastic deformation for each test condition. For bothtemperatures, a decrease of the strain rate involves a decrease in flow stress and an increase of the plasticdeformation and leads to an enhancement of the mechanical properties. This fact reveals the importance ofthe viscoplastic behaviour. Moreover, the results show very close values of flow stress at (730 C, 10−4s−1)and at (840 C, 10−2 s−1) but a plastic deformation twice higher at 730 C which means that a low speedforming process at 730 C should be promoted compared to a higher speed forming process at 840 C.

Metals 2020, 10, 1599 4 of 17
Table 1. Maximal stresses σmax achieved for the deformation εp as a function of the strain rate ε and thetemperature T.
T [C] ε [s−1] T [C] ε [s−1]730 10−4 10−3 10−2 840 10−4 10−3 10−2
σmax [MPa] 180 310 444 σmax [MPa] 47 96 190
εp 0.4 0.258 0.145 εp 0.5 0.415 0.17
At 730 C (Figure 1), on the one hand, the tensile tests performed until the failure reveal a viscoplasticbehaviour with hardening. Thus, a flow stress decrease and an elongation increase is observed withthe strain rate decrease. On the other hand, while the pictures of the samples of the interrupted tensiletests do not exhibit necking initiation, a flow softening is observed for the last interrupted strain levelregardless of the strain rate. This softening cannot be attributed to the only necking phenomenon notsufficient to explain the trend of the stress-strain curves and it suggests that supplementary deformationmechanisms seem to contribute to this stress decrease. The ductile behaviour is obtained as illustrated bythe in-plane curvature of the specimen profiles along gauge length for the tests conducted until failure(see Figures 1 and 2). Finally, from higher elongations to the final failure of the sample, necking initiationcan play a significant role in the stress decrease.
At 840 C, similar observations can be done (Figure 2). The viscoplastic behaviour increases withthe decrease of hardening. At the end of the tensile test, necking greatly contributes to the drastic stressdecrease. However, as shown by the interrupted tensile tests and the associated specimen pictures(Figure 2), the stress decrease also occurs prior to the necking initiation and this phenomenon becomesincreasingly important compared to 730 C. Microstructural investigations are required in order to betterunderstand the mechanisms responsible for the stress decrease prior to necking. Indeed, the occurrence offlow softening in titanium alloys can be related to many mechanisms such as dynamic recovery (DRV byannihilation of dislocation) followed by dynamic recrystallization (DRX), dynamic globularization oflamellar α, deformation heating (locally rising of the temperature), loss of Hall-Petch strengthening at α/β
lamellae interfaces as well as texture evolution [5,6].
3. Microstructural Charaterization
3.1. Methodology and Material
For microstructural analyses, the initial and the deformed specimens were sectioned parallel andperpendicular to the tensile axis (RD/TD and RD/ND surfaces with RD, TD and ND that respectively meanRolling, Transverse and Normal Directions). The microstructure was characterized by scanning electronmicroscopy (SEM) in the back-scattered electron (BSE) mode and by electron backscattered diffractionanalysis (Oxford –HKL EBSD detector). Note that SEM-BSE images were obtained either on a HitachiTM3030Plus Tabletop SEM or a FEI Nova NanoSEM 450 FEGSEM. Grains size (of the α nodules) as wellas the α phase fraction fα were obtained by image analysis (using Image J and/or Aphelion R© softwares).Note that the phase fraction fβ at 730 C and 840 C was obtained on some specimens heat treated for twohours at these two temperatures followed by a water quenching. The specimens for SEM observations andEBSD were mechanically polished using standard metallographic procedure (more details in [2]).
The material investigated in this study is a Ti6242 titanium alloy in the shape of 4 mm thick sheetwith a chemical composition (in wt%) of 6.02Al, 2.0Sn, 4.1Zr, 2.01Mo, 0.09Si, 0.1O, 0.02N, and balance Ti.The transus beta is Tβ = 995 C.
Metals 2020, 10, 1599 5 of 17
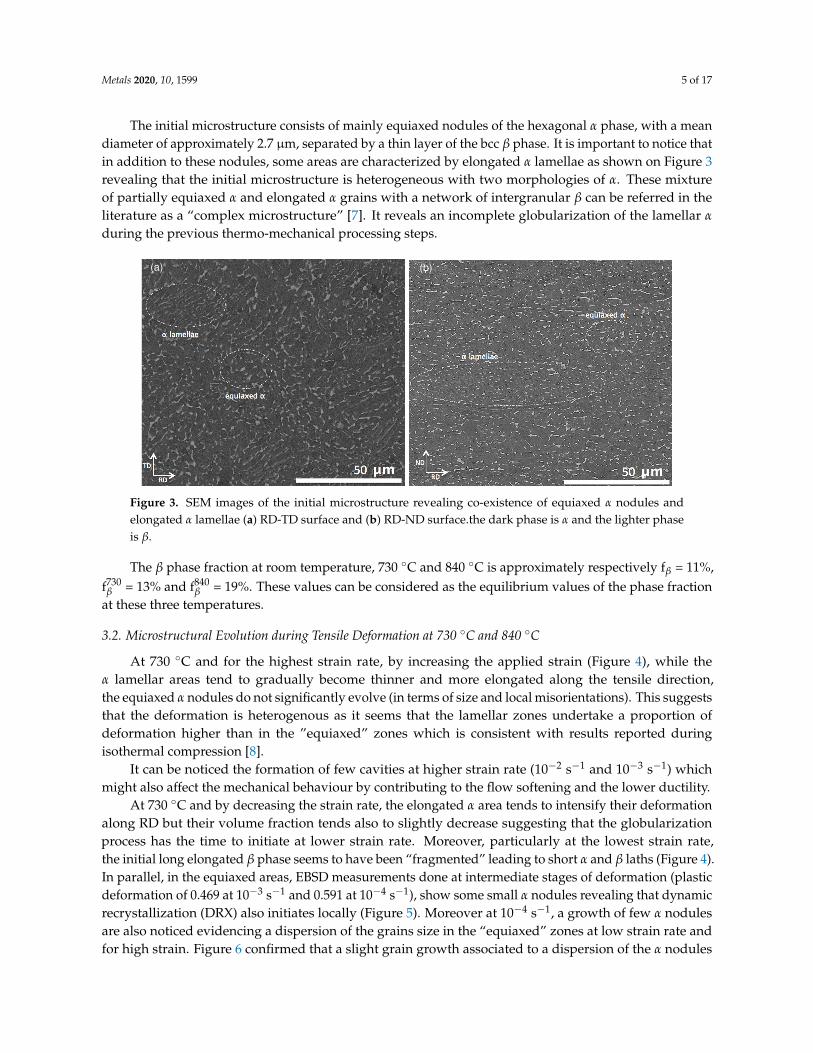
The initial microstructure consists of mainly equiaxed nodules of the hexagonal α phase, with a meandiameter of approximately 2.7 µm, separated by a thin layer of the bcc β phase. It is important to notice thatin addition to these nodules, some areas are characterized by elongated α lamellae as shown on Figure 3revealing that the initial microstructure is heterogeneous with two morphologies of α. These mixtureof partially equiaxed α and elongated α grains with a network of intergranular β can be referred in theliterature as a “complex microstructure” [7]. It reveals an incomplete globularization of the lamellar α
during the previous thermo-mechanical processing steps.
(a) (b)
Figure 3. SEM images of the initial microstructure revealing co-existence of equiaxed α nodules andelongated α lamellae (a) RD-TD surface and (b) RD-ND surface.the dark phase is α and the lighter phaseis β.
The β phase fraction at room temperature, 730 C and 840 C is approximately respectively fβ = 11%,f730β = 13% and f840
β = 19%. These values can be considered as the equilibrium values of the phase fractionat these three temperatures.
3.2. Microstructural Evolution during Tensile Deformation at 730 C and 840 C
At 730 C and for the highest strain rate, by increasing the applied strain (Figure 4), while theα lamellar areas tend to gradually become thinner and more elongated along the tensile direction,the equiaxed α nodules do not significantly evolve (in terms of size and local misorientations). This suggeststhat the deformation is heterogenous as it seems that the lamellar zones undertake a proportion ofdeformation higher than in the ”equiaxed” zones which is consistent with results reported duringisothermal compression [8].
It can be noticed the formation of few cavities at higher strain rate (10−2 s−1 and 10−3 s−1) whichmight also affect the mechanical behaviour by contributing to the flow softening and the lower ductility.
At 730 C and by decreasing the strain rate, the elongated α area tends to intensify their deformationalong RD but their volume fraction tends also to slightly decrease suggesting that the globularizationprocess has the time to initiate at lower strain rate. Moreover, particularly at the lowest strain rate,the initial long elongated β phase seems to have been “fragmented” leading to short α and β laths (Figure 4).In parallel, in the equiaxed areas, EBSD measurements done at intermediate stages of deformation (plasticdeformation of 0.469 at 10−3 s−1 and 0.591 at 10−4 s−1), show some small α nodules revealing that dynamicrecrystallization (DRX) also initiates locally (Figure 5). Moreover at 10−4 s−1, a growth of few α nodulesare also noticed evidencing a dispersion of the grains size in the “equiaxed” zones at low strain rate andfor high strain. Figure 6 confirmed that a slight grain growth associated to a dispersion of the α nodules

Metals 2020, 10, 1599 6 of 17
occur mainly at low strain rate at 730 C. So by decreasing the strain rate at 730 C, diffusion-controlledmechanisms as dynamic recovery, globularization (in lamellar areas) and DRX (in equiaxed areas) startto be promoted particularly at larger strains. Nevertheless, the final microstructure after tensile test stillappears heterogeneous.
Figure 4. SEM-BSE images showing the evolution of the microstructure of the Ti6242 alloy duringdeformation at 730 C for several elongations and strain rates: 10−2 s−1 (a,b); 10−3 s−1 (c,d); 10−4 s−1 (e,f).
At higher temperature (840 C), these softening mechanisms that can counteract the initial strainhardening (due to increase of entangled dislocations), occur at a lower critical strain. Note that this criticalstrain also decreases with decreasing the strain rate.

Metals 2020, 10, 1599 7 of 17
Figure 5. Image Quality maps in an equiaxed area of the Ti6242 alloy (a) prior to deformation and afterdeformation at 730 C with a plastic deformation of (b) 0.469 at 10−3 s−1 and (c) 0.591 at 10−4 s−1. In (b,c)the red color remains to the β phase and circled areas are example of recrystallized zones.
Indeed, at low strain rate (10−4 s−1), the microstructure exhibits less fraction of lamellar areas:as shown on Figure 7 the globularization starts from the first level of strain. A slight coarsening of fewα nodules can be also noticed as confirmed also by the Figure 6. Further deformation lead to a fullyequiaxed and homogeneous microstructure consisting of equiaxed α nodules separated by the β phase.By increasing the strain rate, the dynamic globularization of the lamellae is slightly restrained and initiatesat higher strain level. Thus, while at 10−3 s−1, the microstructure exhibits, before necking, almost onlyequiaxed areas, at 10−2 s−1 some elongated but also “fragmented” lamellae are still evidenced (as observedat 730 C for the lower stain rate).
0 0.5 1 1.5 2
0
0.5
1
1.5
2
2.5
3
3.5
4
4.5
510
-3
0 0.5 1 1.5 2
0
0.5
1
1.5
2
2.5
3
3.5
4
4.5
510
-3
Figure 6. Grain size evolution at 730 C and 840 C for several strain rate conditions for several elongationlevels and at the failure.
So higher temperature and lower strain rate, both promote an increase of the dynamic globularizationrate into the lamellar areas. Note also that the beta phase fraction slightly increases at 840 C.

Metals 2020, 10, 1599 8 of 17
Figure 7. SEM images showing the evolution of the microstructure of the Ti6242 alloy during deformationat 840 C for several elongations and strain rates: 10−2s−1 (a–c); 10−3s−1 (d–f); 10−4s−1 (g–i).
3.3. Discussion
During tensile deformation of the Ti6242 alloy at 730 C and 840 C, the stress-strain curves exhibitdifferent flow behavior characterized by all an initial strain hardening followed by, depending on the testsconditions, a steady state flow, a flow softening and/or hardening.
Based on the literature data dealing with plasticity of titanium alloys at high temperature (as [6]),the initial and “sharp” strain hardening is most likely due to the rapid generation and multiplication ofdislocations that can not be overcome, at earlier strain level, by dynamic recovery (DRV) mechanisms.Nevertheless, from a critical strain, a balance between strain hardening and DRV with the annihilationof dislocations could be promoted as dislocations motion is facilitated at high temperature (by cross slipand/or climb). Then with further deformation, different microstructural evolution can occur dependingon the temperature and the strain rate. As shown previously, the studied Ti6242 alloy is initiallycharacterized by equiaxed as well as lamellar areas that can respectively undergo DRX and globularization.High strain rate and low temperatures decrease the time of deformation and may limit diffusion-controlledmechanisms and dislocations mobility. Thus at 730 C, it seems that the lamellar areas undertake a moreimportant part of the deformation by increasing their elongation along the tensile direction leading tothinner lamellae. Moreover, lower strain rate promote the initiation of the globularization mechanismsinto the lamellar areas as well as DRX into the “equiaxed” areas. It should be remind also that at this lowtemperature (730 C), few cavities were noticed at 10−2 s−1 and 10−3 s−1 revealing some co-deformationincompatibilities between the “soft” layer of β and the “harder” α phases.
The decrease of the flow stress at 840 C can be linked to a higher mobility of dislocation whichfavour their annihilation and so the DRV at earlier strain level. Lower strain rate provides also longer
Metals 2020, 10, 1599 9 of 17
time for the mobility of the dislocations (and so to DRV) as well as the boundaries migration (and soDRX and grain growth). Moreover, the fact that the flow softening becomes increasingly important at840 C compared to 730 C could be, directly related to a more effective globularization rate of the lamellarareas evidenced at 840 C from the microstructural analysis. An homogeneous equiaxed microstructure isobtained at earlier strain level promoting, in association with a higher β phase fraction, the superplasticdeformation mechanisms by grain boundary sliding accommodated by climb/glide of dislocations and/ordiffusion mechanisms.
So a high temperature, a low strain rate as well as a slight increase of the β phase fraction mightpromote the globularization efficiency as well as the growth of both globularized and dynamicallyrecrystallized α grains.
It is important to notice that, in comparison with a Ti-6Al-4V alloy having a similar initialheterogeneous microstructure [3], the globularization process in this near-alpha Ti6242 alloys is clearlyless effective at comparable deformation conditions. Indeed, it is reported in [3] that a fully equiaxedmicrostructure was obtained during a tensile deformation at 750 C and with a strain rate of 10−2 s−1.Indeed, since the “globularization” is the diffusion-controlled process that involved the penetration of theβ phase (by wedging) along substructures inside α lamellae and as the Mo solute has a lowest diffusivitythan V in the β matrix it could explain the decrease of the globularization rate in the Ti6242 alloy.
4. Behaviour Modelling
This section firstly presents the model formulation and the identification procedure. Then,the prediction given by the model are illustrated and discussed.
4.1. Constitutive Equations
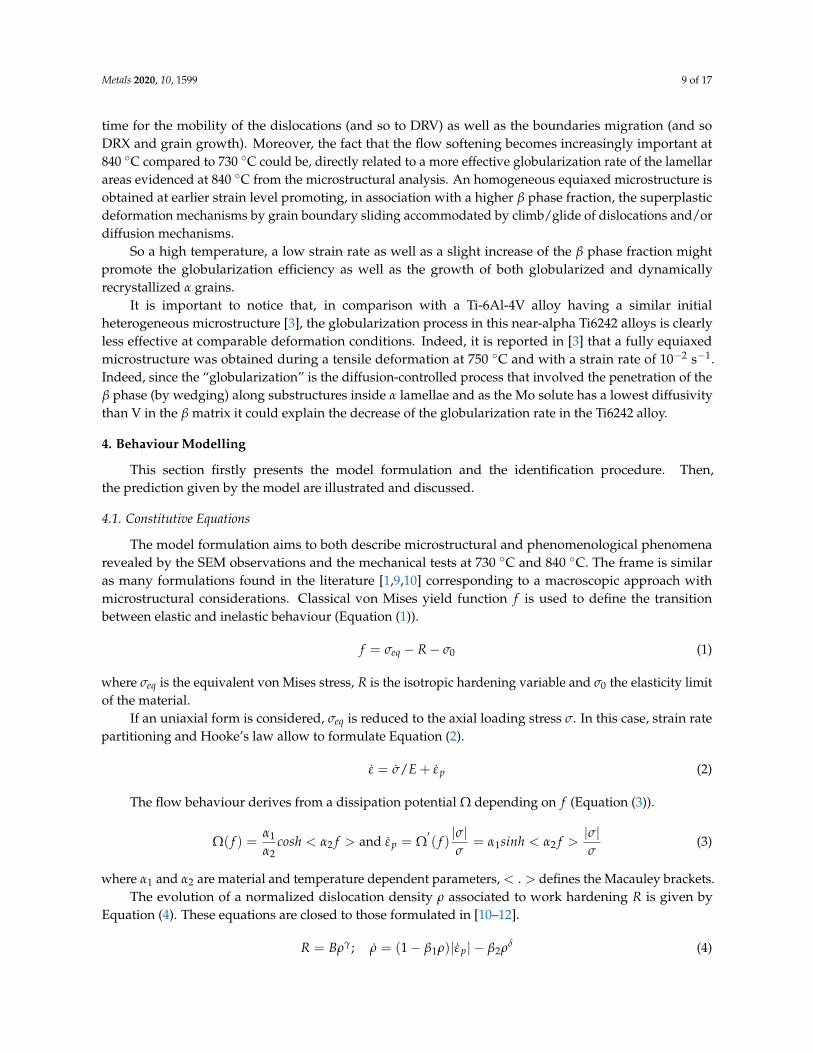
The model formulation aims to both describe microstructural and phenomenological phenomenarevealed by the SEM observations and the mechanical tests at 730 C and 840 C. The frame is similaras many formulations found in the literature [1,9,10] corresponding to a macroscopic approach withmicrostructural considerations. Classical von Mises yield function f is used to define the transitionbetween elastic and inelastic behaviour (Equation (1)).
f = σeq − R− σ0 (1)
where σeq is the equivalent von Mises stress, R is the isotropic hardening variable and σ0 the elasticity limitof the material.
If an uniaxial form is considered, σeq is reduced to the axial loading stress σ. In this case, strain ratepartitioning and Hooke’s law allow to formulate Equation (2).
ε = σ/E + εp (2)
The flow behaviour derives from a dissipation potential Ω depending on f (Equation (3)).
Ω( f ) =α1
α2cosh < α2 f > and εp = Ω
′( f )|σ|σ
= α1sinh < α2 f >|σ|σ
(3)
where α1 and α2 are material and temperature dependent parameters, < . > defines the Macauley brackets.The evolution of a normalized dislocation density ρ associated to work hardening R is given by
Equation (4). These equations are closed to those formulated in [10–12].
R = Bργ; ρ = (1− β1ρ)|εp| − β2ρδ (4)

Metals 2020, 10, 1599 10 of 17
where B,γ, δ and βi are temperature dependent model parameters. This equation includes both dynamicand recovery terms able to fairly describe the dislocation motion.
Modelling the grain growth evolutions can easily been introduced in the constitutive equations [9,13].Three main contribution are classically considered, static grain growth dsta, plastic strain induced graingrowth ddyn and grain refinement due to recrystallization process dDRX (See Equation (5)).
d = dsta + ddyn + dDRX (5)
In the sequel, as explained in the previous section, the flow softening can be due to a succession ofmechanisms as the dislocations substructure evolution and annihilation (dynamic recovery), the dynamicrecrystallisation process in α-nodular areas as well as locally the globularization of the α-lamellae areas [12]or adiabatic shearing behavior of these areas involving a local temperature increase [14]. Note that DRX issometimes, considered as one of the globularization mechanism [15,16].
Thus, the evolution equation related to the DRX process dDRX is not well suitable in the presentcontext as the grain size refinement, if exists, is a very local phenomenon (either in lamellar or nodularareas) and cannot be easily observed and taken into account from a macroscopic model formulation.Moreover, as additional SEM observations [4] (not presented here) do not exhibit significant static graingrowth, the evolution equation related to this effect dsta also vanishes.
Finally, Equation (5) is reduced to Equation (6) only considering the plastic strain induced graingrowth clearly observed in the present study, namely at 840 C and ε = 10−4s−1
d = ddyn = Adm|εp|n (6)
where A, m and n are temperature dependent model parameters. Note that the initial condition of thisdifferential equation is denoted d0 corresponding to the initial grain size.
As explained in the previous section, α-lamellae areas of the initial microstructure are thesites of softening mechanisms [12]. An internal variable S is then introduced to describe thisphenomenon. The formulation is given in Equation (7), it is similar to those considered in many otherinvestigations [10,11,13] intended to describe either dynamic recrystallization, globularization or adiabaticshearing behavior.
S = ηεη1p < εp − εc >
η2 (Smax − S)η3 (7)
where η and ηi are material and temperature dependent parameters. S describes the volume fraction ofthe softened microstructure, it is initiated when the inelastic strain εp exceeds a critical value εc and tendstowards an asymptotic value defined by Smax.
Initially, these softened zones correspond to the initial lamellar microstructure areas which evolvetowards an equi-axe microstructure under the temperature effect and mechanical loading.
Regardless of the test temperature, the soften behaviour is more important for the higher strainrates [11,17]. Moreover, grain growth is dominant for the lower strain rates and can involve strainhardening effect. In order to take into account both phenomena, Equation (3) is modified as described inEquation (8):
εp = α1sinh < α2 f >|σ|σ
(1
1− S
)α3( dd0
)−α4
(8)

Metals 2020, 10, 1599 11 of 17
The constitutive equations set can be summarized as follows (Equation (9)):
f = σeq − R− σ0
ε = σ/E + εp
R = Bργ; ρ = (1− β1ρ)|εp| − β2ρδ
d = ddyn = Adm|εp|n
S = ηεη1p < εp − εc >η2 (Smax − S)η3
εp = α1sinh < α2 f > |σ|σ
(1
1−S
)α3(dd0
)α4
(9)
For each model parameter p, the temperature dependence can be expressed in the form of anArrhenius relation (see Equation (10)).
p = p0eQp
RgT (10)
where T is the temperature in Kelvin and Rg = 8.31 J·mol−1·K−1 the universal gas constant. In thepresent study, note that these relations are only valid in the temperature range of 730 C–840 C. Indeed,their extension to a broader range of temperature would require further investigations.
In the next paragraph, the identification procedure of the model parameters and the results obtainedare presented.
4.2. Model Prediction
Runge-Kutta numerical integration schemes are used to solve the non linear constitutive equationsillustrated by Equation (9). Several calibration stages are firstly performed to estimate the values of modelparameters such as the elastic properties or the viscous flow. The coefficients of the differential equationdescribing the dynamic grain growth effect (see Equation (6)) are also evaluated using an analyticalform provided by the theory of Lifshitz-Slyozov-Wagner and applied on Ti6242Si or Ti-6Al-4V alloys bySemiatin [14].
The identification procedure of the model parameters requires the use of an optimisation loop and thedefinition of an objective function F combining 2 sub-objective functions (Fi)i=1,2 for a given temperature.They are based on experimental results given in Sections 2 and 3, and concern respectively the grain sizedexp and the stress σexp evolutions for several conditions of temperature and strain rates (See Equation (11)).
F = 1N
(F1 + F2
)F1 = ∑Nd
k=1
(||d−dexp ||||dexp ||
)k
F2 = ∑Nσk=1
(||σ−σexp ||||σexp ||
)k
(11)
where Nd and Nσ denote the number of experimental curves, in the present study, Nd = Nσ = 3corresponding to the studied strain rate conditions and N = Nd + Nσ.
||.|| is the Euclidean norm defined as ||x|| =(
∑Nptj=1 x2
i
) 12
with Npt the number of data points
considered in each experiment corresponding the time outputs that are strictly the same with those fromthe simulated files.

Metals 2020, 10, 1599 12 of 17
Hence, a constraint optimization method based on Genetic Algorithm is used to determine theparameters set by minimizing the objective function defined in Equation (11) with respect the constraintsdefined in the calibration stages. The Genetic algorithm uses a population size of 200 and a numberof generations of 3000. At the end, the experimental curve related to the grain size evolution at thehigher strain rate (10−2s−1) is not included in the objective function formulation reducing the number ofexperiments to Nd = 2.
The predictions of the grain size evolution according to the strain rate are illustrated in Figure 8 at730 C (left) and 840 C (right). The model faithfully describes the experiments except for the higher strainrate as mentioned previously. Of course, the average grain size measured at failure cannot be predicted,because it concerns high heterogeneous strain field close to the necking area and therefore cannot bedescribed by the present model formulation.
Figure 9 gives the comparison of the experimental and simulated stress-strain responses for all thestudied test conditions. The identification procedure uses the tests carried out up to the rupture of thesample. But, each test is truncated to a maximum elongation level below which damage initiation isnegligible and no necking process has occurred.
Table 2 refers to the values of all the model parameters.
Table 2. Model parameters in conjunction with Equations (9) and (10), Temperature-dependent parameters(left) and constant parameters (right).
Parameter p Coefficient p0 Coefficient Qp (J·mol−1) Parameter p Value
E 1.0 8.9× 10⁴
σ0 1.1× 10⁻¹ 4.7× 10⁴
B 20.0 2.7× 10⁴ γ 2.9β1 1.35× 10³ −6.3× 10⁴ δ 10.0β2 4.6× 10⁻⁵ 1.3× 10⁵
A 4.2× 10² −2.654× 10⁵ m 2.0n 3.1× 10² −5.9× 10⁴
η 5.75× 10⁴ 1.1× 10⁴
η2 2.6× 10⁻³ 5.85× 10⁴
η3 1.9× 10⁵ −1× 10⁵ η1 2.2εc 3.23× 10¹⁰ −2.36× 105
Smax 3.0 −2.2× 10⁴
α1 1.365× 10⁶ −2.013× 10⁵
α2 3.05 −4.445× 10⁴
α3 300.0 −3.1× 10⁴
α4 100.0 −3.65× 10⁴

Metals 2020, 10, 1599 13 of 17
0 0.5 1 1.5 2
0
0.5
1
1.5
2
2.5
3
3.5
4
4.5
510
-3
0 0.5 1 1.5 2
0
0.5
1
1.5
2
2.5
3
3.5
4
4.5
510
-3
Figure 8. Grain size evolution at 730 C and 840 C for several strain rate conditions (Model predictions:lines; Experiment: Symbols).
0 0.2 0.4 0.6 0.8 1 1.2 1.4 1.6
0
50
100
150
200
250
300
350
400
450
500
0 0.2 0.4 0.6 0.8 1 1.2 1.4 1.6
0
50
100
150
200
250
300
350
400
450
500
Figure 9. Comparison between experimental and computed stress-strain curves at 730 C and 840 C forseveral strain rate conditions (Model predictions: lines; Experiment: Symbols).
5. Discussion
The dynamic grain growth effect increases with the temperature and it is also influenced by the strainrate. Indeed, it is observed for the lower strain rates (10−3s−1 and 10−4s−1) whereas it is not activatedat 10−2s−1. In this case, a slight average grain size decrease seems to occur, but this effect is hard toquantify because it only concerns the microstructural evolution of localized areas belonging mainly tothe prior lamellar microstructure and where a softening phenomenon is induced during the deformationprocess. Therefore, this effect can not be explicitly taken into account at a macroscopic scale through aspecific internal variable. However, it can explain the stress decrease occurring at high strain rates (10−2s−1
and 10−3s−1) and for both temperatures studied. Therefore, the softening phenomenon (Equation (7))is introduced through the S variable and coupled with the viscous flow rule (Equation (8)). On otherhands, at lower strain rates, grain growth involves a strain hardening effect which can be described by theintroduction of the internal variable d (Equation (6)) in the viscous flow rule (Equation (8)). At intermediatestrain rate (10−3s−1), both mechanisms coexist.
Figure 10 illustrates the evolution of the softening mechanisms according to the deformation given bythe model for each test condition. The softening kinetic and the stress decrease are strongly connected.For instance, at the strain rate of 10−2s−1, the softening mechanism is active in the deformation range of

Metals 2020, 10, 1599 14 of 17
0.2–0.4 at T = 730 C and 0.4–0.75 at T = 840 C which corresponds to the ranges where the stress decreaseis active (Figure 9). The same conclusions can be done for the other strain rates even if this phenomenonclearly decreases with the strain rates.
0 0.2 0.4 0.6 0.8 1 1.2 1.4 1.60
0.1
0.2
0.3
0.4
0.5
0.6
0.7
0.8
0.9
1
(a)
0 0.2 0.4 0.6 0.8 1 1.2 1.4 1.60
0.1
0.2
0.3
0.4
0.5
0.6
0.7
0.8
0.9
1
(b)
Figure 10. Normalised softening mechanism estimated from variable S at T = 730 C (a) and T = 840 C (b).
The origins of these mechanisms leading to a flow softening behavior are complex to analyze.Several assumptions can be done. Deformation heating could influence the softening behavior, but itis usually dominant for the very high strain rates (e.g., ε ≥ 0.1 s−1) [18]. It could also be due to thedevelopment, locally, of substructure then subgrains into the α lamellar leading, from a sufficient strainto dynamic transformation and the occurrence of a globularized microstructure with fine grains. Indeedit is widely admitted that flow softening in equiaxed microstructure is much less than that in lamellarmicrostructure [5] as more sources of softening could be involved during the globularization process.Nevertheless, Figure 11 gives the evolution of the coefficient m according to the deformation. m describesthe strain rate sensitivity through the well known relationship σ = Kεm
p . The slight decrease of thiscoefficient during the deformation process regardless of the test temperature does not allow to valid thislast assumption. If the process of lamellar fragmentation is effective, the flow softening could be alsoattributed to the loss of strengthening effect at the α/β interfaces in the lamellar areas [5,19]. Nevertheless,in our study, this fragmentation mechanism which leads to a globularized microstructure,is mainlypromoted at high temperature (T = 840 C) and low strain rate. These observations are not consistent withthe evolution, on Figure 11, of the variable S that show an important contribution of softening mechanismat high strain rate. So, at least for high strain rate, it seems obvious that additional softening sources areincluded into the variable S. In particular, the micro-cavities observed at low temperature and high strainrate could contribute, to some extent, to the softening. Note that another softening reason can be related tothe texture evolution with the rotation of the α phase in a more softer orientation. This phenomenon was notevaluated in this study. It appears that further investigations are needed to understand more precisely thedynamic transformation accounting for the flow softening. Finally, the variable S considered in the modelformulation remains a phenomenological internal variable which can include several mechanisms leadingto the flow softening illustrated in the stress-strain curves. As mentioned previously, each mechanism canact simultaneously or sequentially depending on the elongation range. The implementation of a multiscale approach could be used to take into account the effects of all contributions separately, but this wouldrequire further investigations in order to determine them accurately.

Metals 2020, 10, 1599 15 of 17
0 0.1 0.2 0.3 0.4 0.5 0.6 0.7 0.8
0
0.05
0.1
0.15
0.2
0.25
0.3
0.35
0.4
0.45
Figure 11. Dependence on the strain rate sensitivity (m value) on strain at T = 730 C and T = 840 C.
6. Conclusions
Forming Ti6242 parts outside of conventional process parameters (T ∼ 900 C and ε ∼ 10−3s−1)considered in the aircraft industry is a challenging work in order to reduce the production costs. In thisinvestigation, the alloy is characterized in a temperature range T = 730 C–840 C and with a maximalstrain rate up to 10−2s−1. These new conditions require the development of a mechanical behaviour modelwhich constitutes an essential preliminary step before the simulation by Finite Elements of the forming ofan industrial part [20]. The following conclusions can be drawn from this work:
• Isothermal tensile tests were carried out on a FG Ti6242 alloy allowing to exhibit the effects of thetemperature, the strain rate on the microstructural evolution, initially characterized by both nodularand lamellar areas. Grain growth is activated at the lowest strain rates (ε ≤ 10−3s−1). Interruptedtensile tests confirm a softening mechanism increasing with the strain rate and which cannot berelated to necking phenomenon.
• At T = 840 C, the FG Ti6242 alloy exhibits an interesting superplastic behavior (m ≥ 0.3) thatis attributable to a slight higher β phase fraction and to an effective globularization process thattransforms the lamellar areas into an homogenous equiaxed microstructure which might promotegrain boundary sliding and associated accommodation mechanisms.
• At T = 730 C a lower ductility is obtained. By increasing the strain, the α lamellae mainly elongatealong the tensile direction while the equiaxed α grains evolve slightly (mainly at lower strain rate).The strain rate sensitivity value (m ≤ 0.3) associated to the microstructural evolution revealed thatthe deformation is mainly controlled by dislocation glide/climb mechanisms.
• Phenomenological constitutive equations with microstructural considerations have been developedto predict the mechanical behavior under such conditions of temperatures and strain rates.Particular attention is paid to the prediction of the flow softening through a specific internal modelvariable whose effect increases with the strain rate. On other hand, the model is also able to predictthe effect of grain growth observed for the lowest strain rates and leading to slight strain hardening.
• In addition to classical recovery mechanisms, a part of the the flow softening was attributed to theinitiation and ongoing of the dynamic globularization of the lamellar areas. Nevertheless additionalmechanisms related to dynamic transformation during straining (as micro-cavities, texture evolution,evolution into the β phase, DRX in the nodular areas...) are most probably also contributing.

Metals 2020, 10, 1599 16 of 17
Author Contributions: Conceptualization, V.V. (Vincent Velay), H.M. and V.V. (Vanessa Vidal); methodology, L.S.,L.D., A.I. and H.O.; investigation, L.S., L.D., A.I. and H.O.; writing—original draft preparation, V.V. (Vincent Velay),H.M. and V.V. (Vanessa Vidal); writing—review and editing, V.V. (Vincent Velay), H.M. and V.V. (Vanessa Vidal).All authors have read and agreed to the published version of the manuscript.
Funding: This research received no external funding.
Acknowledgments: The authors gratefully acknowledge T. Papaïx for his help in performing the mechanical tests.
Conflicts of Interest: The authors declare no conflict of interest.
References
1. Velay, V.; Matsumoto, H.; Vidal, V.; Chiba, A. Behavior modeling and microstructural evolutions of Ti–6Al–4Valloy under hot forming conditions. Int. J. Mech. Sci. 2016, 108–109, 1–13. [CrossRef]
2. Imai, H.; Yamane, G.; Matsumoto, H.; Vidal, V.; Velay, V. Superplasticity of metastable ultrafine-grained Ti-6242Salloy: Mechanical flow behavior and microstructural evolution. Mater. Sci. Eng. A 2019, 754, 569–580. [CrossRef]
3. Despax, L.; Vidal, V.; Delagnes, D.; Dehmas, M.; Matsumoto, H.; Velay, V. Influence of strain rate and temperatureon the deformation mechanisms of a fine-grained Ti-6Al-4V alloy. Mater. Sci. Eng. A 2020, 790, 139718. [CrossRef]
4. Yamane, G.; Velay, V.; Vidal, V.; Matsumoto, H. Mechanical behavior of Ti-6Al-2Sn-4Zr-2Mo titanium alloy underhot and superplastic forming conditions: Experiment and modeling. Defect Diffus. Forum 2018, 385, 413–418.[CrossRef]
5. Gao, P.; Fu, M.; Zhan, M.; Lei, Z.; Li, Y. Deformation behavior and microstructure evolution of titanium alloyswith lamellar microstructure in hot working porcess: A review. J. Mater. Sci. Technol. 2020, 39, 56–73. [CrossRef]
6. Semiatin, S. An Overview of the Thermomechanical Processing of α/β Titanium Alloys: Current Status andFuture Research Opportunities. Metall. Mater. Trans. A 2020, 51, 2593–2625. [CrossRef]
7. Bodunrin, M.O.; Chown, L.H.; van der Merwe, J.W.; Alaneme, K.K. Microstructural evolution during hotforming of Ti-6Al-4V alloy with complex initial microstructure. Int. J. Adv. Manuf. Technol. 2019, 104, 3017–3026.[CrossRef]
8. Zhou, D.; Zeng, W.; Xu, J.; Wang, S.; Chen, W. Evolution of equiaxed and lamellar α during hot compression in anear alpha titanium alloy with bimodal microstructure. Mater. Charact. 2019, 151, 103–111. [CrossRef]
9. Alabort, E.; Putman, D.; Reed, R. Superplasticity in Ti–6Al–4V: Characterisation, modelling and applications.Acta Mater. 2015, 95, 428–442. [CrossRef]
10. Yang, L.; Li, N.; Wang, B.; Lin, J.; Zhao, H.; Ma, W. Unified constitutive modelling for two-phase lamellartitanium alloys at hot forming conditions. Manuf. Rev. 2016, 3, 14. [CrossRef]
11. Yasmeen, T.; Shao, Z.; Zhao, L.; Gao, P.; Lin, J.; Jiang, J. Constitutive modeling for the simulation of thesuperplastic forming of TA15 titanium alloy. Int. J. Mech. Sci. 2019, 164, 105178. [CrossRef]
12. Gao, P.; Yang, H.; Fan, X.; Zhu, S. Unified modeling of flow softening and globularization for hot working oftwo-phase titanium alloy with a lamellar colony microstructure. J. Alloy. Compd. 2014, 600, 78–83. [CrossRef]
13. Lin, J.; Liu, Y.; Farrugia, D.C.J.; Zhou, M. Development of dislocation-based unified material model for simulatingmicrostructure evolution in multipass hot rolling. Philos. Mag. 2005, 85, 1967–1987. [CrossRef]
14. Park, C.H.; Lee, B.; Semiatin, S.; Lee, C.S. Low-temperature superplasticity and coarsening behavior ofTi–6Al–2Sn–4Zr–2Mo–0.1Si. Mater. Sci. Eng. A 2010, 527, 5203–5211. [CrossRef]
15. Shell, E.B.; Semiatin, S.L. Effect of initial microstructure on plastic flow and dynamic globularization during hotworking of Ti-6Al-4V. Metall. Mater. Trans. A 1999, 30, 3219–3229. [CrossRef]
16. Semiatin, S.; Seetharaman, V.; Ghosh, A.; Shell, E.; Simon, M.; Fagin, P. Cavitation during hot tension testing ofTi–6Al–4V. Mater. Sci. Eng. A 1998, 256, 92–110. [CrossRef]
17. Zhao, H.; Wang, B.; Ju, D.; Chen, G. Hot tensile deformation behavior and globularization mechanism of bimodalmicrostructured Ti-6Al-2Zr-1Mo-1V alloy. Trans. Nonferrous Met. Soc. China 2018, 28, 2449–2459. [CrossRef]
18. Semiatin, S.; Seetharaman, V.; Weiss, I. Flow behavior and globularization kinetics during hot working ofTi–6Al–4V with a colony alpha microstructure. Mater. Sci. Eng. A 1999, 263, 257–271. [CrossRef]

Metals 2020, 10, 1599 17 of 17
19. Semiatin, S.L.; Bieler, T.R. The effect of alpha platelet thickness on plastic flow during hot working of TI–6Al–4Vwith a transformed microstructure. Acta Mater. 2001, 49, 3565–3573. [CrossRef]
20. Mosleh, A.; Mikhaylovskaya, A.; Kotov, A.; Kwame, J. Experimental, modelling and simulation of an approachfor optimizing the superplastic forming of Ti-6. J. Manuf. Process. 2019, 45, 262–272. [CrossRef]
Publisher’s Note: MDPI stays neutral with regard to jurisdictional claims in published maps and institutionalaffiliations.
c© 2020 by the authors. Licensee MDPI, Basel, Switzerland. This article is an open accessarticle distributed under the terms and conditions of the Creative Commons Attribution(CC BY) license (http://creativecommons.org/licenses/by/4.0/).