EUROPEAN UNION - maritza.info Traditional recipes Haskovo_BG… · EUROPEAN UNION - maritza.info ... 20

255
Hungarian Geographical Bulletin 59 (3) (2010) pp. 255–269.
Experiences with the use of European Union resources in the Southern Great Plain region (Hungary) in 2007–2008
Gizella Vajda1
Abstract
From the very formation of the European Union there have existed regions with diff erent natural and social endowments. This causes a diversity in living conditions, income, and maturity within the integration. To reduce the socio-economic disparities between regions, and to raise the lagging ones are the major tasks within the EU in order to strengthen social and economic cohesion. The 2007–2013 year planning period for the fi rst time opened an opportunity for the regions to develop separate operational programs in the EU. The present study summarizes the results of a survey which examined the direct or indirect resources that arrived into the region during the fi rst two years (2007–2008) of the Southern Great Plain’s Operational Program (SGPOP). An analysis is made how the EU funds were used, which part of the regional operational program was fi nanced from them and how the mechanism for resource allocation worked.
Keywords: European Union, regional development, regional policy, Southern Great Plain
Introduction
Hungary’s accession to the European Union in 2004 opened up new prospects for ample improvement in functioning of the country’s urban system. The EU-membership has brought along a signifi cant change in the sett lement develop-ment in Hungary due to the access to the new fi nancial resources providing new opportunities.
The resources provided by the EU funds support the advancement of the economic and social cohesion and balanced territorial development. From 1990 Hungary was a benefi ciary of the PHARE (Poland and Hungary: Aid for Restructuring of the Economies) Program, which provided non-refundable re-sources to enhance the transition process into market economy, to advance the establishment of political democracy and to facilitate the integration process and the preparations for obtaining EU-membership (Horváth, Gy. 2001). From 2000 on, Hungary received a share from the two pre-accession funds: SAPARD 1 Southern Great Plain Regional Development Agency, Planning Department, Szeged,
H-6726, Közép fasor 1–3., [email protected], [email protected]

256
and ISPA. While the PHARE Program mainly prepared Hungary for the utili-zation of the Social and Regional Development Fund, the SAPARD Program paved the way for the reception of the Agricultural Fund whereas the ISPA Program did it for the use of the support from Cohesion Fund. The signifi cance of these programs amounts to much more than the fi nancial advantages they provide. These programs could make Hungary acquire the knowledge neces-sary for handling the rather complicated procedures and performing tasks in relation with the Structural and Cohesion Funds.
Hungary established relationships with the European Committ ee as early as the fi rst days of the change of regime and signed the articles of part-nership in 1991. Among the fi rst ones in Central Eastern Europe the country submitt ed its application for the EU accession in 1994 (Faragó, L. 2000). The Regional Development Policy of Hungary underwent a signifi cant qualitative change in 1996, when the XXI Act on Spatial Development and Planning was passed including the establishment of the institutional system of regional policy as its greatest achievement (Forman, B. 2001). In 1996 the Act did not take the responsibility of accomplishing the “top-down” regionalisation of the country, but it determined the regional levels and their range of tasks del-egating some of the latt er to organizations for public benefi t (Hrubi, L. 2000). The range of actions of regional politics is determined on the one hand by the institutional, operational and fi nancial reforms of the EU and by its Eastern extension, and on the other hand by the decentralisation processes within the national states (Michalski, A. and Saraceno, E. 2000). As a consequence of the decentralisation it may occur that the consolidation of the regional level is not followed by cooperation between the local and other sub-regional authorities. The networks established between the various levels, sectors and actors as a rule improve the innovative capacity and fl exibility of the regions signifi cantly (Capellin, R. 1997).
On May 1, 2004 the European Union welcomed 10 new member states in the Union and Hungary was one of them (Probáld, F. and Szabó, P. 2007; Nemes Nagy, J. 2009). The benefi ts of the Eastern extension were expected from the region’s dynamism and consequently from the increase of the EU’s inner market and the growth of the EU’s weight in world economy.
The economic development of the new member states is accelerated by the support granted from the EU funds. By the harmonized regulations, the risk foreign investors hitherto had to take has become reduced, thus the infl ow of the capital could be growing. Aft er the accession the newly accepted member states had the right to participate in the EU’s decision making proc-esses in those pointing out the future trends of the development over the whole continent (Probáld, F. and Szabó, P. 2007).
In the fi nancial period of 2000–2013 more than one third of the budget was aimed at fulfi lling the objectives of the EU’s regional policy. More than

257
80 per cent of the whole sum is devoted to facilitate “convergence”. Within the framework of the “convergence”, the poorest countries and regions of the EU (among them Hungary and the Southern Great Plain region ) are eligible to obtain fi nancial support. There are signifi cant diff erences regarding the economic structure and the development levels of the EU member states and regions (Probáld, F. and Szabó, P. 2007). Various methods have been used to reduce or balance these territorial diff erences, and depending on the methods the states and regions use, they may become either losers or winners (Horváth, Gy. 2009).
The primary objective of the policies in the European Community is to achieve balanced, harmonic development, which is not equal to “general” spatial development. Rather the policies highlight the most important devel-opmental factors of the various territories, emphasise these factors and indicate the developmental directions, taking into consideration the most important characteristics of the various regions (Csatári, B. 2002). Stöhr, W. and Tödling, F. (1997) point out that the concept of “spatial equity” is rather changeable regarding its content. According to their research the internationally defi ned aim of spatial and sett lement development policies are to create spatial equity and reduce inequality.
The agreements and documents of the EU concern all the member states impartially, but their eff ects may be diff erent in the various member states and regions (Hamedinger, A. et al. 2008).
By now it has become obvious that in certain territories of the EU the fi nancial resources distributed for developmental purposes have not yielded suffi cient results (Boldrin, M. and Canova, F. 2001; Puga, D. 2002), which is the case in Hungary as well. It is impossible to control the spatial processes without monitoring them. This is the reason why the analysis of the spatial data is essential and has great importance in predicting the outcomes (Kis, K. 2008).
The Community’s most important strategic aim is to mitigate the back-wardness and to develop the regions. The member states and their regions receive signifi cant monetary support from the common budget to overcome the diff erences (Horváth, Gy. 2009).
The changing role of the territorial levels in the new access countries
Comparing the countries that joined the European Union in 2004, it can be concluded that the territorial levels of the countries gain diff erent functions.
In Poland the spatial planning, regional development and economic de-velopment belong to the regions’ range of authority (Young, C. and Kaczmarek, S. 2000; Swianiewicz, P. 2006).
–

258
In the Czech Republic and in Slovakia the function of territorial devel-opment, which is rather important for the local economic development, also belongs to the regions’ responsibility (Józsa, Z. 2006), but local governments have important functions as well (Mezei, C. 2006).
In Lithuania the supervision of the use of territory, planning, educa-tion, the support of training and employment fall to the scope of the regions, however, in the fi eld of infrastructural development the local governments also have the right to intervene (Petkevicius, A. and Linertas, R. 2005). The role of the Regional Development Agencies (RDA) being active participants in the management of the projects, is changing from country to country. RDAs are actually the actors between the public sphere and the market sector. Though forming part of the state governance still they are fi nanced from public funds (Pálné Kovács, I. 2003).
In Latvia the development concepts of the planning statistical regions are prepared by the RDAs, at the same time they cooperate with the local governments and with the regional organs (ESPON 2006).
In Romania the RDAs are subordinated to the Regional Development Councils (RDC).
In Slovenia the RDAs are the representatives of the sett lements’ inter-ests both on local and national level, and also in the structures of the Union. Their task is to prepare the regional plans, to initiate regional developmental projects, to present them at public tenders and to monitor and evaluate these projects.
In Slovakia the RDAs function as the local and regional governments’ educational institutions, methodological centres or EU related centres for consultation (Buček, J. 2005).
In Bulgaria the agencies operating in developmental-fi nancial regions both coordinate the resources deriving from the Structural Funds and play a mediating and communicating role between the public and the private spheres.
The Hungarian RDAs are not only the operative organs of the Regional Councils, but they also play an active, initiating role in spatial development (Somlyódiné Pfeil, E. 2004), and as a re-conciliating organisation of the re-gional operational programs, they also manage the EU applications and par-ticipate in regional innovative and international projects.
Southern Great Plain region
Taking into consideration the state of infrastructural development, the Great Hungarian Plain (Alföld) usually is listed as underdeveloped macro-region in Hungary. This statement is exaggerated and it simplifi es the existing diff er-
–
–
–
–
–
–
–

259
ences in the urban system of the Great Hungarian Plain (Kovács, Z. 1999). The Great Hungarian Plain is one of the most extensive physico-geographical units of Hungary. The endangered state of its environment, the structural problems of its economy, the unique structure of its sett lement system, the state of its infrastructural development contribute to the area’s being “diff erent”, due to its unique characteristic features that are strikingly diff erent from those of other Hungarian regions.
On the basis of NUTS2 Great Hungarian Plain consists of two parts: Northern Great Plain and Southern Great Plain regions. By area Southern Great Plain located in the south-eastern part of Hungary, is the largest region in the country. Southern Great Plain is covered by Bács-Kiskun, Békés and Csongrád counties. Most of the territory is fl at – no more than 200 m above sea level – and rich in diverse natural assets and landscapes. Given the number of municipalities (254 being the lowest value within one region compared with the rest of the country) and the size of the region Southern Great Plain has the lowest density of municipalities in Hungary. However, with 49 towns, it is also the second most urbanized area of the country aft er Northern Great Plain (Figure 1).
Fig. 1. Size of urban sett lements in Southern Great Plain. Source: Own editing on the basis of Statistical Yearbook, 2008

260
Municipalities lagging behind in regional, social and economic terms include villages and towns alike and these municipalities represent 42 per cent of all populated areas. It is highly typical of the network of municipalities in Southern Great Plain that there is an increasingly varied range of scatt ered farmsteads, which constitute an integral part of the municipalities and there-fore they cannot be developed separately from them (SGPOP).
Taking into consideration the GDP per capita, of all the Hungarian re-gions only Central Hungary belongs to the “Competitiveness and Employment Regions”, all the other ones are “Convergence Regions”. The present study deals exclusively with the “Convergence Regions”. Of the latt er Southern Great Plain is among the most populous ones in Hungary being second only to Northern Great Plain (Table 1).
Regarding the GDP per capita, Southern Great Plain is far from being in the leading group. When compared to the other regions, it is considered to be a medium-ranked one. If the fi nancial resources distributed by the EU in the 2007–2013 period are taken into account, it can be seen that the regions with lower GDP and development level have gained stronger fi nancial support. The greatest amount of the EU-resources was received by Northern Great Plain, followed by Northern Hungary, whereas Southern Great Plain ranked third.
The fi nancial period of 2007–2013 was the fi rst one, when the regions were given the opportunity to work out their independent operational pro-grams for the utilization of the fi nancial resources allocated for development purposes (Table 2).
The Southern Great Plain’s Operational Program (SGPOP) was the fi rst Hungarian regional programme that was accepted by the European Commission in July, 2007. The fi rst tenders for applying for the EU-resources
Table 1. Comparative fi gures for regions in Hungary
Region Population,person
GDP per capita,1,000 HUF*
Share of GDP,
per cent*
EU source development,
2007–2013, billion HUF**
Southern Great PlainSouthern TransdanubiaNorthern Great PlainNorthern HungaryCentral TransdanubiaCentral HungaryWestern Transdanubia
1,334,506960,088
1,514,0201,236,6901,104,8412,897,317
997,939
1,5641,5961,4901,5122,1393,9212,370
8.86.59.68.0
10.047.110.0
207.05194.99269.64249.91140.46430.29128.25
Total 10,045,401 2,363 100.0 1,620.59* 2006 data, ** data calculated on 2007 pricesSource: Own editing on the basis of Hungarian Statistical Yearbook 2007, and regional development operational programs

261
available from 2007 were published in April 2007. Since then 53 tenders have been invited. The fi nancial re-sources could be applied for by sub-mitt ing projects within the framework of one- or two-round procedures. In case of two-round procedures the pre-liminary proposal of the project had to be submitt ed fi rst, and the detailed project was to be submitt ed only later, in case the preliminary proposal had been accepted and its further elabora-tion advised.
The aim of the two-round pro-cedure is to make it easier for the large investments with the requirement to elaborate the projects in more detail only if they have not been rejected in the fi rst round. The projects of high priority are the special ones that are approved by the national government, and thus they are treated diff erently.
The analysis of the submitt ed projects
During the fi rst two years of the im-plementation of the SGPOP nearly 45 per cent of the fi nancial resources of the 7 year-long fi nancial period be-came applicable. 60 per cent of the fi nancial resources aimed improving tourism and human infrastructure be-came applicable in the fi rst two years of the period. In connection with the tenders invited in 2007 and 2008, 1315 project proposals arrived at the Instru-mental Constitution from the region (Table 3). The outstandingly high pro-portion (46.5 per cent) of the projects aims to develop human infrastructure.
Tabl
e 2. S
outh
ern
Gre
at P
lain
’s O
pera
tive P
rogr
am re
sour
ces a
lloca
ted
and
anno
unce
d du
ring
the 2
007–
2013
pla
nnin
g pe
riod
Prio
rity
num
ber a
nd n
ame
Sour
ce20
07–2
013,
m
illio
n H
UF*
Ann
ounc
ed s
ourc
e in
20
07–2
008,
mill
ion
HU
FAdv
ertis
ed re
sour
ces
in re
latio
n to
the
annu
al s
ourc
e in
7
year
s pe
riod
, %Te
nder
ing
Feat
ured
pr
ojec
t1.
Reg
iona
l eco
nom
ic d
evel
opm
ent
2. T
ouri
sm-r
elat
ed d
evel
opm
ent
3. D
evel
opm
ent o
f tra
nspo
rt in
fras
truc
ture
4.
Hum
an in
fras
truc
ture
dev
elop
men
t5.
1. U
rban
dev
elop
men
t act
ions
5.2.
Sett
lem
ent d
evel
opm
ent w
ith e
nvir
onm
enta
l foc
us
37,5
2339
,608
45,6
7740
,648
26,5
7818
,426
5,47
118
,324
13,9
5123
,785
6,50
24,
570
1,12
04,
500
4,84
4 02,
999
5,77
8
17.6
57.6
41.1
58.5
35.7
56.2
Tota
l20
8,46
072
,603
19,2
4144
.1* D
ata
corr
ected
on 2
009
pric
es
Sour
ce: O
wn
editi
on b
ased
on da
ta fr
om S
outh
ern
Gre
at P
lain
Reg
iona
l Dev
elop
men
t Age
ncy
(SG
PRD
A) a
nd N
atio
nal
Dev
elop
men
t Age
ncy
(ND
A)

262
Other substantial part (30.8 per cent) of the projects is related to the development of transport infrastructure.
The amount of the required fi nan-cial support of the submitt ed applications three times exceeds that of the available fi nancial resources, which shows the re-gion’s sore need for sources of develop-ment. The invited fi nancial resources to develop human infrastructure proved to be insuffi cient, as applicants would re-quire 3.5 times more money. The greatest need for the fi nancial resources appeared in the fi elds of transport infrastructure and educational infrastructure. School build-ings and equipment in Southern Great Plain badly need modernisation, which is strikingly visible. The greatest interest was shown in the complex projects aiming to improve the infrastructure of educational institutions on the elementary and the sec-ondary levels and of dormitories. Most of the projects arrived at the Instrumental Constitution in this area, claiming fi nan-cial support fi ve times more than the avail-able sum.
The number of the submitted projects and the claims for the fi nancial resources show uniform distribution be-tween the three counties (Csongrád, Bács-Kiskun and Békés) of the region. Taking into consideration the main indicators re-lated to the territory and the population of the counties, it is Bács-Kiskun County that claimed 34.9 per cent of the region’s fi nan-cial resources. This value is only slightly above one third still it does not reach the county’s share within the regional popu-lation or territory of the region, which means that Bács-Kiskun County is under-represented in the 2007–2008 period. On the other hand 32.4 per cent of the submit-
Tabl
e 3. T
ende
rs re
ceiv
ed fo
r the
SG
POP
in 2
007–
2008
SGPO
P pr
iori
ties
Adv
ertis
ed
reso
urce
s (m
illio
n Ft
)
Tend
ers
rece
ived
Cla
ims
rece
ived
/ av
aila
ble
reso
urce
sh
are,
%N
umbe
r (p
iece
s)
need
for
supp
ort (
in
mill
ions
Ft)
1. R
egio
nal e
cono
mic
dev
elop
men
t2.
Tou
rism
-rel
ated
dev
elop
men
t3.
Dev
elop
men
t of t
rans
port
infr
astr
uctu
re
4. H
uman
infr
astr
uctu
re d
evel
opm
ent
5.1.
Urb
an d
evel
opm
ent a
ctio
ns5.
2. S
ett le
men
t dev
elop
men
t with
env
iron
men
tal f
ocus
5,47
118
,324
13,9
5123
,785
6,50
24,
570
70 120
405
611 48 61
6,84
224
,877
43,8
6985
,930
16,6
1511
,713
125.
113
5.8
314.
536
1.3
255.
525
6.3
Tota
l72
,603
1,31
518
9,84
626
1.5
Sour
ce: O
wn
editi
ng b
ased
on da
ta o
f SG
PRD
A a
nd N
DA

263
ted projects from Békés, and especially 32.7 per cent from Csongrád (the latt er with a territorial share of 23.2 per cent within the region), indicate overrepre-sentation of these two counties.
If the number of the submit-ted projects and the amount of fi nan-cial resources claimed in them are also compared to the diff erent types of set-tlements, a rather surprising result is obtained (Table 4).
Analysing the number of the sub-mitt ed projects and the claims for fi nan-cial resources, it can be seen that the major part of claims was submitt ed by villages. 45 per cent of all the competing projects and 30 per cent of the claims for fi nancial support originated from these types of sett lements. This is due to the thematic separation of the Sectoral Operational Programs (SOP) and the Regional Operational Programs (ROP). While the larger towns can fi nance their develop-ment from the resources of the Sectoral Operational Programs, the opportunities of the smaller sett lements are rather lim-ited. They can promote their development by using the fi nancial resources obtained from the SGOP or occasionally from the Rural Development Programs.
The analysis of the projects from fi nancial point of view shows that the average fi nancial requirement of a project is nearly 150 million HUF. The projects that claim less than this amount were submitt ed by the villages. This is due to both the size of the projects and the restricting eff ect of the shortage of the sett lements in own resources. Taking into consideration the type of sett lement where the projects were submitt ed, it can be concluded that the number of the
Tabl
e 4. T
ende
rs re
ceiv
ed a
ccor
ding
to sett l
emen
t typ
es
Sett l
emen
t cat
egor
ies
(res
iden
t pop
ulat
ion)
Adv
ertis
ed
reso
urce
s (m
illio
n Ft
)
Tend
ers
rece
ived
Sett l
emen
t rat
e of
tota
l need
for
supp
ort %
Num
ber
(pie
ces)
Need
for
supp
ort (
in
mill
ions
Ft)
Cou
nty
Tow
nPo
pulo
us c
ity o
f 30,
000
inha
bita
nts
Tow
ns w
ith p
opul
atio
n be
twee
n 10
,000
and
30,
000
Tow
ns w
ith p
opul
atio
n of
10,
000
inha
bita
nts
Mun
icip
aliti
es
72,6
03
183 85 215
235
597
32,6
8721
,361
43,6
4836
,198
55,9
51
17.2
11.3
23.0
19.1
29.5
Tota
l1,
315
189,
846
100.
0So
urce
: Ow
n ed
ition
bas
ed o
n da
ta fr
om S
GPR
DA
and
ND
A
264
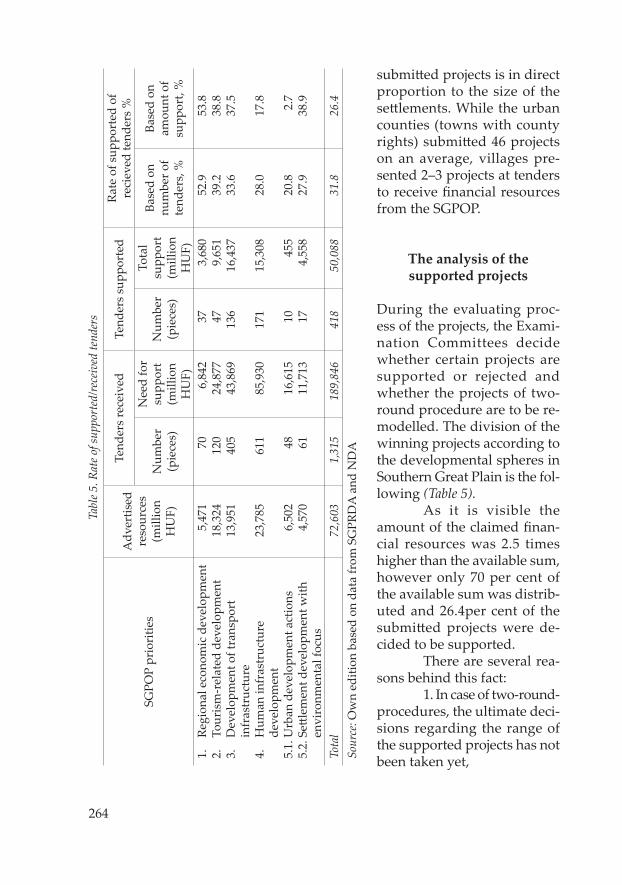
submitt ed projects is in direct proportion to the size of the sett lements. While the urban counties (towns with county rights) submitt ed 46 projects on an average, villages pre-sented 2–3 projects at tenders to receive fi nancial resources from the SGPOP.
The analysis of the supported projects
During the evaluating proc-ess of the projects, the Exami-nation Committees decide whether certain projects are supported or rejected and whether the projects of two-round procedure are to be re-modelled. The division of the winning projects according to the developmental spheres in Southern Great Plain is the fol-lowing (Table 5).
As it is visible the amount of the claimed fi nan-cial resources was 2.5 times higher than the available sum, however only 70 per cent of the available sum was distrib-uted and 26.4per cent of the submitt ed projects were de-cided to be supported.
There are several rea-sons behind this fact:
1. In case of two-round- procedures, the ultimate deci-sions regarding the range of the supported projects has not been taken yet,
Tabl
e 5. R
ate o
f sup
port
ed/re
ceiv
ed te
nder
s
SGPO
P pr
iori
ties
Adv
ertis
ed
reso
urce
s (m
illio
n H
UF)
Tend
ers
rece
ived
Tend
ers
supp
orted
Rate
of s
uppo
rted
of
reci
eved
tend
ers
%
Num
ber
(pie
ces)
Need
for
supp
ort
(mill
ion
HU
F)
Num
ber
(pie
ces)
Tota
l su
ppor
t (m
illio
n H
UF)
Based
on
num
ber o
f te
nder
s, %
Based
on
amou
nt o
f su
ppor
t, %
1.
Reg
iona
l eco
nom
ic d
evel
opm
ent
2.
Tou
rism
-rel
ated
dev
elop
men
t3.
D
evel
opm
ent o
f tra
nspo
rt
in
fras
truc
ture
4.
Hum
an in
fras
truc
ture
d
evel
opm
ent
5.1.
Urb
an d
evel
opm
ent a
ctio
ns5.
2. S
ett le
men
t dev
elop
men
t with
e
nvir
onm
enta
l foc
us
5,47
118
,324
13,9
51
23,7
85
6,50
24,
570
70 120
405
611 48 61
6,84
224
,877
43,8
69
85,9
30
16,6
1511
,713
37 47 136
171 10 17
3,68
09,
651
16,4
37
15,3
08 455
4,55
8
52.9
39.2
33.6
28.0
20.8
27.9
53.8
38.8
37.5
17.8 2.7
38.9
Tota
l72
,603
1,31
518
9,84
641
850
,088
31.8
26.4
Sour
ce: O
wn
editi
on b
ased
on da
ta fr
om S
GPR
DA
and
ND
A

265
2. The submitt ed and professionally acceptable projects (e.g. develop-ing cluster management, creating barrier-free spaces) have not required all the available fi nancial resources,
3. In case of several tender implications, there were no suffi cient fi nan-cial resources to support the professionally correct projects.
Taking into consideration the decisions about the supported projects taken in the fi rst round of the two-round-procedures, the winning projects are going to receive nearly 95 per cent of the available fi nancial resources. (In the areas of human infrastructure and environmental development this percent-age is nearly 100 per cent.)
If the proportion of the supported projects within the submitt ed ones is examined, it can be seen that the projects submitt ed in the fi eld of regional economic development were the most successful. On the one hand every second project submitt ed in this area won, whereas in the fi eld of urban devel-opment only every fi ft h project was supported. On the other hand more than 50 per cent of the available fi nancial resources were distributed between the applicants. The projects submitt ed in the area of urban development proved to be the weakest, as only every fi ft h project won and only 2.7 per cent of the claimed fi nancial resources could be distributed.
Taking into consideration the territorial division of the submitt ed and the supported projects in the region the greatest number of projects and claims for fi nancial support were submitt ed in Bács-Kiskun County. Regarding the number of the supported projects and the amount of fi nancial resources dis-tributed, Csongrád County was the most successful, where more than 37 per cent of the winning projects was submitt ed, which covers 45 per cent of all the distributed amount. If the effi ciency of the two other counties is analysed, it can be concluded that in case of Békés County nearly 30 per cent of the submitt ed projects won, whereas Bács-Kiskun County proved to be the least effi cient. The reason for these relatively low values is due to the unsatisfactory elaboration of their projects.
All the statistical subregions of the Southern Great Plain Region have submitt ed projects, and all of them – although in various proportions – have received some fi nancial support in the fi nancial period of 2007–2008. Szeged statistical subregion was the one that submitt ed the most projects with the highest amount of claimed fi nancial resources. When taking into consideration the ratio of the supported projects and the received fi nancial support it is again Szeged statistical subregion that has proven to be the absolute winner. The statistical subregion of Kistelek achieved the highest fi nancial aid per capita, with more than 138,000 HUF (Figure 2).
Analysing the distribution of the submitt ed and the supported projects by type of sett lements, it can be concluded that projects were submitt ed at all the types The sett lements received fi nancial aid in various percentages, but nearly

266
Fig.
2. S
uppo
rt n
eeds
per
cap
ita in
the
stat
istic
al su
breg
ions
of S
outh
ern
Gre
at P
lain
. Sou
rce:
Dat
a co
llect
ed b
y Va
jda,
G.,
map
des
ign:
Nóg
rádi
, Gy.

267
in direct proportion with the number of projects they had submitt ed. In the fi -nancial period of 2007–2008 most of the projects (597 items) were submitt ed by villages with the highest claim for fi nan-cial resources (29.5 per cent). This type of sett lement was the winner when tak-ing into consideration the number of the supported projects and the amount of the distributed fi nancial aid (Table 6).
Regarding the number of the submitted projects, the towns with less than 10,000 inhabitants were the second most active type of sett lements (235 items). Regarding the claims for fi nancial resources and the amount of the distributed aid, the same position is taken by the towns with population number between 10,000 and 30,000.
When the amount of the distrib-uted aid was compared to the amount of the claimed fi nancial support, the towns with less than 10,000 inhabitants have proven to be the most successful, since 37.9 per cent of the projects sub-mitt ed by them won support. Urban counties were also successful, as 33.3 per cent of their projects were also supported. Taking into consideration the amount of the distributed fi nancial aid, the villages and the towns with in-habitants between 10,000 and 30,000 were followed by the urban counties. Regarding the number of the winning projects and of the amount of the dis-tributed financial aid, the category ranked last were the towns with more than 30,000 inhabitants. These towns submitt ed the least projects selected to be supported and the smallest amount of fi nancial aid was also received by this type of sett lements.
Tabl
e 6. S
uppo
rted
tend
ers a
ccor
ding
to sett l
emen
t typ
es
Sett l
emen
t cat
egor
ies
(res
iden
t pop
ulat
ion)
Tend
ers
rece
ived
Tend
ers
supp
orted
Rate
of s
uppo
rted
of
reci
eved
tend
ers
%
Num
ber
(pie
ces)
need
for
supp
ort
(mill
ion
HU
F)
Num
ber
(pie
ces)
Tota
l su
ppor
t (m
illio
n H
UF)
Based
on
num
ber o
f te
nder
s, %
Based
on
amou
nt o
f su
ppor
t, %
Cou
nty
Tow
nPo
pulo
us c
ity o
f 30.
000
inha
bita
nts
Tow
ns w
ith p
opul
atio
n be
twee
n 10
.000
and
30.
000
Tow
ns w
ith p
opul
atio
n of
10.
000
inha
bita
nts
Mun
icip
aliti
es
183 85 215
235
597
32,6
8721
,361
43,6
4836
,198
55,9
51
61 24 69 89 175
11,2
033,
893
11,6
859,
992
13,3
16
33.3
328
.24
32.0
937
.87
29.3
1
34.2
718
.23
26.7
727
.60
23.8
0To
tal
1,31
518
9,84
641
850
,088
31.7
926
.38
Sour
ce: O
wn
editi
on b
ased
on da
ta fr
om S
GPR
DA
and
ND
A

268
Summary
To balance spatial concentration and promote territorial equalisation, poly-centric development has to become of primary importance in the future. When future project tenders are invited, eff ective measures are needed to be taken to embed the region-specifi c elements into both the determination process of the supportable activities and the establishment of the criteria for the evaluating system. For example, it would be reasonable to give preference to the projects submitt ed in inner or outer peripheries by giving them extra bonus; or to defi -nitely separate the innovation-type development of economic centres and the balance-type development that aims to moderate the spatial concentration.
As to facilitate the preparation works of the following periods, the implementation of the Southern Great Plain’s Operational Program has to be continuously monitored and recommendations are needed to be produced based on the evaluation of fi nancial and professional advancement. The con-tent of the future project tenders has to be adjusted to the economic processes (crisis-management, more eff ective utilisation of the external sources).
The success of territorial development is signalled by emerging and strengthening of centres, by stabilisation and improvement of disadvantageous statistical subregions. In my opinion the evaluations of the developmental pro-grams and regional developments are not to be regarded as mere evaluating reports. They aim is to identify the eff ects of interventions and also to – by pro-viding feedback – help to establish a basis for future development. For decision making persons evaluating reports have to become an instrument that helps to understand the processes of interventions and the causes of the changes that take place. By taking all these into consideration, decision making persons need to make recommendations as to foster the elaboration of regional policy. In my view the necessity of the evaluations of development is obvious; however, fur-ther steps are needed to be taken as to put the gained results into practice.
REFERENCES
Boldrin, M. and Canova, F. 2001. Inequality and Convergence in Europe’s Region Reconsidering European Regional Policies. Economy Policy, 3. 205–253.
Buček, J. 2005. The Role of Local Government in Local Economic Development. Slovakia. – In Local Government and Economic Development. Ed. Čapkova, S. Budapest, Open Society Institute, 107–133.
Capellin, R. 1997. Federalism and the Network paradigm: guidelines for a new approach in national regional policy. In: Regional Governance and Economic Development. Eds. Danson, M. et al., London, Pion, 47–67.
Csatári, B. 2002. Az új európai területfejlesztési perspektíva lehetséges adaptációja az Alföldre. Területfejlesztés, rendszerváltás és az Alföld. Magyarország az ezredfordulón.

269
Stratégiai tanulmányok a Magyar Tudományos Akadémián. Budapest, MTA, 186–203.
ESPON 2006. Espon 2.3.2.: Governance of territorial and urban policies from EU to local level. 2006. május htt p://www.espon.eu/mmp/online/website/content/projects/243/374/fi le_2186/draft _fr-2.3.2-full.pdf – 2006.10.18.
Faragó, L. 2000. Területi tervezés az Európai Integráció tükrében. In A régiók szerepe a bővülő Európai Unióban. Szerk. Horváth, Gy. Pécs, MTA RKK, 149–163.
Forman, B. 2001. Az Európai Unió strukturális és előcsatlakozási alapjai. Budapest, Európai Bizott ság Magyarországi Delegációja.
Hamedinger, A.–Bartik, H. and Wolffhardt, A. 2008. The Impact of EU Area-based ProgrammePrograms on Local Governance: Towards a ‘Europeanisation’? Urban Studies 45. (13): 2669–2687.
Horváth, Gy. 2001. Regionális támogatások az Európai Unióban. Budapest, Osiris Kiadó.Horváth, Gy. 2009. Regionális egyenlőtlenségek Európában. In A regionális tudomány két
évtizede Magyarországon. Szerk: Lengyel, I. and Rechnitzer, J. Budapest, Akadémiai Kiadó, 173–193.
Hrubi, L. 2000. A régiók szerepének felértékelődése a magyar területi struktúrában. In A régiók szerepe a bővülő Európai Unióban. Szerk. Horváth, Gy. Pécs, MTA RKK., 139–148.
Józsa, Z. 2006. Önkormányzati szervezet, funkció, modernizáció. Budapest–Pécs, Dialóg Campus Kiadó.
Kis, K. 2008. A Hódmezővásárhelyi kistérség humán erőforrásainak hierarchia-rendszerű vizsgálata. Agrártudományi Közlemények. 29. 91–110.
Kovács, Z. 1999. Alföldi nagyvárosok társadalmi térszerkezetének vizsgálata. Alföldi Ttanulmányok, 16. 52–71.
Mezei, C. 2006. Helyi gazdaság-fejlesztés Közép-Kelet-Európában. Tér és Társadalom, 20. (3): 95–108.
Michalski, A. and Saraceno, E. 2000. Regions in Enlarged in the Enlarged European Union. Brussels, EC Forward Studies Unit.
Nemes Nagy, J. 2009. Terek, helyek, régiók. Budapest, Akadémiai Kiadó.Pálné Kovács, I. 2003. A területfejlesztés irányítása. PTE KTK Regionális Politika és
Gazdaságtan Doktori Iskola. Habilitációs előadások sorozata. Pécs, PTE KTK.Petkevicius, A. and Linertas, R. 2005. The Role of Local Government in Local Economic
Development. Lithuania. In Local Government and Economic Development. Ed. Čapkova, S. Budapest, Open Society Institute, 47–64.
Probáld, F. and Szabó, P. 2007. Európa regionális földrajza. Társadalomföldrajz. Budapest, ELTE Eötvös Kiadó, 33–53.
Puga, D. 2002. European regional policies in light of recent location theories. Journal of Economic Geography, 2. 373–406.
Somlyódiné Pfeil, E. 2004. A gazdaságfejlesztés megjelenési formái a területfejlesztési régiók szintjén. In: Versenyképesség és igazgatás. Szerk. Pálné Kovács, I. Pécs, MTA RKK. 141–160.
Stöhr, W. and Tödling, F. 1977. Spatial Equity – Some Anti-Thesis to Current Regional Development Strategy. Papers of the RSA, 38. 33–54.
Swianiewicz, P. 2006. Local taxes in Poland – A Base for Local Accountability? In Local Government Financial Capacity Building in Transition Countries. Selected Country Studies. Ed. Šević, Ž. Bratislava, NISPAcee, 180–201.
Young, C. and Kaczmarek, S. 2000. Local government, local economic development and quality of life in Poland. GeoJournal, 2–3. 225–234.

270
Károly Kocsis (ed.): South Eastern Europe in Maps
2nd, Revised and Expanded Edition
Geographical Research Institute Hungarian Academy of Sciences. Budapest, 2007. 136 p.
Over the past fi ft een years the explosion of the “Balkan powder-barrel” shock-ing the European continent deeply i.e. the fanning of ethnic-religious tensions (suppressed for several decades) into regional confl icts and warfare renewed traditional interests of the Hungarian public towards the countries of South Eastern Europe (the former member republics of Yugoslavia, Albania, Bulgaria and Romania).
There has emerged a necessity to publish an atlas in the form of a book or a book combined with an atlas in which a large number of att ractive thematic (political, ethnic, religious, economic) maps, charts, tables completed by concise textual analyses provide explanation for the up-to-date societal and economic issues of South Eastern Europe and the most characteristic seg-ments of the region’s development in the 20th century. The present publication produced in the Geographical Research Institute of the Hungarian Academy
of Sciences serves as a brief account for public and scientific audiences and political decision makers on the region which largely belongs to the Balkans, with some countries as the primary targets of the enlargement of the European Union. The chapters are entitled by the main topics fi gur-ing in the book: the concept of South Eastern Europe and the Balkans; ter-ritorial distribution by states; ethnic and religious patt erns; urbanisation and town network; the standard of economic development; spatial dis-parities; industry; transport; and tourism.------------------------------------------Price: HUF 3,000 (EUR 12.00)Order: Geographical Research Institute HAS Library H-1388 Budapest, POB. 64. E-mail: [email protected]