experiences consumers’ perceptions of online ad An …€¦ · · 2018-02-19For this reason, in...
32
Presented by An experimental methodology to measure consumers’ perceptions of online ad experiences Ad Experience Research Group April 2016 Table of Contents: Abstract Introduction Methodological approach The Survey Tool Overall Experience Ratings Ad Experience Ratings Survey Scales Experimental Methodology and Survey Validation Study Participants Single-Ad Experiments Material For all experiments we present in this paper, we used a similar set of articles sourced from a high-quality publisher, and professionally-designed ad creatives. Ad Creatives Article reading task Overall experience and ad-specific questions Results and Discussion Differences in overall experience Differences in Ad Specific Ratings Multiple-Ad Experiments Experimental Design Material Comprehension, overall experience, and ad-specific questions Final Ranking Survey 1 © 2017 Coalition for Better Ads
Transcript of experiences consumers’ perceptions of online ad An …€¦ · · 2018-02-19For this reason, in...

Presented by
An experimental methodology to measure consumers’ perceptions of online ad experiences Ad Experience Research Group April 2016
Table of Contents:
Abstract
Introduction
Methodological approach
The Survey Tool Overall Experience Ratings Ad Experience Ratings Survey Scales
Experimental Methodology and Survey Validation Study Participants Single-Ad Experiments Material For all experiments we present in this paper, we used a similar set of articles sourced from a high-quality publisher, and professionally-designed ad creatives. Ad Creatives Article reading task
Overall experience and ad-specific questions Results and Discussion Differences in overall experience Differences in Ad Specific Ratings
Multiple-Ad Experiments Experimental Design Material Comprehension, overall experience, and ad-specific questions Final Ranking Survey
1 © 2017 Coalition for Better Ads
Results and Discussion Differences in overall satisfaction Differences in annoyance and distraction Other findings for ad-specific dimensions Ad Experience Ranking
Conclusion
Next Steps
References
Appendix The survey instrument Demographic Questions Overall Experience Questions Ad-specific questions Ad Ranking Exercise
Abstract
Good ad experiences power an open and accessible web, where interested users can access diverse content regardless of their individual ability to pay. Bad ad experiences - those that annoy or attempt to take advantage of users- threaten this ecosystem by disrupting this relationship between users, content creators, and brands. We hypothesize that users are not annoyed by all ads, but by ad experiences that have specific attributes. To test our hypothesis, we developed a general methodology that evaluates how people react to different kinds of ad experiences. The results can help creators and brands make informed choices about the type of ads they show to users. It includes a scalable infrastructure that leverages large groups of users to rate ads in randomized and unbiased trials that mimic real-life web experiences. Users are asked a combination of ad experience-specific rating questions and ad preference questions to add robustness. We tested three ad types to validate that the methodology is able to detect differences between varied ad experiences on mobile devices: sticky ads (ads that “stick” to the bottom of the screen), inline animated ads (ads placed between paragraphs of an article that animate, as opposed to flashing), and pop-up ads with countdowns (ads that obscure the content and require the user to wait before closing them). This methodology found strong differences between tested ad experiences on measures of user satisfaction, annoyance, and distraction. Mobile sticky ads (320x50 pixels) were the most
2
preferred (and least annoying/distracting), animated ads were less preferred, and pop-up ads with countdowns were the least preferred (and by far the most annoying/distracting). Further work will concentrate on rating, ranking, and understanding user attitudes across a larger corpus of ad experiences.
Introduction
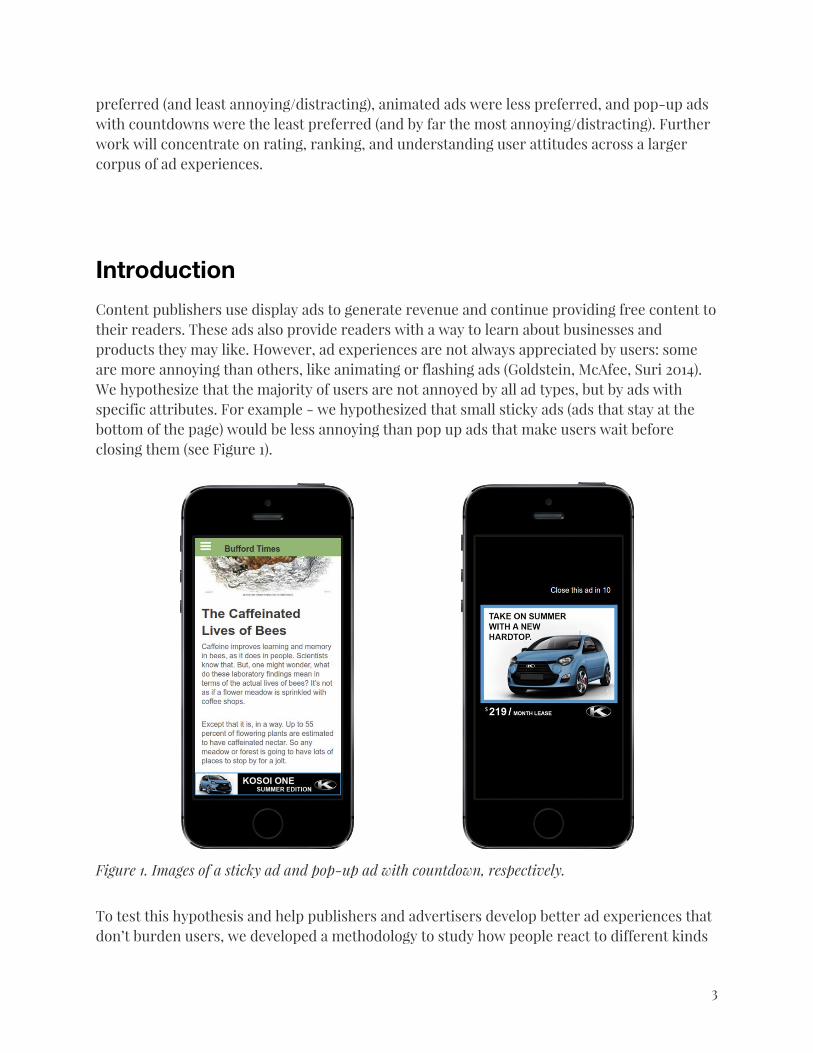
Content publishers use display ads to generate revenue and continue providing free content to their readers. These ads also provide readers with a way to learn about businesses and products they may like. However, ad experiences are not always appreciated by users: some are more annoying than others, like animating or flashing ads (Goldstein, McAfee, Suri 2014). We hypothesize that the majority of users are not annoyed by all ad types, but by ads with specific attributes. For example - we hypothesized that small sticky ads (ads that stay at the bottom of the page) would be less annoying than pop up ads that make users wait before closing them (see Figure 1).
Figure 1. Images of a sticky ad and pop-up ad with countdown, respectively.
To test this hypothesis and help publishers and advertisers develop better ad experiences that don’t burden users, we developed a methodology to study how people react to different kinds
3

of ad experiences. It has been applied to display ads on mobile websites, but is also applicable to display ads on other devices. First, this paper explains the methodology and experimental setup we designed to test ad experiences. Second, it goes over initial results from the experiment: three ad experiences and how the methodology was able to rate them. Finally, the paper goes over the next steps for this methodology: what it would take for it to generate results for additional ad experiences.
Methodological approach
The experimental methodology we developed is based on two principles: adopting the user’s perspective and measuring ads in context. Adopting the user’s perspective. We started by understanding what factors affect people’s online experience and what aspects of online ads impact them, and then measured the relative impact that those factors have on the whole experience. Measuring ads in context. Online ads are not shown in isolation. They are embedded in content sites that users visit with a goal in mind and they are often shown together with a variety of ad types (e.g., a video ad playing among text content may have a different impact than a video ad playing before some video content). For this reason, in this paper we talk about “ad experiences” rather than “ads.” By “ad experience” we mean the combination of site layout and behavior, content, and the ads that users are exposed to. In this study, we selected content from a publisher with high-quality content (with multiple Pulitzer Prizes) and with a top 50 global readership. This methodology allows us to measure the impact of a specific ad format and look at complex, page-level qualities that shape the user experience, such as high density of ads on a web page, long load times, or ads forcing the page to reformat when they load. Finally, during the experiment participants are engaged in a task (e.g., reading an article) rather than just being asked to view and rate ads on the page. The methodology we present here aims at being rigorous, comprehensive, extensible, and replicable.
● By rigorous, we mean a methodology that can help us understand ad experiences by controlling for extraneous factors and using appropriate control conditions and counterbalancing procedures.
● Our methodology is comprehensive—able to measure a broad array of current web ad experiences on desktops and mobile devices—and extensible— able to measure ad experiences as they continue to evolve and as new innovations are developed. We aim to investigate regional and linguistic differences, as well as other forms of content.
● To make our experiments replicable, we used tools readily available to other
4
researchers. We wanted to develop a framework that could be used by others in the industry to repeat or add to the body of information.
A crucial component of our paradigm is a survey tool we developed to measure ad experiences. In the next sections, we describe the survey and discuss a series of pilot experiments we conducted to refine the survey and validate its ability to measure the impact of ads on the user experience.
The Survey Tool
To measure the influence of ads on the quality of online users’ experience, we created a survey tool based on the findings of three years of internal research on user perception of online ads. We wanted the survey to:
● Measure, with good sensitivity, the impact of ads experiences on the quality of the user experience, as compared to a condition without ads
● Discriminate between good, neutral, and bad ad experiences ● Provide information about what aspect of the ad impacted the quality of the experience ● Be effective for both desktop and mobile web experiences ● Be easy to use and to share with other researchers
To achieve those goals we created a 10-question survey divided in two sections. The first section focused on evaluating the entire web page, while the second focused on rating the ads. Each survey section includes one higher-level dimension—“satisfaction,” for the overall experience, and “annoyance,” for the ad-specific experience—and a series of questions rating specific aspects of the web page and the ads. An initial version of the survey was first validated in eight in-person interviews that looked at comprehension and interpretation of the survey questions. Using a cognitive pretesting methodology (Krosnick, 1999), we asked participants to read an article with an ad on a mobile device, then fill out the survey on paper while thinking aloud. We recorded confusion, surprise, and unexpected interpretation of the questions. The findings showed that participants understood most of the questions and consistently interpreted them. Questions that were difficult to understand or confusing were reworded or dropped from the survey. Finally, variations of the survey were tested in pilot experiments and further refined (the complete survey can be found in the Appendix).
Overall Experience Ratings We wanted to capture three aspects of the overall online experience that preliminary research
5
identified as important for users: ● overall quality of the web page experience ● predictable behavior ● perceived performance of the page
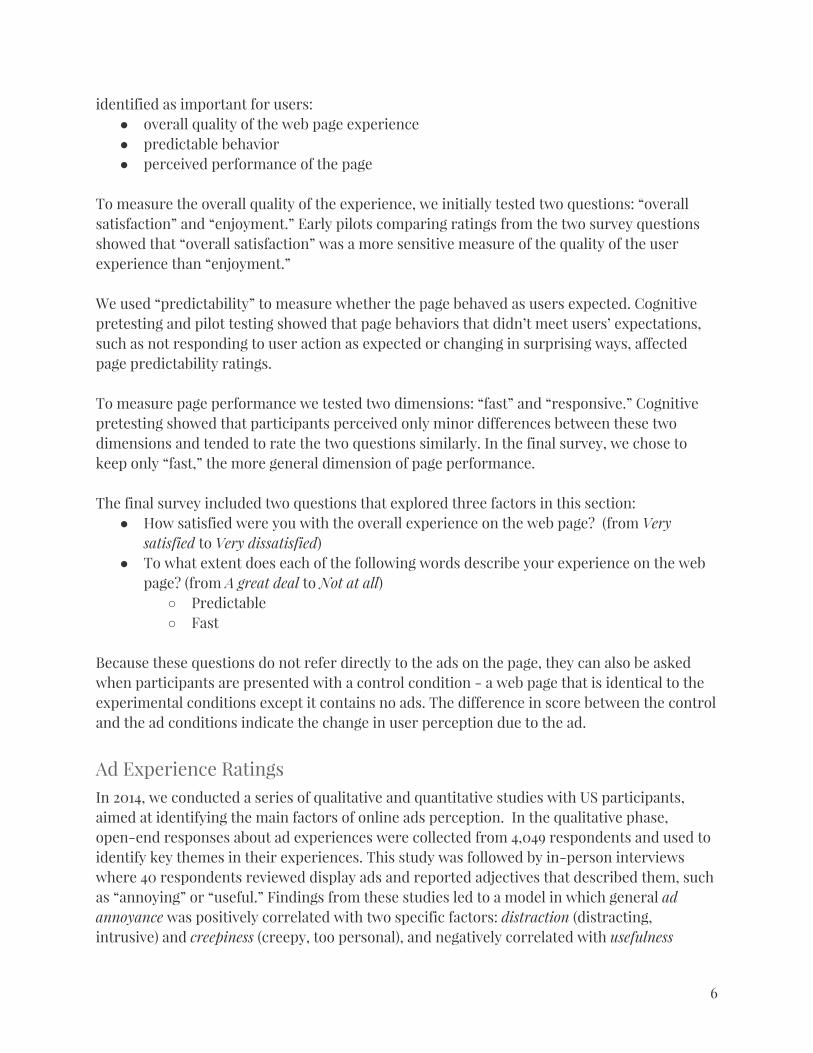
To measure the overall quality of the experience, we initially tested two questions: “overall satisfaction” and “enjoyment.” Early pilots comparing ratings from the two survey questions showed that “overall satisfaction” was a more sensitive measure of the quality of the user experience than “enjoyment.” We used “predictability” to measure whether the page behaved as users expected. Cognitive pretesting and pilot testing showed that page behaviors that didn’t meet users’ expectations, such as not responding to user action as expected or changing in surprising ways, affected page predictability ratings. To measure page performance we tested two dimensions: “fast” and “responsive.” Cognitive pretesting showed that participants perceived only minor differences between these two dimensions and tended to rate the two questions similarly. In the final survey, we chose to keep only “fast,” the more general dimension of page performance. The final survey included two questions that explored three factors in this section:
● How satisfied were you with the overall experience on the web page? (from Very satisfied to Very dissatisfied)
● To what extent does each of the following words describe your experience on the web page? (from A great deal to Not at all)
○ Predictable ○ Fast
Because these questions do not refer directly to the ads on the page, they can also be asked when participants are presented with a control condition - a web page that is identical to the experimental conditions except it contains no ads. The difference in score between the control and the ad conditions indicate the change in user perception due to the ad.
Ad Experience Ratings In 2014, we conducted a series of qualitative and quantitative studies with US participants, aimed at identifying the main factors of online ads perception. In the qualitative phase, open-end responses about ad experiences were collected from 4,049 respondents and used to identify key themes in their experiences. This study was followed by in-person interviews where 40 respondents reviewed display ads and reported adjectives that described them, such as “annoying” or “useful.” Findings from these studies led to a model in which general ad annoyance was positively correlated with two specific factors: distraction (distracting, intrusive) and creepiness (creepy, too personal), and negatively correlated with usefulness
6
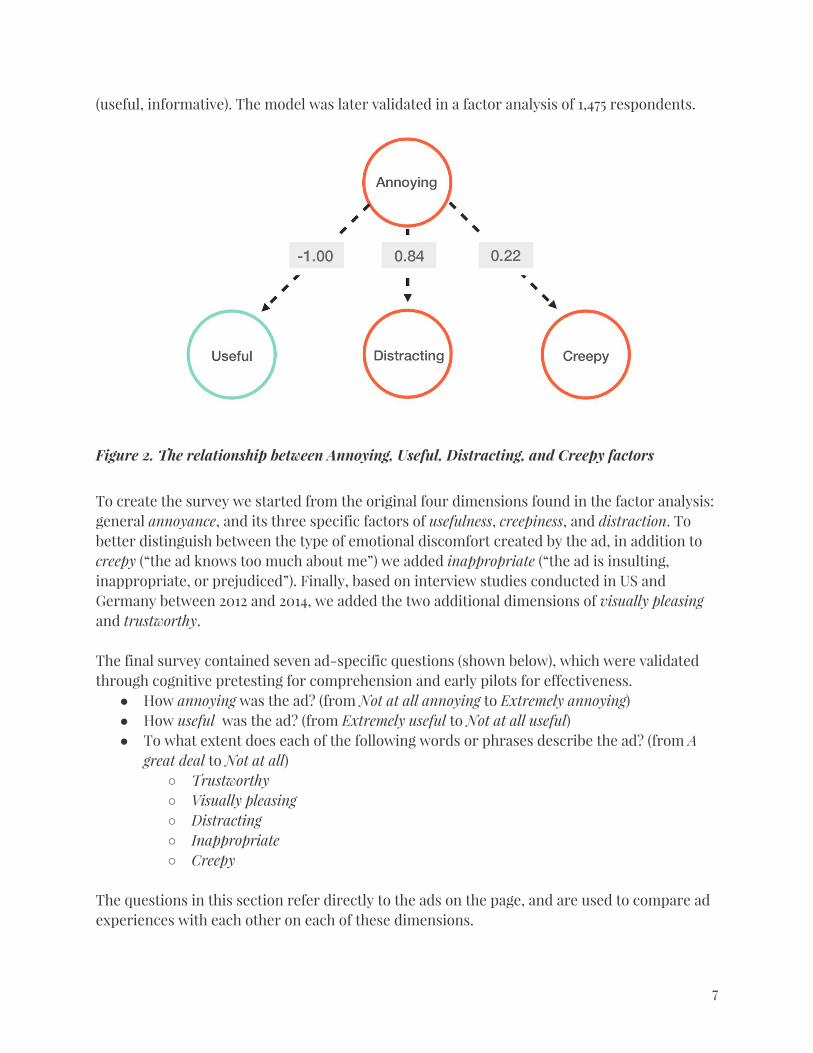
(useful, informative). The model was later validated in a factor analysis of 1,475 respondents.
Figure 2. The relationship between Annoying, Useful, Distracting, and Creepy factors
To create the survey we started from the original four dimensions found in the factor analysis: general annoyance, and its three specific factors of usefulness, creepiness, and distraction. To better distinguish between the type of emotional discomfort created by the ad, in addition to creepy (“the ad knows too much about me”) we added inappropriate (“the ad is insulting, inappropriate, or prejudiced”). Finally, based on interview studies conducted in US and Germany between 2012 and 2014, we added the two additional dimensions of visually pleasing and trustworthy. The final survey contained seven ad-specific questions (shown below), which were validated through cognitive pretesting for comprehension and early pilots for effectiveness.
● How annoying was the ad? (from Not at all annoying to Extremely annoying) ● How useful was the ad? (from Extremely useful to Not at all useful) ● To what extent does each of the following words or phrases describe the ad? (from A great deal to Not at all)
○ Trustworthy ○ Visually pleasing ○ Distracting ○ Inappropriate ○ Creepy
The questions in this section refer directly to the ads on the page, and are used to compare ad experiences with each other on each of these dimensions.
7
In addition to the main survey questions, we used a set of demographic questions (age, gender, employment status, and annual household income) and one question asking about participants’ attitude towards online ads. Previous research suggests that people’s attitude towards online ads impact their evaluation of the quality of ad experiences. Those questions were asked at the beginning of the experiment.
Survey Scales We used unipolar, 5-point, fully labeled scales for all questions, except for satisfaction, which uses a bipolar scale. Unipolar constructs go from a null point to a very high point, while bipolar constructs have a mid point and two extremes. For example, usefulness is a unipolar construct, because “negative utility” is meaningless. Satisfaction, on the other hand, is a bipolar construct; it has a valid midpoint (“neither satisfied or dissatisfied”) and opposite extremes (dissatisfaction and satisfaction). The selection of unipolar and bipolar scales is based on surveys best practices (Krosnick, 1999). We used fully labeled, vertical 5-point text scales to measure each unipolar construct, with each scale point spaced at equidistant intervals (Rohrmann, 2007). Fully labeled text scales result in higher reliability and greater respondent satisfaction than scales with endpoint labels only (Krosnick and Presser, 2010). We omitted numbers from the scale labels, since they create an unnecessary item for participants to evaluate (Callegaro, Murakami, and Henderson, 2015). The 5-point text scales were presented as a vertical list, ordered from positive (at the top) to negative (at the bottom), since respondents expect positive things first, at least in Western cultures. This ordering decreases cognitive burden (Holbrook, Krosnick, Carson, & Mitchell, 2000; Tourangeau, Couper, & Conrad, 2013; Callegaro, Lozar-Manfreda & Vehovar, 2015, p. 73), and reduces response time for respondents (Tourangeau, Couper, & Conrad, 2013). We also used vertical scales for practical reasons; in this study, participants could only take the survey on a mobile device, and mobile phone screens have a limited horizontal real estate. Our bipolar construct, satisfaction, used a scale that followed similar principles about text labeling and positive-to-negative ordering. In addition, we chose a 5-point, instead of a 7-point satisfaction scale, because internal experiments conducted in 2014 suggest it is easier for participants to cognitively process, without reducing sensitivity.
Experimental Methodology and Survey Validation
As we were developing our experimental methodology, we went through several iterations. First, we selected three ad formats that we expected to be rated differently by participants (based on a subjective evaluation): sticky ads that stuck to the bottom of the page, animated image ads inlined into the page, and pop-up ads. We used these three ad experiences plus a control condition – a web page that was identical to the experimental conditions except it
8
contained no ads – to validate the sensitivity of the survey in a simple between-subjects experiment in which each participant rated a single experience (Single-ad experimental paradigm). We then focused on improving the experimental design to maximize efficiency and statistical power and to provide us with ad ranking information through a more complex within-subject design in which each participant rated all three ad experiences and a no-ad control (the Multiple-ad experimental paradigm).
Study Participants For the experiments described in this paper, we recruited 3,158 US participants using Amazon’s Mechanical Turk. We chose Mechanical Turk because it allowed us to run studies quickly; its cost-effectiveness meant we could run iterative versions of the methodology and correct any issues. 2,599 participants completed our single-ad study, and 559 completed the three initial pilot rounds of our multi-ad study. Only participants who completed the study were used in the analyses. For the multi-ad studies, we excluded participants who took more than 40 minutes or less than 7 minutes to complete the study. Based on this criteria, we removed 5% of our participants. Median completion time for the remaining participants was 15 minutes. On Mechanical Turk, workers sign in to the tool to see a list of tasks they can choose to complete along with the title of each task, the amount of money that each task pays, and an estimate of the time that each task requires. We paid workers $1.51 for the single-ad study, and $4.32 for the multi-ad study. To make sure that our results were not skewed by Mechanical Turk’s population, we ran a set of smaller studies on a representative sample of US internet-users. Those studies’ results aligned with the results from the Mechanical Turk studies.
Single-Ad Experiments To test the survey tool described in the previous section, we conducted a series of experiments in which we presented participants with a single web page to read on a mobile device. Each participant saw either a control web page or one of three ad conditions. After reading the article, participants answered a comprehension question, then filled out the survey we presented in the previous section. Differences in survey ratings were analyzed in a between-subjects design. The articles were all news and interest articles sourced from the same high-quality publisher with global readership. High-quality contextually-relevant images were sourced with proper licensing, Ads were created by designers conforming to style guides of imaginary brands created for this experiment. The articles and images, along with some navigational elements and the ads (or lack thereof) were combined into a page for a fictional publisher with its own
9
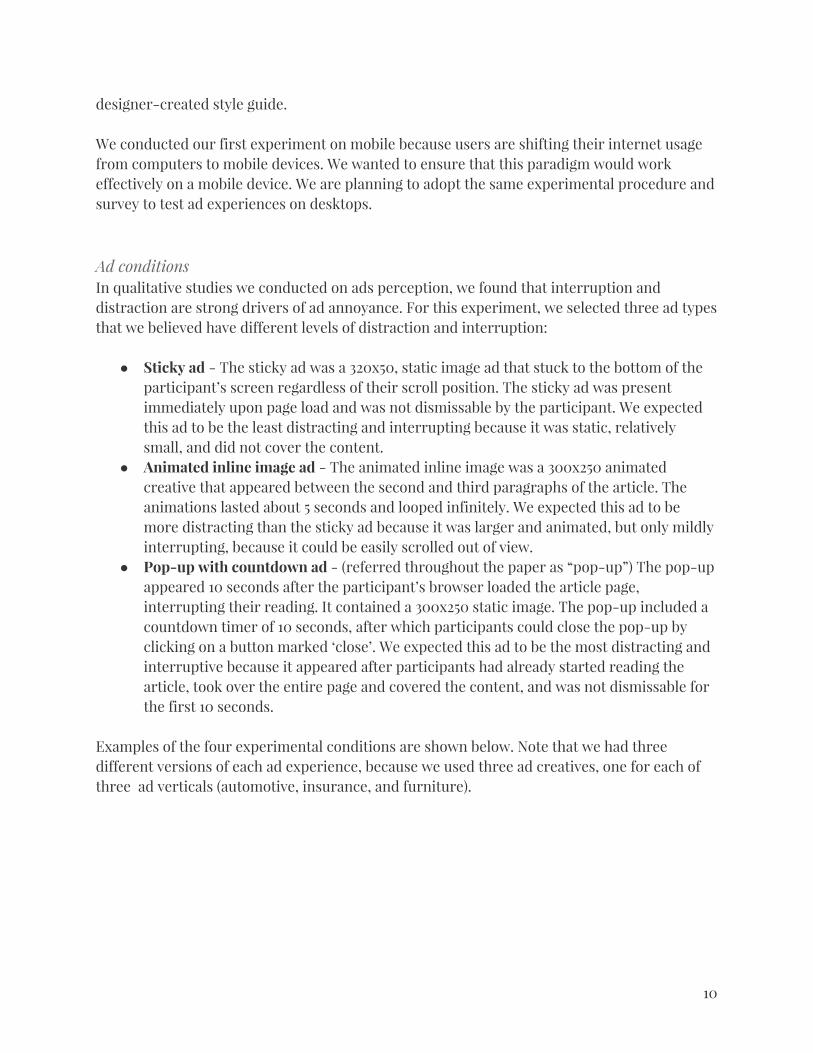
designer-created style guide. We conducted our first experiment on mobile because users are shifting their internet usage from computers to mobile devices. We wanted to ensure that this paradigm would work effectively on a mobile device. We are planning to adopt the same experimental procedure and survey to test ad experiences on desktops. Ad conditions In qualitative studies we conducted on ads perception, we found that interruption and distraction are strong drivers of ad annoyance. For this experiment, we selected three ad types that we believed have different levels of distraction and interruption:
● Sticky ad - The sticky ad was a 320x50, static image ad that stuck to the bottom of the participant’s screen regardless of their scroll position. The sticky ad was present immediately upon page load and was not dismissable by the participant. We expected this ad to be the least distracting and interrupting because it was static, relatively small, and did not cover the content.
● Animated inline image ad - The animated inline image was a 300x250 animated creative that appeared between the second and third paragraphs of the article. The animations lasted about 5 seconds and looped infinitely. We expected this ad to be more distracting than the sticky ad because it was larger and animated, but only mildly interrupting, because it could be easily scrolled out of view.
● Pop-up with countdown ad - (referred throughout the paper as “pop-up”) The pop-up appeared 10 seconds after the participant’s browser loaded the article page, interrupting their reading. It contained a 300x250 static image. The pop-up included a countdown timer of 10 seconds, after which participants could close the pop-up by clicking on a button marked ‘close’. We expected this ad to be the most distracting and interruptive because it appeared after participants had already started reading the article, took over the entire page and covered the content, and was not dismissable for the first 10 seconds.
Examples of the four experimental conditions are shown below. Note that we had three different versions of each ad experience, because we used three ad creatives, one for each of three ad verticals (automotive, insurance, and furniture).
10
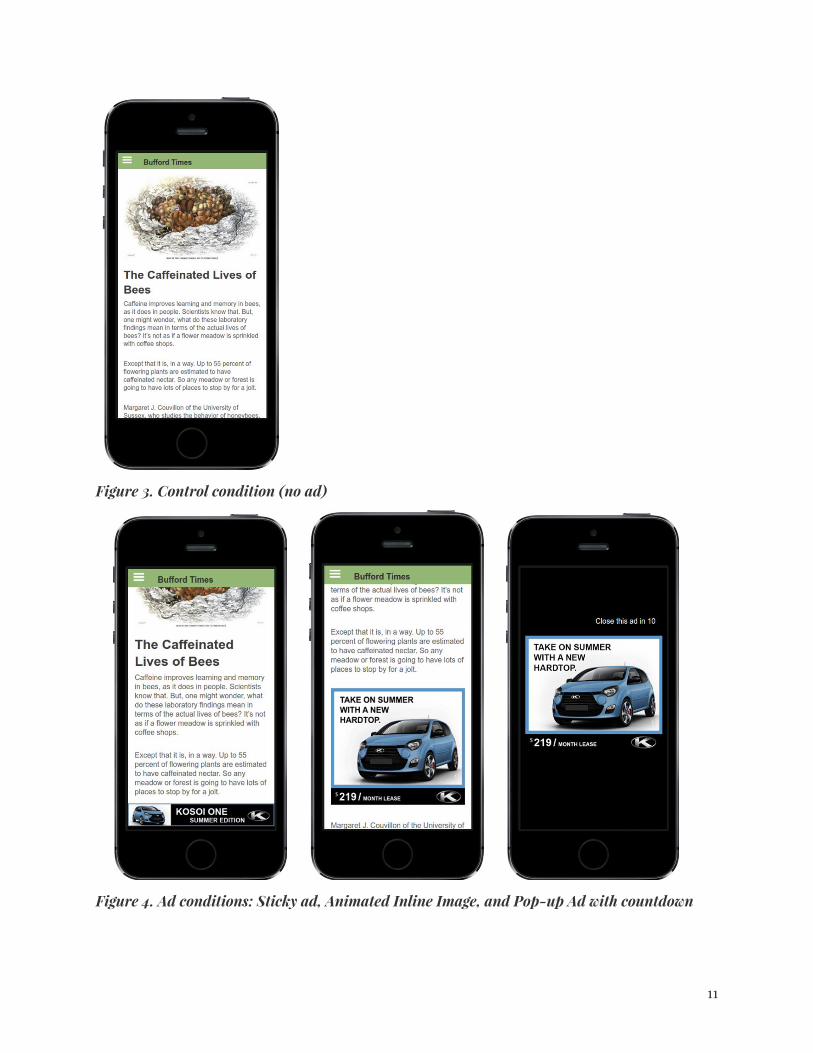
Figure 3. Control condition (no ad)
Figure 4. Ad conditions: Sticky ad, Animated Inline Image, and Pop-up Ad with countdown
11

Material For all experiments we present in this paper, we used a similar set of articles sourced from a high-quality publisher, and professionally-designed ad creatives.
Ad Creatives We created three ad creative concepts, using fictional automotive, furniture, and insurance brands. We designed the creatives to look professional and have a medium-high level of visual polish. We designed three variations for each creative concept, to fit the three ad experiences tested in the experiment (see Figure 4). The pairing of creatives and ad experiences was fully counterbalanced across participants. This ensured that ratings and rankings of ad experience could not be attributed to a specific ad creative.
Figure 5. Examples of the three ad creatives run in the single and multi-ad experiments
Article reading task Participants were asked to read an article and then to answer a comprehension question. We used a reading task because we wanted participants to see the ad while engaged in a typical online activity. Each article was around 400 words and approximately 13-14 year old reading level. The pairing between article and experimental condition was fully counterbalanced across participants. To help identify those who may not have put effort into the reading task, we asked participants a multiple choice recall question after each article. In this question, participants selected the sentence that appeared in the article from a list of five sentences. The choices were differentiated enough such that participants should have been able to select the correct answer without having to read an article multiple times. The majority of participants answered this correctly which suggested they paid attention to the task. We did not filter participants based on this question.
12

Overall experience and ad-specific questions
Participants who saw the control only answered the overall experience questions (satisfaction, page speed, and predictability). Ratings of the control served as a baseline against which to compare the ad conditions. Participants who saw one of the ad conditions answered the overall experience questions, followed by the ad-specific questions (annoying, useful, trustworthy, visually pleasing, distracting, inappropriate, and creepy).
Results and Discussion
We expected that the three ad experiences we selected (sticky ads, animated inline ads, and pop-up ads) would show differences in survey ratings, for both overall experience and ad-specific ratings. We expected differences in the main outcome measures (satisfaction and annoyance) but also in some of the other dimensions. For example, we expected that pop-ups would decrease the “predictability” of the page and be more annoying and distracting, and that animated inline ads would be rated more distracting than sticky ads. We also expected that some variables would not show significant differences. For example, because we counterbalanced the ad creative across conditions, we didn’t expect “visually pleasing” to differ significantly across conditions. To test for statistically significant differences between the overall experience ratings in the four experimental conditions (control, sticky ads, animated ads, pop-up ads), we used a pairwise t-test with 0.95 significance level. In consideration of the potentially non-linear spread of the numeric ratings, we also tested using Chi-square tests and reached similar findings. For each of the ad-specific ratings collected from one of three ad groups (sticky, animated, and pop-up ads), similar groups of statistical tests were implemented.
Differences in overall experience The results show significant differences in satisfaction scores across conditions. Participants rated the content without ads - the control - as more satisfying than any of the ad experiences, and web pages with pop-up ads significantly less satisfying than other conditions (all statistically significant). Sticky and Animated ad satisfaction ratings did not differ significantly.
13

Figure 6. Satisfaction scores for the four experimental conditions in the single-ad experiment.
Average Scores Control Sticky Ads Animated Ads Pop-up Ads
Satisfaction 4.69 4.57 4.56 4.40
Table 1: Average satisfaction scores for each condition in the single-ad experiment.
We also found that content without ads was rated as more predictable than any of the ad experiences and that web pages with pop-up ads were rated as slower than any other pages. The results suggest that these measures can discriminate between a control, ad experiences with a moderate impairment of the overall experience (sticky ads and animated inline), and experiences with a greater impairment of the overall experience (pop-ups)
Differences in Ad Specific Ratings Both annoyance and distraction measures showed significant differences between all ad experiences: Pop-up ads were rated as most annoying and distracting, followed by animated inline, while sticky ads were rated the least annoying and distracting of the ad experiences. Pop-up ads were also rated as less useful than animated and sticky ads.
14

Figure 7. Annoyance scores for the three ad experiences in the single-ad experiment.
Average Scores Control Sticky Ads Animated Ads Pop-up Ads
Annoying N/A 1.70 2.44 3.39
Table 2: Average annoyance scores for each ad experience in the single-ad experiment
15

Figure 8. Distraction scores for the three ad experiences in the single-ad experiment.
Average Scores Control Sticky Ads Animated Ads Pop-up Ads
Distracting N/A 1.86 2.80 3.62
Table 3: Average distraction scores for each ad experience in the single-ad experiment Trustworthy, creepy, and inappropriate showed a similar pattern: pop-ups and animated ads did not differ from each other but were significantly worse than sticky ads (less trustworthy and more creepy and inappropriate). Finally, as predicted, there was no significant difference in “visually pleasing” rating across the ad conditions.
16

Measure Experimental Conditions Comparisons
Overall Experience measures (page-level) The carat “>” is shorthand for “a statistically significant higher rating in that measure” (for example, “more annoying” or “more satisfying”).
Satisfying Control > (Sticky ads = Animated ads) > Pop-up ads
Predictable Control > (Sticky ads = Animated ads = Pop-up ads)
Fast (Control = Sticky ads = Animated ads) > Pop-up ads
Ad-Specific measures
Annoying Pop-up ads > Animated ads > Sticky ads
Distracting Pop-up ads > Animated ads > Sticky ads
Useful (Sticky ads = Animated ads) > Pop-up ads
Trustworthy Sticky Ads > (Animated ads = Pop-up ads)
Inappropriate (Animated ads = Pop-up ads) > Sticky ads
Creepy (Animated ads = Pop-up ads) > Sticky ads
VIsually Pleasing Pop-up ads = Sticky ads = Animated ads
Table 4. Summary table for the differences between ad experiences in the single-ad experiment This Single-Ad paradigm had several advantages: it was a simple design, participants were not influenced by seeing multiple ad experiences, and they were not aware that the experiment was about ad perception until the ad-specific questions were presented to them at the end of the study. However, this version of the experiment also had substantial drawbacks: it required a large number of participants to reach a reasonable statistical power (~500 participants per ad condition) and did not collect data on relative ranking of ad experiences, which was an important outcome measure for us. To improve statistical power, we changed the study from a between-subjects experimental design to a within-subjects design, presenting each participant with three ad experiences plus the control. We also added a final activity to the experiment, in which we asked participants to rank the ad experiences for annoyance.
17

Multiple-Ad Experiments This experiment’s goals were similar to our previous pilot’s. We wanted to validate:
● That our study could detect difference in user experience qualities triggered by different ad experiences.
● That our study produces ranking results that are in line (i.e., highly correlated) with the ad survey results.
● That our study could show significant differences between ad experiences with a relatively small number of participants.
In the multi-ad approach, all four conditions (control and the three ad experiences) are shown to each participant. Participants see four articles in a randomized sequence, and after each article they answer a comprehension question and the survey questions. At the end of the experiment, participants see a page with screenshots of the three ad experiences and are asked to select the most annoying and the least annoying of the three. We predicted that this within-subjects design would have greater statistical power as compared to the between-subjects design used in the single-ad experiment, because it eliminates between-subjects variability. In the next sections, we describe in greater detail the experimental procedure for the multi-ad experiments, and present the findings.
Experimental Design
We utilized a within-subject experimental design in which each participant read four articles, three of which contained ads (experimental ad conditions) and one which did not (control condition). After reading each article, the participants answered questions about their experience. At the end, we asked them to rank the three web pages that contained ads. We chose the same three ad experiences used in the single-ad experiment, which were rated differently in annoyance:
● sticky ad that stuck to the bottom of the participant’s screens (low annoyance level) ● animated images inlined into the article (medium annoyance level) ● pop-ups with 10 second delay (high annoyance level)
Material
The multi-ad experiment used a similar set of ad creatives, text articles, and comprehension questions as the single-ad experiment. Participants saw each article and each creative only once during the experiment, and articles and creatives were fully counterbalanced across the experimental conditions.
18

Comprehension, overall experience, and ad-specific questions
In all conditions, participants answered the comprehension question immediately after seeing the article. When participants were presented with the control, they only answered the set of overall experience questions (satisfaction, page speed, and predictability) as before. Ratings of the no-ad control served as a baseline against which to compare the ad conditions. When participants were presented with any of the ad conditions, they answered both the overall experience and the ad-specific questions (annoying, useful, trustworthy, visually pleasing, distracting, inappropriate, and creepy). Participant ratings on those dimensions allowed us to compare ad experiences with each other.
Final Ranking Survey
After completing the four experimental conditions, participants were administered a final ranking survey, which showed them a screenshot of three ad experiences and asked to select which web page they found most annoying and which one was the least annoying.
19

Figure 9. The top and bottom of the final ranking survey in the multi-ad experiment
Results and Discussion
In the following analyses, we attempt to determine whether the findings from the single-ad experiment can be replicated with the multi-ad experiment. Based on the single-ad experiment results, we expected the following results in the multi-ad experiment: 1. Significant differences in overall satisfaction ratings between control and the three ad experiences following the same pattern as the single-ad study: highest satisfaction for control (no ads), followed by sticky ads and inline animated ads, and lowest satisfaction for pop-up ads.
2. Significant differences in annoyance and distraction between the three ad experiences,
20

lowest distraction and annoyance scores for sticky ads, an increasing ratings of distraction and annoyance for inline animated ads ad pop-up ads.
3. Significant ranking of the ad experiences, with: sticky ads ranked as the least annoying and pop-up ads and the most annoying, with inline animated ads in the middle.
Differences in overall satisfaction The overall results of the multi-ad study confirms the pattern of results that we found in the single-ad study, but with more statistically significant differences across conditions. For example, using a pairwise Wilcoxon rank test, we found significant differences in satisfaction score between all four conditions in the direction we expected (control > sticky ads > animated ads > pop-up ads). The average satisfaction scores were 4.51 for the control condition, and 4.24, 3.80, and 3.56, respectively, for sticky ads, animated ads, and pop-up ads. In contrast, our single ad study did not show statistical differences between sticky ads and animated ads.
Figure 10. Survey responses to the level of satisfaction for each ad experience in the multi-ad experiment.
21
Average Scores Control Sticky Ads Animated Ads Pop-up Ads
Satisfaction 4.51 4.23 3.80 3.56
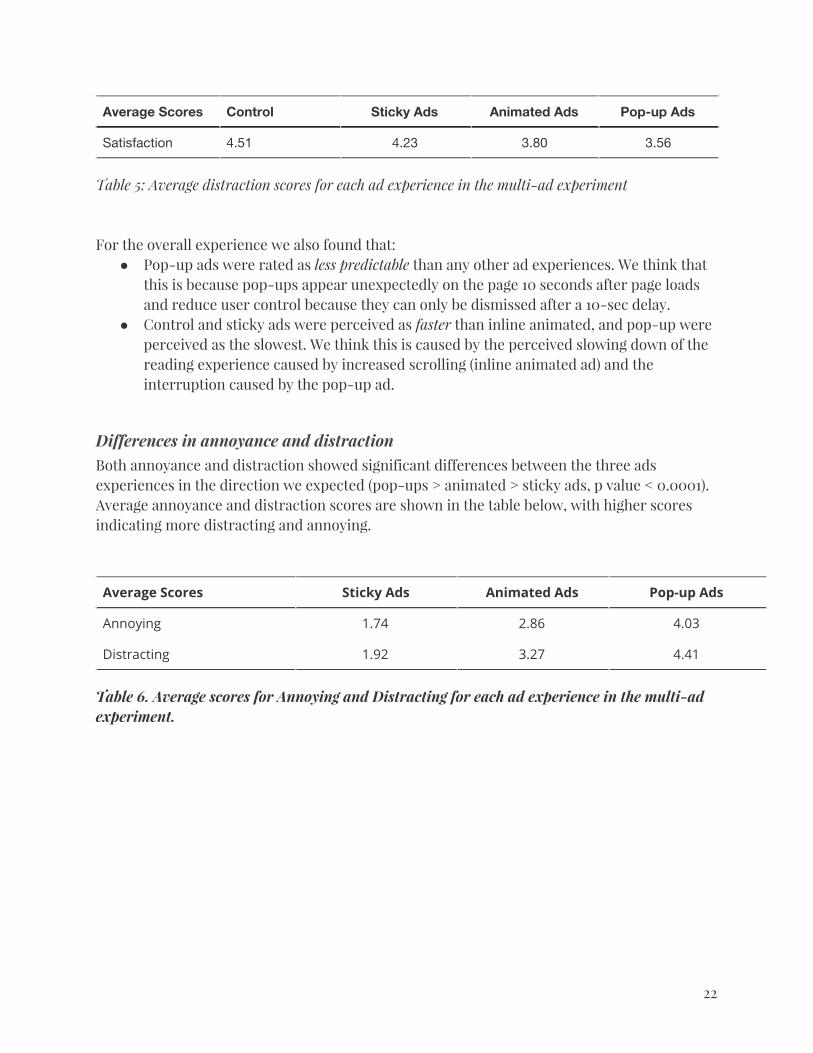
Table 5: Average distraction scores for each ad experience in the multi-ad experiment For the overall experience we also found that:
● Pop-up ads were rated as less predictable than any other ad experiences. We think that this is because pop-ups appear unexpectedly on the page 10 seconds after page loads and reduce user control because they can only be dismissed after a 10-sec delay.
● Control and sticky ads were perceived as faster than inline animated, and pop-up were perceived as the slowest. We think this is caused by the perceived slowing down of the reading experience caused by increased scrolling (inline animated ad) and the interruption caused by the pop-up ad.
Differences in annoyance and distraction Both annoyance and distraction showed significant differences between the three ads experiences in the direction we expected (pop-ups > animated > sticky ads, p value < 0.0001). Average annoyance and distraction scores are shown in the table below, with higher scores indicating more distracting and annoying.
Average Scores Sticky Ads Animated Ads Pop-up Ads
Annoying 1.74 2.86 4.03
Distracting 1.92 3.27 4.41
Table 6. Average scores for Annoying and Distracting for each ad experience in the multi-ad experiment.
22

Figure 11. Survey responses to the annoyance level of each ad experience in the multi-ad experiment.
23

Figure 12. Survey response to the distracting level of each ad experience in the multi-ad experiment.
Other findings for ad-specific dimensions ● As expected, since we counterbalanced creatives across ad types, we didn’t find any significant difference in visually pleasing scores across the ad experiences.
● However, we found that pop-ups were rated as less useful and trustworthy and more inappropriate and creepy than the other ad experiences. Although this result was unexpected, we believe that negative ratings in those dimensions reflect a general sentiment of annoyance and lack of user control caused by this ad experience.
24
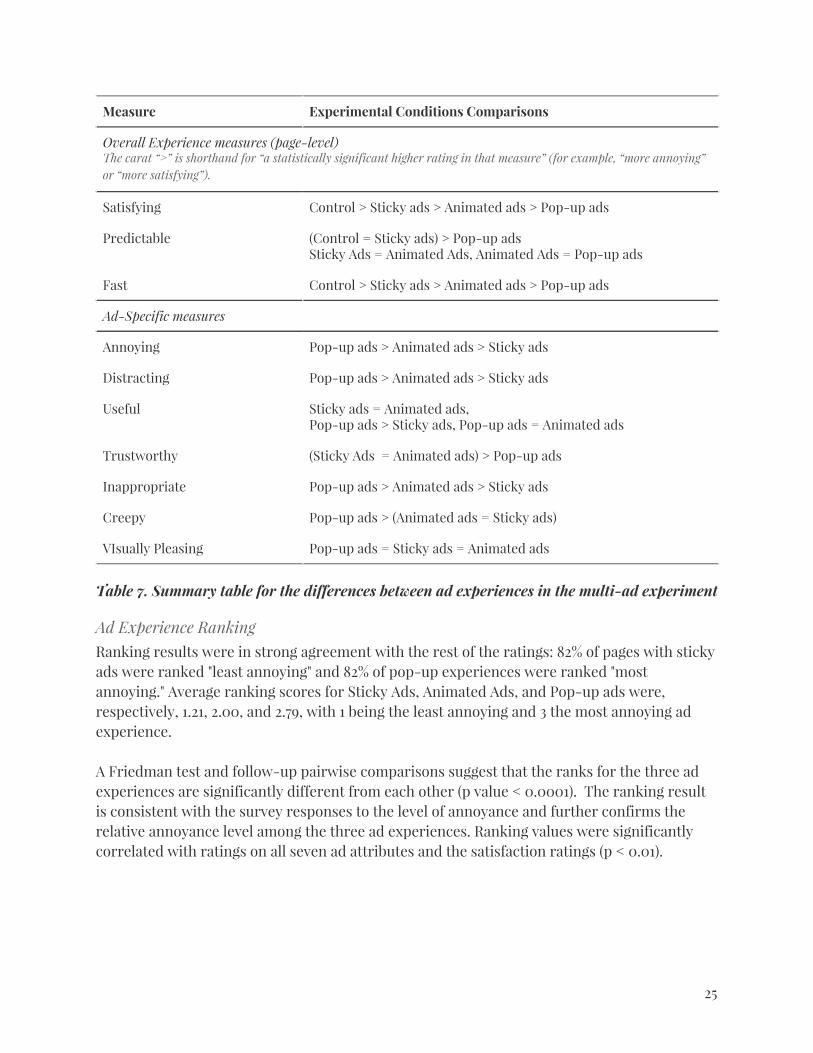
Measure Experimental Conditions Comparisons
Overall Experience measures (page-level) The carat “>” is shorthand for “a statistically significant higher rating in that measure” (for example, “more annoying” or “more satisfying”).
Satisfying Control > Sticky ads > Animated ads > Pop-up ads
Predictable (Control = Sticky ads) > Pop-up ads Sticky Ads = Animated Ads, Animated Ads = Pop-up ads
Fast Control > Sticky ads > Animated ads > Pop-up ads
Ad-Specific measures
Annoying Pop-up ads > Animated ads > Sticky ads
Distracting Pop-up ads > Animated ads > Sticky ads
Useful Sticky ads = Animated ads, Pop-up ads > Sticky ads, Pop-up ads = Animated ads
Trustworthy (Sticky Ads = Animated ads) > Pop-up ads
Inappropriate Pop-up ads > Animated ads > Sticky ads
Creepy Pop-up ads > (Animated ads = Sticky ads)
VIsually Pleasing Pop-up ads = Sticky ads = Animated ads
Table 7. Summary table for the differences between ad experiences in the multi-ad experiment
Ad Experience Ranking Ranking results were in strong agreement with the rest of the ratings: 82% of pages with sticky ads were ranked "least annoying" and 82% of pop-up experiences were ranked "most annoying." Average ranking scores for Sticky Ads, Animated Ads, and Pop-up ads were, respectively, 1.21, 2.00, and 2.79, with 1 being the least annoying and 3 the most annoying ad experience. A Friedman test and follow-up pairwise comparisons suggest that the ranks for the three ad experiences are significantly different from each other (p value < 0.0001). The ranking result is consistent with the survey responses to the level of annoyance and further confirms the relative annoyance level among the three ad experiences. Ranking values were significantly correlated with ratings on all seven ad attributes and the satisfaction ratings (p < 0.01).
25
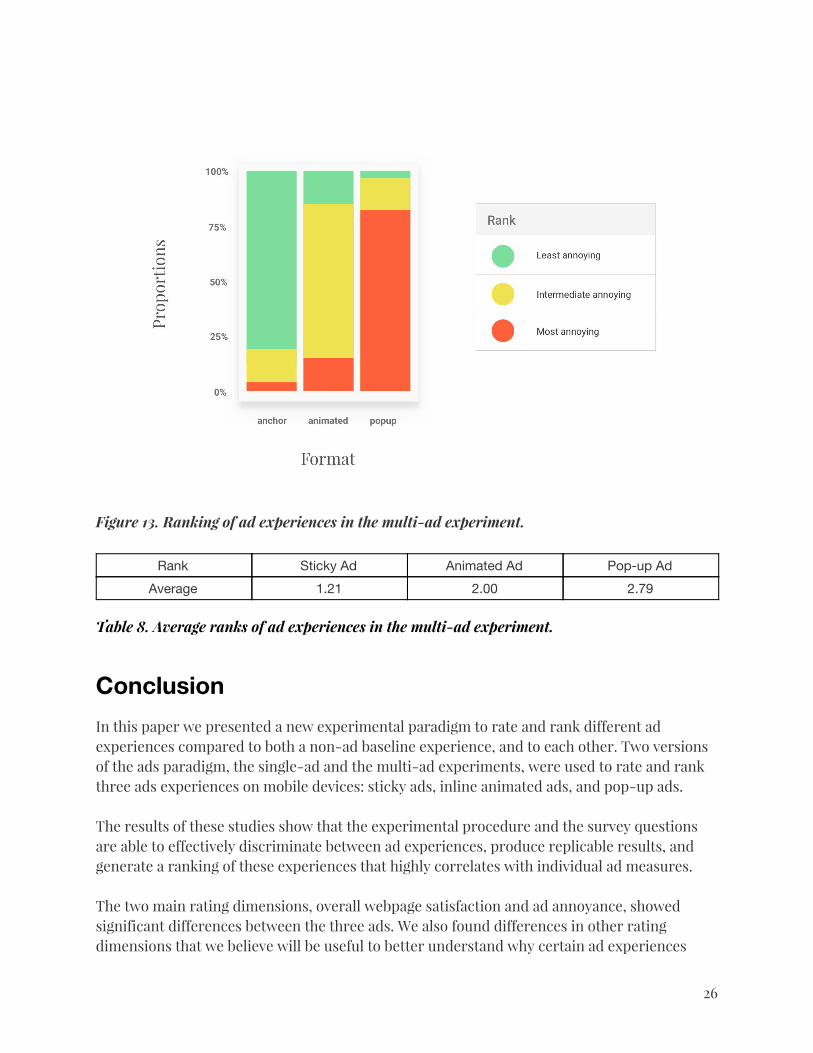
Figure 13. Ranking of ad experiences in the multi-ad experiment.
Rank Sticky Ad Animated Ad Pop-up Ad
Average 1.21 2.00 2.79
Table 8. Average ranks of ad experiences in the multi-ad experiment.
Conclusion
In this paper we presented a new experimental paradigm to rate and rank different ad experiences compared to both a non-ad baseline experience, and to each other. Two versions of the ads paradigm, the single-ad and the multi-ad experiments, were used to rate and rank three ads experiences on mobile devices: sticky ads, inline animated ads, and pop-up ads. The results of these studies show that the experimental procedure and the survey questions are able to effectively discriminate between ad experiences, produce replicable results, and generate a ranking of these experiences that highly correlates with individual ad measures. The two main rating dimensions, overall webpage satisfaction and ad annoyance, showed significant differences between the three ads. We also found differences in other rating dimensions that we believe will be useful to better understand why certain ad experiences
26
have a negative impact on the user experience and could suggest ways to improve them. In the multi-ad experiment, we closely replicated the results of the single-ad experiment, we generated an ad experience ranking highly correlated with the ratings, and we were able to significantly reduce the number of participants necessary to see significant differences. Our findings confirm that this is an effective methodology in discriminating between good and bad ad experiences.
Next Steps
This methodology shows that it is possible to discern the differences in users’ experiences with different ad types, however brands and advertisers will need more information in order to better understand how users perceive ads and make decisions accordingly. The next steps below aim to build on the research we’ve done so far.
● Expand the set of ad experiences to be tested We will expand the set of ad experiences to be tested by this methodology on mobile web. To date, we have 90 representative, isolated experiences that can be tested. We will also evaluate how we can rank these experiences.
● Test across geographical regions Geography and culture may impact how users perceive ad experiences. We will be looking into testing these ad experiences in places other than the US, and have identified partners with a global base.
● Test desktop web experiences Although we focused on mobile web for the purpose of this initial study, the framework can also be used for desktop web ad experiences. The next version of the framework will include desktop experiences as well to see how different platforms alter ad perception.
● Test different user contexts, specifically video User expectations for ads in video content or other contexts may differ when compared to ads in article content (e.g., autoplay ads may be expected, or standard-sized static formats may be used as overlays). We will look into modifying the framework to evaluate video content and video ad experiences.
● Determine if any ads are significantly worse than others In future analyses with more ad experiences, we will look for ways to determine which experiences are particularly more annoying and likely to cause users to abandon a site, create negative brand perceptions, or even install ad blockers.
27

References Callegaro, M., Lozar-Manfreda, K. & Vehovar, V. (2015). Web Survey Methodology (pp.73). London: Sage. Goldstein, D.G., Suri, S., McAfee, R.P., Ekstrang-Abueg, M. & Diaz, F. (2014). The Economic and Cognitive Costs of Annoying Display Advertisements. Journal of Marketing Research, LI, 742-752. Holbrook, A. L., Krosnick, J. A., Carson, R. T., & Mitchell, R. C. (2000). Violating conversational conventions disrupts cognitive processing of attitude questions. Journal of Experimental Social Psychology, 36, 465-494. Krosnick, J. A., & Presser, S. (2010). Questionnaire design. In J. D. Wright & P. V. Marsden (Eds.), Handbook of Survey Research (Second Edition). West Yorkshire, England: Emerald Group. Rohrmann, B. (2007). Verbal qualifiers for rating scales: sociolinguistic considerations and psychometric data. Project report. University of Melbourne. Tourangeau, R., Conrad, F. G. & Couper, M. P. (2013). The Science of Web Surveys. Oxford: Oxford University Press.
28

Appendix
The survey instrument
Demographic Questions
Before you begin, we have a few questions about your background. Age
● 18-21 years old ● 22-34 years old ● 35-44 years old ● 45-54 years old ● 55-64 years old ● 65+ years old
Gender
● Male ● Female ● Other
To what extent do you agree with the following statement? Overall, I consider online advertising a good thing.
● Strongly agree ● Agree ● Neither agree nor disagree ● Disagree ● Strongly disagree
What is your current employment status?
● Employed ● Out of work ● Student ● Retired ● Other
What is your annual household income before taxes?
● Less than $30,000 ● $30,000 to $49,999 ● $50,000 to $99,999 ● $100,000 to $149,999 ● $150,000 or more ● Prefer not to answer
29

Overall Experience Questions
How satisfied were you with the OVERALL EXPERIENCE on the web page? ● Very satisfied ● Somewhat satisfied ● Neither satisfied nor dissatisfied ● Somewhat dissatisfied ● Very dissatisfied
To what extent does each of the following words describe your experience on the WEB PAGE? Predictable
● A great deal ● A lot ● A moderate amount ● A little ● Not at all
Fast
● A great deal ● A lot ● A moderate amount ● A little ● Not at all
Ad-specific questions
Participants only saw this section after reading an article that contained an ad in it. We showed a screenshot of the article they just read, with the ad highlighted, to refresh their memory of the ad. We would like to ask you about an ad (boxed in red) that you may have noticed in Webpage A*. [screenshot of the exposed ad experience with the ad highlighted in red] How USEFUL was the ad?
● Extremely useful ● Very useful ● Moderately useful ● Slightly useful ● Not at all useful
30

How ANNOYING was the ad? ● Not at all annoying ● Slightly annoying ● Moderately annoying ● Very annoying ● Extremely annoying
To what extent does each of the following words or phrases DESCRIBE THE AD? Trustworthy
● A great deal ● A lot ● A moderate amount ● A little ● Not at all
Visually pleasing
● A great deal ● A lot ● A moderate amount ● A little ● Not at all
Distracting
● Not at all ● A little ● A moderate amount ● A lot ● A great deal
Inappropriate
● Not at all ● A little ● A moderate amount ● A lot ● A great deal
Creepy
● Not at all ● A little ● A moderate amount ● A lot ● A great deal
31

Ad Ranking Exercise
In the last part of the survey, we would like you to compare the ads that you saw. [screenshot of the three ad experiences, with each ad highlighted in red] Which ad was MOST annoying?
● A ● B ● C
Which ad was LEAST annoying?
● A ● B ● C
32