Experience with highly automated unmanned aircraft ...
17
0 Cl :! 0 "' _. AIAA Guidance, Navigation , and Control Conference 10 - 13 August 2009, Chicago, Illinois AIAA 2009-6157 Experience with highly automated unmanned aircraft performing complex missions Nimrod Roo z* Eric N. Johnson t A ll en Wu * Claus Christmann * Jin-Cheol Ha+ Wayne Pickell § Jeong Hur § Girish Chowdhary * Henrik Chr istoph ersen § Scott Kimbrell * D. Mike Sobers * Suresh Kannan § Allen Tannenbaum , Jehoon Lee* Hal Gates II Brendan Andrus II Alison Procto r ** School of Aeros pa ce En gi neering, Georgia Institut e of Techn ology, Atlanta, GA As the roles of UAVs in the ae rospace a rena increase, th e re is much int er est in incr eas- ing their ab ility to op er ate a utonomously without the ne ed of operator intervention. The following paper describ es the deve lopment and testing of an autonomous UAV system ca- pable of completing complex surveillance missions. The system has to search for its target building in a predefined search area, find an ent ry point on the ta rget building and fina lly enter the building to transmit imag es from within th e building back to a ground control station, all without the interaction of a human operator. Such complex missions require d eve lopment of al gorithms from multiple disciplines such as image processing, target track- ing and es timation , and GNC(Guidance, N avigation and Control) a lgorithms. Furthermore a sophisticated mission man age r is re quired to synchronize the op e ration of the separate subsystems and that is capable of a utonomously making op era tional d ecisions. This pa- per will present the d eve lopment of these various algorithms and flight test r es ults of the autonomous system. I. Introduction In recent years, the amount of fli ght hours th at U AV s have been logging are increasing rapidly. According to the unmanned systems roadmap , in 2006 large UAVs logged > 160 , 000 hours, which is more than double then the amount of logged hours in 2004 and these numbers are expec ted to rise even more in the near future. 1 Furthermore, during operat i on Ir aqi fr eedom, the US Air Force transferred 120 pilots to fl y UAVs due to the increasing load of UAV assignments. 2 In 2008 Israeli UAVs logged 24,000 flight hours over the Gaza strip , compared with 1,300 hours t h at att ack helic opters flew and only 100 hours t hat fi ghter jets fl ew. 3 With this increase in UAV roles and operations, there is great benefit in developing a UAV system capable of completing a given task from takeoff to landing without requiring the intervention of a human operator. Apart from the abi lity of such a system to fl y completely autonomously, the system must be able to make operational decisions ba se d on sensor input (e.g. obstacle avoidance, target acquisition a nd tra cking) . In this paper, we prese nt the development and test ing of a UAV system at the Georgia Tech UAV research facility, capable of conduct ing a surveillance mission without the need of a human operator. 4 • 5 *G radu ate Research Assis tant t Assoc iate Professor tGu ided Systems T echnolog i es I NC . §Research Engi neer ,Assoc iate Professor, School of E lect ri cal a nd Computer Engineering II Underg rade R esearch A ss i st ant ** Research Engi neer, O cean T echnology Lab , Universi ty of Victoria 1 of 17 Copyright © 2009 by the American Instit ute of Aeronautics and Astronautics
Transcript of Experience with highly automated unmanned aircraft ...

0 Cl
:! 0
"' _.
AIAA Guidance, Navigation, and Control Conference 10 - 13 August 2009, Chicago, Illinois
AIAA 2009-6157
Experience with highly automated unmanned aircraft performing complex missions
Nimrod Rooz* Eric N. Johnson t Allen Wu * Claus Christmann *
Jin-Cheol Ha+
Wayne Pickell §
Jeong Hur §
Girish Chowdhary *
Henrik Christophersen §
Scott Kimbrell *
D. Mike Sobers * Suresh Kannan §
Allen Tannenbaum , Jehoon Lee*
Hal Gates II Brendan Andrus II
Alison Proctor ** School of Aerospace Engineering, Georgia Institute of Techn ology, Atlanta, GA
As the roles of UAVs in the aerospace a rena increase, there is much inte r est in increasing their ability to ope r ate a utonomously without the need of operator intervention. The following paper describes the deve lopment and testing of an autonomous UAV system capable of completing complex surveillance missions. The system has to search for its target building in a predefined search area, find an entry point on the t a rget building and fina lly enter the building to transmit ima ges from within the building back to a ground control station, all without the interaction of a human operator. Such complex missions require d evelopment of a lgorithms from multiple disciplines such as image processing, target tracking and estimation, and GNC(Guidance, N avigation and Control) a lgorithms. Furthermore a sophisticated mission m a n ager is r equired to synchronize the ope ration of the separate subsystems and tha t is capable of a utonomously making ope r a tional d ecisions. This p a per will present the d evelopment of these various algorithms and flight test r esults of the autonomous system.
I. Introduction
In recent years, the amount of flight hours that U AV s have been logging are increasing rapidly. According to the unmanned systems roadmap, in 2006 large UAVs logged > 160, 000 hours, which is more than double then the amount of logged hours in 2004 and these numbers are expected to rise even more in the near future.1 Furthermore, during operation Iraqi freedom, the US Air Force transferred 120 pilots to fly UAVs due to the increasing load of UAV assignments.2 In 2008 Israeli UAVs logged 24,000 flight hours over the Gaza strip, compared with 1,300 hours t hat attack helicopters flew and only 100 hours t hat fighter jets flew. 3
With this increase in UAV roles and operations, there is great benefit in developing a UAV system capable of completing a given task from takeoff to landing without requiring the intervention of a human operator. Apart from the ability of such a system to fly completely autonomously, the system must be able to make operational decisions based on sensor input (e.g. obstacle avoidance, target acquisition and tracking) . In this paper, we present the development and test ing of a UAV system at the Georgia Tech UAV research facility, capable of conducting a surveillance mission without the need of a human operator.4•5
*Grad uate Research Assistant t Associate Professor tGuided Systems Technologies INC. §Research Engineer ,Associa te Professor, School of E lectrical a nd Compu t er Engineering II Undergrade Research Assistant
**Research Engineer, Ocean Technology Lab, University of Victoria
1 of 17
Copyright © 2009 by the American Institute of Aeronautics artc)l}IS\fifriautil!s~titbu~ R~~~mtJcs and Astronaut ics

0 Cl
:! 0
"' _.
A. Mission definition
The mission considered was part of the International Aerial Robotics Competition (IARC) , which was held at t he McKenna Mout site, Ft . Benning, the rules for this competit ion can be found at [6]. One of the hypothetical scenarios considered for this competition was that of a nuclear reactor disaster which investigation teams wish to examine. Due to the nature of the disaster, a UAV is required to fly an predefined 3km t rajectory to approach the disaster site. Once at the site, the vehicle must find t he reactor building identified by the IARC symbol shown in Figure 4 and then find a viable entrance to the building. Once the building and opening have been identified , the system should enter the building or insert a subvehicle into the building and survey the interior of the building, relaying imagery back to the Ground Control Station (GCS).
B. General Approach
A diagram showing the interaction between the different system components is shown in Figure 4. The GTMax referred to in the figure is a helicopter that carries the slung load. It is capable of fully autonomous flight and carries two computers in addition to inertial and other sensors. The primary flight computer (onboardl) runs the guidance, navigation, and control algorithms which use waypoints that may be uploaded over the network from a ground control station (GCS) or from any other computer. The secondary flight computer (onboard2) runs the vision-based algorithms, such as the image processing and object tracking routines, needed to identify the correct building and locate a viable entry point. In addition, t he GTMax provides a relay for the visual telemetry obtained from t he ground robot (rover) to reduce the power requirements of the light-weight sub-vehicle. The ground robot acts independent ly and performs its own guidance within the building. The following sections go into greater detail on this system.
Mission Manager
Image Manager
Navigator
Flight Control
GCS
Guidance
symbol Open ing Symbol Finder Finder Cam
Open ing Slung Siu ng Load
Tracker Load IP Cam
[FTP) Onboard2
~ Image ~Manager
Gumstix
Rover
Figure 1. Syste m block diagram for slung-load insertion of ground robot into a building, Includes four major compone nts: The h elicopte r m other ship (GTMax) , the ground control st a tion (GCS) , the slung load syste m hung b e low the h elicopt e r , and the ground robot to b e inse rte d.
2 of 17
American I nst i t u te of Aeronautics and Astronautics

0 Cl
:! 0
"' _.
II. System Overview
A. Hardware
The UAV used for t his system is a modified Yamaha RMax, called the GTMax. This Vehicle has been modified to support UAV research operations at the Georgia Tech UAV Research Facility and has been flown continuously since 2001. The sensor package on t his vehicle consists of:
Onboard computers
• Main flight computer - Embedded 1.2 GHz SBC wit h 12 RS-232 ports, Ethernet and compact flash
• Auxiliary computer - Embedded 1.2 GHz SBC with Sensoray S314 4-port Frame Grabber, Et hernet and solid state hard drive
Navigation sensors
• Inert ial Sciences Isis Inert ial Measurement Unit
• Novatel D-GP S
• Honeywell 3-axis magnetometer
• Sonar altimeter
Data links
• 2.4 GHz Aironet 11 Mbps wireless Ethernet data link, variable gain - GCS data link
• Freewave serial data link, 900 MHz
• 2.4 GHz Linksys WRT54GL wireless Ethernet data link - Ground rover data link
6
Mission sensors
• Two analog NTSC analog color cameras
The schematics of the hardware configuration on the GTMax is shown in Figure 2.
NovAtel GPS Receiver
HMR-2300 Magnetomeler
I [-- Sona< Ntimete<
ISIS·IMU ~=::::j;;::;;;:M:::ll.U.----. 11! ~----~ ~ -= ::: II
rf =R~·~ .. ~· A~,, ... ~···~~""liil~ _ _JJll == • .:.~:'"'" Serial Extension Board
Flight Computer
Mission Computer & Image Processing Boa<d
--RS-232Serial --E---- DCPower
F igure 2 . Schemat ic of the GTMax avionics. Note Radar A ltim e t e r has b een removed . Cameras interface w ith image processing board (frame grabber) .
3 of 17
American I nsti t u te of Aeronaut ics and Astronaut ics

0 Cl
:! 0
"' _.
B. Guidance, Navigation and Control (GNC)
Given a set of waypoints for a specific flight plan, the trajectory generator creates a smooth reference trajectory based on a kinematic model of the GTMax. The kinematic model used for t rajectory generation uses specifiable limits on the maximum speed and acceleration the aircraft may have during a maneuver. The reference trajectory contains information about the desired position, velocity, attitude and angular rate of t he vehicle at every point of the flight plan. For safety reasons, an altit ude high enough to avoid obstacles representative of t rees and two-story buildings is maintained throughout the majority of the flight . The various kinds of maneuvers are:
• CUT Takes three waypoints and generates a position and velocity profile that includes a turn to go from waypoint 1 to waypoint 3. The t rajectory does not pass through waypoint 2.
• THRU The trajectory will pass through the given waypoint wit hout stopping.
• STOPAT The trajectory will end at the waypoint and bring the helicopter to a hover.
• LAND The t rajectory will be a slow decent unt il ground contact detected.
• TRACK (slung load portal entry) A highly specialized maneuver, described in greater detail below.
The navigation system on the GTMax consists of a 17-state extended Kalman fil ter. The filter states include: vehicle position and velocity, attitude( quaternion) , accelerometer biases, rate gyro biases and terrain height error. The filter can operate at all attit udes and uses t he IMU as a t ime base for updates (lOOHz) .7
The control system of the GTMax consists of a model reference adaptive control (MRAC) system, which follows the trajectory output by t he trajectory generator. The plant controller is a dynamic inversion controller with a mult i-layer perceptron neural network (18 inputs, 5 hidden layers and 7 outputs) as the adapt ive element. Furthermore, the control system generates a pseudo-control hedging signal to prevent adaptation in the presence of saturation.8
C. Software
The software developed for this system9 was designed such that the individual components can be reused for different tasks, i.e t he same code is used for simulation, onboard computers and for the GCS. A snapshot from a SITL setup is shown in Figure 3. The GTMax simulation is a comprehensive simulation including models for the GTMax, as well as for the slung load. This allowed researchers to develop and test all the algorithms related to the mission prior to any flight testing.
:+ t HtCAd: (dee:> t ilt t11nele <~ up) TYPE tt~E VALUE
ch t11r l'lllocle 1 chor pointHode 2 ch a r harc:Ware 5 ch a r sllpR1ni 1
pt!in Off s et.1 O til t.Offset 0
i n t roll Of fset 0 double pt1nt-id - ';10 , 00000000 doubl e t.iltQnd - 45 . 000()0000 do uble r o llCrrid 0.00000000 do uble panRateC~d 0 . 00000000 do ... ble t i ltRat eCm 0 . 00000000 double panTr.ifl'I 0.00000000 double t il tTl"i"' 0.00000000 double rol l Tr u" 0 . 00000000 double :tOOI'\ 1.00000000 do ubl e fovi:j 52. 5 000000 0 do uble r ollDe s 0.00000000 double 11m1n 5 .00000000 double dtDes 0.02000000 doubl e ratelimit 0.00000000 double 11Bacff 0 .00000000 double panM1n -1ao.oooooooo do uble panHe;.; 180 . 00000000 do uble t1l tM.in - 90 , 00000000 do uble t 1 l tMax 90. 00000000 double rollMln -100, 00000000
Cdec> pan •ngl e < Cdee-> ti l t onde Cdee> roll ane l e Cde g/sec) pan ant Cde g/sec) U l t an Cdec) trim Cdec;) Cde i> ZOOM settlns: n=o Cde e) vertica l fi Cdee) deured rol Cft/11:ec:) m1n velo Csec:) uf)d.!lte dt Cdec/l•e c) C$eO) leaddt. Cde i> Cde e:> Cdee> Cdeg) Cde s:>
Figure 3. Ground control station vie w
4 of 17
American Insti t u te of Aeronautics and Astronautics

0 Cl
:! 0
"' _.
III. Building Identification
A. Image Processing
The target building is marked by the IARC symbol shown in Figure 4. Furthermore, during the search phase, t he symbol is only in view for approximately 5 seconds which means that a relatively fast image processing algorithm must be used that has a minimal amount of rejections. The algorithm used for the symbol detection has two stages, in the first stage a shape matching algorithm is used to detect possible symbols within t he image. Halcon, a commercial image processing library developed by MvTec Software GmBH,10 was used for the shape detection stage. This algorithm is faster than the t raditional template matching using a grayscale pixel correlation algorithm and can also handle shape scaling and rotation. In this algorithm, a shape model is generated from an image of the symbol, this model is then used to find features in the images that have the same shape information. In the second stage, once a list of possible features has been generated by t he shape matching algorithm, each feature is ranked based on its color content and the ratio of darker pixels to lighter pixels. Finally the feature with the highest probability is chosen as the candidate for being an actual match for the symbol.
Figure 4. The I ARC Symbol that was use d to mark the targe t building.
B. '!racking
Once the image processer has found a candidate symbol match within the image, the tracking algorithm uses navigational information to compute the local geographical coordinate (LGC) position of the symbol and then based on this position, decide if this is a new track t hat needs to be stored or another observation of an old track whose posit ion and confidence level must be updated. The LGC is determined by finding the intersection of a unit vector in the direction of t he candidate symbol with a reference plane. This reference plane is parallel to the ground and represents the height at which the symbol is expected to be found. If the candidate symbol 's LGC is not wit hin the predefined search area it is discarded, otherwise, t his position is then assigned a score which is based on t he score given to the candidate symbol by t he image processor and is shown in Eq. (1).
P = Pnom + (1 - Pnom)SPs (1)
Where Pnom is t he init ial nominal probability assigned to each candidate, S is the score assigned to the candidate by the image processor and Ps is a scaling factor that limits the effect t he image processor results have on t he probability change. From t his probability, a posit ion variance for t his symbol is calculated as
(2)
Where CJ is the symbol posit ion variance (on the reference plane), CJp is t he navigation system posit ion variance, CJ(} is the navigation system angular variance and R is t he distance from the vehicle posit ion to the symbol's LGC. The tracker then compares the LGC of t his symbol with t he LGC of all previously saved tracks and based on the difference in heading and LGC chooses t he t rack which is closest to t he candidate
5 of 17
American I nsti t u te of Aeronautics and Astronautics
0 Cl
:! 0
"' _.
symbol. Based on t his distance and the previously calculated variance, the tracker decides whether to store the current candidate as a new track or update the previously found existing track with the new measurement . If an existing t rack is to be updated, t he variance is updated using
2 2
( 2)+ _ (lt (lnt (ll - 2 2
(lt + (lnt
and the heading and posit ion are updated using
where the subscripts t and nt denote an existing track and t he new track respectively.
A. Image Processing
1. Curve Evolution
IV. Entry Point Detection
(3)
(4)
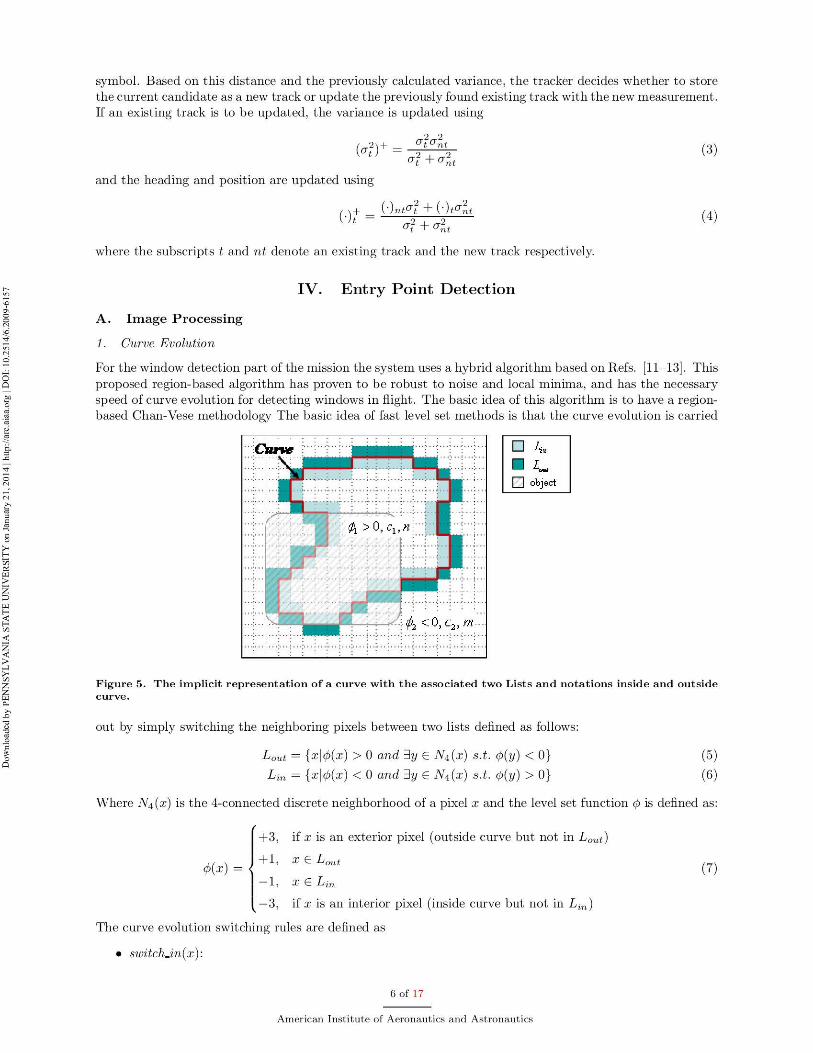
For the window detection part of the mission the system uses a hybrid algorithm based on Refs. [11- 13]. This proposed region-based algorithm has proven to be robust to noise and local minima, and has the necessary speed of curve evolution for detecting windows in flight. The basic idea of this algorit hm is to have a regionbased Chan-Vese methodology The basic idea of fast level set methods is that the curve evolution is carried
• ' .:. ' • : ' • ,., • ' : • ' ,:, ' • : ' •• ~ •• ' ; • ' •:O ' • . : •• :. • ' : ' ' ' : ' • ; ' • ' : • ' f • ' • ~ ' • ~ ' • ' : • ' .. : ' : " : : : : : . . : . . . .
D L; • • L_ D object
F igure 5. The implicit r epre s entation of a curve with the associate d two Lists and notations insid e and outside c u rve .
out by simply switching the neighboring pixels between two lists defined as follows:
Lout= {xl¢(x) > 0 and 3y E N4(x) s.t. ¢(y) < O}
L in= {xl<P(x) < 0 and 3y E N4(x) s.t. ¢(y) > O}
(5)
(6)
Where N4 (x) is t he 4-connected discrete neighborhood of a pixel x and t he level set function 4> is defined as:
+ 3, if x is an exterior pixel (outside curve but not in L out )
¢(x) = + l , x E L out (7)
- 1, x E L in
- 3, if x is an interior pixel (inside curve but not in Lin)
The curve evolution switching rules are defined as
• switch_in(x) :
6 of 17
American I nsti t u te of Aeronautics and Astronautics

0 Cl
:! 0
"' _.
1. Delete x from L out and add it to L in · Then set </>(x) = - 1
2. Vy E N4(x) if </>(y) = 3, add y to L out and set </>(y) = 1
• swi tch_out ( x) :
1. Delete x from L in and add it to L out· Then set </>(x) = 1
2. Vy E N4(x) if </>(y) = - 3, add y to L out and set </>(y) = - 1
Active contours are defined to evolve in a direction which decreases a pre-defined energy functional. For this algorithm the energy functional for curve evolution is derived from the opt imization method introduced by Song and Chan. 12 The main idea of this method is based on the observation of segmentation only needing the sign of level set function </> but not its value. The optimization method for the Chan-Vese model13 is used for our algorithm. More specifically, one partitions the given image into two regions as </> 1 > 0 and ¢2 < 0. Let c1 and c2 be t he average value of features (intensity values) for ¢1 and ¢2, respectively and let m and n be t he total number of pixels for ¢1 and ¢2 , respectively as shown in Figure 5. The equations for the energy function for curve evolution are as follows:
n 2 m 6. F12 = (x - c2)-- - (x - c1) --
n + l m - 1
( m ( 2 n 6.F21 = x - c1)-- - x - c2) --m + 1 n - l
(8)
(9)
where 6.F12 and 6.F21 denote the differences between the new and old energies when a pixel moves from outside to inside the curve and vice versa, respectively. If the energy decreases after changing a pixel from inside to outside the curve or vice versa, two switch procedures for curve evolution are carried out to satisfy the energy minimization. For example, if 6.F12 < 0 when a pixel x E </>1 changes from </>1 to </>2, then x for ¢2 is updated to minimize the total energy. Repeating the above procedures until the total energy remains unchanged , the Chan-Vese model is rapidly implemented without explicitly solving any PDE.
The two methods derived in [11] and [12], complement each other well in the pixel-wise point of view, and their strategies are based on the same concept of switching or changing pixels. Therefore, the fundamental idea of the proposed algorithm is to combine two methods by substituting the energy equations 8 and 9 for the energy function of fast level set framework. In other words, if 6.Fi2(x) < 0, then switch_in procedure is carried out. If 6.F21 (x) < 0, then switch_out procedure is executed. The proposed combining algorithm is described in Table 1. The curve can evolve inward and outward by scanning two lists alternately. Since curve evolution via level set methods is achieved without solving any PDE, the computational cost is drastically reduced. In addition, the boundary information of contours preserved in the two lists is available for contourbased shape analysis to acquire t he specific target as described in the next section.
2. Shape Analysis
Once the stopping condit ion for the evolution of the active contours is reached, the contours are analyzed based on their shape. For t he purposes of t he present work, a planar shape is defined as a closed contour in the plane; see also Ref. [9]. Our method is divided into two processes: extracting connected components of the regions enclosed by closed contours, and finding the feature points. The curve evolut ion algorithm described in t he previous section provides the lists t hat preserve t he information of t he pixels defining the discrete versions of the closed contours. Therefore, the connected components of each region bounded by a contour are obtained by tracing through t he pixels of given contour. In other words, the shape can be considered as t he certain level set of level set function </> satisfying </> ( x) = - 1 or </>( x) = - 1. Figure 6 (a) shows the final curve or contour that enclosed a target object. While tracing around the boundaries of the closed contour, t he histogram of the difference between orientation at previous and current pixels is achieved. The rules of t racing are as follows:
1. One route should be chosen between the clock-wise (CW) and the counter-clock-wise (CCW) direction.
2. The next point cannot be chosen in the opposite direction, and the priority of the subsequent points in descending order begins with the 0 radian and moves counter-clock-wise. (Priorities are assigned in order of 0 , % , 1; , ~ , and 3; radians from a current point. )
7 of 17
American I nsti t u te of Aeronautics and Astronautics

0 Cl
:! 0
"' _.
Table 1. The propose d fast algorithm for curve evolution
Step 1: Init ialization: initialize level set function ¢, two average values c1 , c2 , t he number of pixels
m, n and the two lists, L out and L in from the initial curve
Step 2: For all elements of L out
Calculate llF12(x) If llF12(x) < 0 ,then switch_in(x}and update c1 , c2 , m , and n.
End For
Step 3: For all elements of L in
If Vy E N4(x) , <f>(y) < 0, delete x from L in and set </>(x) = - 3 End For
Step 4: For all elements of L in
Calculate 6.F21 ( x) If 6.F21(x) < 0, then switch_out(x) and update c1, c2, m and n.
End For
Step 5: For all elements of L out
If Vy E N4(x) , </>(y) > 0, delete x from L out and set </>(x) = 3 End For
Step 6: Check stopping condition;
If llF12 ( x) > 0 for all elements of L out and llF21 ( x) < 0 for all elements of L in
Terminate the algorithm.
Else
Go to Step 2
End If
8 of 17
American Institute of Aeronautics and Astronautics

0 Cl
:! 0
"' _.
0.2--------------~
0.18
0.16
il.14
0.12
0 1
0.08
0.05
0.04
002
p~· 4 pi.12 3p1;4 pt 5p1! 4 3pi:'2 7p114
(a) (b)
Figure 6. (a) Extracting the connecte d se t of boundary pixels; (b) Histogram of orientations
In Figure 6(a) , the x-marked pixel is not selected in choosing the next tracing point based on the above rule 2. The extracted components are composed of twenty connected sets of boundary pixels. The orientation diagram shown in Figure 6(b) presents the geometric characteristics of a contour, such as vertical-to-height ratio (VHR) and symmetry. This method does not need large computational requirements and it provides enough information for t he shape analysis for our UAV tasks. Feature points also provide important information for shape. For example, the intersection and extremity points of a shape can be good feature points. In this application, the feature points are obtained by using the information given by t he change of orientation between the connected points on a closed contour. The basic idea of this is to check how much orientation changes while tracing around boundary points of a closed contour unt il returning to the start ing point. If the accumulated sum of radians until a current pixel is greater t han ~ ' the pixel becomes a feature point. From this strategy, the 5th, 9th, 15th, and 19th pixels are selected as feature points for the curve in Figure 6(a) , and this is shown in Figure 7.
Index
Orientation difference
0 2 3
0 ~ 0
4 6 7 8 lO 11 12 l3 14
F ig ure 7. Analysis of pixe l orientation diffe r ence
3. Application to Window Detection
16 17 18
The proposed target detector is applied for finding windows in the images captured by the camera mounted on t he GTMax. The following assumpt ions about the features of an open window are made:
1. The intensity value of a window is less than the background. In other words, it is dark.
2. The shape of a window is rectangular or parallelogram satisfying symmetry and having a four-sided shape.
3. Shadows are bigger than windows or not rectangular in shape. Noise is not smooth on the boundary line.
The intensity values of all pixels of the given image I are normalized to lie between 0 and 1 as follows:
I ( )= I0 (x,y)- min(I) x, y max(I) - min(I) (10)
9 of 17
American I nsti t u te of Aeronautics and Astronautics

0 Cl
:! 0
"' _.
where I 0 (x, y) is the grey-scale intensity of pixel x and y in the image. Only regions with a window or windows are selected for the next segmentation process. To handle this issue, the given image is divided into several small regions and a checking process is executed for finding regions satisfying t he following condit ion :
--+ N(I ( k) < Io, ) > N th (11)
where k is a pixel vector and I th and Nth are intensity thresholds and the number of pixels whose intensity is less than I ih, respectively. Furt her , N(-) is a function t hat indicates the total number of pixels satisfying the given condit ion . If a certain region satisfies Eq. (11), t he proposed curve evolution algorithm is carried out . The computational time for segmentation may be drastically reduced through the above preprocessing. After completing the segmentation process, the several segmented contours become candidates as the most likely windows. Since our images include features such as shadows, grass, mud , etc., which could be segmented as window contours, shape analysis is an important process to filter out such unexpected contours among several candidates. The shape analysis is carried out according to the geometric characteristics of windows ment ioned in the assumpt ions. Next, the corner and center locations of windows are detected as feature points of windows. Also geometric data , such as the area, the darkness of the interior and the center of t he mass of each window candidate are calculated. All of t his information is used to estimate the location of the window candidate in 3D space and assign it a probability measure to be used in the window posit ion estimator, as described in the following section.
B. Opening Position Estimation
In t his stage the estimate of the opening position must be more accurate than that used for identifying the symbol location, since the openings are closer to each other and the tracker requires a more accurate estimate so new opening posit ions aren't confused with previously found openings. Furthermore, the estimator must estimate both the three dimensional posit ion of the opening as well as its size, since this information is required for the next phase of the window entry. One piece of information which is known and is used to increase the accuracy of the posit ion estimate is t hat t he openings are located on the walls of the building. Since the layout of the village buildings is known a priori the position of the opening from the image processor is projected onto the walls of t he building. Figure 8 shows a diagram of the window position measurement process.
Figure 8. Window position m e asurement diagram
V. Building Entry Approach
In order to complete the mission the vehicle must insert t he ground rover into t he selected building. To achieve t his task, a 12ft boom is carried beneath the helicopter, shown in Figure 9. The boom is released once an appropriate opening for building entry is located and is suspended from dual 100-foot long passive tethers via a rappelling mechanism consisting of a spool and damper to cont rol the descent speed. The
10 of 17
American I nsti t u te of Aeronaut ics and Astronaut ics

0 Cl
:! 0
"' _.
rappelling mechanism on the aft end of t he boom also serves as a counterweight for t he ground robot, which is attached to the front end of the boom. Furthermore, t he boom is equipped with a magnetometer which provides the UAV wit h a boom heading measurement which , along wit h the images captured from the ground robot camera is used for the window approach guidance law. A WiFi repeater attached on the boom assures the ground rover can communicate with the UAV and the two servo signals required for rappelling the boom and releasing the ground robot are provided by t he ground robot t hrough an umbilical cord.
Figure 9. GTMax H e licopte r carrying slung load b efor e d e ployme nt (right) and afte r d e ployment (Helicopter top left , slung load bottom left 100 feet b e low). Large v e rtical separation keeps h e licopte r away from potential collision with trees or other obstacles. Ground Robot is locate d on front of boom.
A. Image Processing
The image processing for the building entry approach is done on images captured from the ground rover camera. The image processor used is a fast algorithm for detecting rectangular features using integral images.14 The image processed is transformed to an integral image defined in Eq. (12)
I I (x, y) = L I (x', y') (12) x' <x y' ~y
This transformation is extremely simple and can be achieved by a single iteration on the image by using
II(x , y) = II(x - 1, y) + II(x, y - 1) - I I (x - 1, y - 1) + I (x , y) (13)
The integral image allows to calculate the average pixel intensity in a rectangular region in the image rapidly by simple addition and subtraction of four pixels locations. Once the image has been t ransformed, a series of classification filters are used . These filters are arranged such that the initial filters are simple and fast algorithms that are not necessarily accurate, but they are extremely effi cient at rejecting most of the less probable features. As the process continues, more sophisticated classifiers are used that require more processing power, but the amount of features that are actually processed is greatly reduced. 15
11 of 17
American Institute of Aeronautics and Astronautics

0 Cl
:! 0 ..... _.
B. Guidance
The slung load portal ent ry maneuver has several important elements:
1. The destination (end point of the maneuver), is based on a real-time updating estimate of the location of t he portal. As t he slung load moves closer to t he portal, t he relative position estimate is becoming more and more accurate (since the affect of camera attitude errors diminish).
2. It was deemed unacceptable for t he aircraft to fly at a constant speed during this maneuver, since it should be going very slow as it arrives at the window (on the order of 1 ft. per second), but it would not be acceptable to go that slow for t he whole approach (which involves a distance of 140 feet). As a result , the commanded speed is reducing at a constant rate (constant deceleration) during all but the beginning and end of the approach.
3. The heading of t he helicopter is utilized to cont rol the heading of the slung load. Due to the long wires (100 feet ) t his is a very under-actuated system. It was not unusual for there to be more than a 30 degree offset between the helicopter and the slung load due to the effect of wind. Also, the achievable bandwidth is relatively low.
4. After the slung load has gone a prescribed distance beyond the estimated location of t he portal (note this means the camera loses lock on the portal short ly before this, since the camera actually enters the window) wit hout the slung load bump switch tr iggering, then t he maneuver logic declares the ground robot inside the portal and triggers t he dropping of t he ground robot. The helicopter is then told to move directly backwards a prescribed distance to avoid tangling of the slung load with the opening.
5. If the bump switch on t he slung load is trigger or the image processor loses lock on t he portal the system will back off and retry, as described above.
VI. Ground Robot
The rover developed for the surveying of t he interior of t he building is shown in Figure 10. The rover hardware consists of
• 1.3 Megapixel Axis Networks ethernet camera
• Asus WL-330gE wireless access point
• Gumstix miniature computer with 2 ethernet port and 2 serial port extensions
• Pololu Serial 8-Servo Controller
• 4 Infrared proximity switches
The infrared proximity sensors are used for navigation, two downward looking sensors mounted on each side of the rover and t he other two sensors are pointed to the sides of the rover. The downward sensors are used to detect ledges so the rover does not drive down steps and to detect when the rover is upside down so the rover can initiate a flipping maneuver. The sideways sensors are used to detect when the rover is approaching a wall.
At the beginning of the building approach phase the rover's role is to be the hardware interface between the main vehicle and the slung-load. This is achieved by using an umbilical cord , i.e a connection that is severed when the rover is released , to t ransmit t he signals to the servos mounted on the slung-load. Once in posit ion for t he beginning of the building entry approach, t he GTMax sends a signal to the rover to init iate the slung-load repel. Once t his phase is completed, t he helicopter init iates t he building entry approach, at this point the rover camera is used for the window tracking. To minimize latency, and to simplify the interface to t he rover camera, the rover computer is configured to operate as a network bridge allowing direct access to the rover camera. Once released, the rover starts surveying the interior of the building using a random map exploration algorithm. This approach is implemented as a finite state machine where t he rover switches between the states at random times (or when certain events are triggered). The two states that allow the whole interior of the building to eventually be explored are the wall following state and the wall bouncing state. In wall following the rover proceeds whilst keeping one of t he proximity sensors in constant
12 of 17
American Inst i t u te of Aeronautics and Astronautics

0 Cl
:! 0
"' _.
Figure 10. CAD mode l of the GTRover.
view of t he wall. This state makes it possible for the rover to move from room to room t hrough doors and thus explore all rooms in the building. The second state is a wall "bouncing" state in which the rover t ravels in a strait line and init iates a random t urn once it detects its proximity to one of the room walls. This state allows the rover to move away from the walls and have a better view of the interior of the room it 's exploring. In order to obtain imagery of the interior of the building, the rover switches to a picture taking state. In this state, the rover stops, this guarantees t hat the pictures are not blurred , acquires an image and attempts to transmit this image to the U AV. If the transmission of the image fails the rover buffers the image and proceeds until it regains link wit h the UAV, at which t ime it will then t ransmit all buffered images.
VII. Mission Manager
Upon reaching the target site, the mission manager generates a waypoint list in order to map the disignated area through the use of an onboard camera looking for t he prescribed symbol. During the mapping phase, a database of the area is used to fly a trajectory around each building in order to examine individual building faces with the side/ down looking camera (camera pointing out left side of aircraft , down 45 degrees) . A relatively slow 15 feet/second is used for t he speed, to obtain mult iple images of the same location for the purposes of image processing. All buildings are searched with a single counter-clockwise pass at a prescribed distance and altit ude (100 feet ). Symbol finding results are recursively sorted to obtain most probable location of the symbol in t he search area. This best fi t is cross referenced with t he building database to select the target building candidate. The ground t rack after searching all 15 buildings in simulation is shown in Figure 11.
Figure 11. Ground trac k afte r se arching 15 buildings, ge tting side-pointing camera vie w of all walls of all buildings.
A detailed search of the best building candidate is t hen performed to locate any open portals. A process similar to the symbol finding is used, although only a single pass of the single candidate building. In this case, mult iple portal candidates are potentially found in any given image, and multiple opening locations are tracked. The best overall fit of size, aspect ratio, orientation, and darkness is used to selected the desired
13 of 17
American Insti t u te of Aeronaut ics and Astronaut ics

0 Cl
:! 0
"' _.
opening to attempt entry with the rover. A flight path is generated by t he mission manager to place the aircraft 100 feet above and in front of the selected portal. The slung load system is then lowered 100 feet on two wires while at the same t ime the aircraft is commanded to climb 100 feet to 200 feet. The sub-vehicle is t hen delivered into the building through an opening and performs a search pattern utilizing specialized guidance described above, accomplished by real-time tracking from the camera in the ground robot that is at the front of the slung load system. Once dropped inside the building, images from the ground robot are relayed through the primary flight vehicle to computers residing on the ground for personnel to view at the launch site. The helicopter itself automatically backs off from the building after ground robot release to act as a communication relay. There is a bump switch at the front of the slung load which, if triggered, causes the ground robot release to abort (presumable a closed window or a miss) and the aircraft backs off 100 feet and retries. Because it reinit ializes the image processing lock, the retry may be on a different portal.
VIII. Simulation and Flight Test Results
All of the system algorithms and code were developed and tested within the simulation tool described in Ref. 9. The window tracking algorithm was one of t he more complicated to develop and test since it involved all parts of the system, which had to work in perfect syncronization. The main onboard computer measured/ estimated the boom twist and target location as well as generate the proper guidance commands based on these estimates. The secondary computer executed the image processing algorithms which used images captured by the ground robot camera. Futhermore, t he ground robot was used to control t he boom rappeling and ground robot release. By testing all these algorithms within t he simulation, the closed loop behaviour of the system could be tested prior to flight testing. Figure 12 shows a screenshot of the simulation during a window approach.
Figure 12. Screen shot of the GTMax simulation during a window approach. The t op left w indow shows a view of the boom approaching the building. The top right window is a map of the town with the approach trajectory and estimated location of the window and various vehicle t e lemetry. Bottom le ft window is the simulated ground rove r came ra which is u sed a the source to the image processing r esults on the bottom right. The r ed and green squares are the image processor results and the estimat e d position of the window r espective ly.
Figure 13 shows some reuslts from this window approach. During this approach, the window tracking image processor switched the window t hat it was t racking at t ~= 106s to t he window directly below. From the plots we can see that the lateral estimation error converges to under l.5ft , which considering a valid opening is 3ft wide is enough to insert the ground robot. Furthermore, at the switch time we see the jump in vertical estimation error which then quickly converges to zero. The large error in range is attributed to errors
14 of 17
American Inst i t u te of Aeronautics and Astronautics

0 Cl
:! 0
"' _.
in estimating t he size of t he window. When far from the wall and t racking the top window, t he windows appear square and the image processor correctly captures the size of the window. As seen in Figure 12 when closer to the wall and tracking the lower window, the window appears as a trapizoid and the image processor incorrectly estimates the size of the window.
-2 ........................ -
"' ~ -3 I:
" - 4 ........................ -
80 90 100 110 120 130 14 time[ sec]
,_:t .. ~7·™1 j 70 80 90 100 110 120 130 14
time[ sec]
= j --· height estim.ation error I 10
¥ 5 ......... . . ... . . Q;
0 ........................ -
-5 '--~~--'-~~~_.._~~--"~~~-"-~~~..__~~-'-~~--'
70 80 90 100 11 0 120 130 14 time[ sec]
F igure 13. Estimation results for a w indow approach. Target window swit ched at t ~ 106s. At t > 128s w indow position es timat e is not updates anymore due to loss of lock on w indow during approach t erminal phase .
During the the IARC competition held at Ft. Benning, the described system was flown once before the actual competition and four t imes during the competition. On all the flights the first phase of the mission was performed flawlessly. Once approaching the town, the symbol searching algorithm was turned on and managed to detect the symbol on all but the t hird competition flight. On this flight , the shape matching algorithm managed to detect the symbol, but this result was later rejected by the classifiers due to improper brightness. In subsequent flights, the allowed variance in brightness was increased, so the system could track low confidence matches if no other higher confidence results existed. Furt hermore, during t he third competition flight, since no symbol was found, a failsafe mechanism incorporated into the mission manager chose a default building to insert the ground robot into, t his was unfortunately the wrong building for the specific mission. The window finding algorithm worked without problems on all five flights, for most of the flights the window chosen was the ideal window for the next phase of the mission (window tracking/ approach). On the last competition flight , the window finder chose the correct wall, but chose the window on t he extreme left which resulted in a failed window approach as explained below. Finally, the window approach , t he most complicated step in the mission, managed to operate in a decent manner. Unfortunately, on each of the four attempts a different part of the window approach did not operate optimally which resulted in a decent approach , but not enough to insert t he ground robot into a valid opening. The magnetometer which was used to measure the slung load twist was added on t he practice day, and t herefore was only tested once during the practice test on the day prior to the competit ion. On the first competition at tempt , due to an error in packing t he boom, it did not reppel horizontally and ended up with a significant twist. The heading control on the helicopted managed to correct t his slightly, but the boom arrived at t he wall with the wrong heading. Furt hermore, due to poor image processing results on t he practice flight , the window tracking image processing results were being ingnored on this approach. This resulted in the window posit ion estimate not being updated and the boom being steered to the init ial estimate of the window location as determined by the window finder. During t he second attempt a faulty wireless modem failed to transmit boom heading information. The third attempt , after major fixes to the window approach system, worked much better. The window tracking algorit hm tended to lock onto objects t hat weren't neccecarly windows. Furthermore, the window t racker seemed to overestimate the size of the objects it was t racking which resulted in a range bias. Finally, on this approach a dark square on the ground in front of the building was tracked, and the
15 of 17
American I nsti t u te of Aeronaut ics and Astronaut ics

0 Cl
:! 0
"' _.
rover was dropped ontop this square. On the final competit ion attempt, there was a siginificant error in the boom heading estimate. There are different reasons this error could have resulted, limited calibration of the newly added magnetometer, but these reasons were not investigated further. The error in boom heading and the choise of entry point to the building by the window finder as described earlier , resulted in the window tracker locking onto a different building next to the chosen building. Furthermore, during this attempt , the slung load wires came in contact with overhead wires and the attempt was aborted.
IX. Conclusions
1. The use of proven navigation, control, and other systems. The addition of automatic generation of the desired t rajectory by onboard systems implies t hat the underlying systems are effective and tolerant of a wide array of inputs. In addit ion, it is important that the bandwidth of these underlying systems is fast compared to what needs to be achieved by t hese outer loop guidance policies.
2. The use of full closed-loop simulation allowed for easy developement and validation of the various algorithms. Although the use of synthetically generated images cannot be used to determine the performance of an image processing algorithm, it allows for the testing of the full closed loop functionality of the other system components.
3. One important feature that was incorporated into the simulation tool early in the developement was the ability to record data from various sensors during flight , and then "play back" this data in the simulation. This allowed further , more rigorous, testing of various algorithms within a lab setting. This also increased the efficiency in which flight tests were conducted, since a flight test could be replayed in the lab until all problems were addressed and only t hen would a follow up flight test be scheduled.
4. Avoidance of unnecessary complexity. To facilitate development, testing, and a useful place for human operators (even if they are only monitoring) it was helpful to design the simplest system possible that could achieve the desired behaviors. In particular unnecessary modes of operation were avoided in all parts of the system.
5. Communication of intent. Care should be taken in choosing what information is shown to the human operator when the unmanned system is developing its own path to fly. It was found to first make sure the human operator can easily determine the health and state of t he systems developing t his path. Second, some information about t he predicted path can helpful, although perhaps in a non-traditional form.
X. Acknowledgments
The authors wish to t hank all the people whose help contributed directly to the work described in this paper. The members of the GerogiaTech Aerial Robotics team past and present: Allen Wu, Alison Proctor, Suresh Kannan, Girish Chowdhary, Claus Christman, D. Mike Sobers, Halden Gates, Brendan Andrus, Jeong Hur, Henrik Chistophersen and Wayne Pickell t hat have had major impact on the developement of this system. Furthermore, t here was also specific assistance on the au tomatic precise placement of slung loads that was developed by other individuals for project not directly related to t he IARC including Morten Bisgaard for the initial development of a slung load model and controller, to Jehoon Lee, Jin-Cheol Ha and Allen Tannenbaum for t he development of image processing algorithms and to Yoko Watanabe for the developement of Vision-Based navigation schemes. Also the authors would like to thank all the people that have supported the work of the GeorgiaTech UAV Research Facility over the years.
References
1 US-DoD, "Unmanned systems roadm ap 2007-2032," Tech. rep. , 2008, http://purl.access.gpo.gov/ GPO/ LP S91893. 28aldor, L . C., "Report: UAV use has doubled over 9 months," 2008, http://www.armytimes.com/ news/ 2008/ 01/ ap_uavJl80101 /. 30 pall-Rome , 8., "Israel AF Hones Manned-UAV Mix," 2008, htt p: //www.defensenews.com/ story.php?i= 3617494. 4 Andrus , 8 ., Chowdhary, G. , C hr istophersen , C. H. C. H. 8 . , Gates, H. , J ohnson , E. N., Kannan , S. K., Pickell, R . W. ,
Rooz, N., Sobers, D. M., and Wu, A. D., "Development of an Autonomous Aerial R econnaissance System for Urban Environment s," 2008.
16 of 17
American Institute of Aeronautics and Astronautics

0 Cl
:! 0
"' _.
5Johnson , E. N. and Schrage, D. P., "System Integration and Operation of a Research Unmanned Aerial Vehicle," Journal of A erospace Computing, Information and Communication, Vol. 1, No. 1, Jan 2004, pp. 5-18 .
6 "Offic ia l Interna tiona l Aerial R obotics Com petit ion Webs ite," htt p:/ / ia rc.angelstrike.com / oldauvs/IARCLaunchPoint.html. 7Ditt rich , J. and Johnson , E. , "Multi-Sensor Navigation System for an Autonomous He licopte r ," Proceedings of the 21st
Digital Avionics Systems Conference, 2002. 8 J ohnson , E. and Kannan, S., "Adaptive trajectory control for autonomous he licopte rs," Journal of Guidance, Control,
and Dynamics, Vol. 28, No. 3, 2005, pp. 524-538. 9 K annan, S. K. , Koller, A. A. , and J ohnson , E. N. , "Simula tion and Development Environment fo r Multip le Het erogeneoxus
UAVs," AIAA Modeling and Simulation Technology Conference, No. AIAA-2004-5041 , Providence, Rhode Island, Augus t 2004. lO Halcon/C++ Reference Manual [online], MVTec Software GmbH, http://www.mvtec.com. 11Sh i, Y. and Clem Ka rl, W., "Real-time tracking using level set s," Vol. II , 2005, p p. 34 - 41. 12Song, B. and Chan , T ., "A fast a lgorithm for level set based optim ization," CA M-UCLA, Vol. 68, 2002, pp. 200- 2. 13 C h an, T . F. and Vese, L. A., "Active contours without edges," IEEE Transactio ns on Im age Processing, Vol. 10, No. 2,
2001 , pp. 266 - 277. 14Wagter, C. D., P roctor , A. A. , and Johnson , E. N. , "Vision-Only Airc raft Flight Control," AIAA Digital Avionics Systems
Conference, No. 882, Ind ianapolis, I N, Oct ober 2003. 15P roctor , A. A. , J ohnson , E. N., and Apker, T . 8 ., "Vis ion-on ly control and guidance for a ircraft ," Journal of Field
Robotics, Vol. 23, No. 10, 2006, pp. 863-890.
17 of 17
American Institute of Aeronautics and Astronautics