Experience with Data Analysis Programs: DAWN, DPDAK...
60
Experience with Data Analysis Programs: DAWN, DPDAK and Mantid Gero Flucke FS-EC PETRA III Commissioning Meeting April 2nd, 2014 Gero Flucke (DESY) Comparison of Data Analysis Programs 2.4.2014 1 / 58
Transcript of Experience with Data Analysis Programs: DAWN, DPDAK...

Experience with Data Analysis Programs:DAWN, DPDAK and Mantid
Gero Flucke
FS-EC
PETRA III Commissioning MeetingApril 2nd, 2014
Gero Flucke (DESY) Comparison of Data Analysis Programs 2.4.2014 1 / 58

OutlineIntroductionOverview of Analysis Programs:
DAWNDPDAKMantid
Summary
Gero Flucke (DESY) Comparison of Data Analysis Programs 2.4.2014 2 / 58

IntroductionData rates in modern X-ray experiments are rising.⇒ Raw data might not be “exportable” to users’ institutes.
Groups with little X-ray physics background lessexperienced with “standard” data analysis.Standardisation of data format envisaged: NeXus.How to react at DESY?⇒ Provide central data processing?⇒ Provide “standard” data analysis tools?
⇒ Investigate existing analysis tools!
Note: Within the framework of thePhoton and Neutron data infrastructure initiative.
http://pan-data.eu
Gero Flucke (DESY) Comparison of Data Analysis Programs 2.4.2014 3 / 58

Investigation of Analysis Programs
Candidates: DAWN, DPDAK, Mantid.See what the programs provide,
but need analysis guidance,⇒ example scenario:
Real space analysis of amorphous material,thanks to J. Bednarcik (P02.1) for data and beam time!
All programs share Python as analysis scripting language:⇒ write/(re)use tool independent code base in all programs!
Notes:My physics background is outside X-ray analysis, beingfamiliar with ROOT (http://root.cern.ch) for analysis,I spent more time on DAWN than on the other programs.
Gero Flucke (DESY) Comparison of Data Analysis Programs 2.4.2014 4 / 58

Real Space Analysis of Amorphous Material
Changing conditions: temperature, pressure,. . .Capable of online monitoring.
combineinfo from
many images
2D Image
integrate
Diffractogram background,absorption,
normalisation,fluorescence
Norm. ElasticScattering Int.
TotalStructure Factor
sine Fouriertransformation
Reduced PairDistribution Function Shell Positions
centre of gra-vity of peaksabove zero
VariousInput
Tabulated AtomicScattering Factor,
Sample Composition
calculate
Time/Temperature/...Dependence
Icoh(q) [e.u.]
Calibration(Fit2D or the like),
Mask
IntegrationRange
I(q) [a.u.]I(x,y) [a.u.]
S(q)
...
G(r) [1/A2]
r1,r2,r3,
r1(t),r2(t),r3(t),... ...
Gero Flucke (DESY) Comparison of Data Analysis Programs 2.4.2014 5 / 58

DAWN: Data Analysis WorkbeNchEclipse based program⇒written in Java (requires Java 1.7).“Implements sophisticated support for:
Visualization of data in 1D, 2D and 3D,Python script development, debugging and execution,Workflows for analyzing scientific data calling Python andbinary codes.”
Main developers from Diamond and ESRF.Open source: EPL or Apache license (getting rid of (L)GPL).Open to external collaborating developers.“By and for the synchrotron community - overlap with othercommunities like neutron scattering, photon science, etc.”Supported platforms:Windows, Mac OS (beta version only), Linux.
http://www.dawnsci.orghttp://hasyweb.desy.de/services/computing/dawnDocu
Gero Flucke (DESY) Comparison of Data Analysis Programs 2.4.2014 6 / 58

DAWN
ConceptGUI is based on “Perspectives” and “Views”.View: tab in a frame of the DAWN window, e.g.
a plot, contents of a file/directory, a tool...Perspective: groups views suitable for some task, e.g.
data browsing, python scripting,. . .user can add or remove views.
User’s data organised in “Projects”.Projects and status stored in “Workspace”(default: $HOME/workspace).Many “Cheat sheets”: built-in tutorials.Feedback button – tell the developers
what does not work,what would be nice to have.
Gero Flucke (DESY) Comparison of Data Analysis Programs 2.4.2014 7 / 58

DAWN
Note: mostly tested with version 1.4.0 - there is 1.4.1 and soon 1.5.0.
Many Interactive FeaturesBrowsing many data formats: Nexus/HDF5, images, .edf,ascii, . . . .fio (for DESY version)Investigate multi-D datasets:
1D curves: value vs index or vs value of other dataset’value’ can be expression of datasets.
stack of lines, stack in 3Dslices of multi-D datasets,2D: as surface, as image (featureful colour mapping [fornon-RGB images], pixel ’averaging’)various nice zoom/panning features,
Masking: creation, storage, automatic application. . .
Gero Flucke (DESY) Comparison of Data Analysis Programs 2.4.2014 8 / 58

DAWN
Many Interactive Features (ctd.)Distribution fitting
finding and fitting peaks,fitting polynomials,arbitrary function fitting not working (but will be in 1.5),no fitting of 2D.
Region of interest and profiles: line, box, sector,. . .Specific scientific methods:
calibration for 2D→ 1D integration (Fit2D) will be in 1.5,many methods go as perspectives into Diamond version(ESRF?).
Time needed to find out how things work (as to be expected).Things do not always work as they should,
but feedback highly appreciated by development team!
Gero Flucke (DESY) Comparison of Data Analysis Programs 2.4.2014 9 / 58

Guided Tour through DAWN: First Screen
Gero Flucke (DESY) Comparison of Data Analysis Programs 2.4.2014 10 / 58

DAWN: Image Browsing
Gero Flucke (DESY) Comparison of Data Analysis Programs 2.4.2014 11 / 58

DAWN: Image Browsing
Easily check range of values in (here: image) dataset.
Gero Flucke (DESY) Comparison of Data Analysis Programs 2.4.2014 12 / 58

DAWN: Colour Scale
Full interactive control of colour mapping and outliers to ignore.
Gero Flucke (DESY) Comparison of Data Analysis Programs 2.4.2014 13 / 58

DAWN: Slice Datasets
Here: Sum of 5 consecutive slices.
Gero Flucke (DESY) Comparison of Data Analysis Programs 2.4.2014 14 / 58

DAWN: Surface Plot
Live 3D view (instantly updated):Rotate as you want.Select a box
Gero Flucke (DESY) Comparison of Data Analysis Programs 2.4.2014 15 / 58

DAWN: Line Profile
1D plot updated instantly if mouse moves line.Gero Flucke (DESY) Comparison of Data Analysis Programs 2.4.2014 16 / 58
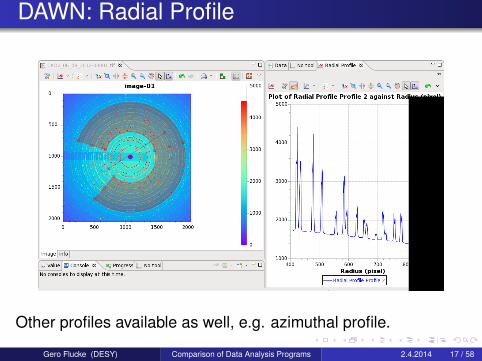
DAWN: Radial Profile
Other profiles available as well, e.g. azimuthal profile.
Gero Flucke (DESY) Comparison of Data Analysis Programs 2.4.2014 17 / 58

DAWN: Masking
Choose regions, upper/lower masks, ’by hand’,. . .Gero Flucke (DESY) Comparison of Data Analysis Programs 2.4.2014 18 / 58

DAWN: Line Profile Masked
Mask taken into account in profiles.Gero Flucke (DESY) Comparison of Data Analysis Programs 2.4.2014 19 / 58

DAWN: Peak Fitting
Interactively define range and maximum number of peaks to be fitted(can be many!).
Gero Flucke (DESY) Comparison of Data Analysis Programs 2.4.2014 20 / 58
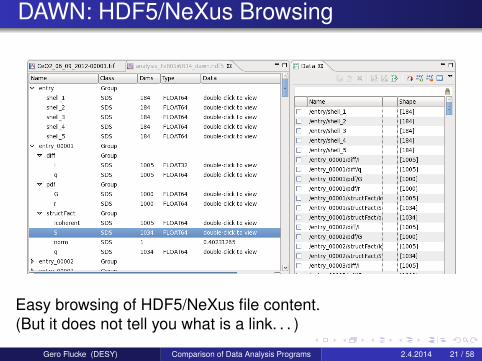
DAWN: HDF5/NeXus Browsing
Easy browsing of HDF5/NeXus file content.(But it does not tell you what is a link. . . )
Gero Flucke (DESY) Comparison of Data Analysis Programs 2.4.2014 21 / 58

DAWN: HDF5/NeXus Browsing
Simple selection what to draw as X, Y1 and Y2.(Non-default line styles a bit more complicated to achieve.)
Gero Flucke (DESY) Comparison of Data Analysis Programs 2.4.2014 22 / 58

DAWN: Python - Scripting Interface for Users
Interactive prompt (using IPython).Nice script development environment (Eclipse and PyDev)!(C)Python: usual Python (“reference implementation”),implemented in C.Jython: Same language, implemented in Java.
(C)Python in DAWNAccess to plotting, fileaccess for various formats.Use standard python tools- e.g. for function fitting.Access to DAWN Javacode possible via py4j(expert action).
Jython in DAWNAccess to plotting, fileaccess for various formats,fitting.No standard (C)Pythontools available!Simple to use any DAWNJava code?
Gero Flucke (DESY) Comparison of Data Analysis Programs 2.4.2014 23 / 58

DAWN: Python Development
Gero Flucke (DESY) Comparison of Data Analysis Programs 2.4.2014 24 / 58

DAWN: Workflows
Idea:graphically compose standard components (“actors”),to form a new analysis/data reduction procedure.
Actors forrequest user input,open files or monitor directories,flow control,mathematics operations or execute python code,plot or review plots,export to files,. . .
Can be run in batch mode, parallelised using threads.Interesting to use for monitoring procedure,
but I failed: little docu, not (yet) flexible enough, bugs,. . .
Gero Flucke (DESY) Comparison of Data Analysis Programs 2.4.2014 25 / 58

DAWN: Workflow Example
Gero Flucke (DESY) Comparison of Data Analysis Programs 2.4.2014 26 / 58

DAWN (1.5.0 beta): Diffraction Calibration
Gero Flucke (DESY) Comparison of Data Analysis Programs 2.4.2014 27 / 58

DAWN: Real Space Analysis/Monitoring
Use DAWN basically only forPython code development,graphics output.
Configuration using configuration file.Monitoring directory for new images:“borrow” DPDAK’s concept.Storing results on HDF5 file using h5py.Arrangement of “Views” stored as new “Perspective”.Miss mechanism to “softly” stop procedure,
needed to close HDF5 file properly.Control of plot appearance via Python very limited:
cannot change colour/style of lines, titles, legend,. . .no way (yet) to set proper legend entries
Plotting acceptably fast (required fix from DAWN developers).Gero Flucke (DESY) Comparison of Data Analysis Programs 2.4.2014 28 / 58

DAWN: Real Space Analysis/Monitoring
Gero Flucke (DESY) Comparison of Data Analysis Programs 2.4.2014 29 / 58

DAWN: Pros and Cons
Flexible multi-dimensional data display and interactive analysis,slicing, masking, profiling, fast 3D plots.
Browsing file content, e.g. HDF5.Python as scripting language(built-in development environment).Large support from Diamond and ESRF.OSGI plugin-based design is modular and thus flexible.
Java: difficult to import “external” algorithms.Fitting arbitrary functions not working yet.Still bugs hitting the user.Limited interface from Python to core functionalities(besides expert way via py4j).OSGI difficult to pick up until you understand it.
Gero Flucke (DESY) Comparison of Data Analysis Programs 2.4.2014 30 / 58

DPDAK:Directly Programmable Data Analysis Kit
Pure Python program using ‘standard’ Python packages:NumPy, SciPy, matplotlib, fabio, wxPython.
Developed in cooperation between DESY and MPIKG,for “(online) analysis of 2D scattering data”,standard tool at P03 (S. Roth) and for its users,author G. Benecke left end of January.
Supported platforms: Windows, Linux.Open Source, GNU GPL.
https://dpdak.desy.de
Gero Flucke (DESY) Comparison of Data Analysis Programs 2.4.2014 31 / 58

DPDAK: Concept
Minimalistic start-up GUI.Select and configure ’plugins’:
data processing steps,tools (data display etc.),data export.
Interfaces of processing plugins:input and output types, parameters,types: scalars, 1D arrays, strings,file/directory paths.
Processed data stored in ’database’:no check if data always identical,for images just their paths,interactive analysis via tools.
General image options:rotation, axis flipping, background.
Gero Flucke (DESY) Comparison of Data Analysis Programs 2.4.2014 32 / 58

DPDAK: Configure Data Processing Plugins
Select plugins from list.Select (matching) input.
Set parameters.
Gero Flucke (DESY) Comparison of Data Analysis Programs 2.4.2014 33 / 58

DPDAK: Image Display
Choose fromdatabase ofprocessed images(broken in v0.3.4,showing always thelast?).
Directly select file.Range of 2D→ 1Dintegration shown -and editable!
Gero Flucke (DESY) Comparison of Data Analysis Programs 2.4.2014 34 / 58

DPDAK: 1D Plots
Select x and y fromoutput of plugins.Many lines can beoverlayed.Choose result ofwhich processedimage to be shown.Stack of all lines alsopossible(broken in recentversion 0.3.4?).
Gero Flucke (DESY) Comparison of Data Analysis Programs 2.4.2014 35 / 58
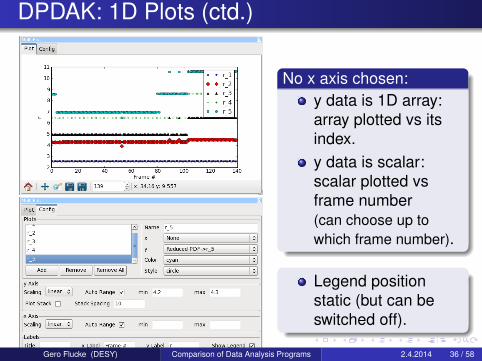
DPDAK: 1D Plots (ctd.)
No x axis chosen:y data is 1D array:array plotted vs itsindex.y data is scalar:scalar plotted vsframe number(can choose up towhich frame number).
Legend positionstatic (but can beswitched off).
Gero Flucke (DESY) Comparison of Data Analysis Programs 2.4.2014 36 / 58

DPDAK: 2D Plot of Distribution vs Time
Gero Flucke (DESY) Comparison of Data Analysis Programs 2.4.2014 37 / 58
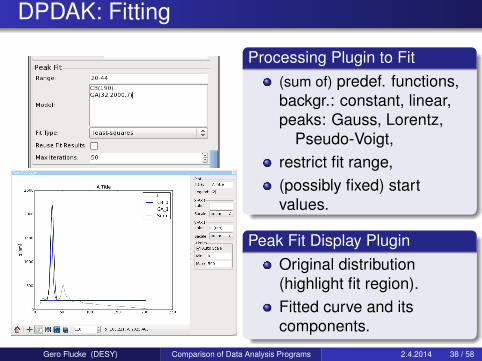
DPDAK: Fitting
Processing Plugin to Fit(sum of) predef. functions,backgr.: constant, linear,peaks: Gauss, Lorentz,
Pseudo-Voigt,restrict fit range,(possibly fixed) startvalues.
Peak Fit Display PluginOriginal distribution(highlight fit region).Fitted curve and itscomponents.
Gero Flucke (DESY) Comparison of Data Analysis Programs 2.4.2014 38 / 58

DPDAK: Real Space Analysis/Monitoring
DPDAK designed for that purpose:add data processing plugins,configure (including display plugins),run!
Already there:directory monitoring,2D→ 1D integration,storage of results as DPDAK ’database’(can be exported to ascii - completely or per plugin).
Gero Flucke (DESY) Comparison of Data Analysis Programs 2.4.2014 39 / 58

DPDAK: Real Space Analysis/Monitoring
Gero Flucke (DESY) Comparison of Data Analysis Programs 2.4.2014 40 / 58

DPDAK: Pros and Cons
Built to be extendible by user,and fulfils that promise (within boundaries. . . )!
Rather simple interface for new plugins.
How to handle multi-dimensional datasets?Does internal database scale with 10 thousands of images?Some intransparent shortcuts.Display plugins do not store configuration (could be added).Limited core support now that G. Benecke left.
Gero Flucke (DESY) Comparison of Data Analysis Programs 2.4.2014 41 / 58

Mantid
Framework for “high-performance computing andvisualisation of scientific data”.To “manipulate and analyse Neutron and Muon scatteringdata, but could be applied to many other techniques.”Main developers from ISIS and SNS.Written in C, C++ and Python(using scientific visualisation software “QtiPlot”).Open source: GNU General Public License.Each release can be cited with a digital object identifier.Supported platforms: Windows, Linux, Mac OS.
http://www.mantidproject.org
Gero Flucke (DESY) Comparison of Data Analysis Programs 2.4.2014 42 / 58

Mantid: Concepts
Data processing via algorithms working on workspaces.Once data loaded into a workspace
investigate interactively: 1D, 2D, 3D plots, 1D fits, slicesor call algorithms.
Store status (workspace, plots,. . . ) as ’project’.Smooth integration of Python as scripting language:
access algorithms,graphics control,extend Mantid by Python algorithms and fit functions,workspaces keep track of their history - as Python script,all but graphics available also outside MantidPlot GUI.
Visualisation of instruments.Good documentation for beginners (GUI plus Python).
Gero Flucke (DESY) Comparison of Data Analysis Programs 2.4.2014 43 / 58
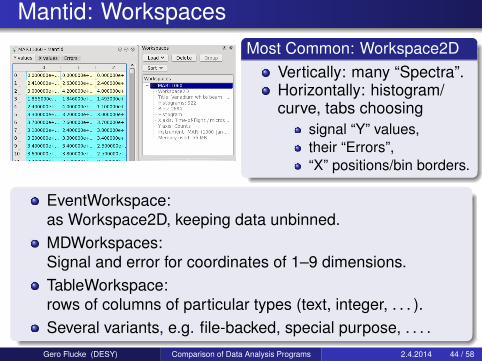
Mantid: WorkspacesMost Common: Workspace2D
Vertically: many “Spectra”.Horizontally: histogram/curve, tabs choosing
signal “Y” values,their “Errors”,“X” positions/bin borders.
EventWorkspace:as Workspace2D, keeping data unbinned.MDWorkspaces:Signal and error for coordinates of 1–9 dimensions.TableWorkspace:rows of columns of particular types (text, integer, . . . ).Several variants, e.g. file-backed, special purpose, . . . .
Gero Flucke (DESY) Comparison of Data Analysis Programs 2.4.2014 44 / 58

Mantid: Data Formats
Generic “Load” algorithm chooses proper sub-algorithm.No generic loader to browse arbitrary HDF5 files.No loader for image files.
MantidPlot can open image files.All I found: make a line profile.Nothing to create a workspace from an image.
Gero Flucke (DESY) Comparison of Data Analysis Programs 2.4.2014 45 / 58

Mantid: 1D Plots
Plotting needs input workspaces.Interactive control of plot appearance.Add (parametric) functions.May place plots next to each other in same window.
Gero Flucke (DESY) Comparison of Data Analysis Programs 2.4.2014 46 / 58

Mantid: 1D WaterfallMAR11060
MAR11060-sp-103MAR11060-sp-102MAR11060-sp-101
Coun
ts
0
100
200
300
400
500
600
700
T ime-of-flight / microsecond5,000 1e+04 1.5e+04 2e+04
Gero Flucke (DESY) Comparison of Data Analysis Programs 2.4.2014 47 / 58

Mantid: Axis with Break
Plot with axis break
exp(0.4 * x) 0.2 * x + 2 0.1 * x
Y ax
is: l
inea
r and
log 1
0 par
t
0
5
100
1e+04
X Axis T it le0 5 10 15 20 25 30
Gero Flucke (DESY) Comparison of Data Analysis Programs 2.4.2014 48 / 58

Mantid: “2D Colour Fill”
Workspace MAR11060
Spec
trum
0
200
400
600
800
1,000
100
1,000
T ime-of-flight / microsecond0 5,000 1e+04 1.5e+04 2e+04 2.5e+04
Workspace im
Spec
trum
0
500
1,000
1,500
2,000
2,500
0
2,000
4,000
6,000
/ -500 0 500 1,000 1,500 2,000 2,500
Default colour scale does not exclude outliers.Also 3D views available (first display slow).
Gero Flucke (DESY) Comparison of Data Analysis Programs 2.4.2014 49 / 58
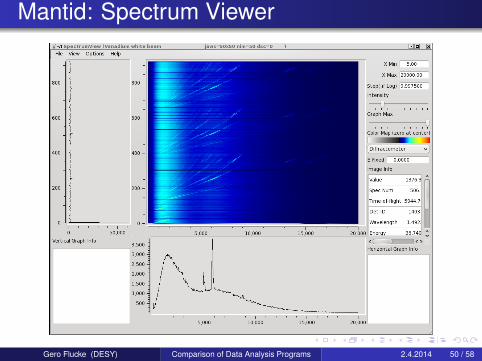
Mantid: Spectrum Viewer
Gero Flucke (DESY) Comparison of Data Analysis Programs 2.4.2014 50 / 58

Mantid: 1D Fitting
Data Fit function Difference: data - fit
Coun
ts
0
100
200
300
400
500
d-Spacing / Angstrom2 2.2 2.4 2.6 2.8
Graphically choose fit range.Compose fit function: various background and peak types.Graphically choose start values of peaks.Graphical result includes difference “data minus fit”(and possibly individual components).Fit result and errors (incl. normalised covariance matrix)available as workspace.
Gero Flucke (DESY) Comparison of Data Analysis Programs 2.4.2014 51 / 58

Mantid: 1D Fitting (ctd.)
Many optionsFit function composed ofarbitrary amount ofcomponents.Rich set of predefinedfunctions.Define your own function (e.g.implemented in Python).Tie parameter values tofunctions of other parameters.Fix parameters.. . .
Gero Flucke (DESY) Comparison of Data Analysis Programs 2.4.2014 52 / 58

Mantid: Miscellaneous
Masking? There is something I did not investigate.Poor Python editor (but can use external one).Python algorithms are not really object-oriented - problem:
CPU-intense initialisation,two different configurations in one data processing chain.
Cannot reset python terminal once I messed it up. . . (?)
Gero Flucke (DESY) Comparison of Data Analysis Programs 2.4.2014 53 / 58

Mantid: Real Space Analysis/MonitoringMake use of algorithm/workspace concept.Write algorithms in Python:
LoadImage, using fabio,other using “common code base”,Fourier transformation from S(q) to G(r) already in Mantid.
(Ab)use Workspace2D even for images(waste of space: errors, “X” values).One master algorithm “RealSpaceMonitor”:
Configured via configuration file (not really Mantid style).
Gero Flucke (DESY) Comparison of Data Analysis Programs 2.4.2014 54 / 58

Mantid: Real Space Analysis/Monitoring
Master Algorithm RealSpaceMonitorWatching directory (“borrow” DPDAK’s logic again).Calling other algorithms.Write HDF5 output file (using h5py).Report progress (and catch cancellation to flush HDF5 file).Doing graphics output.Large control of line plots:common window, axes, legend, . . .2D image plot in extra window:
no control of appearance from Python,slow.
Gero Flucke (DESY) Comparison of Data Analysis Programs 2.4.2014 55 / 58

Mantid: Real Space Analysis/Monitoring
Gero Flucke (DESY) Comparison of Data Analysis Programs 2.4.2014 56 / 58

Mantid: Pros and Cons
Deep integration of Python as scripting language:can extend MantidPlot!
Lots of graphics control (interactively and via Python).Flexible function fitting with error propagation.Version control via doi.
No built-in image handling.Workspace concept may not be flexible enough,
but did not investigate too much the multi-dimension version.Neutron and muon scattering driven:
set of available algorithms,workspaces with signal (counts. . . ) and error,wording.
Gero Flucke (DESY) Comparison of Data Analysis Programs 2.4.2014 57 / 58

SummaryAll three programs have their own value.DAWN has the potential to cover standard needs of X-raydata analysis tasks, but suffers from limited extendability byusers and (still) little bugs.DPDAK has proven itself in praxis and is extendible bydesign, but is not ’complete’ and might fail formulti-dimensional data sets.Mantid provides great integration of user (Python)extensions, good control of plotting, and a professionalfitting interface, but is currently driven by neutron/muonscattering needs.
OutlookPlan to exercise a SAXS analysis procedure as well.
Gero Flucke (DESY) Comparison of Data Analysis Programs 2.4.2014 58 / 58

What to Do to Test on Your Own?
DAWN, DESY Version (i.e. .fio Format Aware)Login on workgroup server p3-wgs12.Run/scratch/DawnVanilla-1.4.1.v20131212-1003-linux64/startDawn.sh.Note that it redirects the workspace to/scratch/$USER/dawn/workspace( $USER is your login name).Or try a more recent, but probably less stable version thatsupports reading of .fio files even from CPython:/scratch/DawnVanilla-1.5.0.v20140326-1353-linux64/startDawn.sh.
MantidA bit more complicated - please contact me. . .
Please contact me ([email protected]) if you need help.Gero Flucke (DESY) Comparison of Data Analysis Programs 2.4.2014 59 / 58

What to Do to Test on Your Own? (ctd.)
DPDAK - WindowsFollowhttps://dpdak.desy.de/index.php/Install_dpdak_v0.3.2#Binary_Package.I did not test that. . .
DPDAK - LinuxLogin on workgroup server p3-wgs12.Download ’Source/Linux’ from https://dpdak.desy.de.Put the *.tar.gz file into SOME/DIRECTORY.cd SOME/DIRECTORY
tar xzf dpdak-dpdak.tar.gz
python dpdak/main.py
Please contact me ([email protected]) if you need help.Gero Flucke (DESY) Comparison of Data Analysis Programs 2.4.2014 60 / 58