VITAL PULP THERAPY Includes: Indirect Pulp Therapy Direct Pulp Cap Pulpotomy Apexification.
David Morgan, CPI, Presentation to xxxxxx, 28 March 2008
Experience of the Paper & Pulp Sector within CCA
Steve FreemanEnergy & Environment Manager
Confederation of Paper IndustriesUnited Kingdom
David Morgan, CPI, Presentation to xxxxxx, 28 March 2008
2
Talk Coverage
• UK paper sector• Development of CCAs & other energy schemes• Impacts on the UK sector• Scheme management• Data management• Trading• Summary
David Morgan, CPI, Presentation to xxxxxx, 28 March 2008
3
The UK Paper & Pulp Sector• 2001 - 90 paper mills, producing 5.5m tonnes• 2010 - 50 paper mills, producing 5.0m tonnesOverall UK consumption 12-13m tonnes (& declining), with
most imports coming from other parts of the European Union
Only two UK pulp mills – all others use recycled paper or imported pulp
High recycling rates - but over 50% exported
David Morgan, CPI, Presentation to xxxxxx, 28 March 2008
4
Energy use in the sector• Extensive use of CHP (due to steam required for drying)
– gas/biomass/waste fired – either owned by the mill or a third party (issues with target boundaries)
• Direct firing mostly gas (only one coal mill)• If grid purchased electricity – approx Gas 52%, Coal
16%, Nuclear 27%, Renewables 5%• Total energy about 20 terra watt hours & falling • Total energy use 35% less that 1990 (4.5m t)• Energy plus raw materials & labour key variables• Energy cost impacts on international competitiveness
David Morgan, CPI, Presentation to xxxxxx, 28 March 2008
5
Background• CCAs first actual govt set targets for energy efficiency• Voluntary agreements and give 80% tax relief of CCL
for achievement of sector targets which reduce either energy or emissions
• 50 sectors across industry and mostly adopted specific energy (kWh/t) targets (not carbon targets)
• Required to pass 5 biennial milestone targets (plus the later addition of 2 extra annual targets for those opted out of EU ETS Ph I)
• CCA are valuable – current estimate is the value of the levy discount to the sector is approx £15M p.a. or over 2001-2012 about £180 Million
• Value to a small mill today 7% of its annual energy bill
David Morgan, CPI, Presentation to xxxxxx, 28 March 2008
6
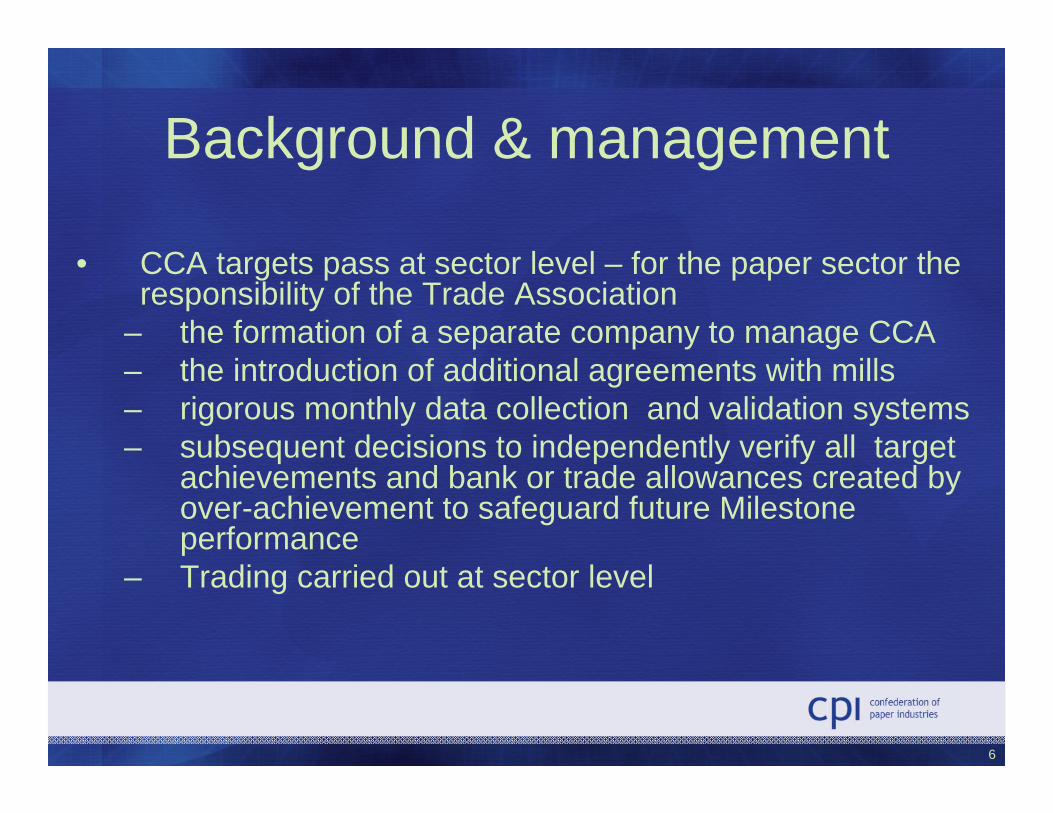
Background & management
• CCA targets pass at sector level – for the paper sector the responsibility of the Trade Association
– the formation of a separate company to manage CCA– the introduction of additional agreements with mills– rigorous monthly data collection and validation systems – subsequent decisions to independently verify all target
achievements and bank or trade allowances created by over-achievement to safeguard future Milestone performance
– Trading carried out at sector level
David Morgan, CPI, Presentation to xxxxxx, 28 March 2008
7
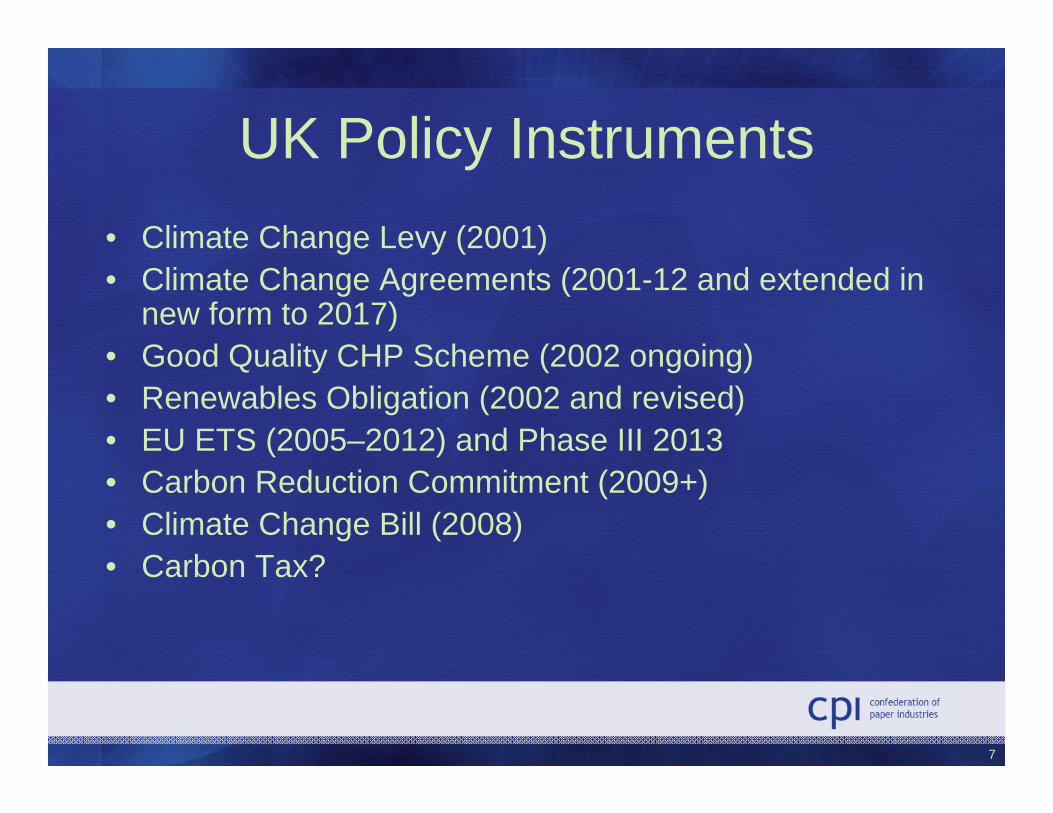
UK Policy Instruments• Climate Change Levy (2001)• Climate Change Agreements (2001-12 and extended in
new form to 2017)• Good Quality CHP Scheme (2002 ongoing)• Renewables Obligation (2002 and revised)• EU ETS (2005–2012) and Phase III 2013 • Carbon Reduction Commitment (2009+)• Climate Change Bill (2008)• Carbon Tax?
David Morgan, CPI, Presentation to xxxxxx, 28 March 2008
8
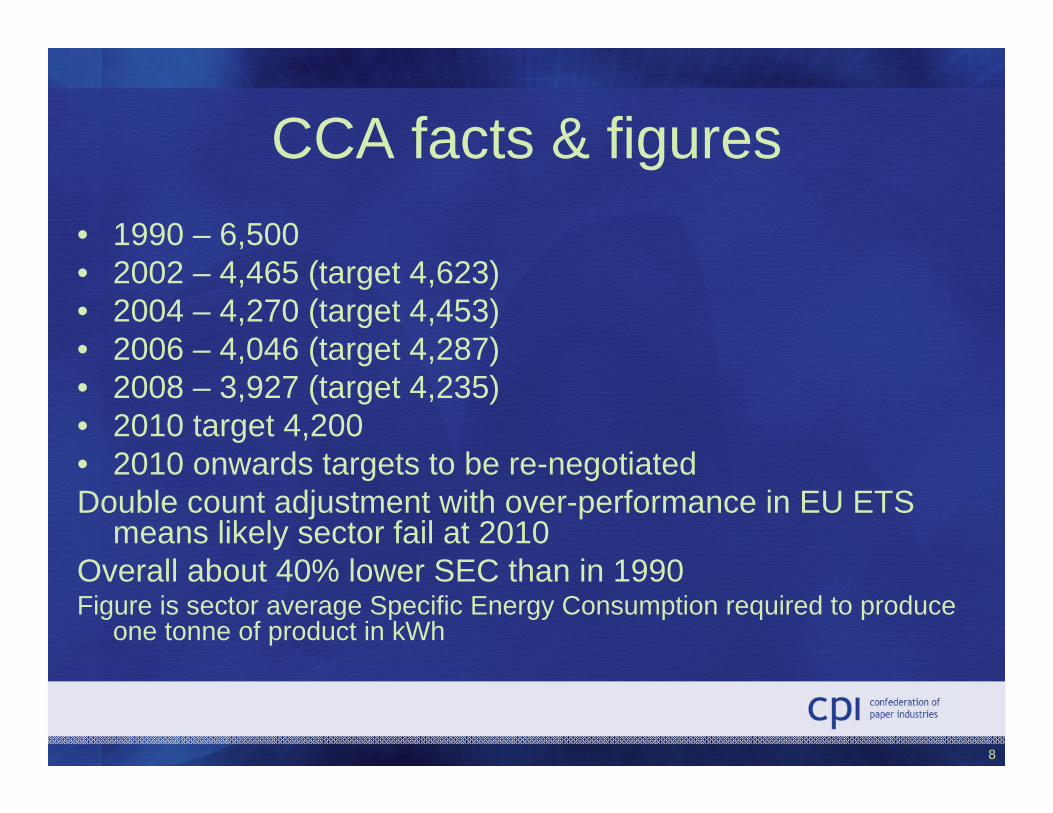
CCA facts & figures• 1990 – 6,500 • 2002 – 4,465 (target 4,623)• 2004 – 4,270 (target 4,453)• 2006 – 4,046 (target 4,287)• 2008 – 3,927 (target 4,235)• 2010 target 4,200• 2010 onwards targets to be re-negotiatedDouble count adjustment with over-performance in EU ETS
means likely sector fail at 2010Overall about 40% lower SEC than in 1990Figure is sector average Specific Energy Consumption required to produce
one tonne of product in kWh
David Morgan, CPI, Presentation to xxxxxx, 28 March 2008
9
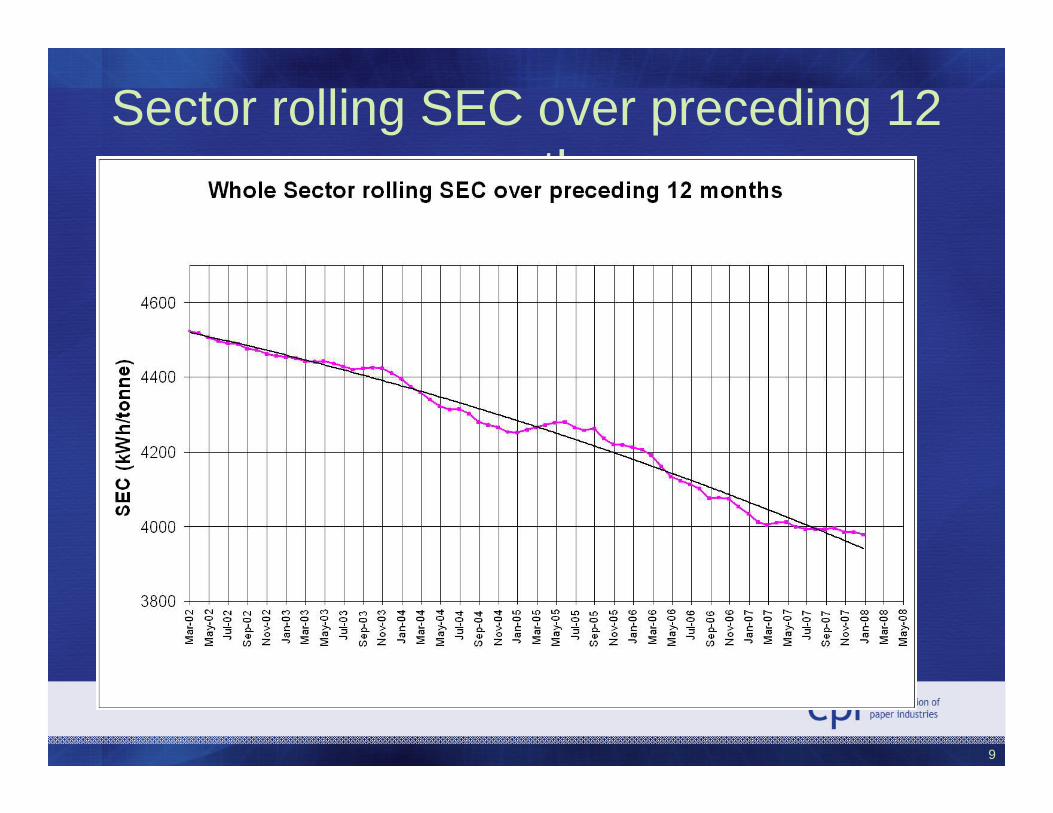
Sector rolling SEC over preceding 12 months
David Morgan, CPI, Presentation to xxxxxx, 28 March 2008
10
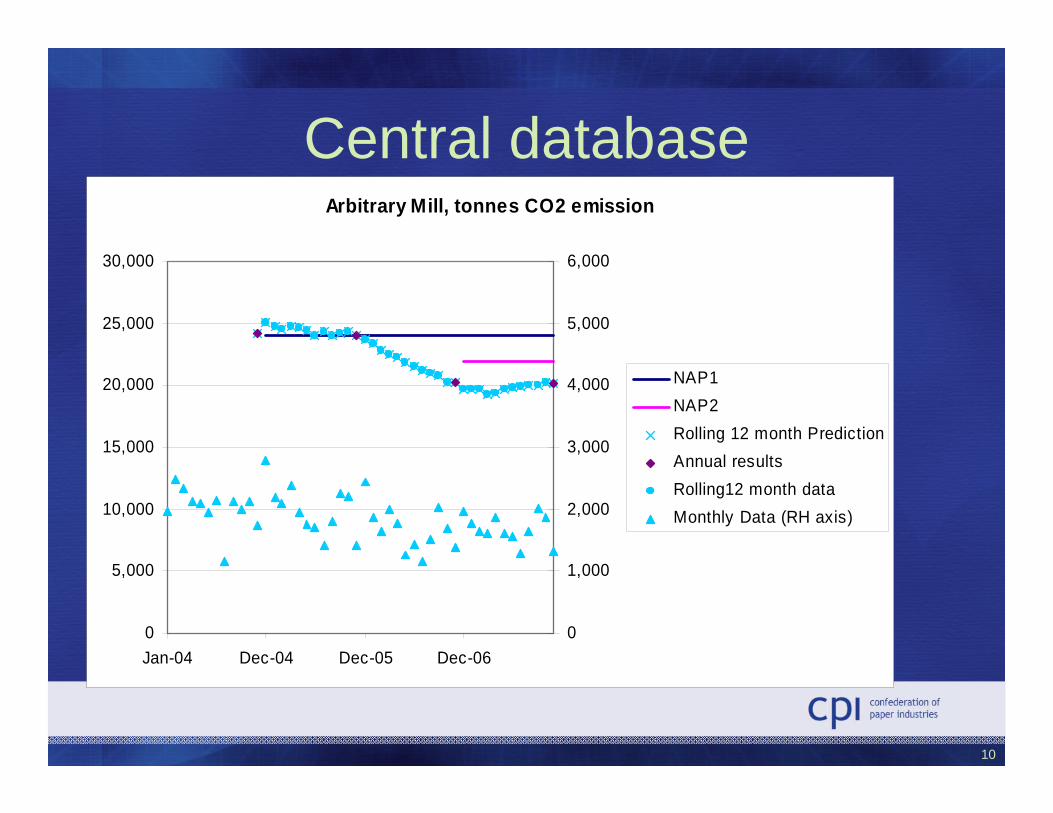
Central databaseArbitrary Mill, tonnes CO2 emission
0
5,000
10,000
15,000
20,000
25,000
30,000
Jan-04 Dec-04 Dec-05 Dec-060
1,000
2,000
3,000
4,000
5,000
6,000
NAP1NAP2 Rolling 12 month PredictionAnnual resultsRolling12 month dataMonthly Data (RH axis)
David Morgan, CPI, Presentation to xxxxxx, 28 March 2008
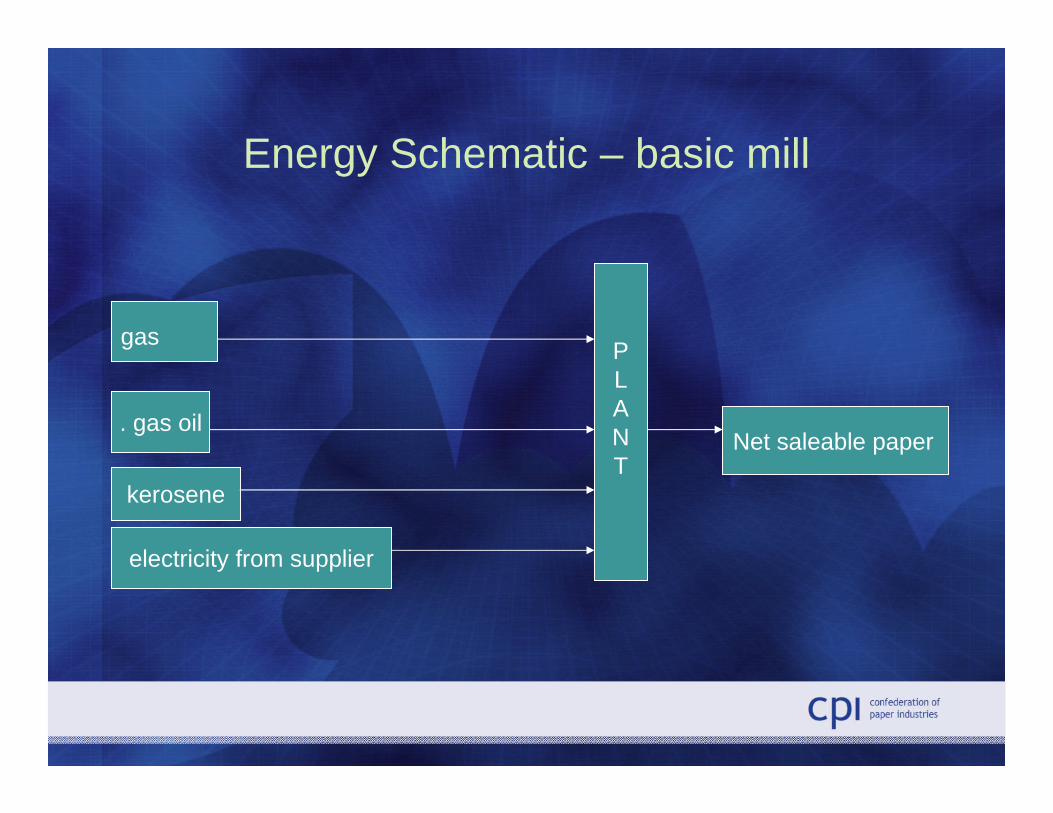
Energy Schematic – basic mill
. gas oil
gas
Net saleable paper
electricity from supplier
PLANT
kerosene
David Morgan, CPI, Presentation to xxxxxx, 28 March 2008
12
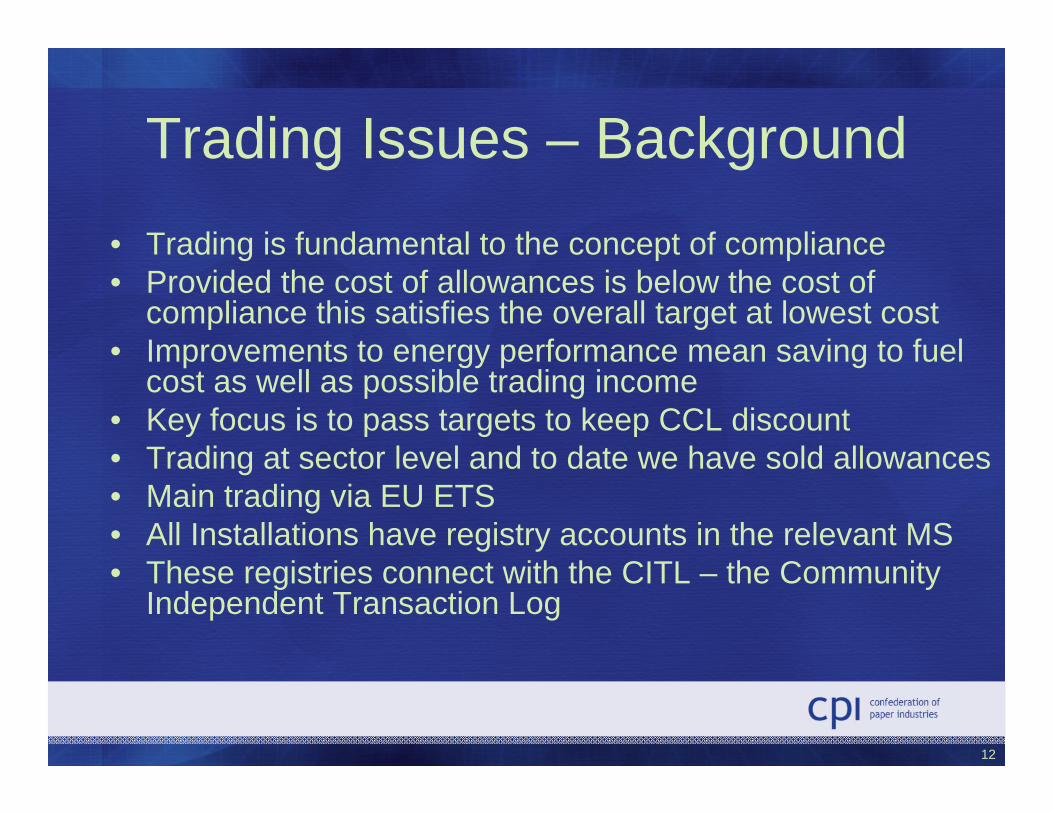
Trading Issues – Background• Trading is fundamental to the concept of compliance• Provided the cost of allowances is below the cost of
compliance this satisfies the overall target at lowest cost• Improvements to energy performance mean saving to fuel
cost as well as possible trading income• Key focus is to pass targets to keep CCL discount • Trading at sector level and to date we have sold allowances• Main trading via EU ETS• All Installations have registry accounts in the relevant MS• These registries connect with the CITL – the Community
Independent Transaction Log
David Morgan, CPI, Presentation to xxxxxx, 28 March 2008
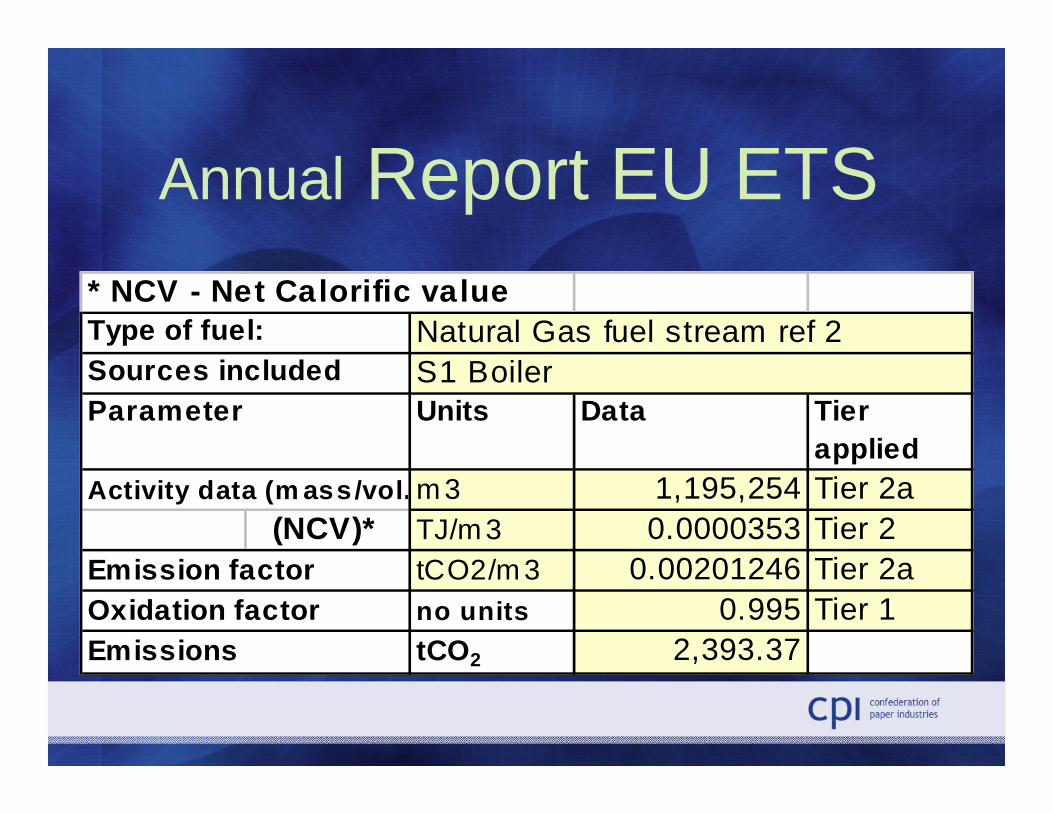
Annual Report EU ETS* NCV - Net Calorific value
Sources includedUnits Data Tier
appliedm 3 1,195,254 Tier 2a
(NCV)* TJ/m 3 0.0000353 Tier 2tCO2/m 3 0.00201246 Tier 2ano units 0.995 Tier 1tCO2 2,393.37
Type of fuel: Natural Gas fuel stream ref 2S1 Boiler
Parameter
Activity data (m ass/vol.
Emission factorOxidation factorEmissions
David Morgan, CPI, Presentation to xxxxxx, 28 March 2008
14
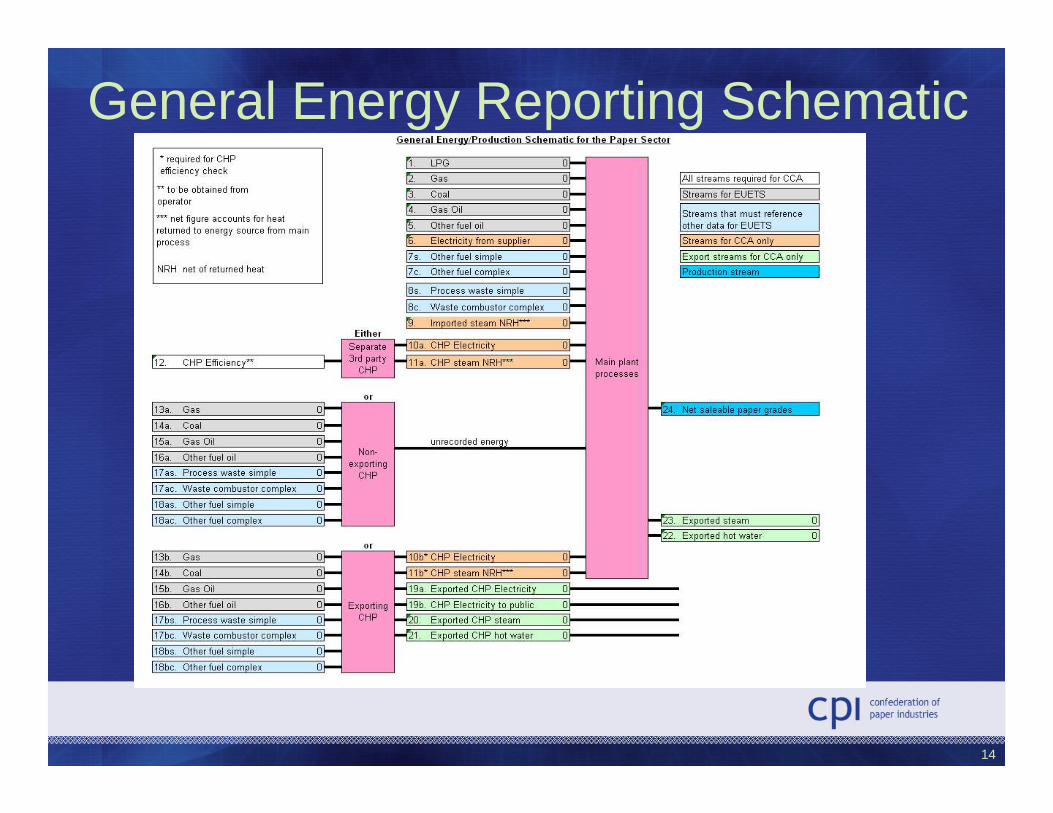
General Energy Reporting Schematic
David Morgan, CPI, Presentation to xxxxxx, 28 March 2008
15
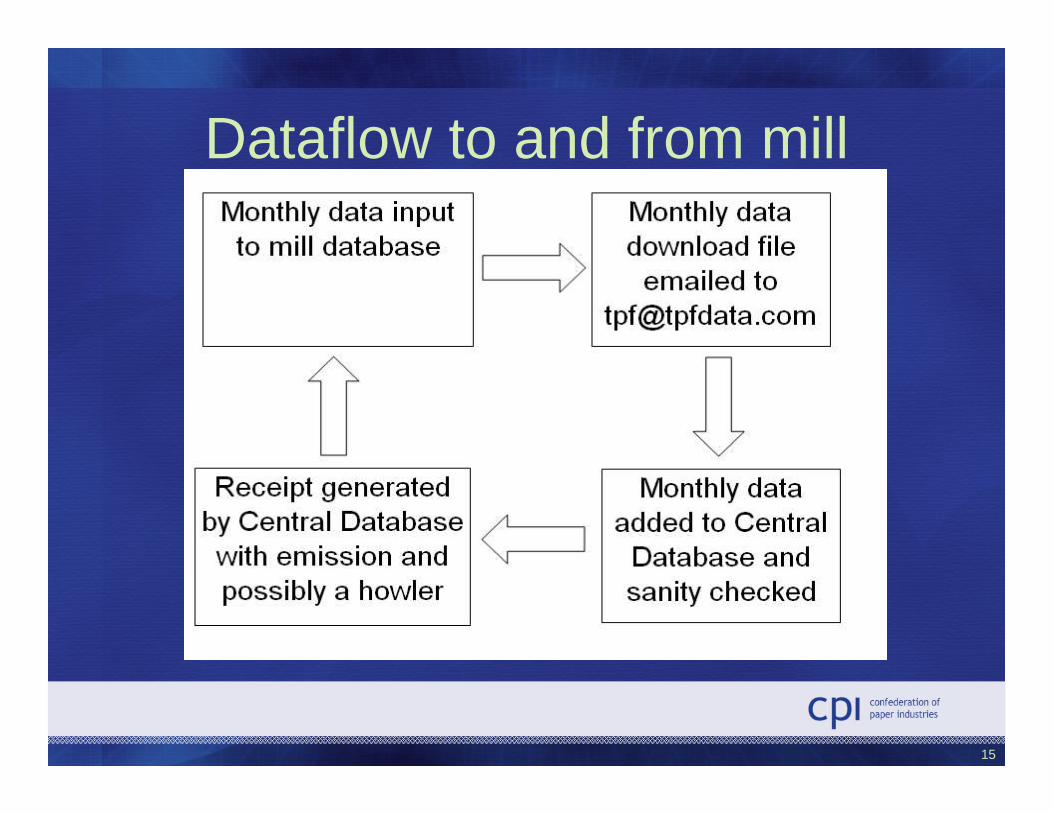
Dataflow to and from mill
David Morgan, CPI, Presentation to xxxxxx, 28 March 2008
16
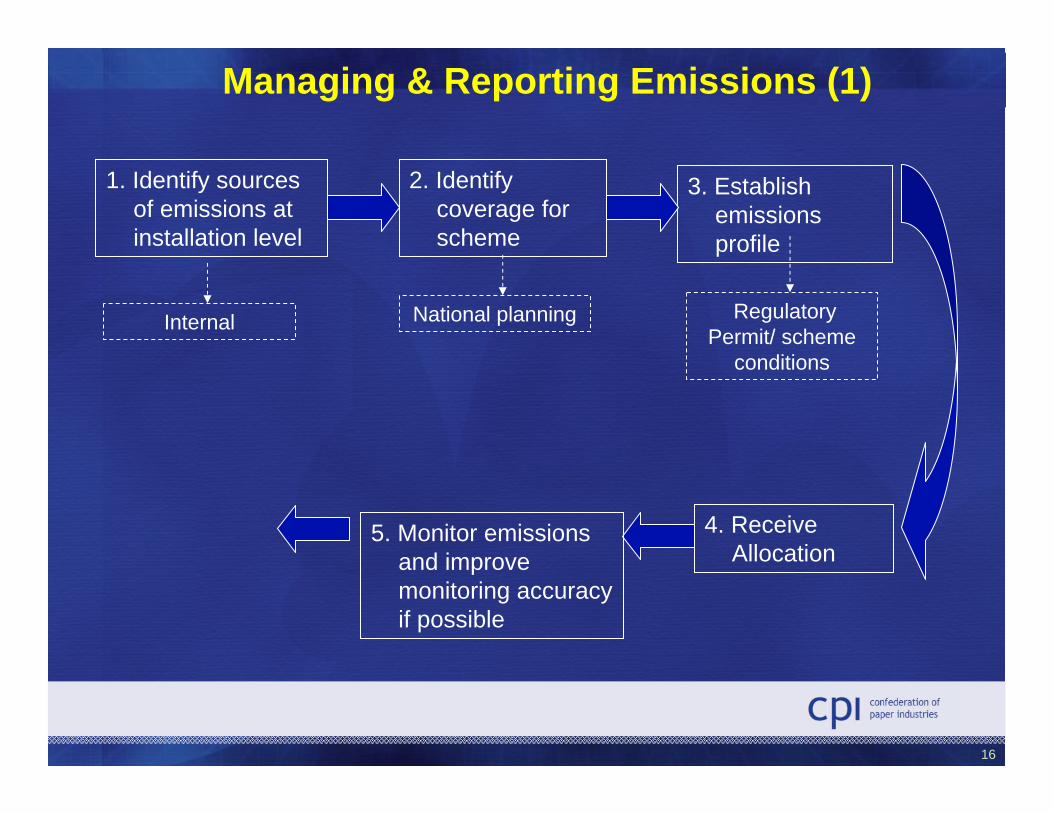
Managing & Reporting Emissions (1)
3. Establish emissions profile
Regulatory Permit/ scheme
conditions
2. Identify coverage for scheme
National planning
4. Receive Allocation
1. Identify sources of emissions at installation level
Internal
5. Monitor emissions and improve monitoring accuracy if possible
David Morgan, CPI, Presentation to xxxxxx, 28 March 2008
17
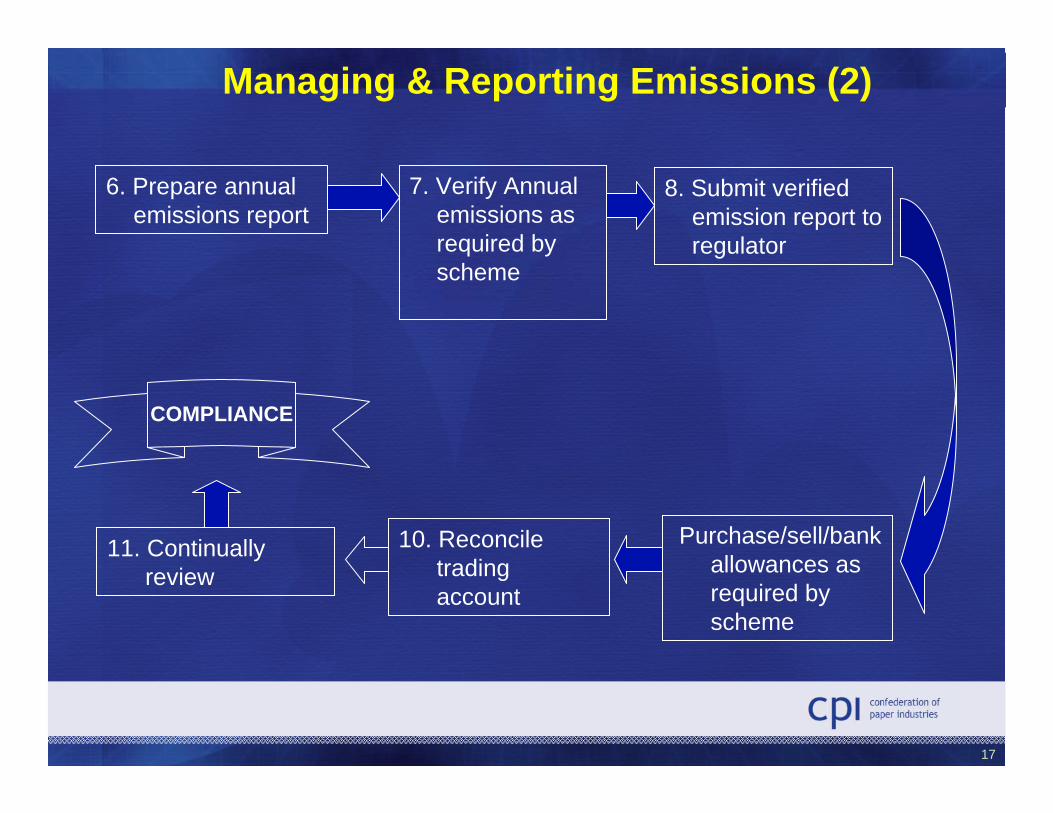
7. Verify Annual emissions as required by scheme
10. Reconcile trading account
6. Prepare annual emissions report
COMPLIANCE
11. Continually review
8. Submit verified emission report to regulator
Purchase/sell/bank allowances as required by scheme
Managing & Reporting Emissions (2)
David Morgan, CPI, Presentation to xxxxxx, 28 March 2008
18
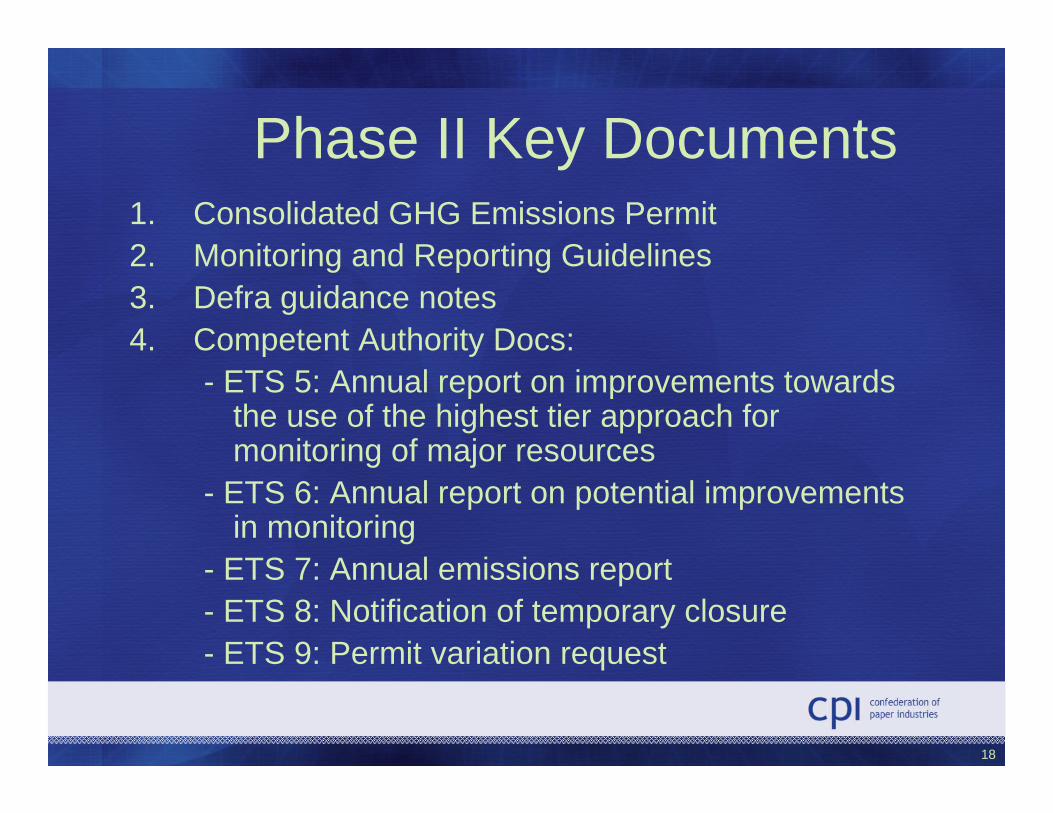
Phase II Key Documents1. Consolidated GHG Emissions Permit2. Monitoring and Reporting Guidelines3. Defra guidance notes4. Competent Authority Docs:
- ETS 5: Annual report on improvements towards the use of the highest tier approach for monitoring of major resources
- ETS 6: Annual report on potential improvements in monitoring
- ETS 7: Annual emissions report- ETS 8: Notification of temporary closure- ETS 9: Permit variation request
David Morgan, CPI, Presentation to xxxxxx, 28 March 2008
19
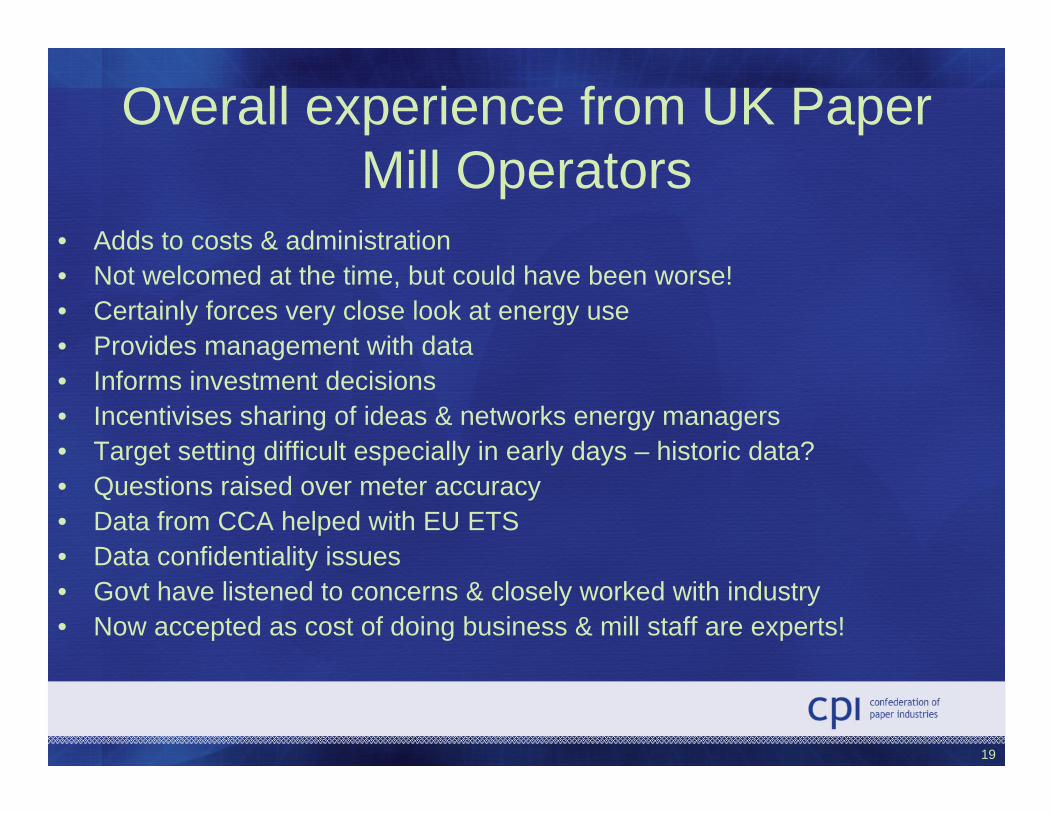
Overall experience from UK Paper Mill Operators
• Adds to costs & administration• Not welcomed at the time, but could have been worse! • Certainly forces very close look at energy use• Provides management with data • Informs investment decisions• Incentivises sharing of ideas & networks energy managers• Target setting difficult especially in early days – historic data?• Questions raised over meter accuracy• Data from CCA helped with EU ETS• Data confidentiality issues• Govt have listened to concerns & closely worked with industry• Now accepted as cost of doing business & mill staff are experts!
David Morgan, CPI, Presentation to xxxxxx, 28 March 2008
Thank You
Steve FreemanEnergy & Environment Manager
Confederation of Paper [email protected]