Expedited Permit Process for PV Systems - Solar...
82
Solar America Board for Codes and Standards www.solarabcs.org Expedited Permit Process for PV Systems A Standardized Process for the Review of Small-Scale PV Systems Prepared by Bill Brooks, P.E. Brooks Engineering Revision 2 July 2012
Transcript of Expedited Permit Process for PV Systems - Solar...
Solar America Board for Codes and Standardswww.solarabcs.org
Expedited PermitProcess for PV Systems
A Standardized Process for the Review of Small-Scale PV Systems
Prepared by
Bill Brooks, P.E.Brooks Engineering
Revision 2July 2012

1Solar America Board for Codes and Standards Report
Disclaimer
This report was prepared as an account of work sponsored by an agency of the United States government. Neither the United States government nor any agency thereof, nor any of their employees, makes any warranty, express or implied, or assumes any legal liability or responsibility for the accuracy, completeness, or usefulness of any information, apparatus, product, or process disclosed, or represents that its use would not infringe privately owned rights. Reference herein to any specific commercial product, process, or service by trade name, trademark, manufacturer, or otherwise does not necessarily constitute or imply its endorsement, recommendation, or favoring by the United States government or any agency thereof. The views and opinions of authors expressed herein do not necessarily state or reflect those of the United States government or any agency thereof.
Download this report and the Expedited Permitting Process:www.solarabcs.org/permitting

Expedited Permit Process for PV Systems 2
Executive Summary
This report presents an expedited permit process for small-scale photovoltaic (PV) systems. The Solar America Board for Codes and Standards (Solar ABCs) recommends that local jurisdictions use this process for awarding building permits to installers of small PV systems. Use of this process simplifies the requirements for the contractor submitting the request and reduces the time needed for the local jurisdiction providing structural and electrical review of the permit application.
The term “expedited permit process” refers to an organized permitting process by which a majority of small, residential-sized photovoltaic systems can be permitted quickly and easily. It is not intended to apply to all types of PV systems. The primary need and value for this process is for systems of less than 10-15 kW of output power. A key difference between small and large projects is the inability of small projects to absorb engineering review costs. Standardizing the process as much as possible is in the contractor’s and jurisdiction’s interest. As projects increase in size and complexity, the ability to handle these projects via a standard framework diminishes.
The one-page expedited permit process and the accompanying guidelines explaining each step provide a means to differentiate PV systems that can be permitted quickly and easily due to their similarity with the majority of small-scale PV systems. Those systems with unique characteristics may be handled with minimal additions to this expedited process or may require additional information, depending on the uniqueness of the installation.
The diagrams shown in the Expedited Permit Process are available online at www.solarabcs.org/permitting in an interactive PDF format so that the diagrams can be filled out electronically and submitted either in printed form or via email to the local jurisdiction. An electronic format is used so that the supplied information is standardized and legible for the local jurisdiction. As this process evolves, and suggestions are received, Solar ABCs will publish additional drawings and diagrams on its website.
The expedited process does provide flexibility in the structural review process. The structural review section includes span tables and additional information found in Appendix B. PV systems with battery backup require a more detailed electrical drawing than this process provides.
Appendix A has an example included of a submittal. An assortment of special electrical topics is presented in Appendix C. Temperature tables included in Appendix E are used in applying the National Electrical Code’s temperature-dependent criteria. This document is intended to be usable throughout the United States and can provide standard installation design documentation for most locations within the U.S. and other regions that use the National Electrical Code (NEC), 2011 version (unless otherwise indicated).

3Solar America Board for Codes and Standards Report
Author Biography
Bill Brooks
Bill Brooks has worked with utility-interconnected PV systems since the late 1980s. He is a consultant to the PV industry on a variety of performance, troubleshooting, and training topics. Over the past 13 years, these training workshops have helped thousands of local inspectors and thousands of electricians and installers understand PV systems and how to properly install them.
His field troubleshooting skills have been valuable in determining where problems occur and to focus training on those issues of greatest need. Mr. Brooks has written several important technical manuals for the industry that are now widely used in California and beyond. His experience includes work on technical committees for the National Electrical Code, Article 690, and IEEE utility interconnection standards for PV systems. In 2008 he was appointed to Code Making Panel 4 of the National Electrical Code by the Solar Energy Industries Association.
Mr. Brooks holds Bachelor and Master of Science Degrees in Mechanical Engineering from N.C. State University and is a Registered Professional Engineer in both North Carolina and California.
Brooks Engineering Web site: www.brooksolar.com
Solar America Board for Codes and StandardsThe Solar America Board for Codes and Standards (Solar ABCs) is a collaborative effort among experts to formally gather and prioritize input from the broad spectrum of solar photovoltaic stakeholders including policy makers, manufacturers, system designers, suppliers, installers, electric utilities, and consumers, resulting in coordinated recommendations to codes and standards making bodies for existing and new solar technologies. The U.S. Department of Energy funds Solar ABCs under the Solar America Initiative Market Transformation (SAI-MT) Program as part of its commitment to facilitate wide-spread adoption of safe, reliable, and cost-effective solar technologies.
For more information, visit the Solar ABCs web site:www.solarabcs.org.
AcknowledgementsThis material is based upon work supported by the Department of Energy under Award Number DE-FC36-07GO17034.
Expedited Permit Process for PV Systems 4
DedicationThis document is dedicated to two key individuals that represent the very best of those who have worked on the codes and standards processes as they relate to PV systems. These two amazing people, Tim Owens, of Santa Clara Building Department, and Chuck Whitaker, of BEW Engineering, passed away in the months prior to the release of this standardized permitting process.
Tim OwensTim Owens passed away in December of 2008 at the age of 59 in the midst of a distinguished career in the electrical trades and code enforcement fields. While working as Chief Electrical Inspector for the City of San Diego in 1999, Tim was the first jurisdictional officer to put together a simplified permitting process for PV systems. His desire to see such a process become commonplace is what has driven this author to work on improving permitting and approval processes for PV systems over the past decade. The solar community lost a true friend and partner who was dedicated to the success of solar photovoltaic systems in California and the rest of the U.S.
Chuck WhitakerChuck Whitaker passed away in early May of 2009 at the age of 52 in the midst of a distinguished career supporting the development and implementation of most of the codes and standards the govern and support PV systems both nationally and internationally. His passing coincided with the initial release of this standardized permitting process.. The author had the privilege of knowing Chuck for two decades and working closely with him for over eight years as his employee and colleague. It is difficult to overstate Chuck’s contribution to the PV industry; his influence is found in nearly every code and standard that has been developed for PV equipment and systems over the past 25 years. It is only fitting that this document—which includes his influence—be dedicated to his memory. A huge hole is left in the PV industry with Chuck’s passing, and it is the hope of many of us in the codes and standards arena to be able to carry on his tireless work some semblance of the skill, wit, and humor that were the hallmarks of this amazing individual.
5Solar America Board for Codes and Standards Report
Table of ContentsDisclaimer .........................................................................................................1
Executive Summary ............................................................................................2
Author Biography ...............................................................................................3
Dedication .........................................................................................................4
Introduction ....................................................................................................................... 6
What Qualifies a PV Project for Expedited Permitting? .................................................. 6
The Permitting Process for PV Systems in the United States ......................................... 7
Problems with the Existing Processes of Permitting PV Systems .................................. 7
Activities to Develop Standardized Review Processes ..................................................... 8
Unifying the Existing Permitting Processes to Move Toward a Standardized
Expedited Permit Process .................................................................................................. 9
Recommendations on Applying the Expedited Permit Process .................................... 9
References ........................................................................................................................ 10
Expedited Permit Process for PV Systems ..................................................................... 11
Expedited Permit Process for Small-Scale PV Systems ................................................. 12
Expedited Permit Guidelines for Small-Scale PV Systems ............................................ 22
Section 1. Required Information for Permit .............................................22
Section 2. Step 1: Structural Review of PV Array Mounting System .............. 22
Section 3. Step 2: Electrical Review of PV System ........................................... 24
Section 4. Inverter Information ......................................................................... 25
Section 5. Module Information ......................................................................... 25
Section 6. Array Information ............................................................................. 26
Section 7. Signs ................................................................................................... 27
Section 8. Wiring and Overcurrent Protection ................................................. 28
Section 9: AC Point of Connection .................................................................... 31
Section 10: Grounding ........................................................................................ 32
Appendix A: Example Submittals ................................................................................... 34
Appendix B: Structural .................................................................................................... 51
Appendix C: Micro-Inverters and AC Modules .............................................................. 54
Appendix D: Special Electrical Topics ............................................................................ 58
Appendix E: Costs of Permits .......................................................................................... 64
Appendix F: Temperature Tables .................................................................................... 65

Expedited Permit Process for PV Systems 6
IntroductionThe term “expedited permit process” refers to an organized permitting process by which a majority of small photovoltaic (PV) systems can be permitted quickly and easily. It is not intended to apply to all types of PV systems. The primary need and value for this process is for systems of less than 10-15 kW maximum power output. As PV systems increase in size and complexity, the ability to handle these projects via a standard framework diminishes. This is not to say that larger systems cannot be handled in a straightforward manner. Many larger PV system projects may be approved with minimum review as is required with smaller systems. A key difference between small and large projects is the inability of small projects to absorb engineering review costs. The expedited permit process is intended to simplify the structural and electrical review of a small PV system project and minimize the need for detailed engineering studies and unnecessary delays.
It is not the intent of an expedited process to circumvent the engineering process. Rather, the intent is to address the engineering concerns by recognizing the similarities among these smaller systems and establishing guidelines to determine when a PV project is within the boundaries of typical, well-engineered systems. To this end, a one-page permit form was devised to outline the process and define what qualifies for expedited permitting. An explanatory document accompanies the permit form so that contractors and local jurisdictions using the form have a description of how to provide the required information.
What Qualifies a PV Project for Expedited Permitting?
The permit form outlines what information is needed for the permit package and the minimum requirements needed for utilizing expedited permitting as summarized below.
1. The structural installation of the systems meets the following criteria:a. the array is mounted on a code-compliant structure;b. an engineered mounting system is used to attach the array to the
structure; and,c. the array has a distributed weight of less than 5 lbs./ft2 and less than 45
lbs. per attachment.2. The electrical design of the system can be described using the supplied standard
electrical diagram and meets the following criteria:a. all products are listed and identified for the application (i.e. modules,
inverters, source combiners, etc.);b. the array is composed of 4 series strings or less and,c. the inverter output is 13.44 kW or less (maximum size for 70-amp
breaker) and is connected on the load side of the service disconnect.In order to complete the permit package, the applicant is required to provide the following:
1. a completed permit application2. the proposed site diagram showing the relative location of major components3. the proposed standard electrical diagram4. the specification sheets and simple instruction manuals for major components.
Even though these stipulations may seem restrictive at first, the majority of PV systems installed in the U.S. will easily meet these requirements. For projects that do not meet these simplified criteria, additional steps may be necessary. Currently, the expedited process identifies steps to complete the review of the structural installation should the array be installed on a roof that is unfamiliar to the jurisdiction, or when a non-

7Solar America Board for Codes and Standards Report
typical mounting system is employed. For installations that do not meet the electrical installation criteria, detailed ampacity calculations, and other supporting documentation may be necessary to complete the review. A variety of special cases will be added to the standard electrical diagram case to accommodate project types that arecomposed of additional system installations (e.g. supply-side connections, modular inverter systems, and battery-based systems).
Finally, it should be noted that an expedited permit process solves only one of several challenges in the installation process of PV systems. Increasingly, local jurisdictions across the U.S. are placing less emphasis on the permit process and more emphasis on the field inspection process. This is a positive trend for the PV industry, as even the best permit package may do little to reduce challenges during a field inspection. Ultimately, the field inspection will illustrate how well a contractor is able to install a code-compliant PV system. A well-organized permit package may simply make a poor-quality contractor look good initially, while the final inspection can more clearly identify competent installers. Understanding that this permit process is only one portion of the code-enforcement process will help advocates and jurisdictions put the appropriate emphasis on the review and inspection portions of the process.
The Permitting Process for PV Systemsin the United States
In order to understand how an expedited permitting process can be of assistance, we should first examine how permitting in general is conducted throughout the U.S. A common method that local jurisdictions utilize is to split the process into two discrete segments: 1) permitting, and 2) field inspection.
The first segment entails both the plan review and permitting process. Depending on the size of the jurisdiction, this process will vary. For large jurisdictions, there may be a group of people that focuses only on plan reviews and typically does not get involved in the field inspection process. For smaller jurisdictions, one person may be providing the plan review, field inspection, and other services of the office. Understanding that these processes can vary significantly is key in helping jurisdictions choosing to adopt a standardized process.
In addition to the more common standard plan review and inspection processes, there are a many other methods used across the U.S. Many rural areas do not require permits or inspections for construction. Other regions may use third-party inspectors who provide the local government with a certificate that an installation meets local code requirements.
Finally, some jurisdictions have a very minimal or non-existent permit process, with all the emphasis placed on the field inspection. This minimal permit process might include simply mailing, faxing, or emailing a short form into an office or going online and paying a fee. This expedited permit process may contain more steps than some jurisdictions require. However, even for those jurisdictions that do not require plan submittals, the documentation can be supplied at the field inspection for reference.
Problems with the Existing Processes of Permitting PV Systems
Given the differences in permitting processes across the U.S., and the significant variations in experience relating to system inspection at various jurisdictions, it becomes apparent why permitting issues have been cited as a barrier to the widespread installation of PV systems. Several articles and reports have been written, documenting general permitting difficulties and cite specific examples of difficulties and delays for
Expedited Permit Process for PV Systems 8
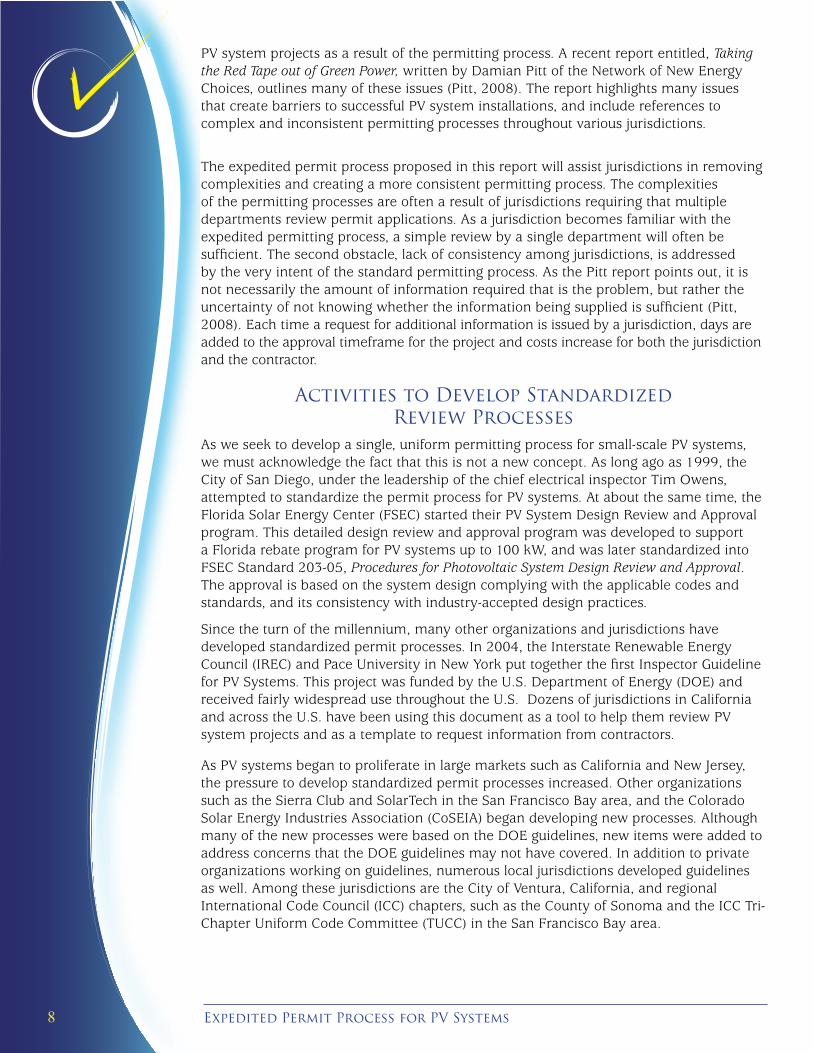
PV system projects as a result of the permitting process. A recent report entitled, Taking the Red Tape out of Green Power, written by Damian Pitt of the Network of New Energy Choices, outlines many of these issues (Pitt, 2008). The report highlights many issues that create barriers to successful PV system installations, and include references to complex and inconsistent permitting processes throughout various jurisdictions.
The expedited permit process proposed in this report will assist jurisdictions in removing complexities and creating a more consistent permitting process. The complexities of the permitting processes are often a result of jurisdictions requiring that multiple departments review permit applications. As a jurisdiction becomes familiar with the expedited permitting process, a simple review by a single department will often be sufficient. The second obstacle, lack of consistency among jurisdictions, is addressed by the very intent of the standard permitting process. As the Pitt report points out, it is not necessarily the amount of information required that is the problem, but rather the uncertainty of not knowing whether the information being supplied is sufficient (Pitt, 2008). Each time a request for additional information is issued by a jurisdiction, days are added to the approval timeframe for the project and costs increase for both the jurisdiction and the contractor.
Activities to Develop Standardized Review Processes
As we seek to develop a single, uniform permitting process for small-scale PV systems, we must acknowledge the fact that this is not a new concept. As long ago as 1999, the City of San Diego, under the leadership of the chief electrical inspector Tim Owens, attempted to standardize the permit process for PV systems. At about the same time, the Florida Solar Energy Center (FSEC) started their PV System Design Review and Approval program. This detailed design review and approval program was developed to support a Florida rebate program for PV systems up to 100 kW, and was later standardized into FSEC Standard 203-05, Procedures for Photovoltaic System Design Review and Approval. The approval is based on the system design complying with the applicable codes and standards, and its consistency with industry-accepted design practices.
Since the turn of the millennium, many other organizations and jurisdictions have developed standardized permit processes. In 2004, the Interstate Renewable Energy Council (IREC) and Pace University in New York put together the first Inspector Guideline for PV Systems. This project was funded by the U.S. Department of Energy (DOE) and received fairly widespread use throughout the U.S. Dozens of jurisdictions in California and across the U.S. have been using this document as a tool to help them review PV system projects and as a template to request information from contractors.
As PV systems began to proliferate in large markets such as California and New Jersey, the pressure to develop standardized permit processes increased. Other organizations such as the Sierra Club and SolarTech in the San Francisco Bay area, and the Colorado Solar Energy Industries Association (CoSEIA) began developing new processes. Although many of the new processes were based on the DOE guidelines, new items were added to address concerns that the DOE guidelines may not have covered. In addition to private organizations working on guidelines, numerous local jurisdictions developed guidelines as well. Among these jurisdictions are the City of Ventura, California, and regional International Code Council (ICC) chapters, such as the County of Sonoma and the ICC Tri-Chapter Uniform Code Committee (TUCC) in the San Francisco Bay area.

9Solar America Board for Codes and Standards Report
Unifying the Existing Permitting Processes to Move Toward a Standardized Expedited Permit Process
With all the energy and focus being placed on this specific issue, the timing was right to work with all these jurisdictions and organizations to determine whether a single process could be developed that met the concerns of all the parties and that could be used as a nationwide template for jurisdictions. By incorporating the major components of each of the developed processes, the Expedited Permit Process was drafted and released for review in early March, 2009. This new permitting process was significantly different from the previous DOE guidelines and included many of the unique aspects of the SolarTech and TUCC documents.
Over the course of March and April of 2009, numerous reviews of the draft document were provided by solar contractors, individuals at organizations including SolarTech, National Renewable Energy Laboratory (NREL), New Mexico State University (NMSU), California Solar Energy Industries Association (CalSEIA), CoSEIA, and jurisdictions that had expressed interest in reviewing the draft. As a result of these reviews, substantial updates and changes were made to the content of the process. In particular, the electrical diagram went from a single 11”x17” diagram with areas to fill in the specifications of the electrical components to two 8.5”x11” diagrams that can be filled in electronically using a PDF reader. Other comments suggested adding descriptions of special cases, such as making ac connections on the supply side of service disconnect and making ac connections to subpanels. Rather than incorporate these special topics into the body of the explanatory document, each item is addressed separately in the appendix under Special Electrical Topics.
The feature that sets the expedited permit process apart from other current standardization attempts is the development of a standard electrical diagram and standard wire sizing. This diagram is pivotal to the development of a standard permit process. Variations in how electrical design information is presented can be a major problem for jurisdictions approving projects. These variations often cause permitting delays as the jurisdictions are unsure about what information is being provided, or left out, when the permit application is submitted. This uncertainty often causes jurisdictions to set a one- or two-week turn around for PV projects. A standard diagram can remove that uncertainty and allow a jurisdiction to review and approve a project at the time of submittal. What is often termed “over the counter” approvals is one of the goals of the Expedited Permit Process. “Over the counter” refers to a local jurisdictional review provided by plan checkers that are available at the permitting counter. A highly organized standardized permit package makes this type of counter review possible.
Recommendations on Applying the Expedited Permit Process
It is likely that various regions and jurisdictions across the United States have regulations and requirements that restrict their ability to adopt the expedited permitting process. At the same time, the issues that jurisdictions face when permitting PV systems are often similar. All jurisdictions must address the safety of PV systems as they affect structures and electrical hazards. The key is beginning with a consistent starting point in the development of a local or regional requirement. By using the new expedited permit process provided by the Solar America Board for Codes and Standards (Solar ABCs), jurisdictions can be assured that they are consistent in their application of codes and standards. Contractors can also be assured that the requirements for permitting will not vary dramatically among jurisdictions.
Solar ABCs recommends that this permitting process be used in its entirety. As jurisdictions begin to use this process and see opportunities to improve the guidelines the updates can be implemented and posted on the Solar ABCs website at www.solarabcs.org/permitting. With

Expedited Permit Process for PV Systems 10
this approach, the latest version can be found and downloaded from a consistent location and jurisdictions can update their local processes as often as they deem necessary. By having a process that can be consistently updated, the permitting process can stay current with the design and installation practices as they change over time. The ultimate goal is to have the best and most up-to-date information on PV system design and installation practices in the hands of jurisdictions and contractors across the U.S. As codes are updated and changed, this flexible system can be adapted quickly and easily.
References
National Fire Protection Association, (2011), National Electrical Code 2011.
Pitt, D., (2008) Taking the Red Tape Out of Green Power: How to Overcome Permitting Obstacles to Small-Scale Distributed Renewable Energy, Network for New Energy Choices. Retrieved 9/4/09 from http://www.newenergychoices.org/uploads/redTape-rep.pdf

11Solar America Board for Codes and Standards Report
Expedited Permit Process for PV Systems
The Solar America Board for Codes and Standards (Solar ABCs) Expedited Permit Pro-cess provides a means to differentiate systems that can be permitted quickly and easily due to their similarity with the majority of small-scale PV systems. Those systems with unique characteristics may be handled with small additions to this Expedited Permit Process or may require much more information, depending on the uniqueness of the installation.
The following pages contain forms to use with the Expedited Permit Process. The forms are available as interactive PDF files at www.solarabcs.org/permitting. In jurisdictionsthat have adopted the Expedited Permit Process for PV Systems, these forms can be filled out electronically and submitted in either printed form and via email. An electronic format is used so that the supplied information is standardized and legible for the local jurisdiction.
Expedited Permit Process for PV Systems 12
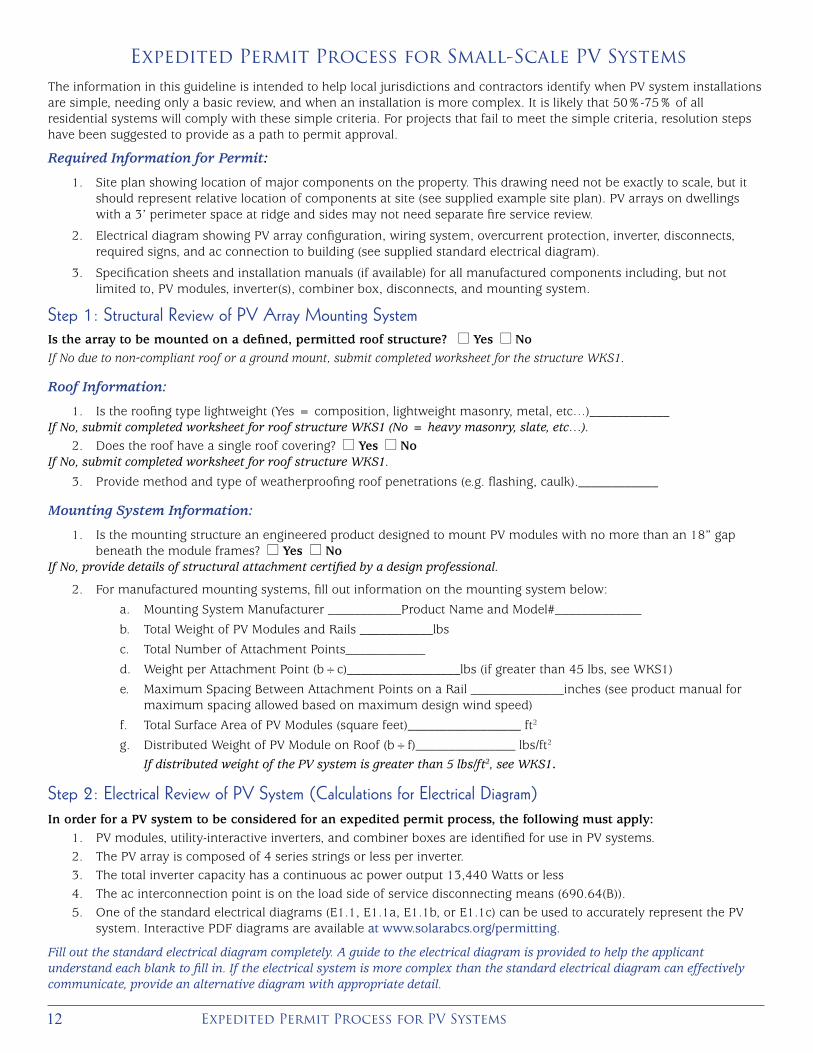
Expedited Permit Process for Small-Scale PV SystemsThe information in this guideline is intended to help local jurisdictions and contractors identify when PV system installations are simple, needing only a basic review, and when an installation is more complex. It is likely that 50%-75% of all residential systems will comply with these simple criteria. For projects that fail to meet the simple criteria, resolution steps have been suggested to provide as a path to permit approval.
Required Information for Permit:
1. Site plan showing location of major components on the property. This drawing need not be exactly to scale, but it should represent relative location of components at site (see supplied example site plan). PV arrays on dwellings with a 3’ perimeter space at ridge and sides may not need separate fire service review.
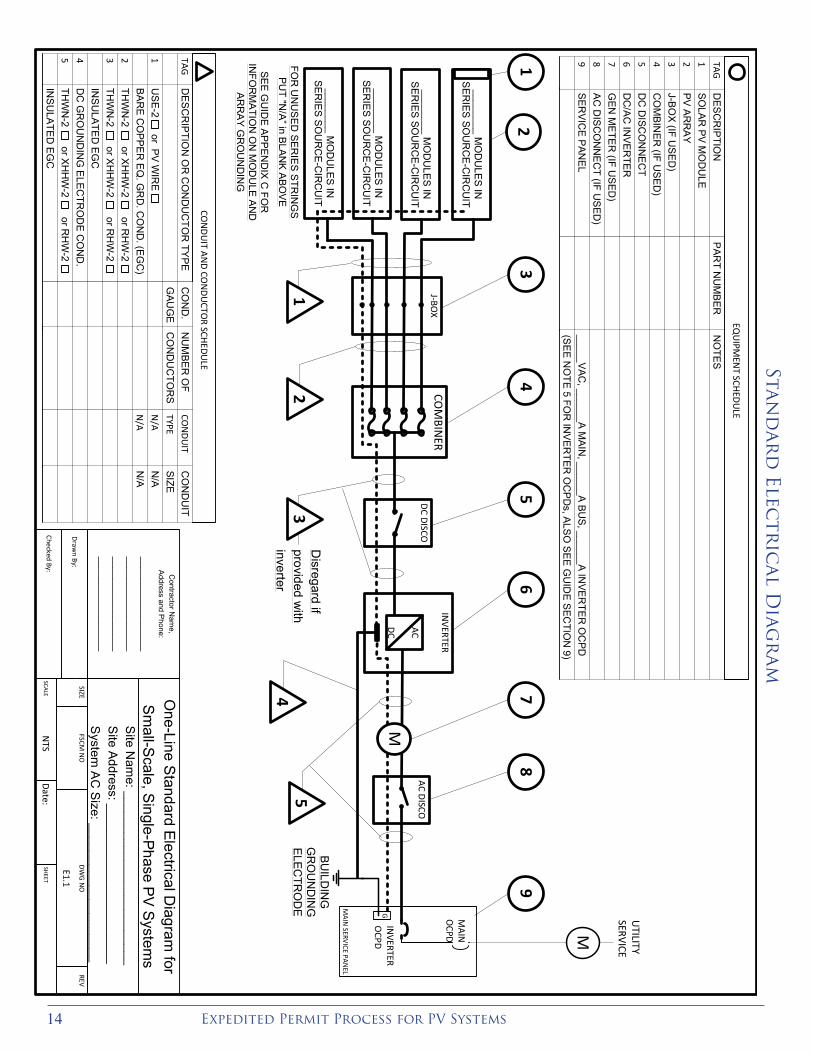
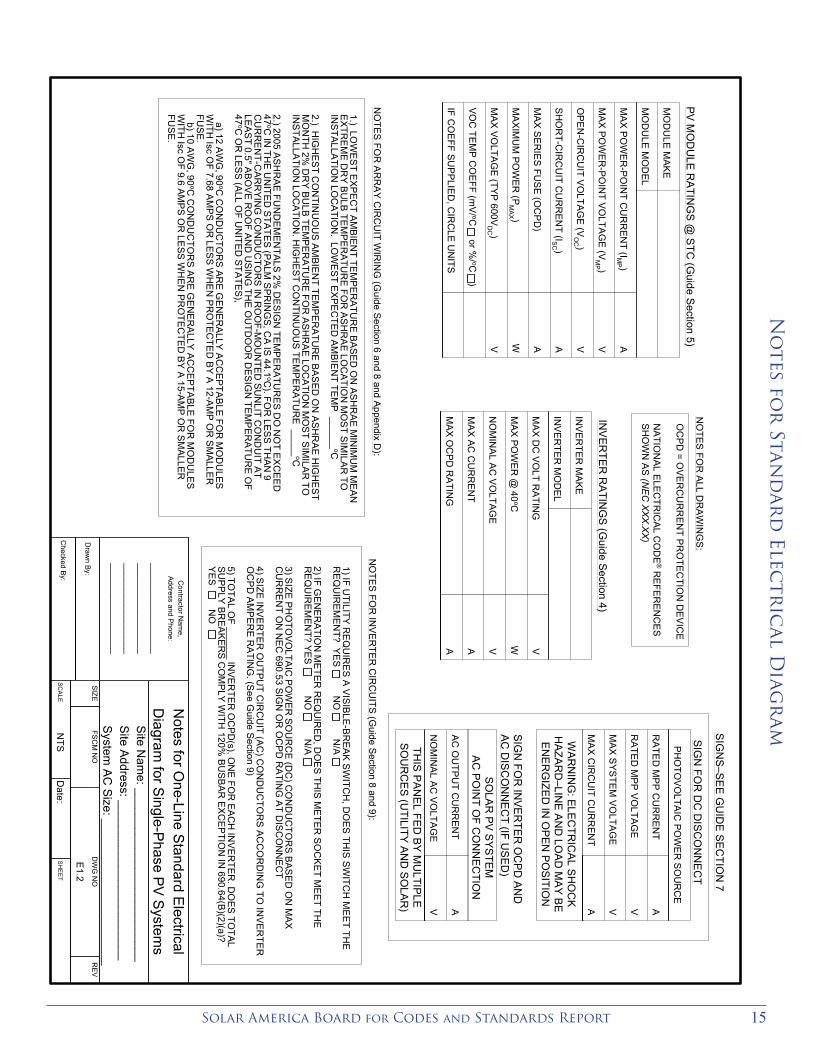
2. Electrical diagram showing PV array configuration, wiring system, overcurrent protection, inverter, disconnects, required signs, and ac connection to building (see supplied standard electrical diagram).
3. Specification sheets and installation manuals (if available) for all manufactured components including, but not limited to, PV modules, inverter(s), combiner box, disconnects, and mounting system.
Step 1: Structural Review of PV Array Mounting SystemIs the array to be mounted on a defined, permitted roof structure? l Yes l NoIf No due to non-compliant roof or a ground mount, submit completed worksheet for the structure WKS1.
Roof Information:
1. Is the roofing type lightweight (Yes = composition, lightweight masonry, metal, etc…)____________If No, submit completed worksheet for roof structure WKS1 (No = heavy masonry, slate, etc…).
2. Does the roof have a single roof covering? l Yes l NoIf No, submit completed worksheet for roof structure WKS1.
3. Provide method and type of weatherproofing roof penetrations (e.g. flashing, caulk).____________
Mounting System Information:
1. Is the mounting structure an engineered product designed to mount PV modules with no more than an 18” gap beneath the module frames? l Yes l No
If No, provide details of structural attachment certified by a design professional.
2. For manufactured mounting systems, fill out information on the mounting system below:
a. Mounting System Manufacturer ___________Product Name and Model#_____________
b. Total Weight of PV Modules and Rails ___________lbs
c. Total Number of Attachment Points____________
d. Weight per Attachment Point (b÷c)_________________lbs (if greater than 45 lbs, see WKS1)
e. Maximum Spacing Between Attachment Points on a Rail ______________inches (see product manual for maximum spacing allowed based on maximum design wind speed)
f. Total Surface Area of PV Modules (square feet)_________________ ft2
g. Distributed Weight of PV Module on Roof (b÷f)_______________ lbs/ft2
If distributed weight of the PV system is greater than 5 lbs/ft2, see WKS1.
Step 2: Electrical Review of PV System (Calculations for Electrical Diagram)In order for a PV system to be considered for an expedited permit process, the following must apply:
1. PV modules, utility-interactive inverters, and combiner boxes are identified for use in PV systems.2. The PV array is composed of 4 series strings or less per inverter.3. The total inverter capacity has a continuous ac power output 13,440 Watts or less4. The ac interconnection point is on the load side of service disconnecting means (690.64(B)).5. One of the standard electrical diagrams (E1.1, E1.1a, E1.1b, or E1.1c) can be used to accurately represent the PV
system. Interactive PDF diagrams are available at www.solarabcs.org/permitting.
Fill out the standard electrical diagram completely. A guide to the electrical diagram is provided to help the applicant understand each blank to fill in. If the electrical system is more complex than the standard electrical diagram can effectively communicate, provide an alternative diagram with appropriate detail.
13Solar America Board for Codes and Standards Report
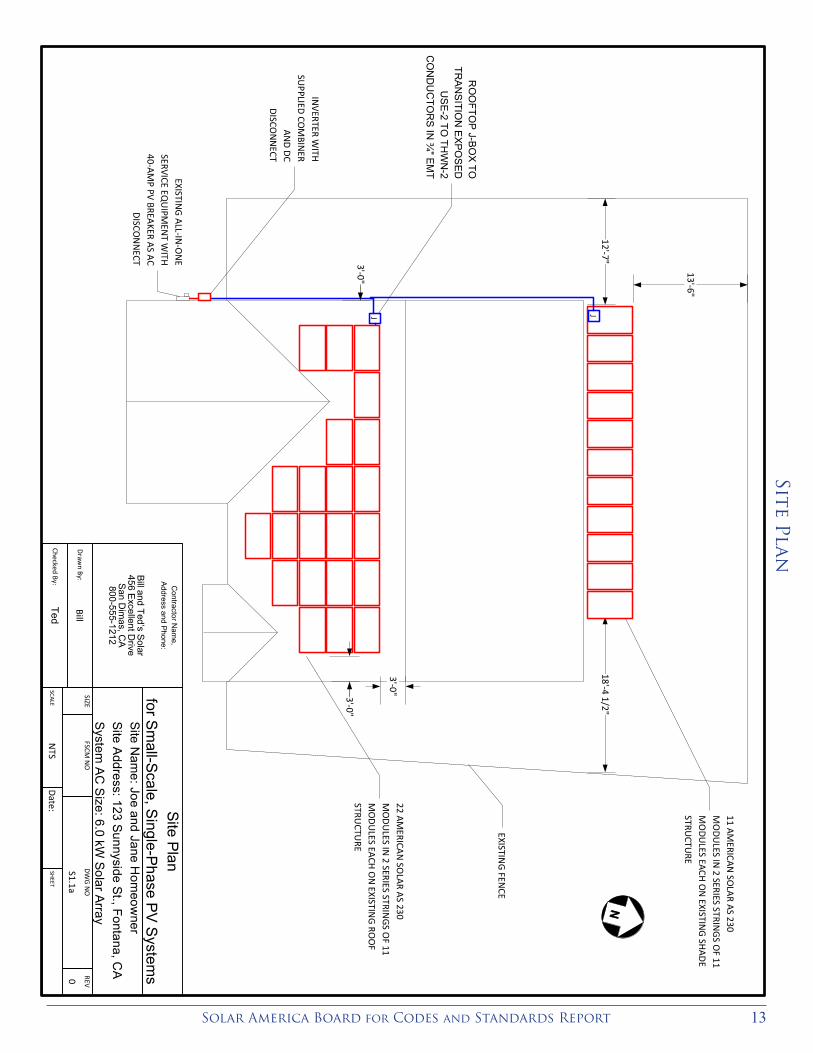
Site Plan
Expedited Permit Process for PV Systems 14
Stand
ard
Electr
ical D
iagr
am
15Solar America Board for Codes and Standards Report
No
tes for
Stand
ard
Electr
ical D
iagr
am
Contractor N
ame,
Address and Phone:
____________________________________________________________________
Notes for O
ne-Line Standard E
lectricalD
iagram for S
ingle-Phase P
V S
ystems
Site N
ame: __________________________
Site A
ddress: ________________________System
AC Size: ______________________
SIZEFS
CM
NO
DW
G N
OR
EV
E1.2
SCA
LEN
TSD
ate:S
HE
ET
Draw
n By:
Checked B
y:
MA
X P
OW
ER
-PO
INT C
UR
RE
NT (IM
P )
MA
X P
OW
ER
-POIN
T VOLTA
GE
(VM
P )
OP
EN
-CIR
CU
IT VO
LTAGE (V
OC )
SH
OR
T-CIR
CU
IT CU
RR
EN
T (ISC )
MA
X S
ER
IES FU
SE (O
CP
D)
MA
XIM
UM
POW
ER
(PM
AX )
MA
X V
OLTAG
E (TYP
600VD
C )
VO
C TE
MP
CO
EFF (mV
/ oC or %
/ oC )
IF CO
EFF SU
PPLIED
, CIR
CLE U
NITS
AVVAAWV
MO
DU
LE M
AKE
MO
DU
LE M
OD
EL
PV
MO
DU
LE R
ATIN
GS
@ S
TC (G
uide Section 5)
MAX
DC
VO
LT RA
TING
MAX
POW
ER
@ 40
oC
NO
MIN
AL A
C V
OLTAG
E
MAX
AC C
UR
REN
T
MAX
OC
PD R
ATIN
G
VWVAA
INV
ER
TER M
AKE
INV
ER
TER M
OD
EL
INV
ER
TER
RA
TING
S (G
uide Section 4)
1) IF UTILITY R
EQU
IRES
A VISIB
LE-BR
EAK
SWITC
H, D
OES
THIS S
WITC
H M
EET TH
ER
EQU
IREM
ENT? Y
ESN
ON
/A
2) IF GE
NE
RATIO
N M
ETER
REQ
UIR
ED, D
OE
S TH
IS M
ETER
SOC
KET M
EET TH
ER
EQU
IREM
ENT? Y
ESN
ON
/A
3) SIZE
PH
OTO
VOLTA
IC P
OW
ER
SO
UR
CE
(DC
) CO
ND
UC
TOR
S BAS
ED
ON
MA
XC
UR
RE
NT O
N N
EC
690.53 SIG
N O
R O
CP
D R
ATIN
G A
T DIS
CO
NN
EC
T
4) SIZE
INV
ER
TER O
UTP
UT C
IRC
UIT (AC
) CO
ND
UC
TOR
S A
CC
OR
DIN
G TO
INV
ERTE
RO
CP
D A
MP
ERE
RA
TING
. (See G
uide Section 9)
5) TOTA
L OF ______ IN
VER
TER
OC
PD
(s), ON
E FO
R E
ACH
INVE
RTE
R. D
OES
TOTAL
SU
PP
LY BR
EAK
ERS C
OM
PLY W
ITH 120%
BU
SB
AR EX
CE
PTIO
N IN
690.64(B)(2)(a)?
YES
NO
NO
TES
FOR
INV
ER
TER C
IRC
UITS
(Guide Section 8 and 9):
1.) LOW
EST E
XPE
CT AM
BIEN
T TEM
PE
RA
TUR
E BA
SED
ON
ASH
RAE
MIN
IMU
M M
EAN
EXTR
EM
E D
RY
BU
LB TE
MP
ER
ATU
RE
FOR
AS
HR
AE LO
CA
TION
MO
ST S
IMILAR
TOIN
STALLATIO
N LO
CA
TION
. LOW
EST E
XPE
CTED
AMBIE
NT TE
MP
______oC
2.) HIG
HE
ST C
ON
TINU
OU
S AM
BIEN
T TEM
PE
RA
TUR
E BA
SED
ON
ASH
RAE
HIG
HE
ST
MO
NTH
2% D
RY B
ULB
TEM
PER
ATUR
E FO
R A
SHR
AE LO
CA
TION
MO
ST S
IMILA
R TO
INS
TALLATION
LOC
ATIO
N. H
IGH
EST C
ON
TINU
OU
S TE
MP
ER
ATU
RE
_____oC
2.) 2005 ASH
RA
E FUN
DEM
ENTA
LS 2% D
ESIG
N TE
MP
ERA
TUR
ES D
O N
OT E X
CE
ED
47oC
IN TH
E UN
ITED STATE
S (PALM
SPR
ING
S, CA IS 44.1
oC). FO
R LES
S TH
AN
9C
UR
RE
NT-C
AR
RY
ING
CO
ND
UC
TOR
S IN
RO
OF-M
OU
NTE
D S
UN
LIT CO
ND
UIT AT
LEAS
T 0.5" ABO
VE
RO
OF A
ND
USIN
G TH
E O
UTD
OO
R D
ES
IGN
TEM
PER
ATUR
E O
F47
oC O
R LE
SS (A
LL OF U
NITED
STATE
S),
a) 12 AW
G, 90
oC C
ON
DU
CTO
RS
ARE
GE
NE
RA
LLY AC
CE
PTA
BLE
FOR
MO
DU
LESW
ITH Isc O
F 7.68 AM
PS O
R LES
S W
HE
N P
RO
TEC
TED
BY A
12-AMP
OR
SM
ALLE
RFU
SE.
b) 10 AW
G, 90
oC C
ON
DU
CTO
RS
ARE
GE
NE
RA
LLY AC
CE
PTA
BLE
FOR
MO
DU
LESW
ITH Isc O
F 9.6 AM
PS
OR
LESS
WH
EN P
RO
TECTE
D B
Y A 15-A
MP
OR
SMALLER
FUS
E.
NO
TES FO
R A
RR
AY C
IRC
UIT W
IRIN
G (G
uide Section 6 and 8 and Appendix D):
OC
PD
= OVE
RC
UR
REN
T PR
OTE
CTIO
N D
EV
ICE
NATIO
NAL E
LEC
TRIC
AL CO
DE
® RE
FER
ENC
ES
SH
OW
N A
S (N
EC
XX
X.X
X)
NO
TES FO
R A
LL DR
AW
ING
S:
SIG
NS
–SE
E G
UID
E S
EC
TION
7
SIG
N FO
R D
C D
ISC
ON
NE
CT
SIG
N FO
R IN
VE
RTE
R O
CP
D A
ND
AC
DIS
CO
NN
EC
T (IF US
ED
)
RA
TED
MPP
CU
RR
EN
T
RA
TED
MPP
VO
LTAG
E
MA
X SYS
TEM VO
LTAG
E
MA
X CIR
CU
IT CU
RR
ENT
AVVA
PH
OTO
VOLTA
IC P
OW
ER
SO
UR
CE
WA
RN
ING
: ELE
CTR
ICA
L SH
OC
KH
AZA
RD
–LINE
AN
D LO
AD
MA
Y B
EE
NE
RG
IZED
IN O
PE
N P
OS
ITION
AC
OU
TPU
T CU
RR
EN
T
NO
MIN
AL A
C V
OLTA
GE
AV
SO
LAR
PV
SY
STE
MA
C P
OIN
T OF C
ON
NE
CTIO
N
THIS
PA
NE
L FED
BY
MU
LTIPLE
SO
UR
CE
S (U
TILITY A
ND
SO
LAR
)
Expedited Permit Process for PV Systems 16
Mic
ro
-Inv
erter Elec
tric
al Diag
ram
Contractor N
ame,
Address and Phone:O
ne-Line Standard E
lectrical Diagram
for Micro-Inverter P
V S
ystems
Site N
ame:
Site Address: S
ystem A
C S
ize: SIZE
FSCM N
ODW
G N
OREV
E1.1a0
SCALEN
TSDate:
SHEET
Drawn By:
Checked By:
DES
CR
IPTION
OR
CO
ND
UC
TOR
TYPE
USE
-2 or PV
WIR
E
GEC
EGC
X ALL TH
AT A
PPLY
EXTE
RIO
R C
AB
LE LIS
TED
W/ IN
V.TH
WN
-2 or XHH
W-2 or R
HW
-2 G
EC EG
C X A
LL THA
T AP
PLYN
O D
C G
EC
IF 690.35 SYS
TEM
THW
N-2 or XH
HW
-2 or RH
W-2
GEC
EGC
X ALL TH
AT A
PPLY
TAG
12345
CON
DUIT AN
D CON
DUCTO
R SCHEDULE
CO
ND
.G
AU
GE
MFG
MFG
NU
MB
ER
OF
CO
ND
UC
TOR
SM
FG C
able
MFG
Cable
CO
ND
UIT
TYPE
N/A
N/A
N/A
SAM
E
SAM
E
CO
ND
UIT
SIZE
N/A
N/A
N/A
SA
ME
SA
ME
DE
SC
RIP
TION
PV
DC
or AC
MO
DU
LED
C/AC
INV
ERTE
R (M
ICR
O)
J-BO
X (IF U
SED
)PV
ARR
AY
AC C
OM
B. P
AN
EL (IF U
SED
)G
EN
METER
(IF US
ED
)AC
DIS
CO
NN
ECT (IF U
SED
)SE
RVIC
E P
ANEL
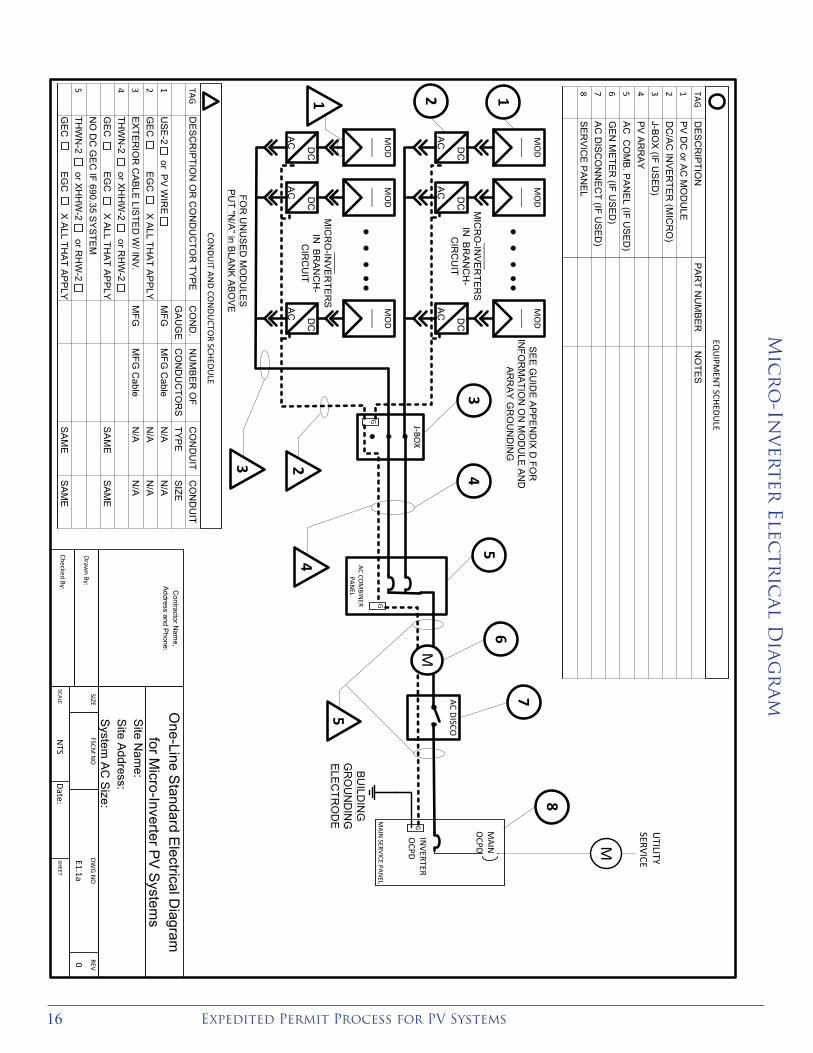
TAG12345678
PAR
T NU
MB
ERN
OTES
FOR
UN
US
ED M
OD
ULE
SP
UT "N
/A” in B
LAN
K AB
OVE
1 1
3
23
EQU
IPMEN
T SCHEDULE
2
_____ M
ICR
O-IN
VER
TER
S
IN B
RA
NC
H-
CIR
CU
IT
MO
D____D
C
AC
MO
D____D
C
AC
MO
D____D
C
AC
MO
D____D
C
AC
MO
D____D
C
AC
MO
D____D
C
AC
J-BOX
4
AC DISCO
M
BU
ILDIN
GG
RO
UN
DIN
G
ELE
CTR
OD
E G
M
UTILITY
SERVICE
MAIN
SERVICE PANEL
MAIN
OCPD
INVERTER
OCPD
67
8
5
45
G
SEE
GU
IDE
AP
PEN
DIX D
FOR
IN
FOR
MATIO
N O
N M
OD
ULE
AND
AR
RA
Y GR
OU
ND
ING
AC COM
BINER
PANEL
G
____ M
ICR
O-IN
VER
TER
S
IN B
RAN
CH
-C
IRC
UIT
17Solar America Board for Codes and Standards Report
Contractor N
ame,
Address and Phone:N
otes for One-Line S
tandard Electrical
Diagram
for Single-P
hase PV
System
sS
ite Nam
e: Site Address: S
ystem A
C S
ize: SIZE
FSCM N
ODW
G N
OREV
E1.2a
SCALEN
TSDate:
SHEET
Drawn By:
Checked By:
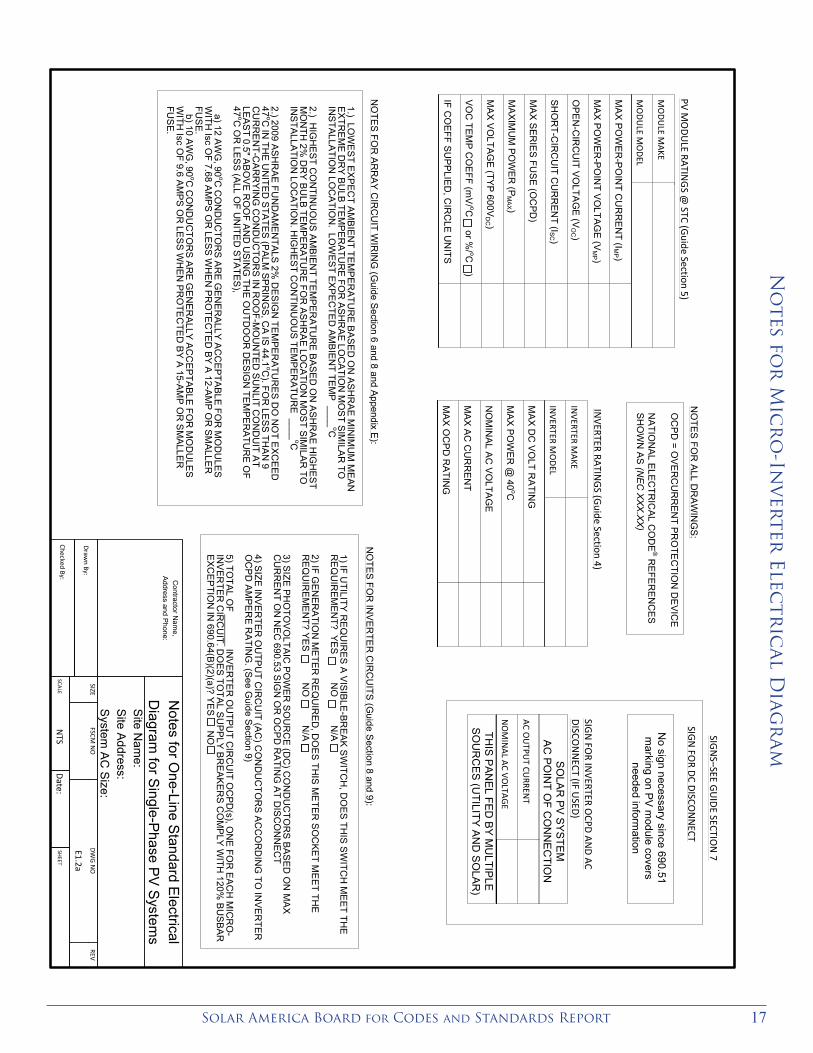
MA
X PO
WER
-PO
INT C
UR
REN
T (IMP )
MA
X PO
WER
-PO
INT V
OLTAG
E (V
MP )
OP
EN-C
IRC
UIT VO
LTAG
E (V
OC )
SHO
RT-C
IRC
UIT C
UR
REN
T (ISC )
MA
X SER
IES FU
SE (O
CPD
)
MA
XIMU
M P
OW
ER (P
MA
X )
MA
X VO
LTAGE (TY
P 600V
DC )
VOC
TEMP C
OE
FF (mV
/ oC or %
/ oC )
IF CO
EFF SU
PPLIE
D, C
IRC
LE U
NITS
MO
DULE M
AKE
MO
DULE M
ODEL
PV MO
DULE RATIN
GS @
STC (Guide Section 5)
MA
X DC
VO
LT RA
TING
MA
X P
OW
ER @
40oC
NO
MIN
AL AC VO
LTAG
E
MA
X AC
CU
RR
EN
T
MA
X OC
PD
RATIN
G
INVERTER M
AKE
INVERTER M
ODEL
INVERTER RATIN
GS (G
uide Section 4)
1) IF UTILITY
RE
QU
IRE
S A V
ISIBLE
-BREA
K S
WITC
H, D
OES
THIS S
WITC
H M
EET TH
E
RE
QU
IRE
ME
NT? YE
S N
O
N/A
2) IF GE
NE
RA
TION
METER
RE
QU
IRE
D, D
OE
S THIS
ME
TER
SO
CKE
T ME
ET THE
RE
QU
IRE
ME
NT? YE
S
NO
N
/A
3) SIZE
PH
OTO
VO
LTAIC P
OW
ER
SO
UR
CE (D
C) C
ON
DU
CTO
RS
BA
SED
ON
MA
X
CU
RR
EN
T ON
NE
C 690.53 S
IGN
OR
OC
PD
RA
TING
AT DIS
CO
NN
EC
T
4) SIZE
INV
ERTE
R O
UTP
UT C
IRC
UIT (A
C) C
ON
DU
CTO
RS
AC
CO
RD
ING
TO IN
VER
TER
O
CP
D A
MP
ERE R
ATING
. (See G
uide Section 9)
5) TOTAL O
F ______ INV
ER
TER O
UTP
UT C
IRC
UIT O
CP
D(s), O
NE
FOR
EAC
H M
ICR
O-
INV
ERTER
CIR
CU
IT. DO
ES TO
TAL SU
PPLY B
RE
AKE
RS
CO
MP
LY W
ITH 120%
BU
SBAR
EX
CEP
TION
IN 690.64(B)(2)(a)? YE
SN
O
NO
TES FO
R IN
VER
TER
CIR
CU
ITS (Guide S
ection 8 and 9):
1.) LOW
ES
T EXP
ECT A
MB
IENT TE
MP
ERATU
RE
BA
SED
ON
ASH
RA
E M
INIM
UM
MEA
N
EXTR
EM
E D
RY B
ULB
TEM
PER
ATUR
E FO
R A
SHR
AE
LOC
ATIO
N M
OS
T SIM
ILAR
TO
INS
TALLA
TION
LOC
ATIO
N. LO
WE
ST EXP
ECTE
D A
MB
IENT TE
MP
____oC
2.) HIG
HE
ST CO
NTIN
UO
US
AM
BIEN
T TEM
PER
ATUR
E B
ASE
D O
N A
SHR
AE
HIG
HE
ST M
ON
TH 2%
DR
Y BU
LB TEMPE
RA
TUR
E FOR
ASH
RA
E LOC
ATION
MO
ST SIMILA
R TO
IN
STA
LLATIO
N LO
CA
TION
. HIG
HE
ST CO
NTIN
UO
US
TEM
PER
ATUR
E ____
oC
2.) 2009 ASH
RA
E FUN
DA
ME
NTA
LS 2%
DE
SIG
N TEM
PER
ATUR
ES D
O N
OT E
XCE
ED
47oC
IN TH
E U
NITE
D S
TATES
(PA
LM SP
RIN
GS
, CA
IS 44.1
oC). FO
R LE
SS TH
AN
9 C
UR
RE
NT-C
AR
RY
ING
CO
ND
UC
TOR
S IN R
OO
F-MO
UN
TED
SU
NLIT C
ON
DU
IT AT
LEAST 0.5" A
BO
VE R
OO
F AN
D U
SIN
G TH
E OU
TDO
OR
DE
SIGN
TEMPE
RA
TUR
E OF
47oC
OR
LESS (A
LL OF U
NITE
D S
TATES
),
a) 12 AWG
, 90oC
CO
ND
UC
TOR
S A
RE
GE
NER
ALLY AC
CE
PTABLE FO
R M
OD
ULE
S
WITH
Isc OF 7.68 AM
PS O
R LE
SS W
HE
N PR
OTE
CTED
BY A 12-AM
P OR
SMA
LLER
FU
SE.
b) 10 AWG
, 90oC
CO
ND
UC
TOR
S A
RE
GE
NER
ALLY AC
CE
PTABLE FO
R M
OD
ULE
S
WITH
Isc OF 9.6 A
MP
S OR
LESS W
HE
N P
RO
TEC
TED
BY A
15-AMP O
R S
MA
LLER
FU
SE.
NO
TES
FOR
AR
RAY
CIR
CU
IT WIR
ING
(Guide S
ection 6 and 8 and Appendix E
):
OC
PD = O
VE
RC
UR
RE
NT PR
OTE
CTIO
N D
EVIC
E
NA
TION
AL E
LEC
TRIC
AL C
OD
E®
RE
FER
ENC
ES
SH
OW
N A
S (NE
C X
XX
.XX
)
NO
TES FO
R A
LL DR
AW
ING
S:
SIGN
S–SEE GU
IDE SECTION
7
SIGN
FOR DC DISCO
NN
ECT
SIGN
FOR IN
VERTER OCPD AN
D AC DISCO
NN
ECT (IF USED)
No sign necessary since 690.51
marking on P
V m
odule covers needed inform
ation
AC OU
TPUT CU
RRENT
NO
MIN
AL AC VOLTAG
E
SO
LAR
PV
SY
STE
MA
C P
OIN
T OF C
ON
NE
CTIO
N
THIS
PA
NE
L FED
BY
MU
LTIPLE
S
OU
RC
ES
(UTILITY
AN
D S
OLA
R)
No
tes for
Mic
ro
-Inv
erter Elec
tric
al Diag
ram
Expedited Permit Process for PV Systems 18
Contractor N
ame,
Address and P
hone:O
ne-Line Standard E
lectrical Diagram
for AC
Module P
V S
ystems
Site N
ame:
Site Address: S
ystem A
C Size:
SIZEFSCM
NO
DWG
NO
REV
E1.1b
SCALEN
TSDate:
SHEET
Drawn By:
Checked By:
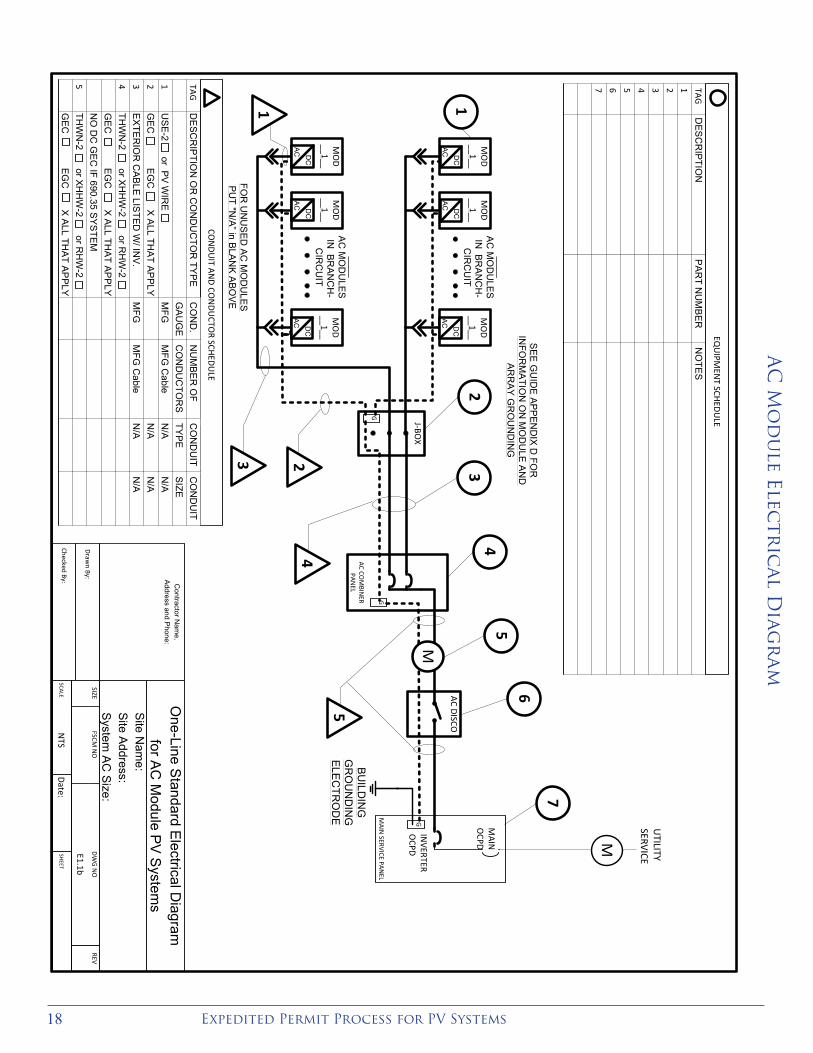
DE
SC
RIP
TION
OR
CO
ND
UC
TOR
TYP
E
US
E-2 or PV W
IRE
G
EC
EGC
X ALL TH
AT APPLY
EX
TER
IOR
CAB
LE LISTED W
/ INV
.TH
WN
-2 or XH
HW
-2 or RH
W-2
GE
C EG
C X
ALL THAT AP
PLYN
O D
C G
EC IF 690.35 S
YSTEM
THW
N-2 or X
HH
W-2 or R
HW
-2G
EC
EGC
X ALL TH
AT APPLY
TAG
12345
CON
DUIT AN
D CON
DUCTO
R SCHEDULE
CO
ND
.G
AUG
EM
FG
MFG
NU
MBE
R O
FC
ON
DU
CTO
RS
MFG
Cable
MFG
Cable
CO
ND
UIT
TYPE
N/A
N/A
N/A
CO
ND
UIT
SIZEN
/AN
/AN
/A
DES
CR
IPTION
TAG1234567
PAR
T NU
MBE
RN
OTE
S
FOR
UN
US
ED AC
MO
DU
LES
PU
T "N/A” in B
LANK A
BOV
E
12
23
EQU
IPMEN
T SCHEDULEJ-BO
X
4
AC DISCO
M
BU
ILDIN
GG
RO
UN
DIN
G
ELE
CTR
OD
E G
M
UTILITY
SERVICE
MAIN
SERVICE PANEL
MAIN
OCPD
INVERTER
OCPD
56
7
5
34
G
SEE
GU
IDE
APP
END
IX D
FOR
IN
FOR
MA
TION
ON
MO
DU
LE A
ND
A
RR
AY G
RO
UN
DIN
G
AC COM
BINER
PANEL
G
____ A
C M
OD
ULES
IN BR
AN
CH
-C
IRC
UIT
MO
D__1__
DC
AC
MO
D__1__
DC
AC
MO
D__1__
DC
AC
____ A
C M
OD
ULES
IN BR
AN
CH
-C
IRC
UIT
MO
D__1__
DC
AC
MO
D__1__
DC
AC
MO
D__1__
DC
AC
1
AC
Mo
du
le Electr
ical D
iagr
am
19Solar America Board for Codes and Standards Report
AC
Mo
du
le Electr
ical D
iagr
am
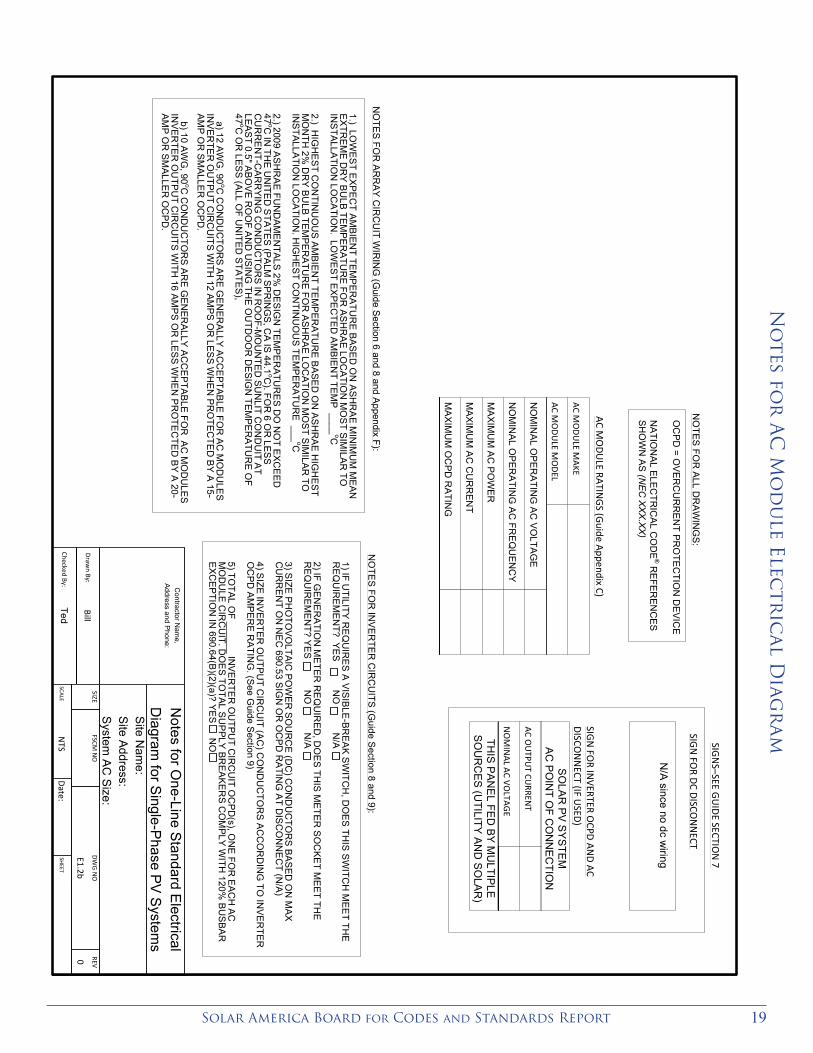
Contractor N
ame,
Address and Phone:
Bill
Ted
Notes for O
ne-Line Standard E
lectrical D
iagram for S
ingle-Phase P
V S
ystems
Site N
ame:
Site Address: S
ystem A
C S
ize: SIZE
FSCM N
ODW
G N
OREV
E1.2b0
SCALEN
TSDate:
SHEET
Drawn By:
Checked By:
NO
MIN
AL OP
ERA
TING
AC
VO
LTAG
E
NO
MIN
AL OP
ERA
TING
AC
FRE
QU
ENC
Y
MA
XIMU
M A
C P
OW
ER
MA
XIMU
M A
C C
UR
REN
T
MA
XIMU
M O
CPD
RA
TING
AC MO
DULE M
AKE
AC MO
DULE M
ODEL
AC MO
DULE RATIN
GS (G
uide Appendix C)
1) IF UTILITY
RE
QU
IRE
S A V
ISIBLE
-BREA
K S
WITC
H, D
OES
THIS S
WITC
H M
EET TH
E
RE
QU
IRE
ME
NT? YE
S N
O
N/A
2) IF GE
NE
RA
TION
METER
RE
QU
IRE
D, D
OE
S THIS
ME
TER
SO
CKE
T ME
ET THE
RE
QU
IRE
ME
NT? YE
S
NO
N
/A
3) SIZE
PH
OTO
VO
LTAIC P
OW
ER
SO
UR
CE (D
C) C
ON
DU
CTO
RS
BA
SED
ON
MA
X
CU
RR
EN
T ON
NE
C 690.53 S
IGN
OR
OC
PD
RA
TING
AT DIS
CO
NN
EC
T (N/A)
4) SIZE
INV
ERTE
R O
UTP
UT C
IRC
UIT (A
C) C
ON
DU
CTO
RS
AC
CO
RD
ING
TO IN
VER
TER
O
CP
D A
MP
ERE R
ATING
. (See G
uide Section 9)
5) TOTAL O
F ______ INV
ER
TER O
UTP
UT C
IRC
UIT O
CP
D(s), O
NE
FOR
EAC
H A
C
MO
DU
LE CIR
CU
IT. DO
ES TO
TAL SU
PPLY
BREA
KER
S CO
MPLY
WITH
120% B
US
BAR
EX
CEP
TION
IN 690.64(B)(2)(a)? YE
SN
O
NO
TES FO
R IN
VER
TER
CIR
CU
ITS (Guide S
ection 8 and 9):
1.) LOW
ES
T EXP
ECT A
MB
IENT TE
MP
ERATU
RE
BA
SED
ON
ASH
RA
E M
INIM
UM
MEA
N
EXTR
EM
E D
RY B
ULB
TEM
PER
ATUR
E FO
R A
SHR
AE
LOC
ATIO
N M
OS
T SIM
ILAR
TO
INS
TALLA
TION
LOC
ATIO
N. LO
WE
ST EXP
ECTE
D A
MB
IENT TE
MP
____oC
2.) HIG
HE
ST CO
NTIN
UO
US
AM
BIEN
T TEM
PER
ATUR
E B
ASE
D O
N A
SHR
AE
HIG
HE
ST M
ON
TH 2%
DR
Y BU
LB TEMPE
RA
TUR
E FOR
ASH
RA
E LOC
ATION
MO
ST SIMILA
R TO
IN
STA
LLATIO
N LO
CA
TION
. HIG
HE
ST CO
NTIN
UO
US
TEM
PER
ATUR
E ___
oC
2.) 2009 ASH
RA
E FUN
DA
ME
NTA
LS 2%
DE
SIG
N TEM
PER
ATUR
ES D
O N
OT E
XCE
ED
47oC
IN TH
E U
NITE
D S
TATES
(PA
LM SP
RIN
GS
, CA
IS 44.1
oC). FO
R 6 O
R LES
S C
UR
RE
NT-C
AR
RY
ING
CO
ND
UC
TOR
S IN R
OO
F-MO
UN
TED
SU
NLIT C
ON
DU
IT AT
LEAST 0.5" A
BO
VE R
OO
F AN
D U
SIN
G TH
E OU
TDO
OR
DE
SIGN
TEMPE
RA
TUR
E OF
47oC
OR
LESS (A
LL OF U
NITE
D S
TATES
),
a) 12 AWG
, 90oC
CO
ND
UC
TOR
S A
RE
GE
NER
ALLY AC
CE
PTABLE FO
R AC
MO
DU
LES
IN
VER
TER O
UTP
UT C
IRC
UITS
WITH
12 AMP
S OR
LESS W
HE
N P
RO
TEC
TED
BY A
15-AM
P OR
SM
ALLE
R O
CP
D.
b) 10 AWG
, 90oC
CO
ND
UC
TOR
S A
RE
GE
NER
ALLY AC
CE
PTABLE FO
R A
C M
OD
ULE
S IN
VER
TER O
UTP
UT C
IRC
UITS
WITH
16 AMP
S OR
LESS W
HE
N P
RO
TEC
TED
BY A
20-AM
P OR
SM
ALLE
R O
CP
D.
NO
TES
FOR
AR
RAY
CIR
CU
IT WIR
ING
(Guide S
ection 6 and 8 and Appendix F):
OC
PD = O
VE
RC
UR
RE
NT PR
OTE
CTIO
N D
EVIC
E
NA
TION
AL E
LEC
TRIC
AL C
OD
E®
RE
FER
ENC
ES
SH
OW
N A
S (NE
C X
XX
.XX
)
NO
TES FO
R A
LL DR
AW
ING
S:
SIGN
S–SEE GU
IDE SECTION
7
SIGN
FOR DC DISCO
NN
ECT
SIGN
FOR IN
VERTER OCPD AN
D AC DISCO
NN
ECT (IF USED)
N/A
since no dc wiring
AC OU
TPUT CU
RRENT
NO
MIN
AL AC VOLTAG
E
SO
LAR
PV
SY
STE
MA
C P
OIN
T OF C
ON
NE
CTIO
N
THIS
PA
NE
L FED
BY
MU
LTIPLE
S
OU
RC
ES
(UTILITY
AN
D S
OLA
R)
No
tes for
AC
Mo
du
le Electr
ical D
iagr
am
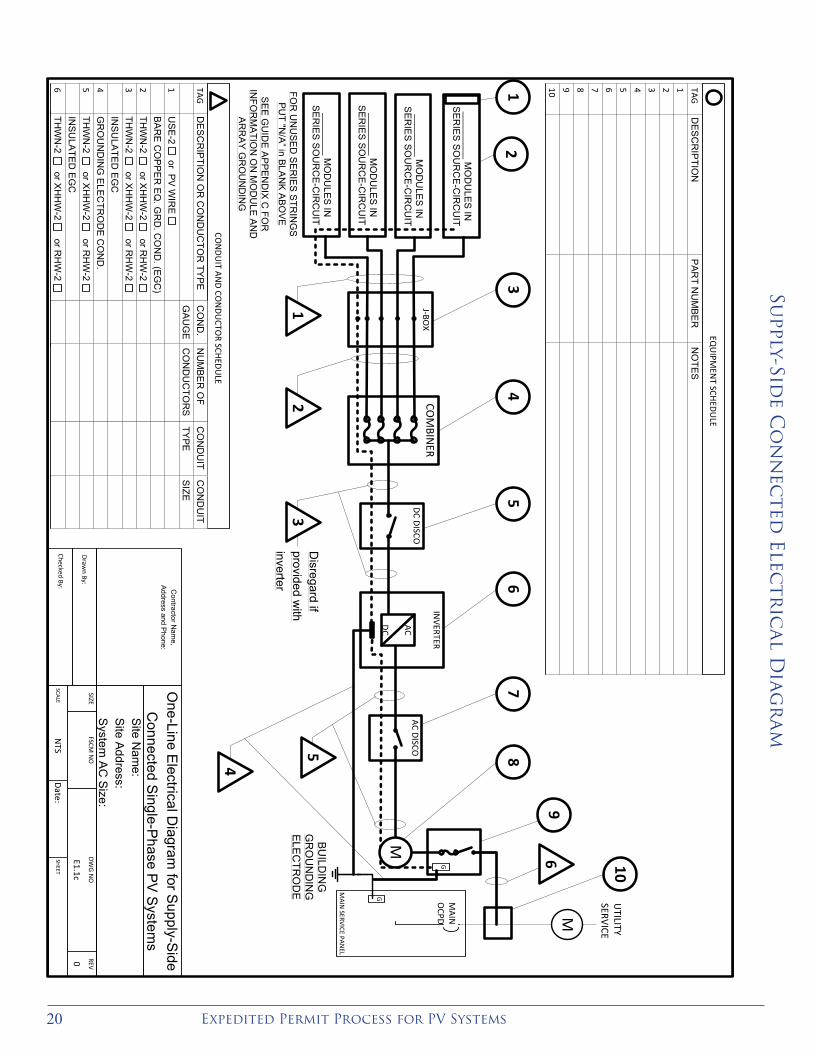
Expedited Permit Process for PV Systems 20
Contractor N
ame,
Address and Phone:O
ne-Line Electrical D
iagram for S
upply-Side
Connected S
ingle-Phase P
V S
ystems
Site N
ame:
Site Address: S
ystem A
C S
ize: SIZE
FSCM N
ODW
G N
OREV
E1.1c0
SCALEN
TSDate:
SHEET
Drawn By:
Checked By:
DE
SC
RIP
TION
OR
CO
ND
UC
TOR
TYP
E
US
E-2 or PV W
IRE
BAR
E C
OPP
ER
EQ
. GR
D. C
ON
D. (EG
C)
THW
N-2 or X
HH
W-2 or R
HW
-2 TH
WN
-2 or XH
HW
-2 or RH
W-2
INSU
LATED
EG
CG
RO
UN
DIN
G E
LECTR
OD
E C
ON
D.
THW
N-2 or X
HH
W-2 or R
HW
-2IN
SULATE
D E
GC
THW
N-2 or X
HH
W-2 or R
HW
-2
TAG
123456
CON
DUIT AN
D CON
DUCTO
R SCHEDULE
CO
ND
.G
AUG
EN
UM
BER
OF
CO
ND
UC
TOR
SC
ON
DU
ITTY
PEC
ON
DU
ITSIZE
DES
CR
IPTION
TAG12345678910
PAR
T NU
MBE
RN
OTE
S
FOR
UN
USE
D S
ER
IES S
TRIN
GS
PUT "N
/A” in BLA
NK
ABO
VE
SE
E GU
IDE
APP
END
IX C
FOR
IN
FOR
MA
TION
ON
MO
DU
LE A
ND
A
RR
AY G
RO
UN
DIN
G
_________ MO
DU
LES
IN
SER
IES
SOU
RC
E-C
IRC
UIT
________ MO
DU
LES
IN
SER
IES
SOU
RC
E-C
IRC
UIT
________ MO
DU
LES IN
S
ER
IES S
OU
RC
E-CIR
CU
IT
________ MO
DU
LES IN
S
ER
IES S
OU
RC
E-CIR
CU
IT
DC DISCO
INVERTER
AC DISCOACDC
MBU
ILDIN
GG
RO
UN
DIN
G
ELE
CTR
OD
E G
Disregard if
provided with
inverter
COM
BINER
M
UTILITY
SERVICE
MAIN
SERVICE PANEL
MAIN
OCPD
J-BOX
1
13
45
67
9
23
4
5 82
EQU
IPMEN
T SCHEDU
LE
G 10
6
Supply-Sid
e Co
nn
ected
Electr
ical D
iagr
am
21Solar America Board for Codes and Standards Report
Supply-Sid
e Co
nn
ected
Electr
ical D
iagr
am
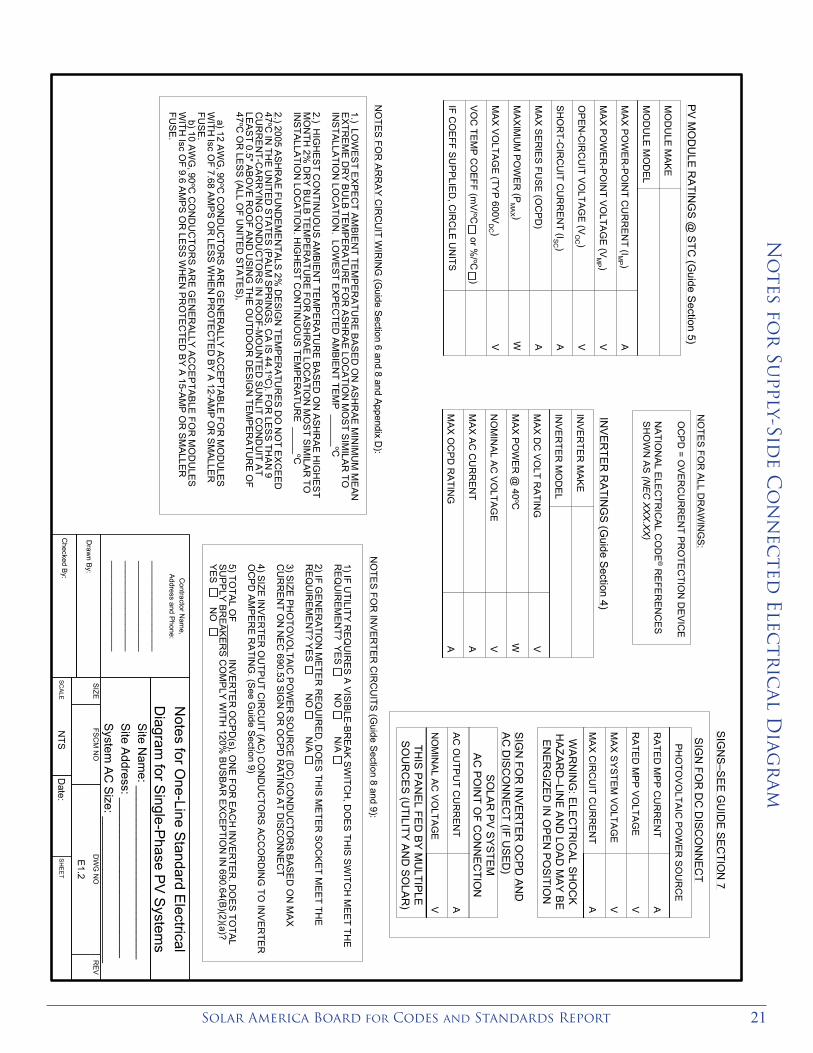
No
tes for
Supply-Sid
e Co
nn
ected
Electr
ical D
iagr
am
Contractor N
ame,
Address and Phone:
____________________________________________________________________
Notes for O
ne-Line Standard E
lectricalD
iagram for S
ingle-Phase P
V S
ystems
Site N
ame: __________________________
Site A
ddress: ________________________System
AC Size: ______________________
SIZEFS
CM
NO
DW
G N
OR
EV
E1.2
SCA
LEN
TSD
ate:S
HE
ET
Draw
n By:
Checked B
y:
MA
X P
OW
ER
-PO
INT C
UR
RE
NT (IM
P )
MA
X P
OW
ER
-POIN
T VOLTA
GE
(VM
P )
OP
EN
-CIR
CU
IT VO
LTAGE (V
OC )
SH
OR
T-CIR
CU
IT CU
RR
EN
T (ISC )
MA
X S
ER
IES FU
SE (O
CP
D)
MA
XIM
UM
POW
ER
(PM
AX )
MA
X V
OLTAG
E (TYP
600VD
C )
VO
C TE
MP
CO
EFF (mV
/ oC or %
/ oC )
IF CO
EFF SU
PPLIED
, CIR
CLE U
NITS
AVVAAWV
MO
DU
LE M
AKE
MO
DU
LE M
OD
EL
PV
MO
DU
LE R
ATIN
GS
@ S
TC (G
uide Section 5)
MAX
DC
VO
LT RA
TING
MAX
POW
ER
@ 40
oC
NO
MIN
AL A
C V
OLTAG
E
MAX
AC C
UR
REN
T
MAX
OC
PD R
ATIN
G
VWVAA
INV
ER
TER M
AKE
INV
ER
TER M
OD
EL
INV
ER
TER
RA
TING
S (G
uide Section 4)
1) IF UTILITY R
EQU
IRES
A VISIB
LE-BR
EAK
SWITC
H, D
OES
THIS S
WITC
H M
EET TH
ER
EQU
IREM
ENT? Y
ESN
ON
/A
2) IF GE
NE
RATIO
N M
ETER
REQ
UIR
ED, D
OE
S TH
IS M
ETER
SOC
KET M
EET TH
ER
EQU
IREM
ENT? Y
ESN
ON
/A
3) SIZE
PH
OTO
VOLTA
IC P
OW
ER
SO
UR
CE
(DC
) CO
ND
UC
TOR
S BAS
ED
ON
MA
XC
UR
RE
NT O
N N
EC
690.53 SIG
N O
R O
CP
D R
ATIN
G A
T DIS
CO
NN
EC
T
4) SIZE
INV
ER
TER O
UTP
UT C
IRC
UIT (AC
) CO
ND
UC
TOR
S A
CC
OR
DIN
G TO
INV
ERTE
RO
CP
D A
MP
ERE
RA
TING
. (See G
uide Section 9)
5) TOTA
L OF ______ IN
VER
TER
OC
PD
(s), ON
E FO
R E
ACH
INVE
RTE
R. D
OES
TOTAL
SU
PP
LY BR
EAK
ERS C
OM
PLY W
ITH 120%
BU
SB
AR EX
CE
PTIO
N IN
690.64(B)(2)(a)?
YES
NO
NO
TES
FOR
INV
ER
TER C
IRC
UITS
(Guide Section 8 and 9):
1.) LOW
EST E
XPE
CT AM
BIEN
T TEM
PE
RA
TUR
E BA
SED
ON
ASH
RAE
MIN
IMU
M M
EAN
EXTR
EM
E D
RY
BU
LB TE
MP
ER
ATU
RE
FOR
AS
HR
AE LO
CA
TION
MO
ST S
IMILAR
TOIN
STALLATIO
N LO
CA
TION
. LOW
EST E
XPE
CTED
AMBIE
NT TE
MP
______oC
2.) HIG
HE
ST C
ON
TINU
OU
S AM
BIEN
T TEM
PE
RA
TUR
E BA
SED
ON
ASH
RAE
HIG
HE
ST
MO
NTH
2% D
RY B
ULB
TEM
PER
ATUR
E FO
R A
SHR
AE LO
CA
TION
MO
ST S
IMILA
R TO
INS
TALLATION
LOC
ATIO
N. H
IGH
EST C
ON
TINU
OU
S TE
MP
ER
ATU
RE
_____oC
2.) 2005 ASH
RA
E FUN
DEM
ENTA
LS 2% D
ESIG
N TE
MP
ERA
TUR
ES D
O N
OT E X
CE
ED
47oC
IN TH
E UN
ITED STATE
S (PALM
SPR
ING
S, CA IS 44.1
oC). FO
R LES
S TH
AN
9C
UR
RE
NT-C
AR
RY
ING
CO
ND
UC
TOR
S IN
RO
OF-M
OU
NTE
D S
UN
LIT CO
ND
UIT AT
LEAS
T 0.5" ABO
VE
RO
OF A
ND
USIN
G TH
E O
UTD
OO
R D
ES
IGN
TEM
PER
ATUR
E O
F47
oC O
R LE
SS (A
LL OF U
NITED
STATE
S),
a) 12 AW
G, 90
oC C
ON
DU
CTO
RS
ARE
GE
NE
RA
LLY AC
CE
PTA
BLE
FOR
MO
DU
LESW
ITH Isc O
F 7.68 AM
PS O
R LES
S W
HE
N P
RO
TEC
TED
BY A
12-AMP
OR
SM
ALLE
RFU
SE.
b) 10 AW
G, 90
oC C
ON
DU
CTO
RS
ARE
GE
NE
RA
LLY AC
CE
PTA
BLE
FOR
MO
DU
LESW
ITH Isc O
F 9.6 AM
PS
OR
LESS
WH
EN P
RO
TECTE
D B
Y A 15-A
MP
OR
SMALLER
FUS
E.
NO
TES FO
R A
RR
AY C
IRC
UIT W
IRIN
G (G
uide Section 6 and 8 and Appendix D):
OC
PD
= OVE
RC
UR
REN
T PR
OTE
CTIO
N D
EV
ICE
NATIO
NAL E
LEC
TRIC
AL CO
DE
® RE
FER
ENC
ES
SH
OW
N A
S (N
EC
XX
X.X
X)
NO
TES FO
R A
LL DR
AW
ING
S:
SIG
NS
–SE
E G
UID
E S
EC
TION
7
SIG
N FO
R D
C D
ISC
ON
NE
CT
SIG
N FO
R IN
VE
RTE
R O
CP
D A
ND
AC
DIS
CO
NN
EC
T (IF US
ED
)
RA
TED
MPP
CU
RR
EN
T
RA
TED
MPP
VO
LTAG
E
MA
X SYS
TEM VO
LTAG
E
MA
X CIR
CU
IT CU
RR
ENT
AVVA
PH
OTO
VOLTA
IC P
OW
ER
SO
UR
CE
WA
RN
ING
: ELE
CTR
ICA
L SH
OC
KH
AZA
RD
–LINE
AN
D LO
AD
MA
Y B
EE
NE
RG
IZED
IN O
PE
N P
OS
ITION
AC
OU
TPU
T CU
RR
EN
T
NO
MIN
AL A
C V
OLTA
GE
AV
SO
LAR
PV
SY
STE
MA
C P
OIN
T OF C
ON
NE
CTIO
N
THIS
PA
NE
L FED
BY
MU
LTIPLE
SO
UR
CE
S (U
TILITY A
ND
SO
LAR
)
Expedited Permit Process for PV Systems 22
Section 1. Required Information for Permit1. Site plan showing location of major components on the property. This drawing need
not be to scale, but it should represent relative location of components at site. (see supplied example site plan).
Explanation: This is a simple diagram to show where the equipment is located on the property. This can be a zone-clearance plot plan with the equipment clearly shown and identified on the plan. If PV array is ground-mounted, clearly show that system will be mounted within allowable zoned setbacks. See site plan example drawing in permit process for reference.
2. Electrical diagram showing PV array configuration, wiring system, overcurrent protection, inverter, disconnects, required signs, and ac connection to building (see supplied standard electrical diagram).
Explanation: The cornerstone of a simplified permit process is the ability to express the electrical design with a generic electrical diagram. This diagram has been designed to accurately represent the majority of single-phase, residential-sized PV systems. PV systems may vary dramatically in PV array layout and inverter selection. However, the majority of small-scale, residential-sized PV systems can be accurately represented by this diagram. This diagram must be fully completed filled out in order for the permit package to be submitted.
3. Specification sheets and installation manuals (if available) for all manufactured components including, but not limited to, PV modules, inverter(s), combiner box, disconnects, and mounting system.
Explanation: At a minimum, specification sheets must be provided for all major components. In addition to the components listed, other important components may be specialty fuses, circuit breakers, or any other unique product that may need to be reviewed by the local jurisdiction. Installation manuals are also listed in this item. This is referring to the brief versions of manuals that are reviewed by the listing agency certifying the product. Some detailed installation manuals can be several dozens or hundreds of pages. If the local jurisdiction feels it is necessary to review these large documents, a good alternative would be for the documents to be supplied electronically, rather than in print.
Section 2. Step 1: Structural Review of PV Array Mounting System1. Is the array to be mounted on a defined, permitted roof structure? l Yes l No
(structure meets modern codes)
If No, submit completed worksheet for roof structure WKS1.Explanation: The reference to a defined, permitted roof structure refers to structures that have a
clear inspection history so that verification of structural elements is unnecessary. If structural modifications have been made due to remodeling, those changes should be documented through the permit and review process. It also recognizes the fact that code enforcement for roof structural elements has been much more consistent across the United States in the last 35 years. However, there may be many local jurisdictions who have been carefully reviewing roof structures for a much longer period of time. The local jurisdiction should consider extending this limit based on the period that roofs have been consistently inspected. In areas where jurisdictional reviews have not extended 35 years into the past, the jurisdiction may need to get the information from WKS1 to be sure whether or not the proposed PV system is being installed on a typical roof structure or not.
Roof Information:
1. Is the roofing type lightweight (Yes = composition, lightweight masonry, metal, wood shake, etc.)_____________
If No, submit completed worksheet for roof structure WKS1 (No = heavy masonry, slate, etc.).
Explanation: There is a need to distinguish if a roof has a lightweight product. Roof structures supporting heavier roofing materials (e.g. slate, heavy masonry) may not have the assumed dead loading and live loading capacities that are found with lighter weight roofing materials. These are much less common roof types and often justify a further review to clarify whether the roof structure is either in compliance or needs enhancement.
Expedited Permit Guidelines for Small-Scale PV Systems

23Solar America Board for Codes and Standards Report
2. If a composition shingle roof, does the roof have a single roof covering? l Yes l No
If No, submit completed worksheet for roof structure WKS1.Explanation: Multiple composition roof layers may be taking a portion or all of the assumed additional
weight allowance found in the 5 lbs/ft2 allowance at the end of the mounting system section.
3. Provide method and type of weatherproofing roof penetrations (e.g. flashing, caulk.)____________
Explanation: The weatherproofing method needs to be specifically identified so that plan checkers and field inspectors are notified ahead of time of the method being used. Some jurisdictions may constrain weatherproofing methods and materials. Sealant information should confirm that the product is compatible with the roofing material.
Mounting System Information:
1. Is the mounting structure an engineered product designed to mount PV modules with no more than an 18” gap beneath the module frames? l Yes l No
If No, provide details of structural attachment certified by a design professional.Explanation: Non-engineered racking systems have undefined capabilities. PV systems should only
be mounted using systems that are engineered and designed for that purpose. Structural loading of a roof is more complex when modules are angled more than 18” above the roof surface. For simplicity, this process has been limited to PV arrays that are mounted parallel to the roof surface or angled with no more than an 18” gap between the module frame and the roof surface. If an installer chooses to mount the PV modules with a larger gap or if they use a mounting system of unique design, then the mounting design would require a review by a design professional.
2. For manufactured mounting systems, fill out information on the mounting
system below:
a. Mounting System Manufacturer ___________Product Name and Model#_____________ (self-explanatory)
b. Total Weight of PV Modules and Rails ___________lbs (include total weight of all hardware used along with module weight)
c. Total Number of Attachment Points____________(self-explanatory)
d. Weight per Attachment Point (b÷c)_________________lbs (if greater than 45 lbs, see WKS1)
Explanation: 45 lbs has been used by some jurisdictions as a reasonable level below which point loading of roof joists and trusses can be ignored. Most standard mounting systems have point loadings of 25-35 lbs per attachment.
e. Maximum Spacing Between Attachment Points on a Rail _____________inches (see product manual for maximum spacing allowed based on wind loading)
Explanation: Depending on the wind loading requirements of a particular jurisdiction, the spacing or attachments may be dictated by the manufacturer’s directions. For instance, a particular manufacturer may allow a 72” attachment spacing for a 90 MPH windspeed design, but the spacing reduces to a maximum of 48” when the design windspeed exceeds 100 MPH.
f. Total Surface Area of PV Modules (square feet)_________________ ft2
Explanation: Take the surface area of a single module, and multiply it by the total number of modules in the roof-mounted system.
g. Distributed Weight of PV System on Roof (b÷f)_______________ lbs/ft2
If distributed weight of the PV system is greater than 5 lbs/ft2, see WKS1.
Explanation: The 5 lbs/ft2 limit is based on two things: 1) the roof is typical of standard code-compliant roof structures so that the structure either has the proper spans and spacing, or proper use of engineered trusses (first item under “Step 1: Structural Review”); and, 2) there is a single layer of roofing so that the normal weight allowance for additional roof layers is unused and available for the weight of the PV system. For applications on lightweight masonry roofing materials and other lightweight roofing products (e.g. metal, shake, etc.), these materials do not accept multiple layers and therefore the 5 lbs/ft2 allowance is used to identify the maximum allowable additional weight for roofs that are exchanging the allowable live load for a dead load that prevents live load such as people walking on the roof.

Expedited Permit Process for PV Systems 24
Section 3. Step 2: Electrical Review of PV System (Calculations for Electrical Diagram) In order for a PV system to be considered for an expedited permit process, the following must apply:
1. PV modules, utility-interactive inverters, and combiner boxes are identified for use in PV systems.
Explanation: PV utility-interactive inverters must be specifically listed and labeled for this application [NEC 690.60 and 690.4] (Brackets refer to sections in the 2011 NEC throughout this document.)Without this specific identification process an unacceptable amount of review would be necessary to approve an inverter. Inverters that pass UL1741 and are listed as “utility-interactive” have met the requirement. Over 500 inverters currently meet this requirement. An inclusive list of these inverters is available online at http://gosolarcalifornia.com/equipment/inverter.php.
PV modules must also be listed and identified for use in PV systems [NEC 690.4]. PV modules that pass UL1703 and have a 600-Volt maximum voltage meet the requirement. A list of these modules is available online at http://gosolarcalifornia.com/equipment/pvmodule.php. Source-circuit combiners must be listed and labeled to meet the dc voltage requirements of the PV system or be specifically tested for PV systems and clearly state the allowable maximum current and voltage [NEC 690.4].
2. The PV array is composed of 4 series strings or less, for AC module and micro-inverter arrays, PV array is composed of 4 branch circuits or less.Explanation: The purpose of this requirement is to limit the number of options of what can
comply as a “simple” system so that a single electrical diagram can be used to describe a large percentage of the systems being installed. The electrical diagram can handle up to 4 strings or branch circuits in parallel. This ensures that the conduit will have no more than eight current-carrying conductors, which the ampacity tables in this guide have been based upon.
3. The combined inverter continuous AC power output 13,440 Watts or less.Explanation: The limit is set to stay generally within electrical interconnections that would
be considered simple and possibly able to meet the 120% of busbar rating allowance in NEC 690.64(B) in a residence (Minimum breaker for a 13.44 kWac PV system is 70 amps at 240Vac). A 70-amp breaker is important since a 225-amp busbar in a 200-amp panel will allow a 70-amp PV breaker. Since this does happen from time to time, and an installer can choose to install such a panelboard, it is considered the largest “simple” PV system for purposes of this guideline. A table of breaker/ panelboard combinations is in Section 9 of this Guideline.
4. The ac interconnection point is on the load side of service disconnecting means (NEC 690.64(B)).Explanation: Load side interconnections are by far the most common, particularly in
residential applications. Any line side connection is covered by NEC 690.64(A) and 230.82. Although line side connections can be quite straightforward, they should require an additional step in the approval process and require a slightly different electrical drawing.
5. One of the standard electrical diagrams can be used to accurately represent the PV system:
• E1.1: Standard System• E1.1a: Micro-Inverter• E1.1b: AC Module• E1.1c: Supply-Side ConnectedEach diagram has a corresponding notes form. Interactive PDF diagrams are
available at www.solarabcs.org/permitting. Explanation: The basis for a simplified permit is the use of the standard electrical diagram.
Clearly, PV systems can vary significantly in PV array layout and inverter selection. However, the majority of small-scale, residential-sized PV systems can be accurately represented by this diagram. This diagram must be completely filled out in order for the permit package to be considered complete. This diagram is not intended for use with battery-based systems. Interactive PDF versions of all the standard electrical diagrams can be found at www.solarabcs.org/permitting. These diagrams allow values to be input and the page to be saved and printed.
25Solar America Board for Codes and Standards Report
Section 4. Inverter InformationA copy of the manufacturer’s specification sheet is required for a permit submittal. In addition, a printed out digital photo of the inverter listing label can be very helpful for gathering the ratings of the equipment.
a. INVERTER MAKE: This is the manufacturer’s name (e.g. Motech, PV Powered, SMA, etc.)
b. INVERTER MODEL #: This is the model number on the listing label (e.g. PVMate3840U, PVP 5200, SB7000US, etc.)
c. MAX DC VOLTAGE RATING: Provided either on listing label or specification sheet.
d. MAX POWER @ 40ºC: The maximum continuous output power at 40ºC is required information for the listing label and the Go Solar California website. If the specification sheet does not clearly state the value, consult either of these other two sources.
e. NOMINAL AC VOLTAGE: This is the ac output voltage of the inverter as configured for this project. Some inverters can operate at multiple ac voltages.
f. MAX OCPD RATING: This is the maximum overcurrent protective device (OCPD) rating allowed for the inverter. This is either stated on the listing label or in the installation manual. Sometimes this is also listed on the specification sheet—but not always. It is important to check that the inverter OCPD rating in the panel is less than or equal to this maximum rating to preserve the listing of the inverter.
Section 5. Module InformationA copy of the manufacturer’s specification sheet is required for a permit submittal. In addition, a printed out digital photo of the module listing label can be very helpful for gathering the ratings of the equipment. A prerequisite for a code-approved installation is the use of PV modules listed UL 1703 [NEC 690.4]. For a current list of modules that are listed to UL 1703, visit the Go Solar California website, http://gosolarcalifornia.com/equipment/pvmodule.php.
Explanation: This module information is particularly important since it is used to calculate several current and voltage parameters required by the National Electrical Code (NEC). Listing information is necessary for NEC testing requirements [NEC 90.7, 100, 110.3, 690.4].
a) MODULE MANUFACTURER: This is the manufacturer’s name (e.g. BP Solar, Evergreen, Solar World, Sharp, SunPower, Suntech etc.)
b) MODULE MODEL #: This is the model number on the listing label (e.g. BP175B, EGS185, SW175 Mono, ND-U230C1, SP225, STP175S, etc.)
c) MAXIMUM POWER-POINT CURRENT (IMP)Explanation: The rated IMP is needed to calculate system operating current. This is the
current of the module when operating at STC and maximum power.
d) MAXIMUM POWER-POINT VOLTAGE (VMP) Explanation: The rated VMP is needed to calculate system operating voltage. This is the voltage of the module when operating at STC and maximum power.
e) OPEN-CIRCUIT VOLTAGE (VOC)Explanation: The rated VOC is needed to calculate maximum system voltage specified in NEC 690.7.
f) SHORT-CIRCUIT CURRENT (ISC)Explanation: The rated ISC is needed to calculate maximum current specified in NEC 690.8(A).
g) MAXIMUM SERIES FUSE (OCPD)Explanation: The maximum series fuse (OCPD) rating is needed to ensure that the proper
overcurrent protection is provided for the modules and array wiring.h) MAXIMUM POWER (PMAX) at Standard Test Conditions (STC is 1000W/m2, 25°C
cell temp, & Air Mass 1.5) Explanation: Maximum power at STC specifies the rated power of the PV module under simulated conditions.
Expedited Permit Process for PV Systems 26
i) MAXIMUM SYSTEM VOLTAGE Explanation: Maximum system voltage (often but not always 600 Vdc) is needed to show that
the NEC 690.7 voltage does not exceed this value.
Section 6. Array InformationThis section defines the configuration of the PV array. PV arrays are generally made up of several modules in series, called “source circuits.” These source circuits are often paralleled with multiple other source circuits to make up the entire dc generating unit called an “array.” The last four items related to the PV array must be calculated and posted on a sign at the PV power source disconnect. The first two items a) and b) characterize the array design and provide the information necessary to calculate the four items needed to produce proper array identification for the PV power source sign discussed in Section 7 that is required at the site.
a) NUMBER OF MODULES IN SERIES
Explanation: For simplicity, this diagram only addresses the most common configuration of PV modules—multiple modules in series. Although single module PV power sources exist, it is more common to see PV arrays configured with as many as 12 to 24 modules in series.
b) NUMBER OF PARALLEL CIRCUITS
Explanation: Since single-phase inverters can be as large as 12 kW or more, and the largest PV source circuits are only about 2 to 5 kW, it is common for PV arrays to have two or more source circuits in parallel. From Example in Appendix A:
Number of modules in series = 14 Number of parallel source circuits = 3 Total number of modules = 14 x 3 = 42
c) LOWEST EXPECTED AMBIENT TEMP
Explanation: Up through the 2008 edition, the NEC has not clearly defined “lowest expected ambient temperature.” ASHRAE (American Society of Heating, Refrigeration, and Air Conditioning Engineers) has performed statistical analysis on weather data from the National Weather Service. These data include values for the mean extreme temperatures for the locations with temperature data. The mean extreme low temperature is the coldest expected temperature for a location. Half of the years on record have not exceeded this number, and the rest have exceeded this number. These data are supplied in the appendix for reference. The 2011 NEC includes an informational Note to 690.7 that specifies the use of the ASHRAE mean extreme value for lowest expected ambient temperature when calculating maximum system voltage.
d) HIGHEST CONTINUOUS TEMP (ambient)
Explanation: Up through the 2011 edition, the NEC has not clearly defined “highest continuous ambient temperature.” Continuous is defined in the NEC as a 3-hour period Article 100. ASHRAE (American Society of Heating, Refrigeration, and Air Conditioning Engineers) has performed statistical analysis on weather data from the National Weather Service. These data include design values of 0.4%, 1%, and 2% for each month signifying that the temperature only exceeds the recorded value up to the specified time for a given location with temperature data. The average for June, July, and August of the 2% value has been chosen by the Copper Development Association as the value that best represents a condition that would create the 3-hour continuous condition referred to in Article 100. Two percent of one month is about 14 hours. Since high temperatures usually last for several days in most locations, the assumption is that at least one or two 3-hour high temperature events will happen during a given month. These data are supplied in the appendix for reference. If a designer seeks a more conservative approach to temperature, the 0.4% data for hottest month of the year is an alternative value. 0.4% of one month is about 3 hours. Using the 0.4% value assumes that all 3 hours occur on the same day which would be the statistical worst case scenario. Both the 3-month average 2% data and the hottest single month 0.4% data are supplied in the appendix for reference.
27Solar America Board for Codes and Standards Report
Section 7. Signsa) PV POWER SOURCE
i) RATED MPP (MAXIMUM POWER-POINT) CURRENT (sum of parallel source circuit operating currents)Explanation: Rated MPP current is found by multiplying the module rated MPP current for a
module series string by the number of source circuits in parallel. From the example in Appendix A:
IMP = 7.80 amps Number of source circuits in parallel = 3 7.80amps x 3 = 23.4 amps
ii) RATED MPP (MAXIMUM POWER-POINT) VOLTAGE (sum of series modules operating voltage in source circuit)Explanation: Operating voltage is found by multiplying the module rated MPP voltage by the
number of modules in a series source circuit. From the example in Appendix A:
VMP = 29.5 Volts Number of modules in series = 11 29.5 Volts x 11 = 325 Volts
iii) MAXIMUM SYSTEM VOLTAGE [NEC 690.7]Explanation: Maximum system voltage is calculated by multiplying the value of Voc on the listing
label by the appropriate value on Table 690.7 in the NEC, and then multiplying that value by the number of modules in a series string. The table in the NEC is based on crystalline silicon modules and uses lowest expected ambient temperature at a site to derive the correction factor. Some modules do not have the same temperature characteristics as crystalline silicon so the manufacturer’s instructions must be consulted to determine the proper way to correct voltage based on lowest expected ambient temperature. As of the 2008 NEC, the manufacturer’s temperature correction factor must be used for all modules, regardless of construction, if the information is supplied. All known listed modules currently provide this information.
From the example in Appendix A: Module VOC = 37.0 Volts Rating temperature= 25°C Number of Modules in Series = 11 Lowest expected ambient temperature (ASHRAE)= 1°C (Ontario, California) Maximum System Voltage = VMAX = V
OC x # of Modules in Series x Temperature
Correction Factor Method 1— Module Manufacturer’s Temperature Correction Factor—Percentage Method
Temperature Coefficient for VOC = αVOC = -0.37%/C = -0.0037/C Temperature Correction Factor = 1 + α VOC (%) x (TempLOW - TempRATING) = 1 + (-0.0037/C) x (-1°C - 25°C) = 1 + 0.0962 = 1.0962 VMAX = 37V x 11 x 1.0962 = 446 Volts < 500Volts (compliant for a 500VMAX inverter)
Method 2— Module Manufacturer’s Temperature Correction Factor—Voltage MethodTemperature Coefficient for VOC = αVOC = 137mV/C = 0.137 V/C Temperature Correction Factor = 1+[αVOC (V) x (TempLOW - TempRATED) ÷ VOC] = 1+ [0.137 V/C x (-1°C - 25°C) ÷ 37V] = 1+ [5.206V ÷ 37V] = 1.0963 VMAX = 37V x 11 x 1.0963 = 446 Volts < 500Volts (compliant for a 500VMAX inverter)
Method 3—Table 690.7 Temperature Correction Factor From row for ambient temperature = -1°C to -5°C 1.12 VMAX = 37V x 11 x 1.12 = 456 Volts < 500Volts (compliant for a 500VMAX inverter)
iv) MAXIMUM CIRCUIT CURRENT [NEC 690.8] Explanation: The maximum circuit current is calculated by multiplying the rated Isc of the PV
module by the number of source circuits operating in parallel, then multiplying this value by 125%to account for extended periods of sunlight above the tested solar intensity (rated irradiance=1000
Expedited Permit Process for PV Systems 28
W/m2; maximum continuous irradiance= 1250 W/m2). The NEC in 690.53 asks for the short-circuit current in the 2005 and 2008 editions, but the 2008 edition clarifies in a Fine Print Note that theintended value is the maximum circuit current as defined in 690.8 (A) and is a worst-case continuousshort-circuit current value. From the example in Appendix A:
ISC = 8.4 ampsNumber of source circuits in parallel = 3
8.4 amps x 3 x 1.25 = 31.5 amps
b) WARNING SIGN REQUIRED BY NEC 690.17. Explanation: Any time a switch can have the load side energized in the open position, a warning sign must be placed on the switch. This is nearly always true of the dc disconnect at the inverter. The line side of the switch is energized by the PV array, while the load side of the switch is often energized by input capacitors of the inverter. These capacitors can remain energized for five minutes or more as the bleed resistors dissipate the charge over time. The warning sign should read essentially as follows:
WARNING: ELECTRICAL SHOCK HAZARD–LINE AND LOAD MAY BE ENERGIZED IN OPEN POSITION
c) Point of Connection Sign [NEC 690.54](To be placed on the Solar AC Disconnect and AC Point of Connection locations)
i) AC OUTPUT CURRENT Explanation: The ac output current, or rated ac output current as stated in the NEC, at the point of connection is the maximum current of the inverter output at full power. When the rated current is not specifically called out in the specification sheets, it can be calculated by taking the maximum power of the inverter, at 40°, and dividing that value by the nominal voltage of the inverter.
From the example in Appendix A:Maximum Inverter Power = 7,000 wattsNominal Voltage = 240 VoltsIRATED
= 7,000 W/ 240 V = 29.2 amps
ii) NOMINAL AC VOLTAGEExplanation: The nominal ac voltage, or nominal operating ac voltage as stated in the NEC, at
the point of connection is the nominal voltage (not maximum or minimum) of the inverter output. It will be the same as the service voltage. Most residential inverters operate at 240 Volts.
From the example in Appendix A:Nominal Voltage = 240 Volts
d) PV System Disconnect Location Directory [NEC 690.56(B)] (To be placed at service disconnect, if PV System Disconnect is not located at the same location)
Explanation: For first responders, it may not be readily apparent that a PV system has been installed on site. This directory indicates that a PV system has been installed on site and shows the disconnect location. This is only required if the PV disconnect is not immediately adjacent to the existing service disconnect.
Section 8. Wiring and Overcurrent Protectiona) DC Wiring Systems:
Source-circuit conductors:In Exposed Locations:PV module interconnections are generally 90°C wet-rated conductors NEC 690.31(A)
FPN. The same conductor type is typically used for all home run conductors needed for source circuit conductors in exposed locations.
Allowable wire types are as follows:
• USE-2 single conductor cable for exposed locations. [NEC 690.31(B)]
• PVWireorPVCableasasingleconductorforexposedlocations(requiredforallungrounded systems). [NEC 690.31(B), 690.3(0)(3)]
29Solar America Board for Codes and Standards Report
Explanation for the need for High Temperature Conductors: Typical temperature for PV modules in full sun at 20°C outdoor temperature is 50°C. This is a 30°C rise above outdoortemperatures. On the hottest day of the year, outdoor temperatures can reach a continuoustemperature of 41°C in many hot locations throughout the United States. This means that thePV module could be operating at 71°C on the hottest day of the year (41°C+30°C =71°C).75°C wire is insufficient for connection to a hot PV module under this condition. To further support the concern over the high temperature of PV modules, a fine print note has been added to the 2005 NEC.“NEC 690.31 (A) FPN: Photovoltaic modules operate at elevated temperatures when exposed
to high ambient temperatures and to bright sunlight. These temperatures may routinely exceed 70°C (158°F) in many locations. Module interconnection conductors are available with insulation rated for wet locations and a temperature rating of 90°C (194°F) or greater.”
In Conduit on Rooftops:THREE OPTIONS FOR SOURCE CIRCUIT CONDUCTOR TYPE (INSIDE CONDUITCHOOSE ONE) THWN-2, XHHW-2 and RHW-2Explanation: Conductors in conduit, when exposed to direct sunlight, must account for the higher
temperatures caused by intense sunlight and the proximity of the roof. The 2005 NEC first recognized the issue of sunlit conduit in a fine print note in NEC 310.10.
“310.10 FPN No. 2: Conductors installed in conduit exposed to direct sunlight in close proximity to rooftops have been shown, under certain conditions, to experience a temperature rise of 17°C (30°F) above ambient temperature on which the ampacity is based.”
The 2008 NEC codified this issue by classifying the temperatures based on the height above the roof surface. On residential roofs, where conduit typically is spaced between ½” and 3 ½” above the roof surface, the temperature adder is stated as 22°C above the ambient temperature according to NEC Table 310.15(B)(2)(c): in the 2008 NEC, and Table 310.15 (B)(3)(c) in the 2011 NEC. Using this adder, along with the ASHRAE 2% design data for the hottest location in the U.S. (Palm Springs, CA is 44°C), produces a design temperature of 66°C and correction factor of 0.58 for 90°C conductors based on NEC Table 690.31 and Table 310.16 in the 2008 NEC, and 310.15(B)(16) in the 2011 NEC. If nine conductors or less are in the exposed conduit (4 pairs of conductors or less), then the conduit fill correction factor is 0.7 according to NEC Table 310.15(B)(2)(a): in the 2008 NEC, and Table 310.15(B)(3)(a) in the 2011 NEC. Putting all these correction factors together means that the 30°C conductor ampacity can be calculated as follows:
If only two strings in parallel (no fuses):
I30°C. = IMAX/0.58/0.7 = 2.46 x IMAX
When ISC = 12.8 amps or less, then IMAX = ISC x 1.25 = 16 amps or less.
When IMAX = 16 Amps, then I30°C. = 39.4 Amps (10 AWG, 90°C required (NEC Table 310.16))
When ISC= 9.6 amps or less, then IMAX = ISC x 1.25 = 12 amps or less.
When IMAX = 12 Amps, then I30°C. = 29.5 Amps (12 AWG, 90°C required (NEC Table 310.16))
When ISC = 6.4 amps or less, then IMAX = ISC x 1.25 = 8 amps or less.
When IMAX = 8 Amps, then I30°C. = 19.7 Amps (14 AWG, 90°C required (NEC Table 310.16))
If fuses are needed to protect PV modules (most cases), a shortcut to choose a conductor of sufficient ampacity is to use the following calculation:
I30°C. = IFUSE/0.58/0.7 = 2.46 x IFUSE
When ISC = 6.4 amps or less, then IMAX = ISC x 1.25 = 8 amps. The minimum overcurrent protective device (OCPD) as required by 690.8(B) is 10 amps (IFUSE = IMAX x 1.25 = 10A).
When IFUSE = 10 Amps, then I30°C. = 2.46 x 10A = 24.6 Amps (14 AWG, 90°C required (NEC Table 310.16) -10A fuse to protect the conductor)
When ISC = 7.68 amps or less, then IMAX = ISC x 1.25 = 9.6 amps. The minimum overcurrent protective device (OCPD) as required by NEC 690.8(B) is 12 amps (IFUSE = IMAX x 1.25 = 12A).
When IFUSE = 12 Amps, then I30°C. = 2.46 x 12A = 29.5 Amps (12 AWG, 90°C required (NEC Table 310.16) -12A fuse to protect the conductor)
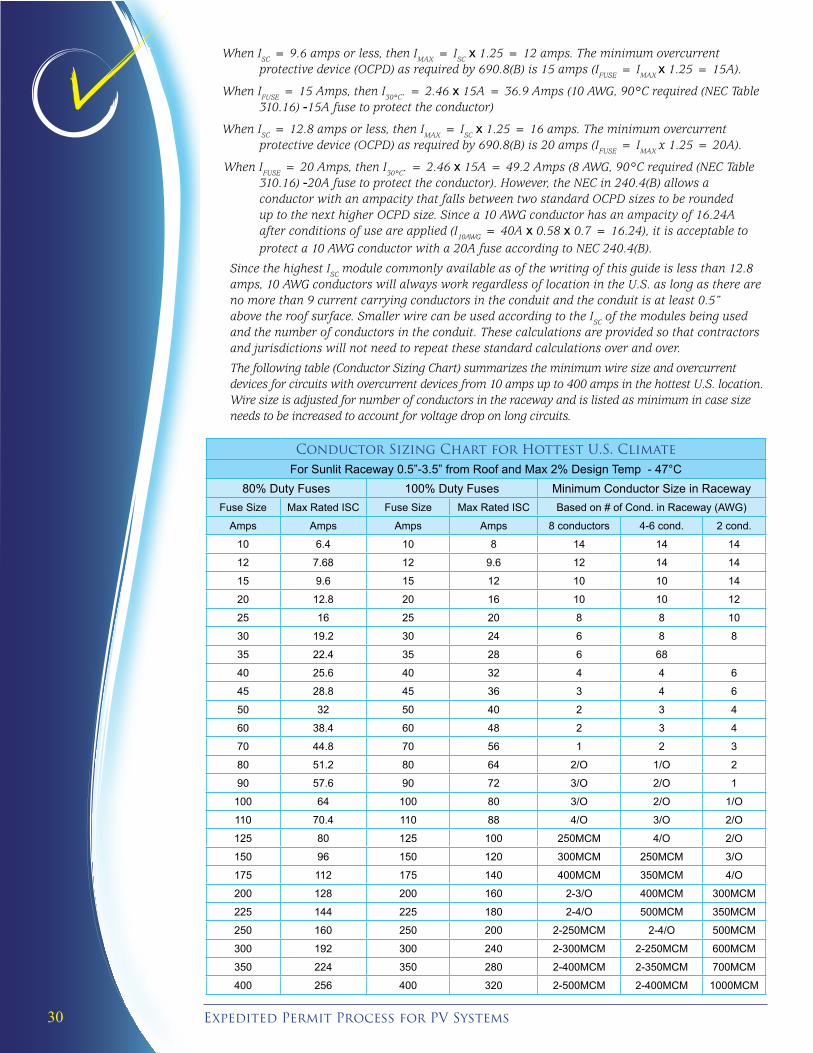
Expedited Permit Process for PV Systems 30
When ISC = 9.6 amps or less, then IMAX = ISC x 1.25 = 12 amps. The minimum overcurrent protective device (OCPD) as required by 690.8(B) is 15 amps (IFUSE = IMAX x 1.25 = 15A).
When IFUSE = 15 Amps, then I30°C. = 2.46 x 15A = 36.9 Amps (10 AWG, 90°C required (NEC Table 310.16) -15A fuse to protect the conductor)
When ISC = 12.8 amps or less, then IMAX = ISC x 1.25 = 16 amps. The minimum overcurrent protective device (OCPD) as required by 690.8(B) is 20 amps (IFUSE = IMAX x 1.25 = 20A).
When IFUSE = 20 Amps, then I30°C. = 2.46 x 15A = 49.2 Amps (8 AWG, 90°C required (NEC Table 310.16) -20A fuse to protect the conductor). However, the NEC in 240.4(B) allows a conductor with an ampacity that falls between two standard OCPD sizes to be rounded up to the next higher OCPD size. Since a 10 AWG conductor has an ampacity of 16.24A after conditions of use are applied (I10AWG = 40A x 0.58 x 0.7 = 16.24), it is acceptable to protect a 10 AWG conductor with a 20A fuse according to NEC 240.4(B).
Since the highest ISC module commonly available as of the writing of this guide is less than 12.8 amps, 10 AWG conductors will always work regardless of location in the U.S. as long as there are no more than 9 current carrying conductors in the conduit and the conduit is at least 0.5” above the roof surface. Smaller wire can be used according to the ISC of the modules being used and the number of conductors in the conduit. These calculations are provided so that contractors and jurisdictions will not need to repeat these standard calculations over and over.
The following table (Conductor Sizing Chart) summarizes the minimum wire size and overcurrent devices for circuits with overcurrent devices from 10 amps up to 400 amps in the hottest U.S. location. Wire size is adjusted for number of conductors in the raceway and is listed as minimum in case size needs to be increased to account for voltage drop on long circuits.
Conductor Sizing Chart for Hottest U.S. ClimateFor Sunlit Raceway 0.5”-3.5” from Roof and Max 2% Design Temp - 47°C
80% Duty Fuses 100% Duty Fuses Minimum Conductor Size in RacewayFuse Size Max Rated ISC Fuse Size Max Rated ISC Based on # of Cond. in Raceway (AWG)
Amps Amps Amps Amps 8 conductors 4-6 cond. 2 cond.
10 6.4 10 8 14 14 14
12 7.68 12 9.6 12 14 14
15 9.6 15 12 10 10 14
20 12.8 20 16 10 10 12
25 16 25 20 8 8 10
30 19.2 30 24 6 8 8
35 22.4 35 28 6 68
40 25.6 40 32 4 4 6
45 28.8 45 36 3 4 6
50 32 50 40 2 3 4
60 38.4 60 48 2 3 4
70 44.8 70 56 1 2 3
80 51.2 80 64 2/O 1/O 2
90 57.6 90 72 3/O 2/O 1
100 64 100 80 3/O 2/O 1/O
110 70.4 110 88 4/O 3/O 2/O
125 80 125 100 250MCM 4/O 2/O
150 96 150 120 300MCM 250MCM 3/O
175 112 175 140 400MCM 350MCM 4/O
200 128 200 160 2-3/O 400MCM 300MCM
225 144 225 180 2-4/O 500MCM 350MCM
250 160 250 200 2-250MCM 2-4/O 500MCM
300 192 300 240 2-300MCM 2-250MCM 600MCM
350 224 350 280 2-400MCM 2-350MCM 700MCM
400 256 400 320 2-500MCM 2-400MCM 1000MCM
31Solar America Board for Codes and Standards Report
b) AC Wiring SystemsInverter Output Circuit overcurrent protection should be sized and protected accord-ing the manufacturer’s directions. The circuit and corresponding overcurrent protection should be sized at a 125% of the maximum continuous output of the inverter [NEC 215.3 Overcurrent for Feeder Circuits, and NEC 690.8(A)(3) and 690.8(B)]. The 125 per-cent increase over the maximum Inverter Output Circuit current is to account for the standard listing of overcurrent devices to 80% of maximum circuit current for continu-ous duty. Listed inverters have a maximum allowable overcurrent protection device re-quirement that is printed on the listing label or found in the installation manual.
Explanation: For instance, the fictitious inverter in the example in Appendix A, the AI-7000 has a maximum continuous output of 29.2 amps and a maximum allowable overcurrent protection of 50 amps. This means that the minimum allowable overcurrent is 40 amps (29.2 amps x 1.25 = 36.5 amps—round up to the next standard size, which is 40 amps) and a maximum of 50 amps. Normally the minimum allowable breaker size is used since the panelboard supply breakers are constrained to 120% of the panelboard busbar rating.
From the example in Appendix A:Inverter continuous output rating = 7000 WattsNominal inverter voltage = 240 VoltsMaximum operating current = 7000 Watts / 240 Volts = 29.2 AmpsMin. Inverter Output Circuit ampacity = 29.2 Amps x 1.25 = 36.5 Amps
Section 9. AC Point of ConnectionNEC 705.12 (D) in the 2011 NEC and 690.64 (B) in the 2008 NEC covers the requirements for Point of Connection of the PV inverter to the building electrical system. The most common method of connection is through a dedicated circuit breaker to a panelboard busbar. The sum of the supply breakers feeding the busbar of a panel can be up to 120% of the busbar rating. Appendix C treats this subject in detail.
Explanation: A service panel containing a 200-amp busbar and a 200-amp main breaker will allow breakers totaling 120% of the busbar rating (240-amps). Since the main breaker is 200 amps, the PV breaker can be up to 40 amps without exceeding the 120% allowance. For a service panel with a 125-amp busbar and a 100-amp main breaker, this provision will allow up to a 50 amp breaker (125 amps x 1.2 = 150 amps; 150 amps - 100 amp main breaker = 50 amp PV breaker).
A provision in the 2005 NEC clarifies the fact that dedicated circuit breakers backfed from listed utility-interactive inverters do not need to be individually clamped to the panelboard busbars. This has always been the case, but many inspectors have employed the provisions of NEC 408.36(F) that the breaker be secured in place by an additional fastener. Utility-interactive inverters do not require this fastener since they are designed to shut down immediately should the dedicated breaker become disconnected from the bus bar under any condition. This provision is repeated in the 2008 NEC in a clear and concise statement:
“NEC 690.64(B)(6) Fastening. Listed plug-in-type circuit breakers backfed from utility-interactive inverters complying with 690.60 shall be permitted to omit the additional fastener normally required by 408.36(D) for such applications.”
Since 690.64(B) and 705.12(D) are nearly identical in the 2008 NEC, the 2011 NEC references 705.12(D) in 690.64(B) so that all utility interactive inverter interconnections are covered in the same section. This will help consistency among other inverter-based technologies such as fuel cells, wind, and micro-turbines. The table below, or Table of NEC 690.64(B) AC Interconnection Options, shows the how the maximum current of the inverter (column 1) requires a minimum size OCPD (column 2), which requires a minimum size conductor (column 3), which requires a compatible busbar/main breaker combination in the panelboard (column 4). The way to understand column 4, minimum busbar/main breaker combinations is to look at the row that coincides with the particular breaker being selected (from column 2) and use any combination from column 4 found
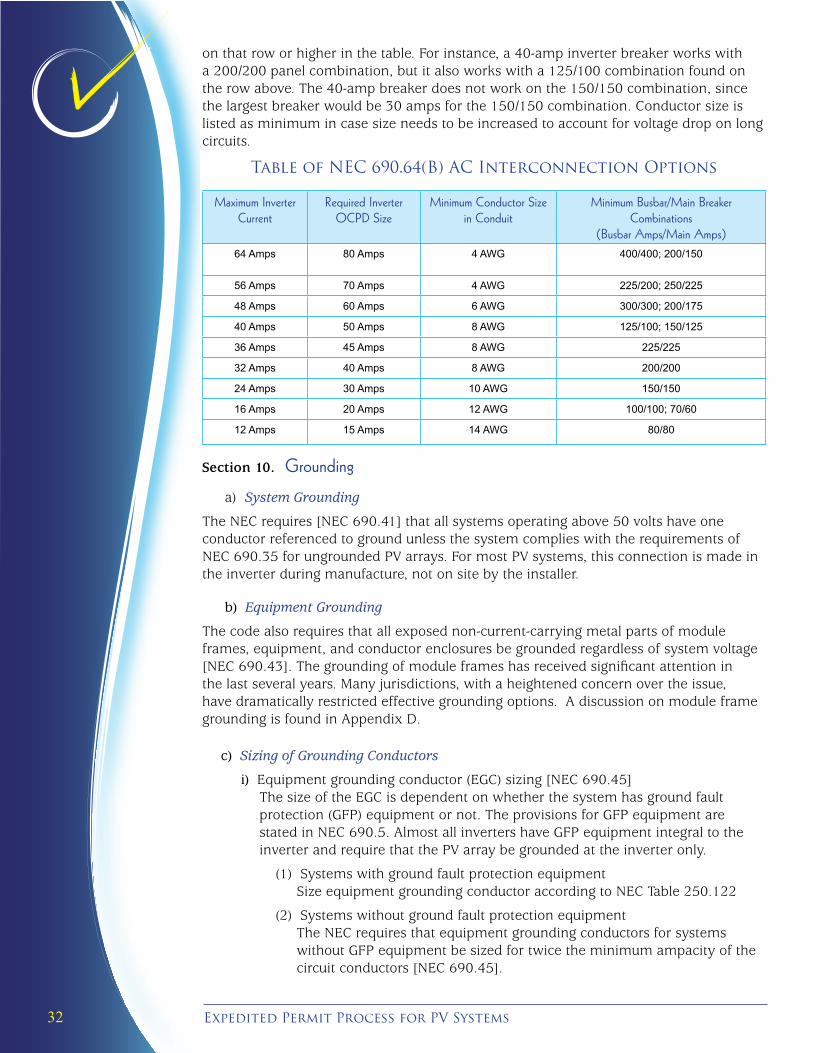
Expedited Permit Process for PV Systems 32
on that row or higher in the table. For instance, a 40-amp inverter breaker works with a 200/200 panel combination, but it also works with a 125/100 combination found on the row above. The 40-amp breaker does not work on the 150/150 combination, since the largest breaker would be 30 amps for the 150/150 combination. Conductor size is listed as minimum in case size needs to be increased to account for voltage drop on long circuits.
Table of NEC 690.64(B) AC Interconnection Options
Maximum Inverter Current
Required Inverter OCPD Size
Minimum Conductor Size in Conduit
Minimum Busbar/Main Breaker Combinations
(Busbar Amps/Main Amps)64 Amps 80 Amps 4 AWG 400/400; 200/150
56 Amps 70 Amps 4 AWG 225/200; 250/225
48 Amps 60 Amps 6 AWG 300/300; 200/175
40 Amps 50 Amps 8 AWG 125/100; 150/125
36 Amps 45 Amps 8 AWG 225/225
32 Amps 40 Amps 8 AWG 200/200
24 Amps 30 Amps 10 AWG 150/150
16 Amps 20 Amps 12 AWG 100/100; 70/60
12 Amps 15 Amps 14 AWG 80/80
Section 10. Grounding
a) System Grounding
The NEC requires [NEC 690.41] that all systems operating above 50 volts have one conductor referenced to ground unless the system complies with the requirements of NEC 690.35 for ungrounded PV arrays. For most PV systems, this connection is made in the inverter during manufacture, not on site by the installer.
b) Equipment Grounding
The code also requires that all exposed non-current-carrying metal parts of module frames, equipment, and conductor enclosures be grounded regardless of system voltage [NEC 690.43]. The grounding of module frames has received significant attention in the last several years. Many jurisdictions, with a heightened concern over the issue, have dramatically restricted effective grounding options. A discussion on module frame grounding is found in Appendix D.
c) Sizing of Grounding Conductors
i) Equipment grounding conductor (EGC) sizing [NEC 690.45] The size of the EGC is dependent on whether the system has ground fault protection (GFP) equipment or not. The provisions for GFP equipment are stated in NEC 690.5. Almost all inverters have GFP equipment integral to the inverter and require that the PV array be grounded at the inverter only.
(1) Systems with ground fault protection equipment Size equipment grounding conductor according to NEC Table 250.122
(2) Systems without ground fault protection equipment The NEC requires that equipment grounding conductors for systems without GFP equipment be sized for twice the minimum ampacity of the circuit conductors [NEC 690.45].
33Solar America Board for Codes and Standards Report
ii) System grounding conductor sizing
(1) AC SystemSize grounding electrode conductor (GEC) according to NEC Table 250.66
Normally the site already has the conductor and electrode installed for the ac building wiring.
(2) DC System Size grounding electrode conductor (GEC) according to NEC 250.166
This results in a minimum size of 8 AWG. The maximum size of the GEC is dependent upon the type of grounding electrode or the maximum size conductor in the dc system, whichever is smaller.
Expedited Permit Process for PV Systems 34
APPENDIX A: Example Submittals
Example 1: Standard String Inverter SystemExample 2: Micro-InverterExample 3: AC ModuleExample 4: Supply-Side Connection
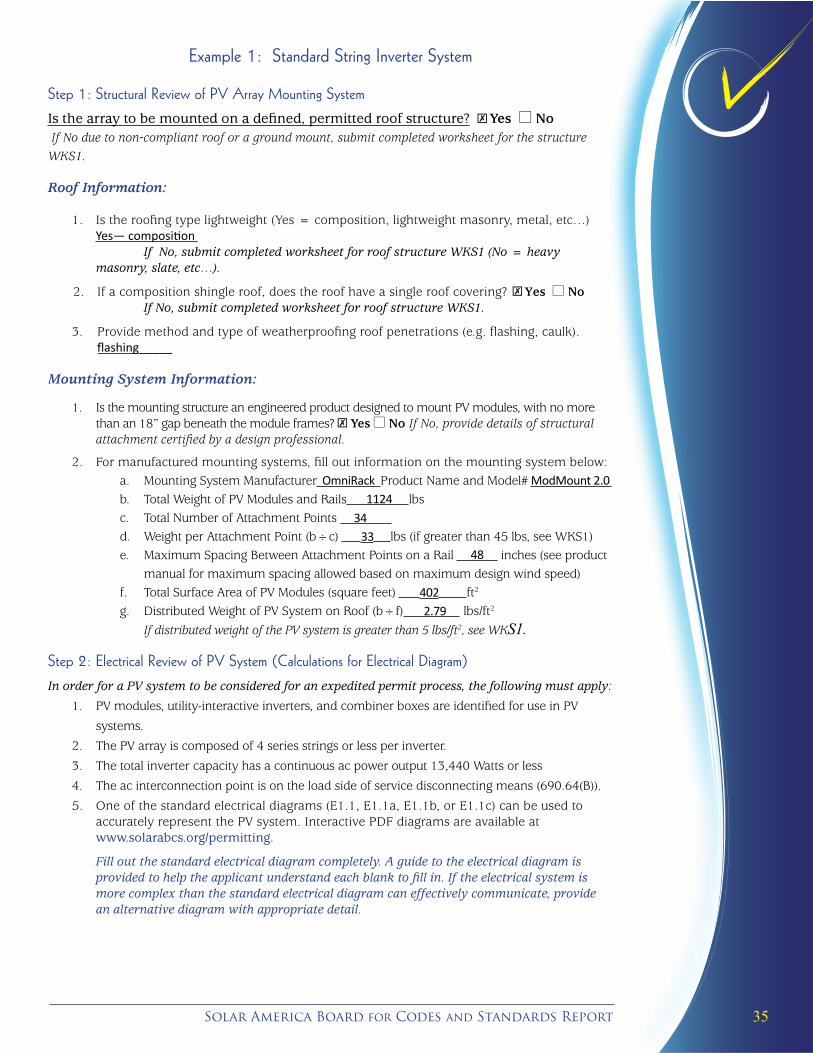
35Solar America Board for Codes and Standards Report
Example 1: Standard String Inverter System
Step 1: Structural Review of PV Array Mounting SystemIs the array to be mounted on a defined, permitted roof structure? \Yes l No If No due to non-compliant roof or a ground mount, submit completed worksheet for the structure WKS1.
Roof Information:
1. Is the roofing type lightweight (Yes = composition, lightweight masonry, metal, etc…)Yes— composition
If No, submit completed worksheet for roof structure WKS1 (No = heavy masonry, slate, etc…).
2. If a composition shingle roof, does the roof have a single roof covering? \Yes l NoIf No, submit completed worksheet for roof structure WKS1.
3. Provide method and type of weatherproofing roof penetrations (e.g. flashing, caulk). flashing_____
Mounting System Information:
1. Is the mounting structure an engineered product designed to mount PV modules, with no more than an 18” gap beneath the module frames? \ Yes l No If No, provide details of structural attachment certified by a design professional.
2. For manufactured mounting systems, fill out information on the mounting system below:a. Mounting System Manufacturer OmniRack Product Name and Model# ModMount 2.0 b. Total Weight of PV Modules and Rails 1124 lbsc. Total Number of Attachment Points 34 d. Weight per Attachment Point (b÷c) 33 lbs (if greater than 45 lbs, see WKS1)e. Maximum Spacing Between Attachment Points on a Rail 48 inches (see product
manual for maximum spacing allowed based on maximum design wind speed)f. Total Surface Area of PV Modules (square feet) 402 ft2
g. Distributed Weight of PV System on Roof (b÷f) 2.79 lbs/ft2
If distributed weight of the PV system is greater than 5 lbs/ft2, see WKS1.
Step 2: Electrical Review of PV System (Calculations for Electrical Diagram)In order for a PV system to be considered for an expedited permit process, the following must apply:
1. PV modules, utility-interactive inverters, and combiner boxes are identified for use in PV
systems.
2. The PV array is composed of 4 series strings or less per inverter.
3. The total inverter capacity has a continuous ac power output 13,440 Watts or less
4. The ac interconnection point is on the load side of service disconnecting means (690.64(B)).
5. One of the standard electrical diagrams (E1.1, E1.1a, E1.1b, or E1.1c) can be used to accurately represent the PV system. Interactive PDF diagrams are available at
www.solarabcs.org/permitting.
Fill out the standard electrical diagram completely. A guide to the electrical diagram is provided to help the applicant understand each blank to fill in. If the electrical system is more complex than the standard electrical diagram can effectively communicate, provide an alternative diagram with appropriate detail.
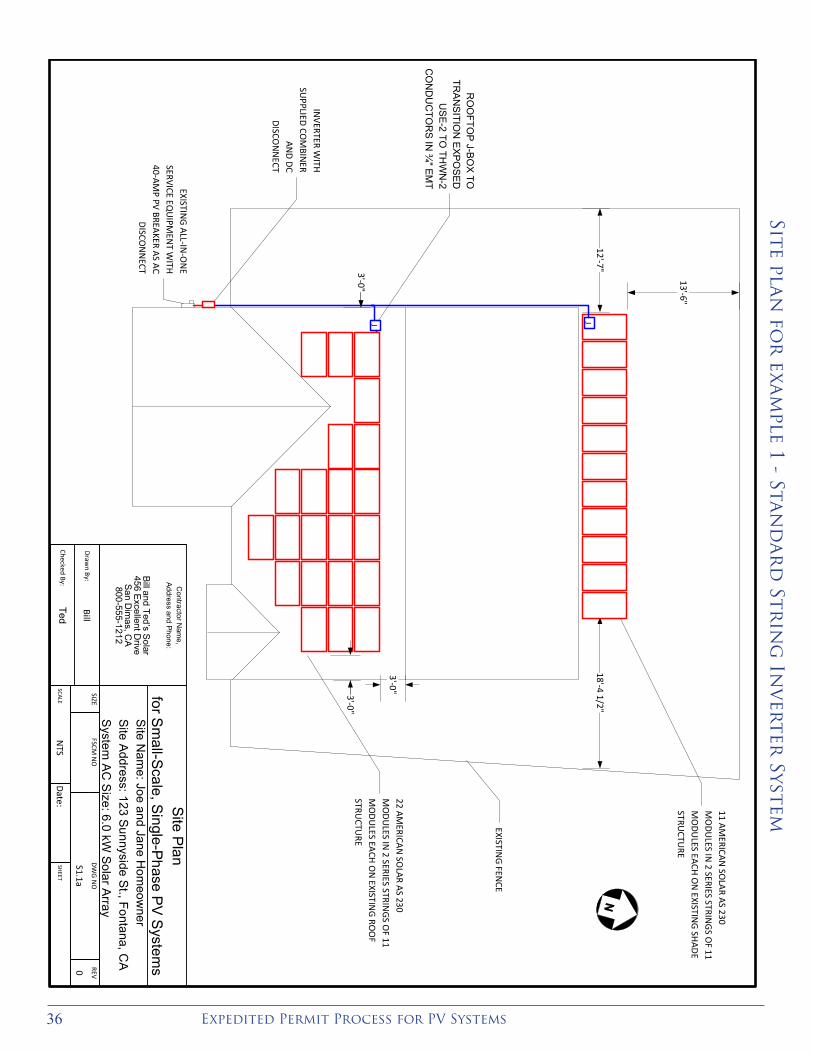
Expedited Permit Process for PV Systems 36
Site plan fo
r exa
mple 1 - Stan
dar
d Str
ing
Inv
erter System
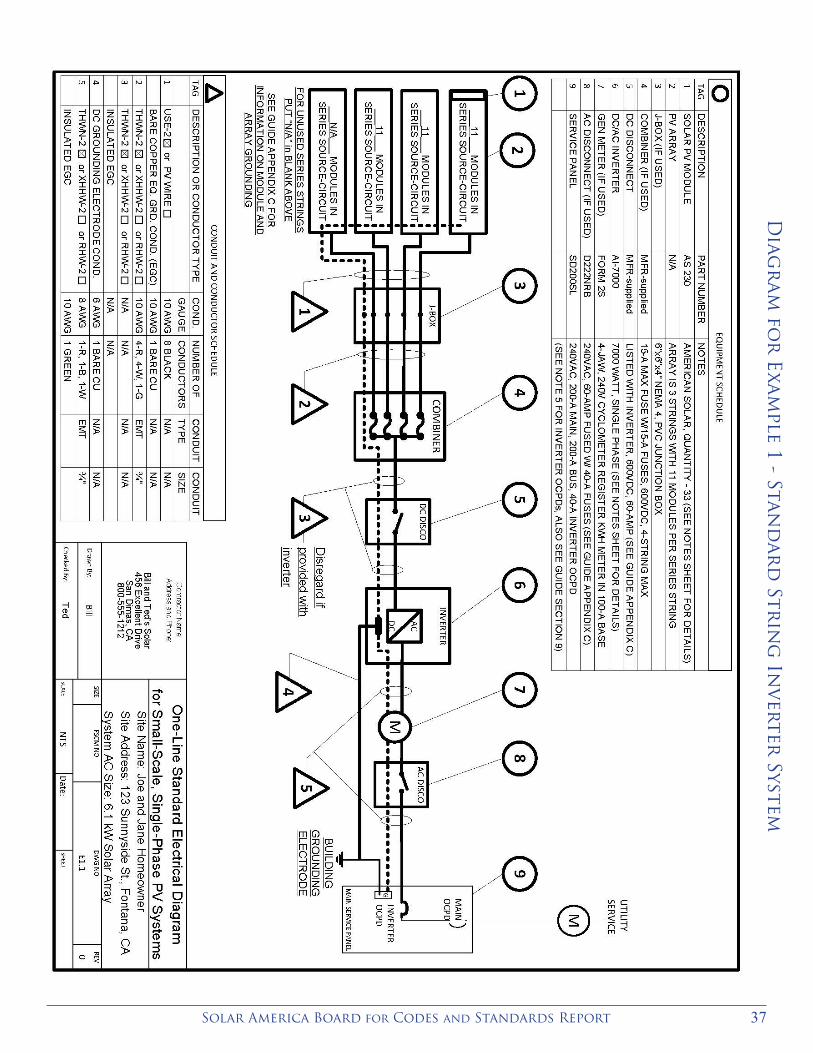
37Solar America Board for Codes and Standards Report
Site plan fo
r exa
mple 1 - Stan
dar
d Str
ing
Inv
erter System
Diag
ram
for
Exa
mple 1 - Stan
dar
d Str
ing
Inv
erter System
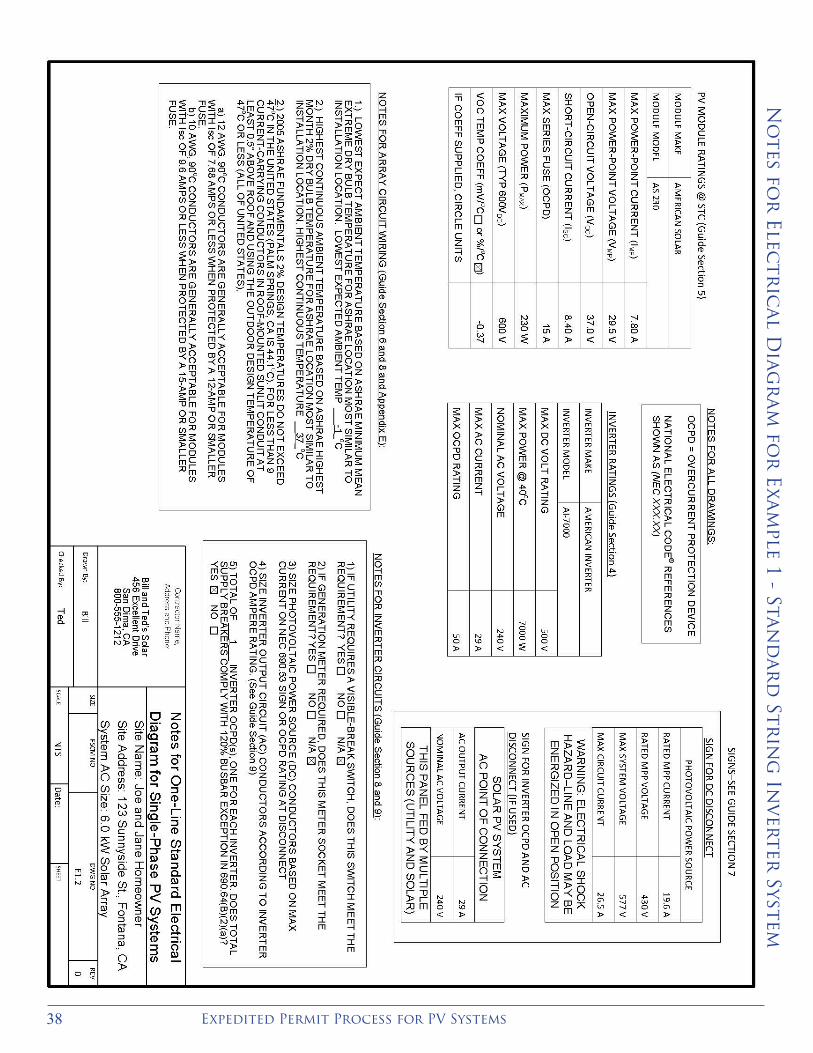
Expedited Permit Process for PV Systems 38
No
tes for
Electr
ical D
iagr
am
for
Exa
mple 1 - Stan
dar
d Str
ing
Inv
erter System

39Solar America Board for Codes and Standards Report
Example 2: Micro-Inverter
Step 1: Structural Review of PV Array Mounting SystemIs the array to be mounted on a defined, permitted roof structure? \Yes l No If No due to non-compliant roof or a ground mount, submit completed worksheet for the structure WKS1.
Roof Information:
1. Is the roofing type lightweight (Yes = composition, lightweight masonry, metal, etc…)Yes— composition
If No, submit completed worksheet for roof structure WKS1 (No = heavy masonry, slate, etc…).
2. If a composition shingle roof, does the roof have a single roof covering? \Yes l NoIf No, submit completed worksheet for roof structure WKS1.
3. Provide method and type of weatherproofing roof penetrations (e.g. flashing, caulk). flashing_____
Mounting System Information:
1. Is the mounting structure an engineered product designed to mount PV modules, with no more than an 18” gap beneath the module frames? \ Yes l No If No, provide details of structural attachment certified by a design professional.
2. For manufactured mounting systems, fill out information on the mounting system below:a. Mounting System Manufacturer OmniRack Product Name and Model# ModMount 2.0 b. Total Weight of PV Modules and Rails 1022 lbsc. Total Number of Attachment Points 32 d. Weight per Attachment Point (b÷c) 32 lbs (if greater than 45 lbs, see WKS1)e. Maximum Spacing Between Attachment Points on a Rail 48 inches (see product
manual for maximum spacing allowed based on maximum design wind speed)f. Total Surface Area of PV Modules (square feet) 365 ft2
g. Distributed Weight of PV System on Roof (b÷f) 2.8 lbs/ft2
If distributed weight of the PV system is greater than 5 lbs/ft2, see WKS1.
Step 2: Electrical Review of PV System (Calculations for Electrical Diagram)In order for a PV system to be considered for an expedited permit process, the following must apply:
1. PV modules, utility-interactive inverters, and combiner boxes are identified for use in PV
systems.
2. The PV array is composed of 4 series strings or less per inverter.
3. The total inverter capacity has a continuous ac power output 13,440 Watts or less
4. The ac interconnection point is on the load side of service disconnecting means (690.64(B)).
5. One of the standard electrical diagrams (E1.1, E1.1a, E1.1b, or E1.1c) can be used to accurately represent the PV system. Interactive PDF diagrams are available at
www.solarabcs.org/permitting.
Fill out the standard electrical diagram completely. A guide to the electrical diagram is provided to help the applicant understand each blank to fill in. If the electrical system is more complex than the standard electrical diagram can effectively communicate, provide an alternative diagram with appropriate detail.
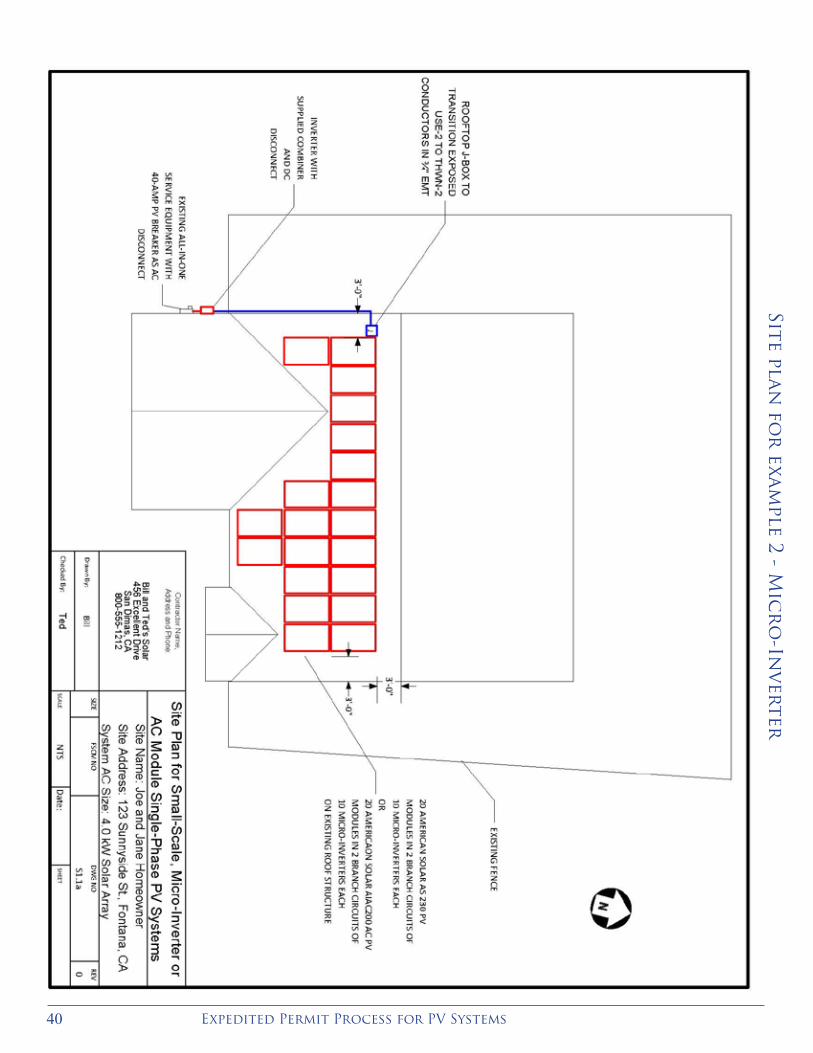
Expedited Permit Process for PV Systems 40
Site plan fo
r exa
mple 2 - M
icr
o-In
verter
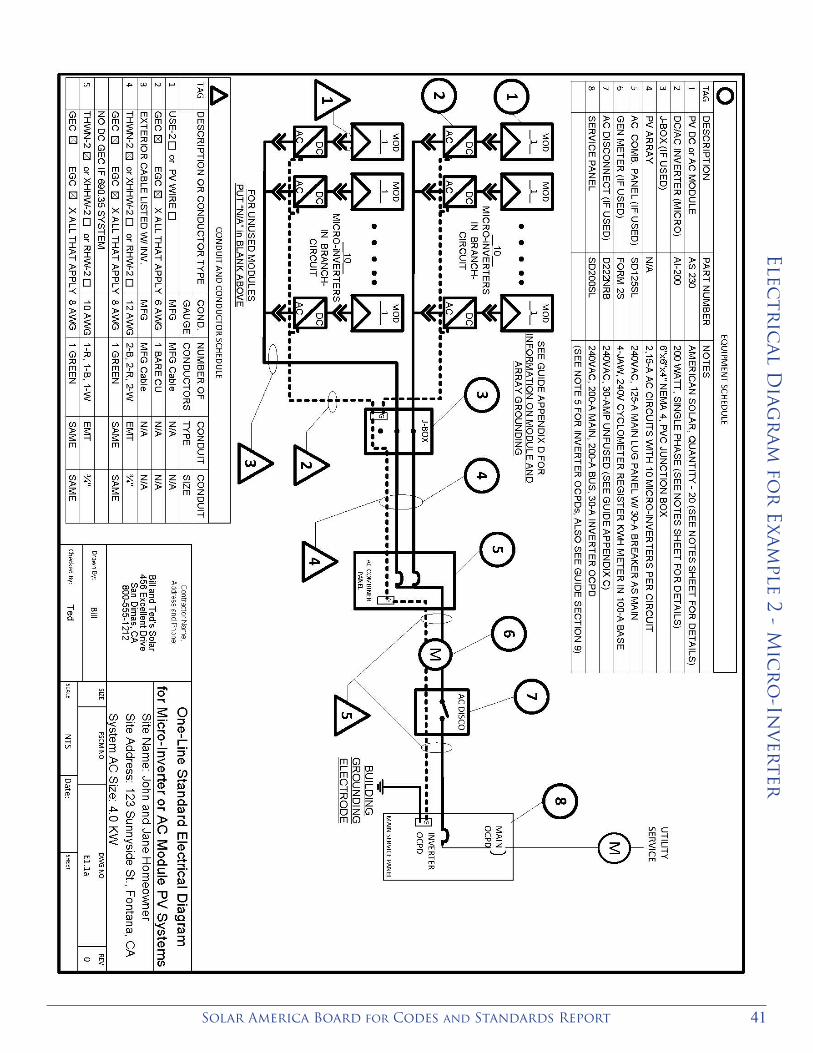
41Solar America Board for Codes and Standards Report
Site plan fo
r exa
mple 2 - M
icr
o-In
verter
Electr
ical D
iagr
am
for
Exa
mple 2 - M
icr
o-In
verter
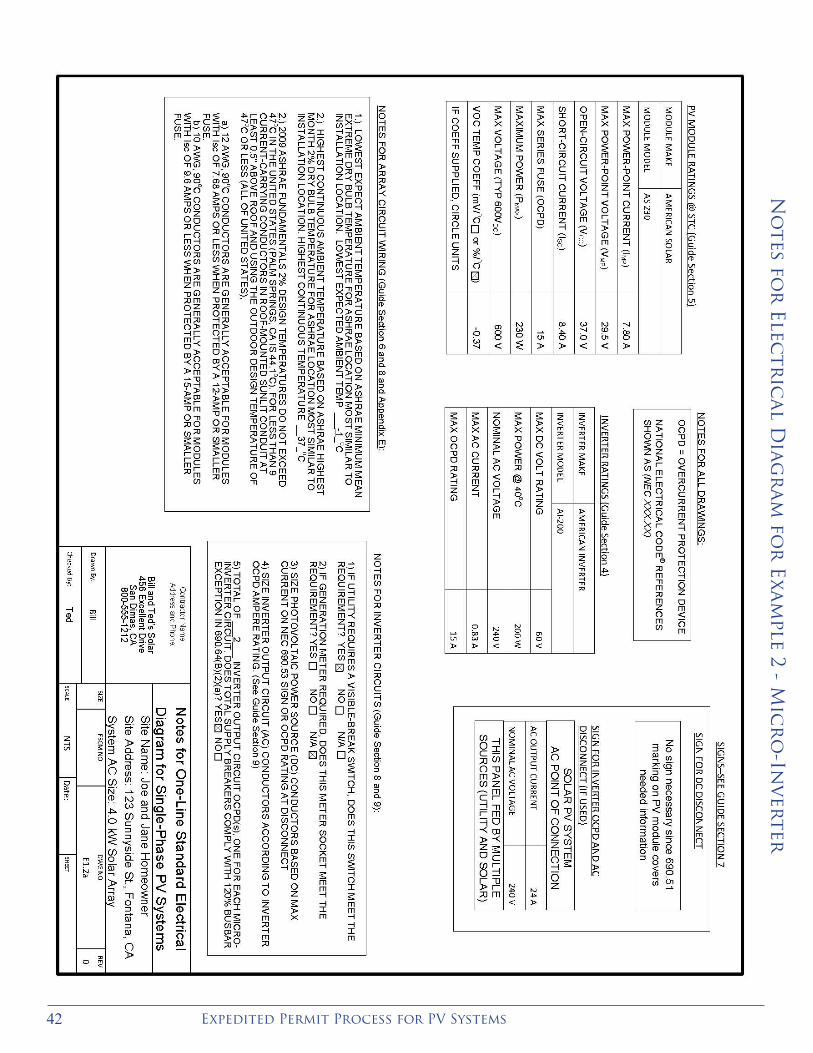
Expedited Permit Process for PV Systems 42
No
tes for
Electr
ical D
iagr
am
for
Exa
mple 2 - M
icr
o-In
verter
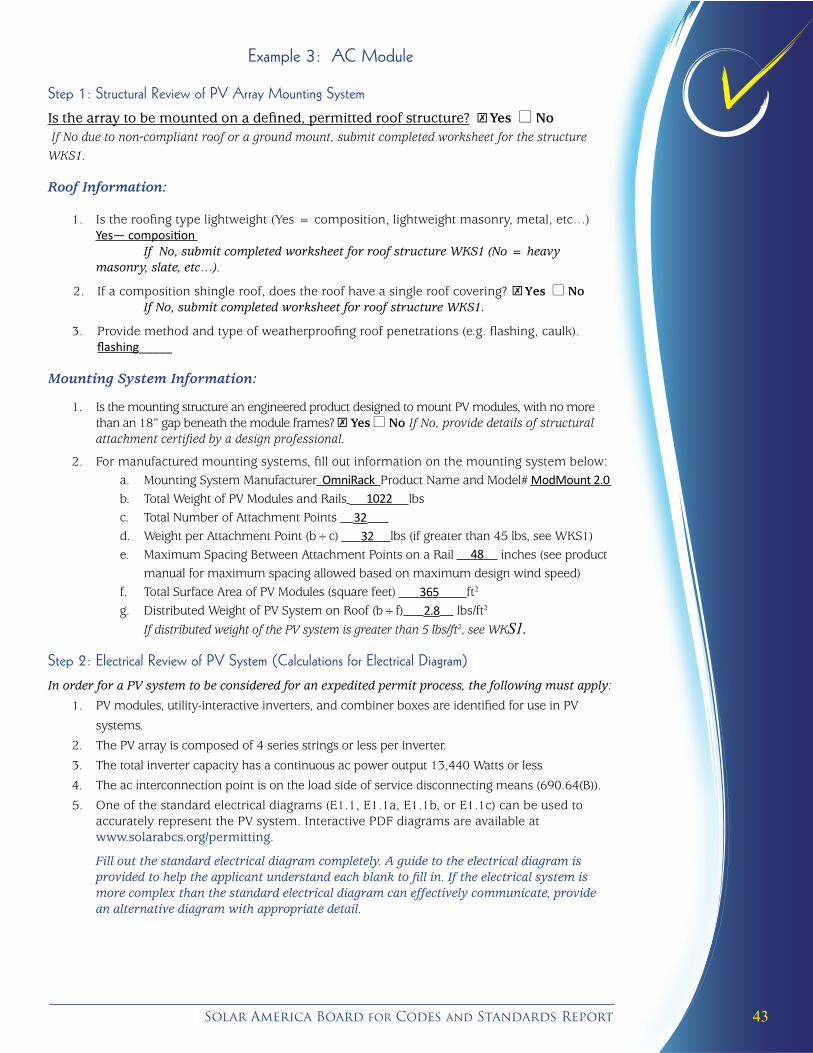
43Solar America Board for Codes and Standards Report
Example 3: AC Module
Step 1: Structural Review of PV Array Mounting SystemIs the array to be mounted on a defined, permitted roof structure? \Yes l No If No due to non-compliant roof or a ground mount, submit completed worksheet for the structure WKS1.
Roof Information:
1. Is the roofing type lightweight (Yes = composition, lightweight masonry, metal, etc…)Yes— composition
If No, submit completed worksheet for roof structure WKS1 (No = heavy masonry, slate, etc…).
2. If a composition shingle roof, does the roof have a single roof covering? \Yes l NoIf No, submit completed worksheet for roof structure WKS1.
3. Provide method and type of weatherproofing roof penetrations (e.g. flashing, caulk). flashing_____
Mounting System Information:
1. Is the mounting structure an engineered product designed to mount PV modules, with no more than an 18” gap beneath the module frames? \ Yes l No If No, provide details of structural attachment certified by a design professional.
2. For manufactured mounting systems, fill out information on the mounting system below:a. Mounting System Manufacturer OmniRack Product Name and Model# ModMount 2.0 b. Total Weight of PV Modules and Rails 1022 lbsc. Total Number of Attachment Points 32 d. Weight per Attachment Point (b÷c) 32 lbs (if greater than 45 lbs, see WKS1)e. Maximum Spacing Between Attachment Points on a Rail 48 inches (see product
manual for maximum spacing allowed based on maximum design wind speed)f. Total Surface Area of PV Modules (square feet) 365 ft2
g. Distributed Weight of PV System on Roof (b÷f) 2.8 lbs/ft2
If distributed weight of the PV system is greater than 5 lbs/ft2, see WKS1.
Step 2: Electrical Review of PV System (Calculations for Electrical Diagram)In order for a PV system to be considered for an expedited permit process, the following must apply:
1. PV modules, utility-interactive inverters, and combiner boxes are identified for use in PV
systems.
2. The PV array is composed of 4 series strings or less per inverter.
3. The total inverter capacity has a continuous ac power output 13,440 Watts or less
4. The ac interconnection point is on the load side of service disconnecting means (690.64(B)).
5. One of the standard electrical diagrams (E1.1, E1.1a, E1.1b, or E1.1c) can be used to accurately represent the PV system. Interactive PDF diagrams are available at
www.solarabcs.org/permitting.
Fill out the standard electrical diagram completely. A guide to the electrical diagram is provided to help the applicant understand each blank to fill in. If the electrical system is more complex than the standard electrical diagram can effectively communicate, provide an alternative diagram with appropriate detail.
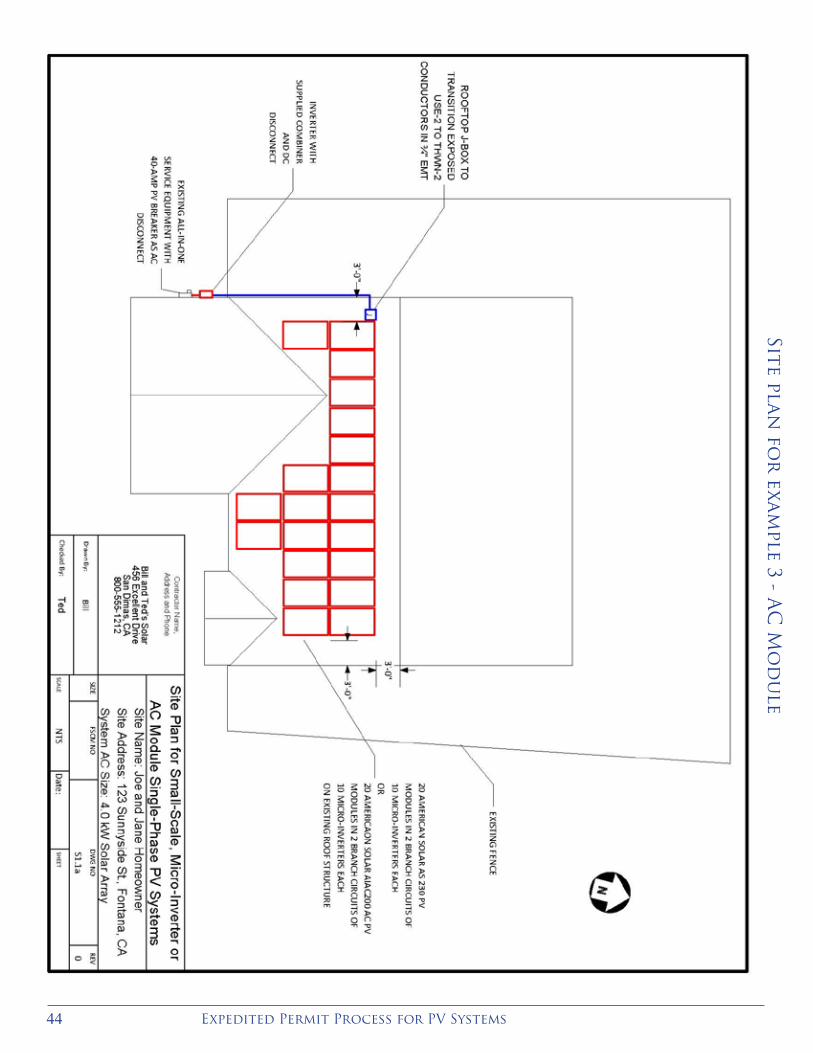
Expedited Permit Process for PV Systems 44
Site plan fo
r exa
mple 3 - A
C M
od
ule
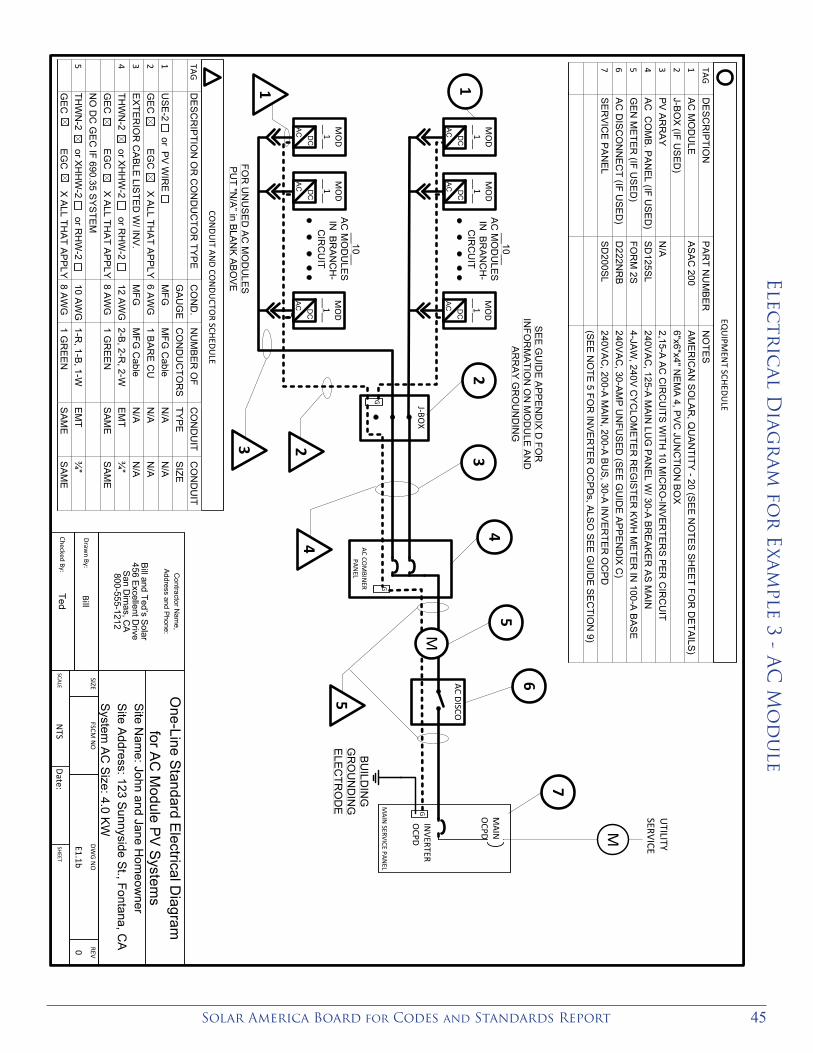
45Solar America Board for Codes and Standards Report
Site plan fo
r exa
mple 3 - A
C M
od
ule
Contractor N
ame,
Address and Phone:
Bill and Ted’s S
olar456 Excellent D
riveSan D
imas, C
A800-555-1212
Bill
Ted
One-Line S
tandard Electrical D
iagramfor A
C M
odule PV
System
sSite N
ame: John and Jane H
omeow
nerS
ite Address: 123 S
unnyside St., Fontana, C
ASystem
AC Size: 4.0 KW
SIZEFSCM
NO
DWG
NO
REV
E1.1b0
SCALEN
TSDate:
SHEET
Drawn By:
Checked By:
DE
SC
RIPTIO
N O
R C
ON
DU
CTO
R TYP
E
US
E-2 or P
V WIR
E
GE
C E
GC
X ALL TH
AT A
PPLY
EXTER
IOR
CA
BLE LIS
TED
W/ IN
V.TH
WN
-2 or XH
HW
-2 or RH
W-2
GE
C E
GC
X ALL TH
AT A
PPLY
NO
DC
GE
C IF 690.35 SY
STE
MTH
WN
-2 or XH
HW
-2 or RH
W-2
GE
C E
GC
X ALL TH
AT A
PPLY
TAG
12345
CON
DUIT AN
D CON
DUCTO
R SCHEDU
LE
CO
ND
.G
AU
GE
MFG
6 AW
GM
FG12 AW
G8 A
WG
10 AWG
8 A
WG
NU
MB
ER O
FC
ON
DU
CTO
RS
MFG
Cable
1 BAR
E C
UM
FG C
able2-B
, 2-R, 2-W
1 GR
EE
N
1-R, 1-B, 1-W
1 GR
EE
N
CO
ND
UIT
TYPE
N/A
N/A
N/A
EM
TS
AME
EM
TS
AME
CO
ND
UIT
SIZE
N/A
N/A
N/A
¾"
SAM
E
¾"
SAM
E
DE
SC
RIP
TION
AC
MO
DU
LEJ-B
OX
(IF US
ED)
PV AR
RA
YAC
CO
MB. P
ANEL (IF U
SED
)G
EN
ME
TER (IF U
SED
)AC
DIS
CO
NN
ECT (IF U
SED
)SE
RV
ICE
PAN
EL
TAG1234567
PA
RT N
UM
BER
AS
AC 200
N/A
SD
125SLFO
RM
2SD
222NR
BS
D200SL
NO
TESA
ME
RIC
AN
SO
LAR
, QU
AN
TITY -20 (S
EE N
OTES
SHEE
T FOR
DE
TAILS)6"x6"x4" N
EM
A 4, P
VC JU
NC
TION
BO
X2,15-A A
C C
IRC
UITS
WITH
10 MIC
RO
-INV
ERTER
S PER
CIR
CU
IT240V
AC, 125-A
MA
IN LU
G PA
NE
L W/ 30-A B
RE
AKE
R A
S MAIN
4-JAW
, 240V CYC
LOM
ETER R
EG
ISTE
R K
WH
ME
TER
IN 100-A
BAS
E240V
AC, 30-AM
P UN
FUS
ED
(SEE
GU
IDE A
PPE
ND
IX C)
240VAC
, 200-A M
AIN
, 200-A BU
S, 30-A
INVE
RTE
R O
CP
D(SE
E N
OTE
5 FOR
INVE
RTE
R O
CP
Ds, ALS
O S
EE G
UID
E S
EC
TION
9)
FOR
UN
US
ED
AC
MO
DU
LESPU
T "N/A
” in BLAN
K AB
OV
E
12
23
EQU
IPMEN
T SCHEDULEJ-BO
X
4
AC DISCO
M
BU
ILDIN
GG
RO
UN
DIN
G
ELE
CTR
OD
E G
M
UTILITY
SERVICE
MAIN
SERVICE PANEL
MAIN
OCPD
INVERTER
OCPD
56
7
5
34
G
SEE G
UID
E APP
EN
DIX D
FOR
IN
FOR
MATIO
N O
N M
OD
ULE
AND
A
RR
AY G
RO
UN
DIN
G
AC COM
BINER
PANEL
G
__10__ A
C M
OD
ULE
SIN
BR
AN
CH
-C
IRC
UIT
MO
D__1__
DC
AC
MO
D__1__
DC
AC
MO
D__1__
DC
AC
__10__ A
C M
OD
ULE
SIN
BR
AN
CH
-C
IRC
UIT
MO
D__1__
DC
AC
MO
D__1__
DC
AC
MO
D__1__
DC
AC
1
Electr
ical D
iagr
am
for
Exa
mple 3 - A
C M
od
ule
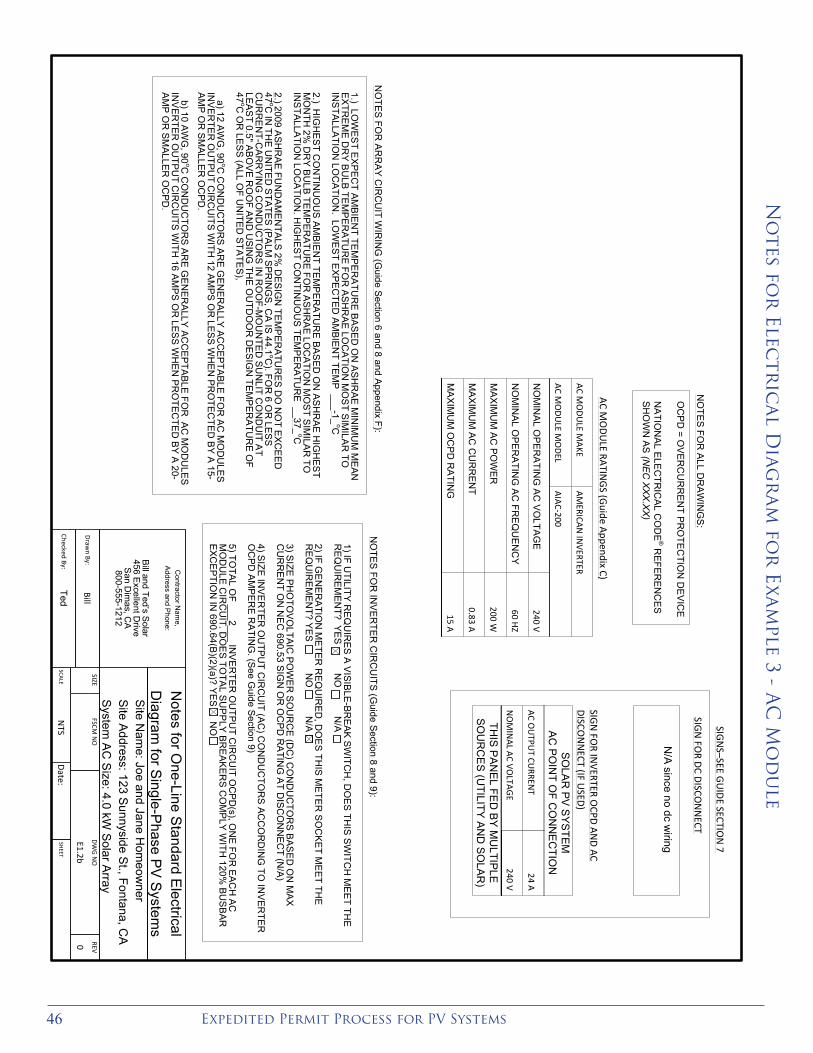
Expedited Permit Process for PV Systems 46
Contractor N
ame,
Address and P
hone:
Bill and Ted’s Solar456 Excellent D
riveS
an Dim
as, CA
800-555-1212
Bill
Ted
Notes for O
ne-Line Standard E
lectrical D
iagram for S
ingle-Phase P
V S
ystems
Site Nam
e: Joe and Jane Hom
eowner
Site Address: 123 Sunnyside St., Fontana, CA
System
AC
Size: 4.0 kW
Solar A
rraySIZE
FSCM N
ODW
G N
OREV
E1.2b0
SCALEN
TSDate:
SHEET
Drawn By:
Checked By:
NO
MIN
AL O
PER
ATIN
G A
C V
OLTAG
E
NO
MIN
AL O
PER
ATIN
G A
C FR
EQ
UE
NC
Y
MA
XIM
UM
AC
PO
WE
R
MA
XIM
UM
AC
CU
RR
EN
T
MA
XIM
UM
OC
PD
RA
TING
240 V
60 HZ
200 W
0.83 A
15 A
AC MO
DULE M
AKE
AC MO
DULE M
ODEL
AMERICAN
INVERTER
AIAC-200
AC MO
DULE RATIN
GS (G
uide Appendix C)
1) IF UTILITY R
EQU
IRES
A VISIB
LE-BRE
AK SW
ITCH
, DO
ES TH
IS SW
ITCH
ME
ET THE
REQ
UIR
EMEN
T? YES
N
O
N/A
2) IF GE
NE
RATIO
N M
ETER
REQ
UIR
ED, D
OE
S TH
IS M
ETER
SO
CK
ET ME
ET THE
R
EQU
IREM
ENT? Y
ES
NO
N
/A
3) SIZE
PH
OTO
VOLTA
IC P
OW
ER
SO
UR
CE
(DC
) CO
ND
UC
TOR
S BAS
ED
ON
MA
X
CU
RR
EN
T ON
NE
C 690.53 S
IGN
OR
OC
PD
RA
TING
AT D
ISC
ON
NE
CT (N
/A)
4) SIZE
INV
ER
TER O
UTP
UT C
IRC
UIT (AC
) CO
ND
UC
TOR
S AC
CO
RD
ING
TO IN
VER
TER
O
CP
D A
MP
ERE
RA
TING
. (See G
uide Section 9)
5) TOTA
L OF ___2___ IN
VE
RTER
OU
TPU
T CIR
CU
IT OC
PD
(s), ON
E FO
R E
ACH
AC
M
OD
ULE
CIR
CU
IT. DO
ES
TOTA
L SU
PP
LY BR
EAK
ERS
CO
MP
LY W
ITH 120%
BU
SB
AR
EXC
EPTIO
N IN
690.64(B)(2)(a)? YES
NO
NO
TES
FOR
INV
ER
TER C
IRC
UITS
(Guide Section 8 and 9):
1.) LOW
EST E
XPE
CT AM
BIEN
T TEM
PE
RA
TUR
E BA
SED
ON
AS
HR
AE M
INIM
UM
ME
AN
EXTR
EM
E D
RY
BU
LB TE
MP
ER
ATU
RE
FOR
AS
HR
AE LO
CA
TION
MO
ST S
IMILAR
TO
INS
TALLATION
LOC
ATIO
N. LO
WES
T EXP
EC
TED AM
BIEN
T TEM
P ___-1_
oC
2.) HIG
HE
ST C
ON
TINU
OU
S AM
BIEN
T TEM
PE
RA
TUR
E BA
SED
ON
ASH
RAE
HIG
HE
ST
MO
NTH
2% D
RY B
ULB
TEM
PER
ATUR
E FO
R A
SHR
AE LO
CA
TION
MO
ST S
IMILA
R TO
IN
STALLATIO
N LO
CA
TION
. HIG
HES
T CO
NTIN
UO
US
TEM
PE
RA
TUR
E __37_
oC
2.) 2009 ASH
RA
E FUN
DA
MEN
TALS 2%
DES
IGN
TEM
PER
ATU
RE
S DO
NO
T EXC
EE
D
47oC
IN TH
E UN
ITED
STATES
(PALM
SPR
ING
S, C
A IS 44.1
oC). FO
R 6 O
R LES
S
CU
RR
EN
T-CA
RR
YIN
G C
ON
DU
CTO
RS
IN R
OO
F-MO
UN
TED
SU
NLIT C
ON
DU
IT AT LEA
ST 0.5" AB
OV
E R
OO
F AN
D U
SING
THE
OU
TDO
OR
DE
SIG
N TE
MP
ERATU
RE
OF
47oC
OR
LESS
(ALL O
F UN
ITED STATE
S),
a) 12 AW
G, 90
oC C
ON
DU
CTO
RS
ARE G
ENE
RA
LLY AC
CE
PTABLE
FOR
AC
MO
DU
LES
INV
ER
TER O
UTP
UT C
IRC
UITS
WITH
12 AM
PS O
R LES
S W
HE
N P
RO
TECTE
D B
Y A
15-A
MP
OR
SM
ALLER O
CPD
.
b) 10 AW
G, 90
oC C
ON
DU
CTO
RS
ARE G
ENE
RA
LLY AC
CE
PTABLE
FOR
AC M
OD
ULE
S
INV
ER
TER O
UTP
UT C
IRC
UITS
WITH
16 AM
PS O
R LES
S W
HE
N P
RO
TECTE
D B
Y A
20-A
MP
OR
SM
ALLER O
CPD
.
NO
TES FO
R A
RR
AY C
IRC
UIT W
IRIN
G (G
uide Section 6 and 8 and Appendix F):
OC
PD
= OVE
RC
UR
REN
T PR
OTE
CTIO
N D
EV
ICE
NATIO
NAL E
LEC
TRIC
AL CO
DE
®R
EFERE
NC
ES
SH
OW
N A
S (N
EC
XX
X.X
X)
NO
TES FO
R A
LL DR
AW
ING
S:
SIGN
S–SEE GU
IDE SECTION
7
SIGN
FOR DC DISCO
NN
ECT
SIGN
FOR IN
VERTER OCPD AN
D AC DISCO
NN
ECT (IF USED)
N/A
since no dc wiring
AC OU
TPUT CU
RRENT
NO
MIN
AL AC VOLTAG
E
24 A
240 V
SO
LAR
PV
SY
STE
MA
C P
OIN
T OF C
ON
NE
CTIO
N
THIS
PA
NE
L FED
BY
MU
LTIPLE
S
OU
RC
ES
(UTILITY
AN
D S
OLA
R)
No
tes for
Electr
ical D
iagr
am
for
Exa
mple 3 - A
C M
od
ule

47Solar America Board for Codes and Standards Report
Example 4: Supply-Side Connection
Step 1: Structural Review of PV Array Mounting SystemIs the array to be mounted on a defined, permitted roof structure? \Yes l No If No due to non-compliant roof or a ground mount, submit completed worksheet for the structure WKS1.
Roof Information:
1. Is the roofing type lightweight (Yes = composition, lightweight masonry, metal, etc…)Yes— composition
If No, submit completed worksheet for roof structure WKS1 (No = heavy masonry, slate, etc…).
2. If a composition shingle roof, does the roof have a single roof covering? \Yes l NoIf No, submit completed worksheet for roof structure WKS1.
3. Provide method and type of weatherproofing roof penetrations (e.g. flashing, caulk). flashing_____
Mounting System Information:
1. Is the mounting structure an engineered product designed to mount PV modules, with no more than an 18” gap beneath the module frames? \ Yes l No If No, provide details of structural attachment certified by a design professional.
2. For manufactured mounting systems, fill out information on the mounting system below:a. Mounting System Manufacturer OmniRack Product Name and Model# ModMount 2.0 b. Total Weight of PV Modules and Rails 1124 lbsc. Total Number of Attachment Points 34 d. Weight per Attachment Point (b÷c) 33 lbs (if greater than 45 lbs, see WKS1)e. Maximum Spacing Between Attachment Points on a Rail 48 inches (see product
manual for maximum spacing allowed based on maximum design wind speed)f. Total Surface Area of PV Modules (square feet) 402 ft2
g. Distributed Weight of PV System on Roof (b÷f) 2.79 lbs/ft2
If distributed weight of the PV system is greater than 5 lbs/ft2, see WKS1.
Step 2: Electrical Review of PV System (Calculations for Electrical Diagram)In order for a PV system to be considered for an expedited permit process, the following must apply:
1. PV modules, utility-interactive inverters, and combiner boxes are identified for use in PV
systems.
2. The PV array is composed of 4 series strings or less per inverter.
3. The total inverter capacity has a continuous ac power output 13,440 Watts or less
4. The ac interconnection point is on the load side of service disconnecting means (690.64(B)).
5. One of the standard electrical diagrams (E1.1, E1.1a, E1.1b, or E1.1c) can be used to accurately represent the PV system. Interactive PDF diagrams are available at
www.solarabcs.org/permitting.
Fill out the standard electrical diagram completely. A guide to the electrical diagram is provided to help the applicant understand each blank to fill in. If the electrical system is more complex than the standard electrical diagram can effectively communicate, provide an alternative diagram with appropriate detail.
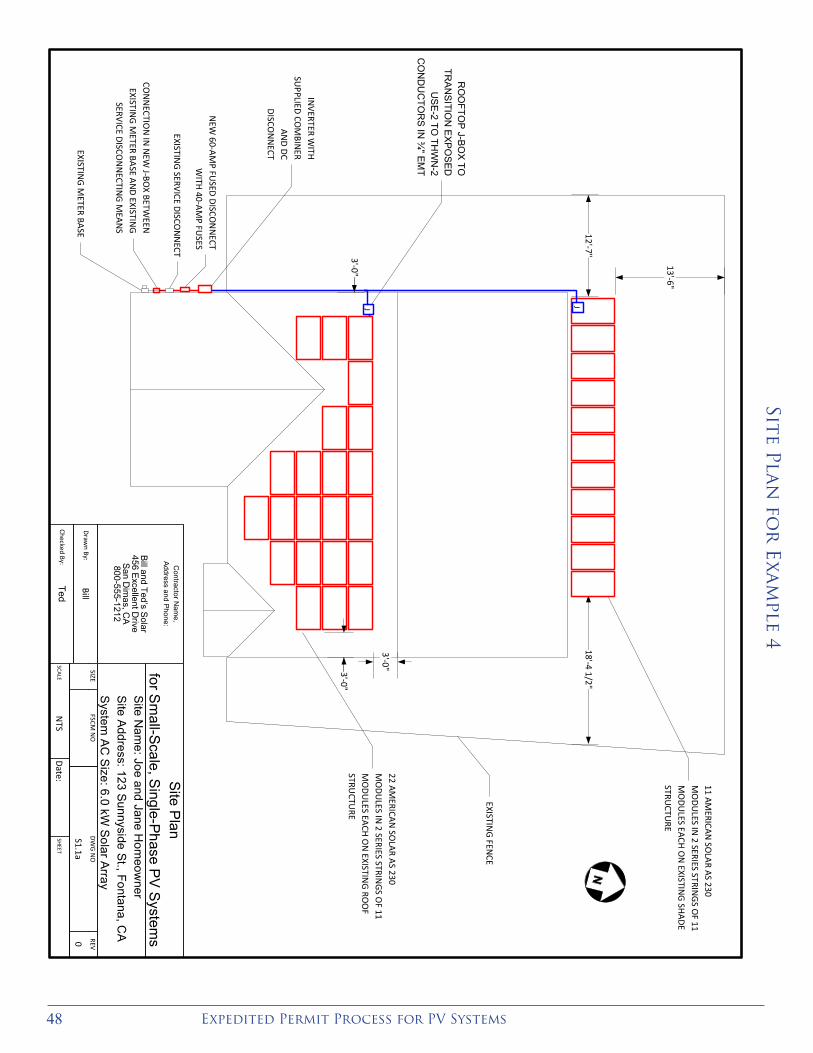
Expedited Permit Process for PV Systems 48
Site Plan fo
r E
xam
ple 4
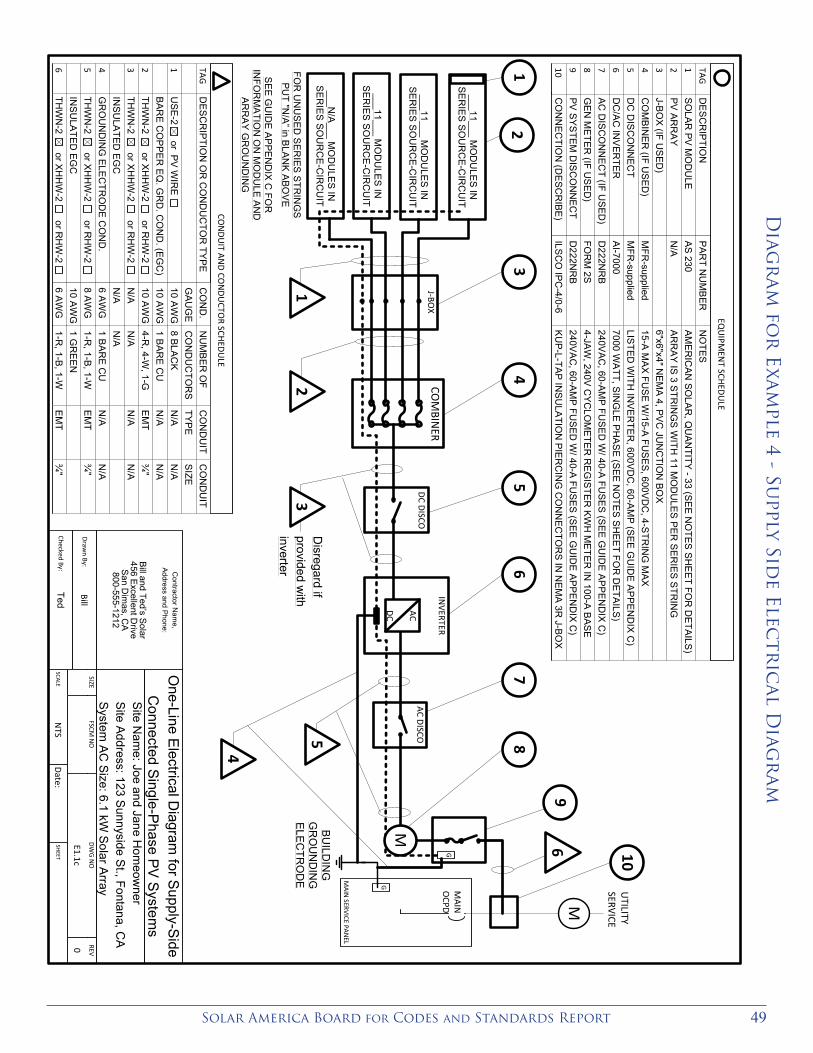
49Solar America Board for Codes and Standards Report
Contractor N
ame,
Address and Phone:
Bill and Ted’s Solar456 E
xcellent Drive
San Dim
as, CA
800-555-1212
Bill
Ted
One-Line E
lectrical Diagram
for Supply-S
ide C
onnected Single-P
hase PV
System
sSite N
ame: Joe and Jane H
omeow
nerSite Address: 123 Sunnyside St., Fontana, C
ASystem
AC Size: 6.1 kW
Solar ArraySIZE
FSCM N
ODW
G N
OREV
E1.1c0
SCALEN
TSDate:
SHEET
Drawn By:
Checked By:
DES
CR
IPTION
OR
CO
ND
UC
TOR
TYPE
USE
-2 or PV
WIR
E
BAR
E C
OP
PER
EQ. G
RD
. CO
ND
. (EG
C)
THW
N-2 or XH
HW
-2 or RH
W-2
THW
N-2 or XH
HW
-2 or RH
W-2
INS
ULA
TED EG
CG
RO
UN
DIN
G E
LEC
TRO
DE C
ON
D.
THW
N-2 or XH
HW
-2 or RH
W-2
INS
ULA
TED EG
CTH
WN
-2 or XHH
W-2 or R
HW
-2
TAG
123456
CON
DUIT AN
D CON
DUCTO
R SCHEDULE
CO
ND
.G
AU
GE
10 AW
G10 A
WG
10 AW
GN
/AN
/A6 A
WG
8 AW
G
10 AW
G6 A
WG
NU
MB
ER
OF
CO
ND
UC
TOR
S8 B
LACK
1 BA
RE
CU
4-R, 4-W
, 1-GN
/AN
/A1 B
AR
E C
U1-R
, 1-B, 1-W
1 GR
EE
N1-R
, 1-B, 1-W
CO
ND
UIT
TYPE
N/A
N/A
EM
TN
/A
N/A
EM
T
EM
T
CO
ND
UIT
SIZE
N/A
N/A
¾"
N/A
N/A
¾"
¾"
DE
SC
RIP
TION
SO
LAR PV
MO
DU
LEPV
ARR
AY
J-BO
X (IF U
SED
)C
OM
BIN
ER
(IF USE
D)
DC
DIS
CO
NN
ECT
DC
/AC IN
VER
TER
AC D
ISC
ON
NEC
T (IF US
ED)
GE
N M
ETER (IF U
SE
D)
PV SY
STE
M D
ISC
ON
NE
CT
CO
NN
ECTIO
N (D
ESC
RIBE
)
TAG12345678910
PAR
T NU
MB
ERAS
230N
/A
MFR
-suppliedM
FR-supplied
AI-7000D
222NR
BFO
RM
2SD
222NR
BILS
CO
IPC
-4/0-6
NO
TESA
ME
RIC
AN SO
LAR, Q
UA
NTITY -33 (SE
E NO
TES S
HE
ET FOR
DETAILS
)A
RR
AY IS 3 STR
ING
S W
ITH 11 M
OD
ULES
PER
SE
RIE
S STR
ING
6"x6"x4" NEM
A 4, PV
C JU
NC
TION
BOX
15-A M
AX FU
SE
W/15-A FU
SE
S, 600VD
C, 4-STR
ING
MAX
LISTED W
ITH IN
VE
RTER
, 600VDC
, 60-AM
P (S
EE G
UID
E A
PPEN
DIX
C)
7000 WA
TT, SING
LE PH
AS
E (SEE
NO
TES S
HE
ET FO
R D
ETA
ILS)
240VA
C, 60-A
MP
FUSE
D W
/ 40-A FU
SES
(SEE
GU
IDE
APP
END
IX C
)4-JA
W, 240V
CY
CLO
METE
R R
EGISTER
KWH
ME
TER IN
100-A BAS
E240V
AC
, 60-AM
P FU
SED
W/ 40-A
FUSE
S (S
EE G
UID
E AP
PEN
DIX
C)
KU
P-L-TAP
INS
ULA
TION
PIE
RC
ING
CO
NN
ECTO
RS IN
NEM
A 3R J-BO
X
FOR
UN
US
ED
SER
IES STR
ING
S
PU
T "N/A” in B
LANK A
BOV
E
SEE
GU
IDE
APPE
ND
IX C
FOR
IN
FOR
MA
TION
ON
MO
DU
LE AN
D
ARR
AY
GR
OU
ND
ING
___11___ MO
DU
LES IN
SE
RIE
S SO
UR
CE
-CIR
CU
IT
___11___ MO
DU
LES IN
SE
RIE
S SO
UR
CE
-CIR
CU
IT
___11___ MO
DU
LES IN
S
ERIE
S S
OU
RC
E-C
IRC
UIT
___N/A
___ MO
DU
LES
IN
SER
IES
SO
UR
CE
-CIR
CU
IT
DC DISCO
INVERTER
AC DISCOACDC
MBU
ILDIN
GG
RO
UN
DIN
G
ELE
CTR
OD
E G
Disregard if
provided with
inverter
COM
BINER
M
UTILITY
SERVICE
MAIN
SERVICE PANEL
MAIN
OCPD
J-BOX
1
13
45
67
9
23
4
5 82
EQU
IPMEN
T SCHEDULE
G 10
6
Diag
ram
for
Exa
mple 4 - Su
pply Side Elec
tric
al Diag
ram
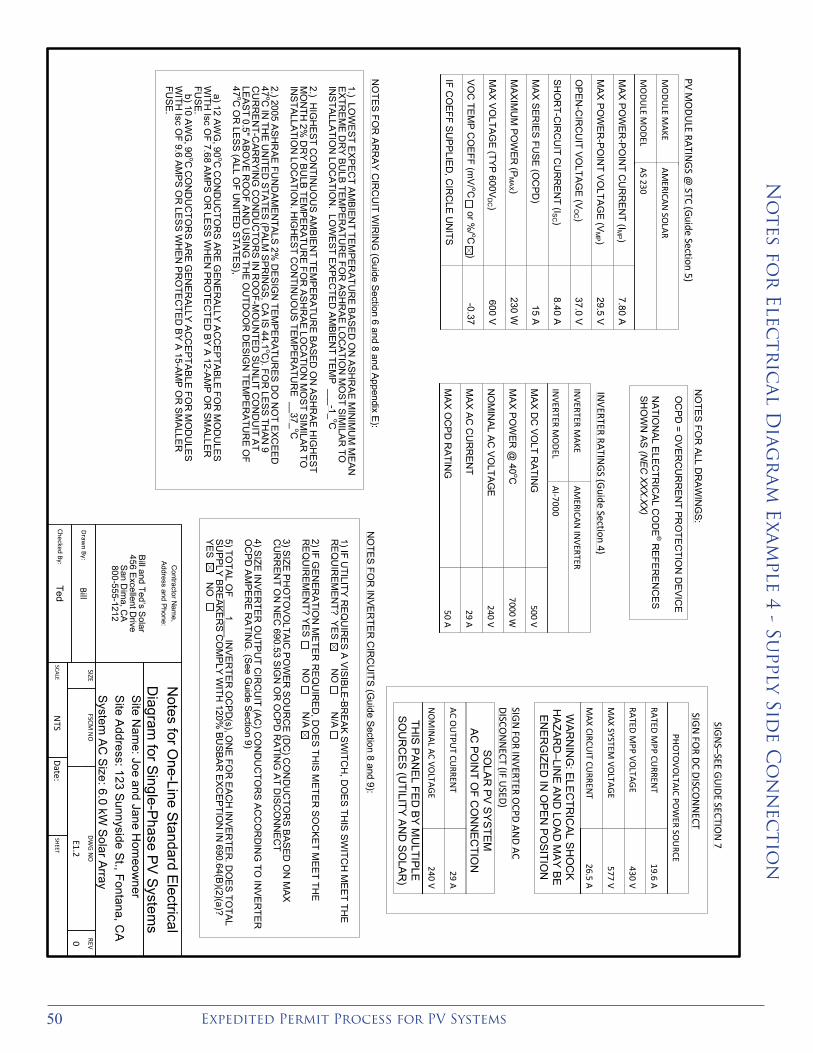
Expedited Permit Process for PV Systems 50
No
tes for
Electr
ical D
iagr
am
Exa
mple 4 - Su
pply Side C
on
nec
tion

51Solar America Board for Codes and Standards Report
APPENDIX B: STRUCTURAL
B.1 Structure Worksheet—WKS1
If array is roof mounted
This section is for evaluating roof structural members that are site built. This includes rafter systems and site built trusses. Manufactured truss and roof joist systems, when installed with proper spacing, meet the roof structure requirements covered in item 2 below.
1. Roof construction: l Rafters l Trusses l Other: ________________________
2. Describe site-built rafter or or site-built truss system.
a. Rafter Size: ___ x ___ inches
b. Rafter Spacing: ________ inches
c. Maximum unsupported span: _____ feet, _____ inches
d. Are the rafters over-spanned? (see the IRC span tables in B.2.) l Yes l No
e. If Yes, complete the rest of this section.
3. If the roof system hasa. over-spanned rafters or trusses,b. the array over 5 lbs/ft2 on any roof construction, orc. the attachments with a dead load exceeding 45 lbs per attachment;
it is recommended that you provide one of the following: i. A framing plan that shows details for how you will strengthen the
rafters using the supplied span tables in B.2. ii. Confirmation certified by a design professional that the roof
structure will support the array.
If array is ground mounted:
1. Show array supports, framing members, and foundation posts and footings.
2. Provide information on mounting structure(s) construction. If the mounting structure is unfamiliar to the local jurisdiction and is more than six (6) feet above grade, it may require engineering calculations certified by a design professional.
3. Show detail on module attachment method to mounting structure.
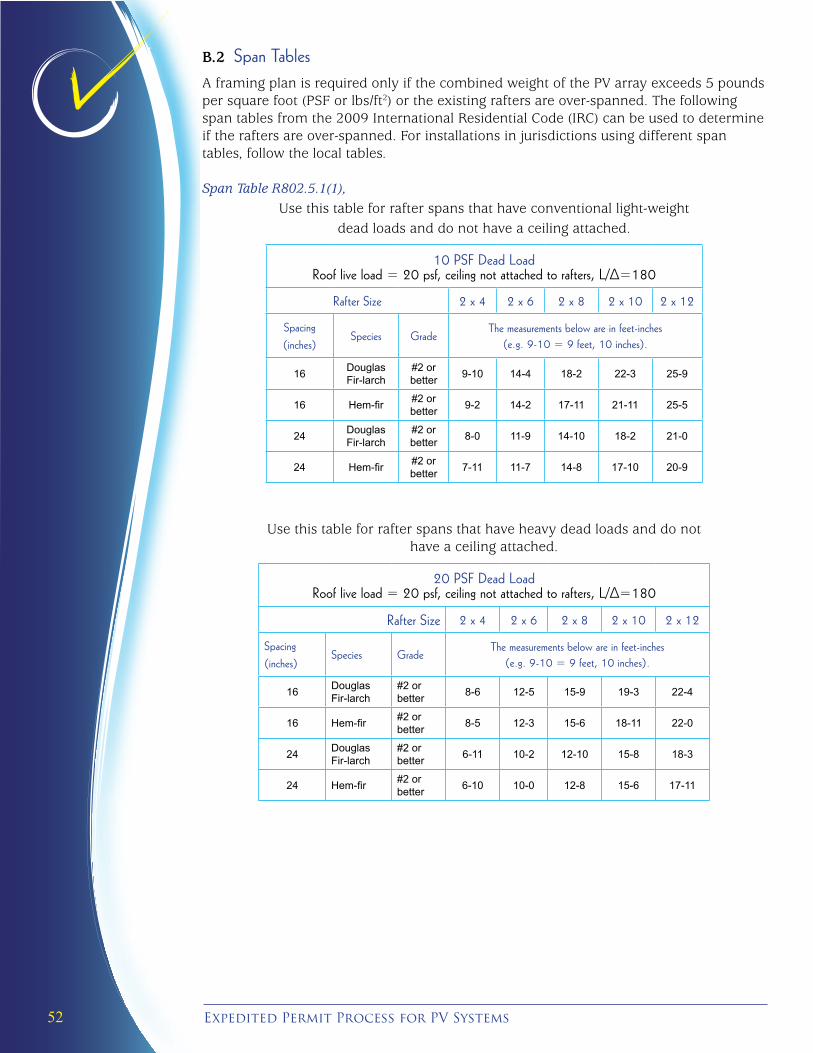
Expedited Permit Process for PV Systems 52
B.2 Span TablesA framing plan is required only if the combined weight of the PV array exceeds 5 pounds per square foot (PSF or lbs/ft2) or the existing rafters are over-spanned. The following span tables from the 2009 International Residential Code (IRC) can be used to determine if the rafters are over-spanned. For installations in jurisdictions using different span tables, follow the local tables.
Span Table R802.5.1(1), Use this table for rafter spans that have conventional light-weight
dead loads and do not have a ceiling attached.
10 PSF Dead Load Roof live load = 20 psf, ceiling not attached to rafters, L/∆=180
Rafter Size 2 x 4 2 x 6 2 x 8 2 x 10 2 x 12
Spacing (inches)
Species GradeThe measurements below are in feet-inches
(e.g. 9-10 = 9 feet, 10 inches).
16 Douglas Fir-larch
#2 or better 9-10 14-4 18-2 22-3 25-9
16 Hem-fir #2 or better 9-2 14-2 17-11 21-11 25-5
24 Douglas Fir-larch
#2 or better 8-0 11-9 14-10 18-2 21-0
24 Hem-fir #2 or better 7-11 11-7 14-8 17-10 20-9
Use this table for rafter spans that have heavy dead loads and do not have a ceiling attached.
20 PSF Dead Load Roof live load = 20 psf, ceiling not attached to rafters, L/∆=180
Rafter Size 2 x 4 2 x 6 2 x 8 2 x 10 2 x 12
Spacing (inches)
Species GradeThe measurements below are in feet-inches
(e.g. 9-10 = 9 feet, 10 inches).
16 Douglas Fir-larch
#2 or better 8-6 12-5 15-9 19-3 22-4
16 Hem-fir #2 or better 8-5 12-3 15-6 18-11 22-0
24 Douglas Fir-larch
#2 or better 6-11 10-2 12-10 15-8 18-3
24 Hem-fir #2 or better 6-10 10-0 12-8 15-6 17-11
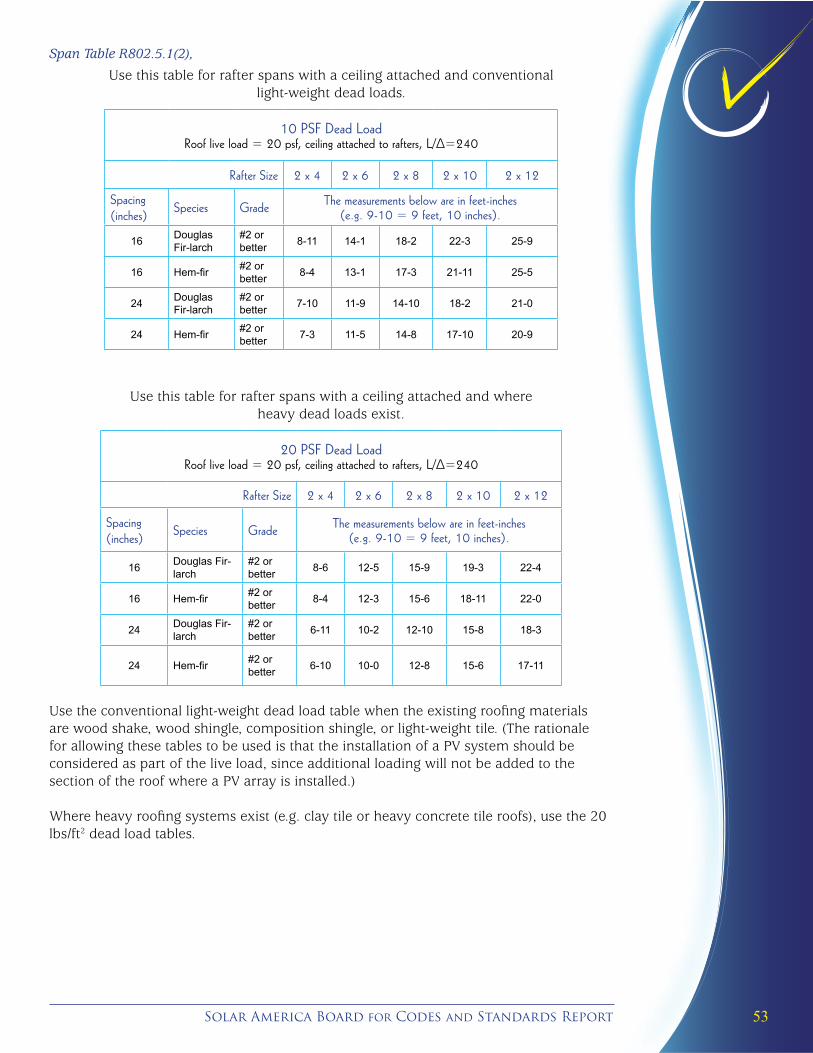
53Solar America Board for Codes and Standards Report
Span Table R802.5.1(2),
Use this table for rafter spans with a ceiling attached and conventionallight-weight dead loads.
10 PSF Dead Load Roof live load = 20 psf, ceiling attached to rafters, L/∆=240
Rafter Size 2 x 4 2 x 6 2 x 8 2 x 10 2 x 12
Spacing (inches) Species Grade The measurements below are in feet-inches
(e.g. 9-10 = 9 feet, 10 inches).
16 Douglas Fir-larch
#2 or better 8-11 14-1 18-2 22-3 25-9
16 Hem-fir #2 or better 8-4 13-1 17-3 21-11 25-5
24 Douglas Fir-larch
#2 or better 7-10 11-9 14-10 18-2 21-0
24 Hem-fir #2 or better 7-3 11-5 14-8 17-10 20-9
Use this table for rafter spans with a ceiling attached and where heavy dead loads exist.
20 PSF Dead Load Roof live load = 20 psf, ceiling attached to rafters, L/∆=240
Rafter Size 2 x 4 2 x 6 2 x 8 2 x 10 2 x 12
Spacing (inches) Species Grade The measurements below are in feet-inches
(e.g. 9-10 = 9 feet, 10 inches).
16 Douglas Fir-larch
#2 or better 8-6 12-5 15-9 19-3 22-4
16 Hem-fir #2 or better 8-4 12-3 15-6 18-11 22-0
24 Douglas Fir-larch
#2 or better 6-11 10-2 12-10 15-8 18-3
24 Hem-fir #2 or better 6-10 10-0 12-8 15-6 17-11
Use the conventional light-weight dead load table when the existing roofing materials are wood shake, wood shingle, composition shingle, or light-weight tile. (The rationale for allowing these tables to be used is that the installation of a PV system should be considered as part of the live load, since additional loading will not be added to the section of the roof where a PV array is installed.)
Where heavy roofing systems exist (e.g. clay tile or heavy concrete tile roofs), use the 20 lbs/ft2 dead load tables.
Expedited Permit Process for PV Systems 54
APPENDIX C: Micro-Inverters And Ac Modules
GeneralMicro-inverters and ac modules convert PV dc power to ac power on a module by module basis. The output of the PV module is fed directly into the inverter so that the majority, or all, of the field wiring is ac rather than dc. This array design has several advantages includ-ing the fact that, when the utility service is shut down, the only voltage that remains in the system is the low dc voltage that the module produces. In the 1999 NEC section 690.6, Alternating-Current (ac) Modules, was added to the electrical code. While a few products existed at that time, only recently has the number of installations increased sharply.
The fundamental difference between micro-inverters and ac modules is that an ac mod-ule does not have to meet the requirements for the dc side of a PV system.The dc wiring is considered internal to the unit and covered by the product listing process (the NEC defines the requirements of an ac module in NEC 690.6(A)). The product listing require-ments for the inverter portion of an ac module is covered in the standard, UL 1741, entitled Inverters, Converters, Controllers and Interconnection System Equipment for Use With Distributed Energy Resources. Article 110.3(B) requires that all equipment is installed according to the product instructions. Jurisdictions are encouraged to approve products that have been certified by a Nationally Recognized Testing Laboratory (NRTL) that is approved by OSHA to test the appropriate product evaluation standards (primar-ily UL1703 and UL1741) in Article 90.7. Since a micro-inverter is not covered by the 690.6(A) provision, it must comply with the requirements for the dc side of a PV system. In essence, a micro-inverter system is simply a very small PV system with a one (or two) module PV array.
Common code issues for micro-inverters and ac modulesConductors used for micro-inverters and ac modulesCables and conductors connected to micro-inverters and ac modules have been called into question by various jurisdictions over the years. Since the wiring for these types of PV systems are often concealed under the PV module, 690.34 applies for connections that require access under the module. 690.34 states, Access to Boxes. Junction, pull, and outlet boxes located behind modules or panels shall be so installed that the wiring contained in them can be rendered accessible directly or by displacement of a module(s) or panel(s) se-cured by removable fasteners and connected by a flexible wiring system. This requires that a flexible wiring system be used to provide for access and servicing. The most common cable type used for the ac side of these systems is Type TC-ER, which is tray cable with extra reinforcing and protection. TC-ER when rated sunlight resistance meets all the requirements of 690.31(C), Flexible Cords and Cables that are required for tracking sys-tems even though most micro-inverters are not installed in tracking systems. 690.31(C) cables must be rated for extra hard usage, for outdoor use, for wet locations, and for sunlight resistance, and meet the requirements of article 400. While Type TC-ER is not specifically mentioned in article 400, 400.4 states, “400.4 Types. Flexible cords and flex-ible cables shall conform to the description in Table 400.4. Types of flexible cords and flexible cables other than those listed in the table shall be the subject of special investigation.” Since the cable is part of the overall equipment listing, the cable, connectors, and cable to the junction box where the wiring method is transitioned to standard wiring methods is cov-ered by the equipment listing and subjected to special investigation. Proper support of the cable is an important safety consideration and the installation instruction should pro-vide detailed information on how to properly support the cable between modules and to the transitional junction box.
Another common issue for micro-inverters and ac modules is a shared OCPD for multiple units. Typical string inverters will each require a dedicated OCPD, which would be a bur-densome requirement for a system with many micro-inverters or ac modules. This
55Solar America Board for Codes and Standards Report
feature allows up to 15 or 20 outputs to be paralleled with field wiring and protected by a single 15A or 20A breaker which does not need to be located at the array. Product docu-mentation will describe the maximum number of units that could be paralleled in this man-ner on a single OCPD. This configuration is still be compatible with 690.64(B)(1) in that individual inverters/modules can still be disconnected individually, as described below.
Since the remaining requirements differ between micro-inverters and ac modules, the NEC requirements will be covered separately in the following sections.
AC Module Systems in the NECAc modules are defined by the NEC as a complete package of PV parts and electronics, independent of mounting structure, which produces ac power. 690.6 covers the installa-tion requirements of ac modules. 690.6(C) permits a single disconnecting means to pro-vide disconnect for multiple inverters on the same circuit. 690.6(D) permits one device to provide ground-fault protection for all the ac modules a single circuit. Note that this is not a requirement, but rather an allowance. An installer might want to provide this capability with a typical 15- or 20-amp GFCI breaker. While this sounds like a good idea, and ap-pears to comply with 690.6(D), there are no GFCI breakers on the market, as of the writ-ing of this document, that are listed for bidirectional power flow. Laboratory tests have shown that some GFCI breakers can be damaged while backfeeding power. A message to plan checkers and inspectors on this item—do not require GFCI breakers on circuits con-nected to ac modules until it is a code requirement and specifically listed products are available to properly provide protection.
Marking
Ac module marking is covered specifically in 690.52. These markings are:(1) Nominal operating ac voltage(2) Nominal operating ac frequency(3) Maximum ac power(4) Maximum ac current(5) Maximum overcurrent device rating for ac module protection
690.52(5) would normally be the maximum rating of the branch circuit breaker feeding the circuit to the ac modules. The markings of 690.51 (PV module) and 690.53 (PV power source) are not required on the ac module.
The output of ac modules is defined as an inverter output circuit [690.6(B)] and the over-current protection for that circuit is permitted to follow the requirements of 240.5(B)(2) for fixture wires. This is significant in that it allows products to have smaller wire connected to OCPDs. By allowing smaller conductors in circuits with larger OCPDs, a product is allowed to have small conductors connected directly to the ac module while feeding power into a larger feeder. The fixture wire provisions even allow as small as 18AWG conductors to be protected by a 20-amp OCPD provided that the circuit is no longer than 20 feet. This is per-missive language and does not trump the sizing and OCPD for standard wiring systems. It does allow specialty wiring systems that are evaluated as part of the product listing. Once the circuit reaches the inverter output circuit’s OCPD, all aspects of an ac module are identi-cal to other utility-interactive PV systems from that point onward.
Micro-Inverter Systems in the NECThe term “micro-inverter” is not used in the NEC through the 2011 version. Therefore, the requirements for micro-inverter installations must be ascertained from a series of code requirements that relate to these devices. The key sections of article 690 that provide specific guidance to micro-inverter installations are covered here sequentially.
Maximum system voltage690.7 defines maximum system voltage as it applies to the dc PV array. Since the PV ar-ray is only one or two modules, the worst-case value for most of the U.S. would be to
Expedited Permit Process for PV Systems 56
multiply the module rated open-circuit voltage (Voc) by 1.25 since that covers crystalline silicon modules down to 40°F or -40°C. For simplicity, take the maximum allowable dc voltage for the micro-inverter and divide that value by 1.25. This means that a micro-inverter with a 60-Volt maximum system voltage can use any crystalline-silicon module that has a rated Voc of 48 Volts or less without exceeding maximum voltage. For situa-tions where this simplified 1.25 factor does not work, the standard calculations for maxi-mum system voltage, detailed in section 6 of this guideline, should be used.
Disconnecting Means
Since most micro-inverters are mounted in locations that are not readily accessible (e.g. sloped rooftops), then we must review the requirements of 690.14 (D) Utility-Interactive Inverters Mounted in Not-Readily-Accessible Locations.
This provision specifically allows micro-inverters to be installed in places that are not readily accessible like rooftops. In order to meet the requirements, the micro-inverter must have dc and ac disconnects in sight of the inverter. These disconnects would also be in a not-readily accessible locations so 690.14(D)(3) requires that an additional ac disconnect be in a readily accessible location. This provision can be met as simply as a circuit breaker at the ac point of connection in the main service panel on a house. Lastly, 690.14(D)(4) requires that a sign be placed at the service entrance notifying where the inverters are located on the premises. The cited article 705.10 allows large numbers of inverters to be identified in groups rather than individually.
690.14(D) begs the question as to whether disconnects now have to be mounted with the micro-inverters. Bulky, vertically mounted disconnects would clearly make micro-inverters impractical. However, the exception at the end of 690.17 clarifies that a connector may be used as a disconnect provided the connector meets the requirements of 690.33 and is identified for the application. All the requirements in 690.33 apply, but the most specific relates to interruption of the circuit, 690.33(E).
690.33(E) Interruption of Circuit. Connectors shall be either (1) or (2): (1) Be rated for interrupting current without hazard to the operator. (2) Be a type that requires the use of a tool to open and marked “Do Not Disconnect Under Load” or “Not for Current Interrupting.”
Some micro-inverter manufacturers have their connectors certified as capable of interrupting maximum current without hazard to the operator. Those that do not have this certification must have connectors that require a tool along with the required marking to prevent inadvertent disconnect under load.
System and Equipment Grounding of Micro-Inverters
Since all the dc requirements remain in effect for a micro-inverter, the system grounding rules apply. If a product requires a conductor to be grounded, a grounding electrode (GEC) must be run from the inverter to the grounding electrode system. The minimum size GEC for dc or ac systems is 8AWG [250.166 or 250.66]. Since micro-inverters may choose to ground the dc side of the system, those inverters will need an 8AWG conductor run to the grounding electrode system. 690.47(C)(3) allows for the dc GEC to be combined with the ac equipment grounding conductor (EGC) and for that combined conductor to be terminated at the grounding busbar in the service equipment where the ac circuit originates. This means that a bare or sunlight resistant 8AWG or 6AWG can be run, outside of a raceway and adjacent to the ac conductors, to pick up both the GEC and EGC requirements of a micro-inverter array. At the point where the current carrying conductors transition from the array to the wiring method going to the service panel, the combined GEC/EGC can be irreversibly spliced to a stranded 8AWG to be landed at the grounding busbar in the service equipment.
If the inverter is ungrounded, no GEC is required. Therefore, the EGC must simply be that required by the OCPD supplying the circuit and sized according to Table 250.122. The EGC can now easily be incorporated into the ac connector system provided that it the EGC is the first to make and last to break according to 690.33(D).
57Solar America Board for Codes and Standards Report
Marking
Again, since dc requirements remain for micro-inverters, 690.53, marking for the PV power source applies. In this case, manufacturing a new sign is somewhat problematic since the dc disconnect is a connector. 690.53 requires that the sign be mounted on or adjacent to the PV power source disconnect. Alternatively, the PV module, as required in 690.51, has very similar marking requirements and the marking is adjacent to the PV power source disconnect, the dc connectors. The purpose of the 690.53 sign is to identify the PV array connected to an inverter since the array is often not visible from the location of the inverter, or the size of array is not obvious at the inverter. In the case of the micro-inverter, the array is essentially being held in the hands of the person operating the PV power source disconnect, with the array plainly marked [690.51], so the intent of 690.53 is met.
Expedited Permit Process for PV Systems 58
APPENDIX D: Special Electrical Topics
Module Frame GroundingModule frame grounding has been a subject of confusion and controversy for many years. The primary concern raised by industry experts, including the Solar ABCs, has been the fact that the anodized aluminum frames in contact with anodized aluminum rails may not create an adequate and reliable electrical connection for bonding and grounding requirements. Until this issue was raised, many inspectors and contractors were satisfied with grounding the metal support structure rather than grounding indi-vidual modules. Several standard and new grounding methods can address the electrical bond of the module frame to its support by penetrating each nonconductive surface with a sharp, metallurgically compatible device. This device may be a simple as a stainless steel star washer, or as unique as a specially designed grounding clip with sharp points to pierce the anodizing, addressing the concern of creating a solid electrical connection that will resist corrosion.
PV module grounding options include a variety of methods, such as grounding screws or lugs on each module connected to a ground wire, or methods that create an electrical bond between the module frame and its support structure. Installation manuals for PV modules have become more explicit about grounding methods. The appropriate ground-ing means are to be defined in the module installation instructions as part of the UL1703 listing. While equipment grounding requirements for PV modules still require some level of interpretation by the local jurisdiction, clarifying language is being proposed for the UL1703 standard that should address most of the current ambiguities.
AC Connection to Building Electrical SystemsAC Connection to Load Side of Main Service Panel
The connection of a PV system’s inverter output circuit to the load side of the Main Ser-vice panel is the most common installation method. This type of connection is governed by the requirements of NEC 705.12(D) and 690.64(B) in the 2008 NEC. These require-ments dictate that the maximum sum of the current ratings of overcurrent protection devices (OCPDs) that can be fed into a conductor or busbar is 120% of the busbar or conductor rating [NEC 705.12(D)(2)]. For example, if a busbar has a current rating of 225-amps, and a main breaker rated at 200-amps, then the maximum breaker rating for a PV inverter is 70-amps as shown below:
Maximum allowable OCPD: Busbar = 225A; 120% of Busbar = 225A x 1.2 = 270A
Existing Main OCPD = 200A
Maximum PV OCPD = Maximum allowable OCPD - Existing Main OCPD = 270A - 200A = 70A
To determine the maximum size inverter that can be fed into a 70A OCPD, remember that most circuit breakers and other OCPDs are limited to 80% of their current rating for continuous operation. This means that 70A circuit breaker must be sized so that 56A can pass through the breaker on a continuous basis (3-hours or more). Since PV inverters are rated based on their maximum power at 40C for a continuous 3-hour period, an inverter capable of a continuous 56A is capable of 11,648 Watts at 208Vac; 13,440Wac at 240Vac; and 15,512Wac at 277Vac.
The only way to put more current into the load side of the service panel in this is example, is to reduce the size of the main OCPD. To the extent that the main OCPD is reduced, the PV inverter OCPD may be increased. However, any time a main OCPD is reduced, a load calculation following the requirements of NEC Article 220 must be calculated to show that the load on the main OCPD will not see more than an 80% continuous load at the chosen OCPD rating.
59Solar America Board for Codes and Standards Report
If no other panel boards exist on this service, the only other opportunity to install a larger PV system is to make a supply-side service connection [NEC 705.12(A) in the 2011 NEC and 690.64(A) in the 2008 NEC]. This method is discussed in the AC Supply Side Connection section in this Appendix.
AC Connection to SubpanelWhen a site service contains more than one panel board, the panels fed from the main service panel are referred to as subpanels. The NEC, in 705.12(D) and NEC 690.64(B)(1) in the 2008 NEC, allows the inverter OCPD to be connected at any location in the premises wiring system, provided that the 120% of busbar and conductor ampacity limitation is observed.
For example, a large residence has a main panel with a 400-amp rating with a 400-amp main OCPD. From a 200-amp breaker in this 400-amp panel is a 200-amp panel at the opposite end of the residence. In this example, the PV array is located much closer to the 200-amp panel, so the preferred interconnection point is the 200-amp panel. As long as the inverter OCPD complies with limitations of the 200-amp panel, the inverter can interconnect at that panel.
With a 200-amp busbar and a 200-amp main breaker, the largest PV OCPD allowed in that panel is 40-amps (see discussion on AC Connection to Load Side of Main Service Panel in this Appendix). Assuming a 40-amp PV OCPD is sufficient for the PV inverter (e.g. 7000 Watt inverter), the issues of concern in the subpanel are addressed.
Now consider the current flow at the main service panel. The 2011 NEC instructs the installer to calculate the sum of the supply OCPDs at the main service panel based on the rating of inverter OCPD, which is 40-amps, not the 200-amp feeder breaker that feeds the subpanel [NEC 705.12(D)(2) and NEC 690.64(B)(2) in the 2008 NEC]. Clearly, the 40-amp PV OCPD does not exceed the 120% of busbar rating in the 400-amp panel, whereas, had the 200-amp feeder breaker value been used in the calculation, the installation would have been in violation.
To further extend this example, should another PV inverter be desired, due to the large electrical consumption of the residence, there is still ampacity allowance in the 400-amp main panel busbar. The allowable inverter OCPD size would be calculated as follows:
Maximum allowable OCPD: Busbar = 400A; 120% of Busbar = 400A x 1.2 = 480A
Existing Main OCPD = 400A; Inverter OCPD in 200A subpanel = 40A
Maximum PV OCPD in 400A panel = Maximum allowable OCPD - Existing Main OCPD - Inverter OCPD in 200A subpanel = 480A - 400A - 40A = 40A
Therefore an additional 40A inverter OCPD could be placed in the main panel without any changes to the panel.
Should a larger PV system be desired than could be handled by the two 40A breakers in this example, refer to the discussions in AC Connection to Load Side of Main Service Panel in this Appendix.
AC Supply Side Connection
When the size of PV system is relatively large relative to the size of the site service, it is fairly common to consider a supply side connection for the inverter OCPD. Whenever the 120% allowance for OCPDs connected to busbars or conductors cannot be observed, due to size of the required PV OCPD and the limited size of the service panel, the supply side connection may be the only alternative available. A supply side connection is defined as a connection made between the service meter and the service disconnect.
Expedited Permit Process for PV Systems 60
Not all services can be legally connected at this point. For instance, many all-in-one meter panels, used routinely in new residential construction, have no means of making such a connection without violating the listing of the product. On the other end of the size spectrum, many large 3,000-amp service panels have no space for such a connection. To further complicate this situation, some utilities have begun requiring metering current transformers to be installed on the load side of service OCPD, making a supply side connection impossible.
With those complications aside, we will discuss the situations where a supply side connection is possible and does not violate the equipment listings of the service equipment. The NEC covers supply side connections in 705.12(A) and 690.64(A) in the 2008 NEC. These sections refer back to article 230.82. The supply side connection for the PV system must have a disconnect and OCPD located immediately adjacent to the main service disconnect as specified in 230.91. If the connection is not adjacent, then there must be sign or directory showing where the disconnect(s) are located [NEC 690.56(B)]. Even though the tap rule, discussed in Article 240.99 does not apply to supply side connections, the conductors connecting the supply side connection to the PV OCPD are sized according to the OCPD rating. Therefore, if a 60-amp fused disconnect is used as the PV OCPD, the conductor size between the supply side connection and the PV OCPD need only be 6AWG, regardless of the size of service conductors.
The method of termination of PV conductors to the supply conductors or busbar, depends on the service equipment and conductors. In any case, the service voltage will need to be interrupted to tie in to the service conductors or busbar (very rare exceptions outlined in NFPA 70E are involved at facilities like hospitals where the cut-in process must be done while energized.) Typical termination methods include several options:
1. lugging to an accessible perforated bus within service equipment;
2. using an empty set of double-barrel lugs within service equipment;
3. using piercing lugs on conductors between the meter and service disconnect;
4. any lug identified for making connections to conductors of the size range installed.
Installing lugs on service conductors will often require removal of service conductors and conduit and reinstalling conductors with a junction box to accommodate the connection.
A standard diagram has been added to the list of standard diagrams for permit submittals. The key issue in the permit process is to clearly define the code approved method of making the electrical connection on the supply side of the service disconnect. An example of the diagram, based on Example 1 in Appendix A, is provided on the next page. This diagram is available as a blank interactive PDF at www.solarabcs.org/permitting
Source Circuit Overcurrent ProtectionSource circuit overcurrent protection must be sized so that both the PV module and the conductor from the module to the overcurrent device are properly protected [NEC 690.9 (A), 240.20 (A)]. PV modules must be protected so that the maximum series fuse rating, printed on the listing label, is not exceeded. It is important to note that even though the listing label states “fuse” rating, a more accurate term would be the “maximum series overcurrent protection” rating since either a fuse or a circuit breaker may be used to satisfy this listing requirement. The module may be protected either by installing fuses or circuit breakers in a series string of modules or by the design of the PV system.
Inverters listed with a maximum utility back feed current that is well above 2 amps (typically equal to the maximum allowable output overcurrent protection) must be assumed to provide back feed current to the PV array. Each source circuit must have overcurrent protection that is greater than or equal to the minimum PV Source Circuit current rating and less than or equal to the maximum series fuse rating.
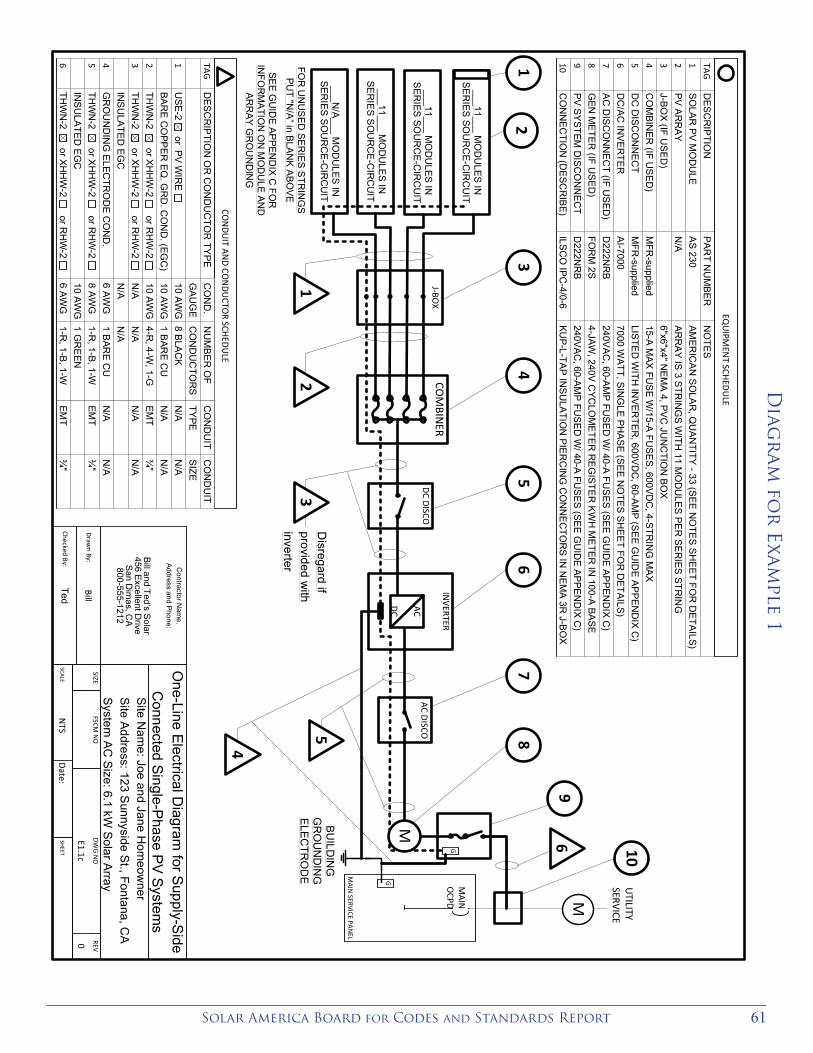
61Solar America Board for Codes and Standards Report
Diag
ram
for
Exa
mple 1

Expedited Permit Process for PV Systems 62
Explanation: For source circuit with a maximum circuit current of 6.8 amps and a maximum series fuse rating of 15 amps, The minimum fuse rating would be 9 amps (next larger fuse rating above 8.5 amps; 6.8A x 1.25 = 8.5A) and the maximum would be 15 amps.
For inverters listed with a maximum utility back feed current that is 2 amps or less (e.g. Fronius IG 4000), two source circuits can be connected to the inverter without requiring overcurrent protection on either circuit.
Explanation: If an array containing two strings in parallel is connected to an inverter that is a limited back feeding source (2 amps or less), the maximum current in a string is equal to the current from the other string in parallel plus the maximum back-fed current from the inverter. If the maximum current of each string is 6.8 Amps, and the inverter provides 2 amps, then the maximum current in a fault at any PV module is 8.8 Amps and the maximum series fuse rating of the module will never be ex-ceeded (i.e. a module with an ISC of 5.4 amps will have a maximum series overcurrent device rating of at least 10 amps).
For smaller inverters listed with a maximum utility back feed current that is no larger than the module maximum overcurrent device rating (e.g. Enphase M200 with a 1.6 amp utility backfeed), a single source circuit can be connected to the inverter without requiring overcurrent protection on the array circuit.
Explanation: If a single string array (could be a single module array) is connected to an inverter that provides less than the rated module maximum overcurrent device rating in backfeed current, it is equivalent to having that size overcurrent device prevent current flow from the utility and the array is protected. The maximum reverse fault current at any PV module is the amount of the inverter utility backfeed current and the maximum series fuse rating of the module will never be exceeded.
Disconnecting MeansThe NEC defines disconnecting means in the following way: “NEC Article 100 Disconnecting Means. A device, or group of devices, or other means by which the conductors of a circuit can be disconnected from their source of supply.”
A primary purpose of a disconnecting means is to open a circuit providing a source of supply so that the equipment fed by that source can be maintained without exposing the operator to hazardous voltages. NFPA 70E, Standard of Electrical Safety in the Workplace refers to this as an electrically safe work condition.
Disconnecting Means in Inverters
Various inverters have provided a variety of integral dc and ac disconnects. These disconnects may or may not provide the necessary isolation for maintenance. The key in differentiating whether the supplied disconnects provide the appropriate isolation is to review the primary method of maintenance and repair of the device. If the device has a standard means of removing the parts needing service, without exposing the technician to hazardous voltages (anything over 50 Volts), the supplied disconnects meet the intent of maintenance disconnecting means. If the technician is exposed to voltages above 50 Volts during service, even with the supplied disconnecting means, external disconnecting means may be necessary.
It is important to point out that every currently available PV inverter that does not operate on a battery system has input capacitors. These capacitors may remain energized for five or more minutes after all external sources are removed from an inverter. Internal bleed resistors remove this voltage over a prescribed time period, and warning labels are provided on the inverter to identify this hazard. This hazard is typical of electrical equipment using significant capacitance. This capacitive source is controlled by warning signage and bleed resistors and not generally by internal or external disconnects. Disconnects should not be required to control the capacitive source during maintenance or service of the inverter.
63Solar America Board for Codes and Standards Report
Utility-Required Disconnecting Means
Utilities may require some method to isolate PV systems from their grid during maintenance procedures. The isolation device is usually required to provide a visible break in order to comply, and molded-case circuit breakers do not meet that requirement. Several utilities, including the utility with the most PV installations in the U.S., Pacific Gas & Electric, have adopted a policy of allowing residential PV systems with self-contained meters (the most common residential-type meter) to provide the necessary visible break via removal of the meter. For installations with current-transformer meters, a separate visible-break switch is almost always required. When the utility requires a visible-break switch, this switch may be used to provide the NEC-required ac switch for maintaining the inverter if the inverter is located in the immediate vicinity of the switch.
Provisions for the Photovoltaic Power Source Disconnecting MeansThe NEC states in 690.14(C)(1), “Location. The photovoltaic disconnecting means shall be installed at a readily accessible location either outside of a building or structure or inside nearest the point of entrance of the system conductors.”
a) Readily accessible—NEC Article 100 defines, “Accessible, Readily (Readily Accessible). Capable of being reached quickly for operation, renewal, or inspections without requiring those to whom ready access is requisite to climb over or remove obstacles or to resort to portable ladders, and so forth.”
b) The “readily accessible” provision is primarily for emergency operation. If the disconnect is not mounted in close proximity of the service entrance disconnect (usually within 10 feet of the meter location or service disconnect switch), then a diagram or directory must be provided to clearly identify where the disconnecting means is located.
c) A rooftop disconnect on a residential roof will normally not qualify as a readily accessible disconnect.
An exception to this requirement was added to the 2005 NEC to provide additional clarification for residential and building integrated PV systems. This exception reads:
“Exception: Installations that comply with 690.31(E) shall be permitted to have the disconnecting means located remote from the point of entry of the system conductors.”
NEC 690.31(E) states:
“(E) Direct-Current Photovoltaic Source and Output Circuits Inside a Building. Where direct current photovoltaic source or output circuits of a utility-interactive inverter from a building-integrated or other photovoltaic system are run inside a building or structure, they shall be contained in metal raceways or metal enclosures from the point of penetration of the surface of the building or structure to the first readily accessible disconnecting means. The disconnecting means shall comply with 690.14(A) through 690.14(D).”
Although metal-clad cable is not specifically called out in 690.31(E), in the 2005 and 2008 NEC, many jurisdictions consider installations with metal-clad cable as meeting the intent of this provision.The 2011 NEC specifically allows MC cable in this application by adding the phrase, “Type MC metal-clad cable that complies with 250.118 (10),” to the list of allowed wiring methods. Note that this section specifically mentions building-integrated systems. The way the 2002 NEC was written, a roof-integrated PV system cannot reasonably comply with 690.14(C)(1) as written.

Expedited Permit Process for PV Systems 64
APPENDIX E: COSTS OF PERMITSEach jurisdiction may have different internal costs structures and approaches to working with solar PV systems. The following section is provided as a suggestion in developing the cost structure for a local jurisdiction.
Explanation: Costs for permits are often based on the overall project cost. This works well for many conventional projects because this accurately represents the scale of the project. However, with a PV installation, the equipment costs are much higher than with other projects of similar scope. It is therefore recommended that an alternative permit fee scale be used for PV system installations. The scope of a PV installation is similar to that of installing a retrofitted residential HVAC system. The permitting costs for a PV system should be similar to those for an HVAC system.
Although initial plan review and field inspection costs may be slightly higher for the first few systems, those costs should reduce as the local jurisdiction becomes familiar with the installations. A subdivision of more than 10 units should be considered for an additional fee reduction based on the repetitive nature of the reviews. A suggested fee schedule is as follows:
Small PV system (up to 4 kW): $75 - $200Large PV system (up to 10 kW): $150 - $400
For systems of 10-50 kW, consider a permit cost of $15 - $40 per kW.
For systems of 50-100 kW, consider a permit cost of $1,500.
For systems of 100-500 kW, consider a permit cost of $3,000.
For systems up to 1000 kW, consider a permit cost of $3,000-$5,000.
65Solar America Board for Codes and Standards Report
APPENDIX F: Temperature Tables
Design Temperatures For Various U.S. Cities
The tables on the following pages indicate low and high ambient design temperatures that must be used when designing code-compliant PV systems. These temperatures have been provided by ASHRAE, and are given in degrees Celsius. The high temperatures are used for conductor sizing and calculations of minimum array operating voltage. The low temperatures are used in the NEC 690.7 calculation.
This website provides an alternative method of viewing this same data: http://www.solarabcs.org/about/publications/reports/expedited-permit/map/index.html
There are several numbers listed for each site. A description of each number follows:
Elev.: the elevation in meters of the meteorological site.
High Temp (0.4%): this air temperature is only exceeded during 3 hours (not necessarily continuous) of a summer month (June through August). This number is slightly more conservative than the 2% value.
High Temp (2%): this number is likely exceeded during 14 hours (not necessarily continuous) over a summer month (June through August). The Copper Development As-sociation recommends that this number be used for ampacity calculations.
Distance above roof: The high temperature numbers refer only to the air temperature. According to the National Electrical Code, the temperature within rooftop raceways shall be assumed higher than ambient; these temperatures are dependent upon the minimum height of that conduit above the roof (NEC 2008 Table 310.15(B)(2)(c), or NEC 2011 Table 310.15(B)(3)(c)). The three figures here (0.5”, 3.5”, 12”) are based off the High Temp (2%) numbers. Conduit that touches the roof, or is less than 0.5” above the roof is not listed since it is poor practice to mount conduit this close to the roof in general.
Extreme Min: The lowest expected ambient temperature for this site. This number should be used for the calculations for maximum system voltage required in NEC 690.7.An Informational Note in 690.7(A) in the 2011 NEC specifies this value, the Extreme Annual Mean Minimum Design Dry Bulb Temperature from ASHRAE Handbook— Fundamentals, as the proper value for lowest expected ambient temperature.
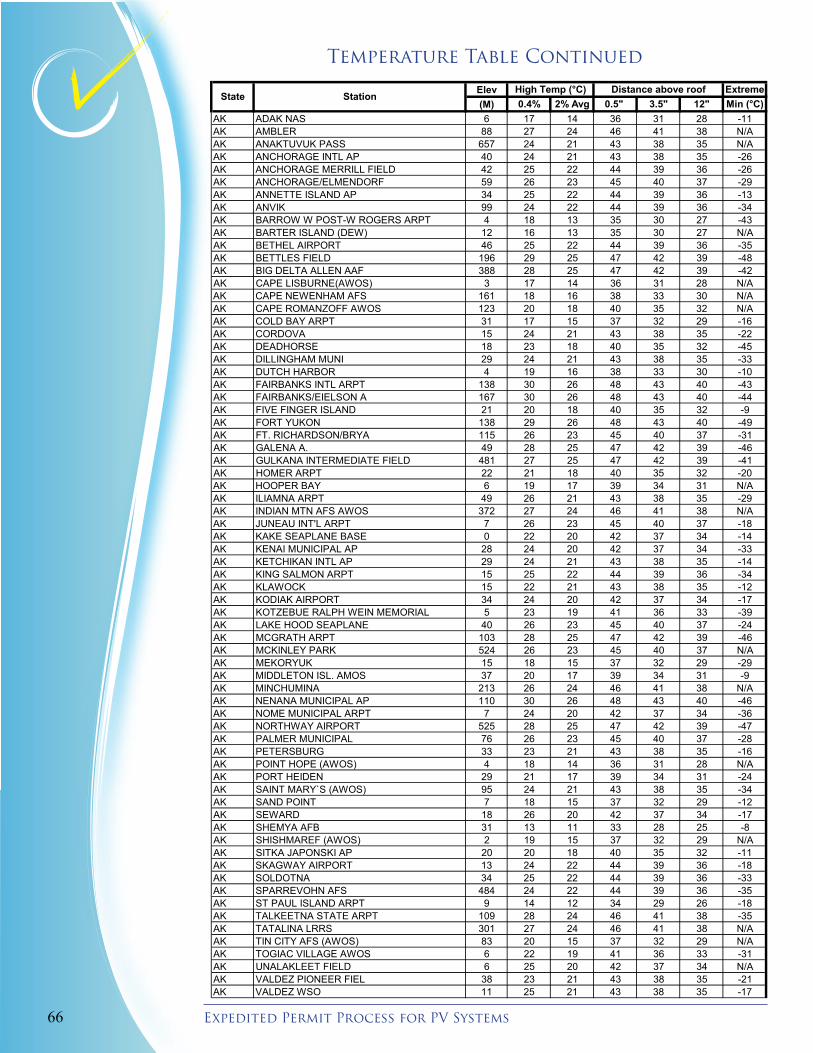
Expedited Permit Process for PV Systems 66
Temperature Table ContinuedASHRAE DATA
Elev Extreme(M) 0.4% 2% Avg 0.5" 3.5" 12" Min (°C)
AK ADAK NAS 6 17 14 36 31 28 -11AK AMBLER 88 27 24 46 41 38 N/AAK ANAKTUVUK PASS 657 24 21 43 38 35 N/AAK ANCHORAGE INTL AP 40 24 21 43 38 35 -26AK ANCHORAGE MERRILL FIELD 42 25 22 44 39 36 -26AK ANCHORAGE/ELMENDORF 59 26 23 45 40 37 -29AK ANNETTE ISLAND AP 34 25 22 44 39 36 -13AK ANVIK 99 24 22 44 39 36 -34AK BARROW W POST-W ROGERS ARPT 4 18 13 35 30 27 -43AK BARTER ISLAND (DEW) 12 16 13 35 30 27 N/AAK BETHEL AIRPORT 46 25 22 44 39 36 -35AK BETTLES FIELD 196 29 25 47 42 39 -48AK BIG DELTA ALLEN AAF 388 28 25 47 42 39 -42AK CAPE LISBURNE(AWOS) 3 17 14 36 31 28 N/AAK CAPE NEWENHAM AFS 161 18 16 38 33 30 N/AAK CAPE ROMANZOFF AWOS 123 20 18 40 35 32 N/AAK COLD BAY ARPT 31 17 15 37 32 29 -16AK CORDOVA 15 24 21 43 38 35 -22AK DEADHORSE 18 23 18 40 35 32 -45AK DILLINGHAM MUNI 29 24 21 43 38 35 -33AK DUTCH HARBOR 4 19 16 38 33 30 -10AK FAIRBANKS INTL ARPT 138 30 26 48 43 40 -43AK FAIRBANKS/EIELSON A 167 30 26 48 43 40 -44AK FIVE FINGER ISLAND 21 20 18 40 35 32 -9AK FORT YUKON 138 29 26 48 43 40 -49AK FT. RICHARDSON/BRYA 115 26 23 45 40 37 -31AK GALENA A. 49 28 25 47 42 39 -46AK GULKANA INTERMEDIATE FIELD 481 27 25 47 42 39 -41AK HOMER ARPT 22 21 18 40 35 32 -20AK HOOPER BAY 6 19 17 39 34 31 N/AAK ILIAMNA ARPT 49 26 21 43 38 35 -29AK INDIAN MTN AFS AWOS 372 27 24 46 41 38 N/AAK JUNEAU INT'L ARPT 7 26 23 45 40 37 -18AK KAKE SEAPLANE BASE 0 22 20 42 37 34 -14AK KENAI MUNICIPAL AP 28 24 20 42 37 34 -33AK KETCHIKAN INTL AP 29 24 21 43 38 35 -14AK KING SALMON ARPT 15 25 22 44 39 36 -34AK KLAWOCK 15 22 21 43 38 35 -12AK KODIAK AIRPORT 34 24 20 42 37 34 -17AK KOTZEBUE RALPH WEIN MEMORIAL 5 23 19 41 36 33 -39AK LAKE HOOD SEAPLANE 40 26 23 45 40 37 -24AK MCGRATH ARPT 103 28 25 47 42 39 -46AK MCKINLEY PARK 524 26 23 45 40 37 N/AAK MEKORYUK 15 18 15 37 32 29 -29AK MIDDLETON ISL. AMOS 37 20 17 39 34 31 -9AK MINCHUMINA 213 26 24 46 41 38 N/AAK NENANA MUNICIPAL AP 110 30 26 48 43 40 -46AK NOME MUNICIPAL ARPT 7 24 20 42 37 34 -36AK NORTHWAY AIRPORT 525 28 25 47 42 39 -47AK PALMER MUNICIPAL 76 26 23 45 40 37 -28AK PETERSBURG 33 23 21 43 38 35 -16AK POINT HOPE (AWOS) 4 18 14 36 31 28 N/AAK PORT HEIDEN 29 21 17 39 34 31 -24AK SAINT MARY`S (AWOS) 95 24 21 43 38 35 -34AK SAND POINT 7 18 15 37 32 29 -12AK SEWARD 18 26 20 42 37 34 -17AK SHEMYA AFB 31 13 11 33 28 25 -8AK SHISHMAREF (AWOS) 2 19 15 37 32 29 N/AAK SITKA JAPONSKI AP 20 20 18 40 35 32 -11AK SKAGWAY AIRPORT 13 24 22 44 39 36 -18AK SOLDOTNA 34 25 22 44 39 36 -33AK SPARREVOHN AFS 484 24 22 44 39 36 -35AK ST PAUL ISLAND ARPT 9 14 12 34 29 26 -18AK TALKEETNA STATE ARPT 109 28 24 46 41 38 -35AK TATALINA LRRS 301 27 24 46 41 38 N/AAK TIN CITY AFS (AWOS) 83 20 15 37 32 29 N/AAK TOGIAC VILLAGE AWOS 6 22 19 41 36 33 -31AK UNALAKLEET FIELD 6 25 20 42 37 34 N/AAK VALDEZ PIONEER FIEL 38 23 21 43 38 35 -21AK VALDEZ WSO 11 25 21 43 38 35 -17
Distance above roofHigh Temp (°C)State Station
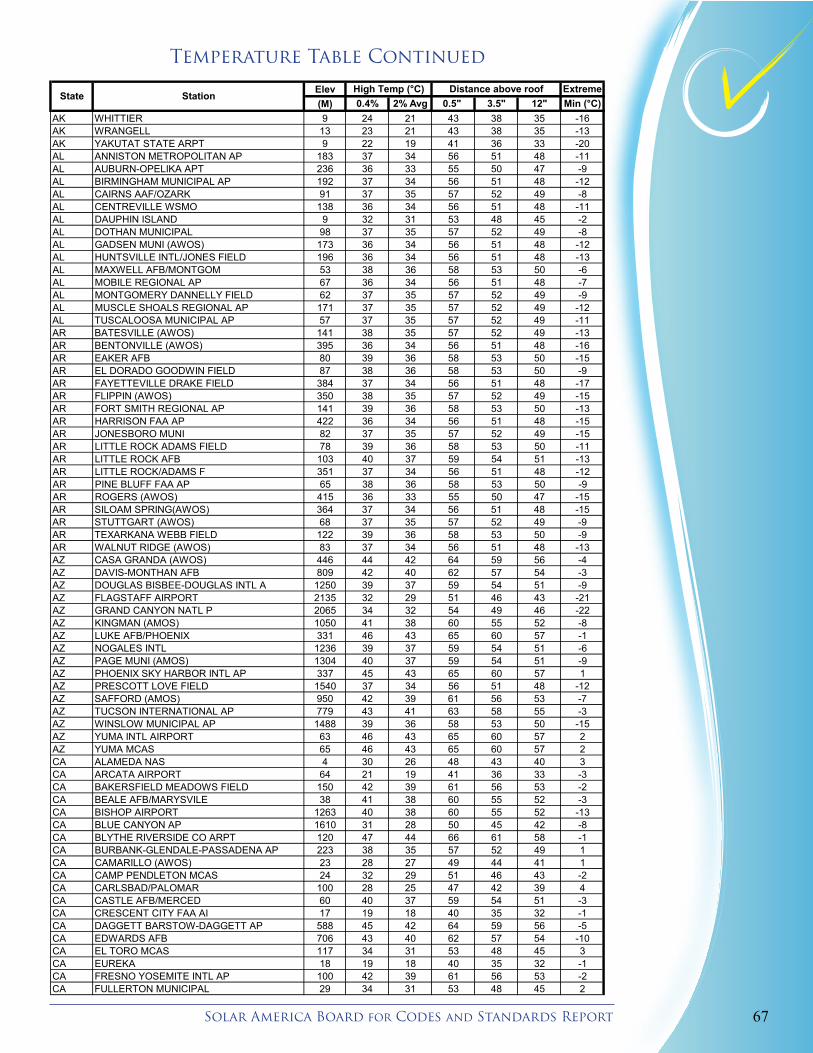
67Solar America Board for Codes and Standards Report
ASHRAE DATA
Elev Extreme(M) 0.4% 2% Avg 0.5" 3.5" 12" Min (°C)
Distance above roofHigh Temp (°C)State Station
AK WHITTIER 9 24 21 43 38 35 -16AK WRANGELL 13 23 21 43 38 35 -13AK YAKUTAT STATE ARPT 9 22 19 41 36 33 -20AL ANNISTON METROPOLITAN AP 183 37 34 56 51 48 -11AL AUBURN-OPELIKA APT 236 36 33 55 50 47 -9AL BIRMINGHAM MUNICIPAL AP 192 37 34 56 51 48 -12AL CAIRNS AAF/OZARK 91 37 35 57 52 49 -8AL CENTREVILLE WSMO 138 36 34 56 51 48 -11AL DAUPHIN ISLAND 9 32 31 53 48 45 -2AL DOTHAN MUNICIPAL 98 37 35 57 52 49 -8AL GADSEN MUNI (AWOS) 173 36 34 56 51 48 -12AL HUNTSVILLE INTL/JONES FIELD 196 36 34 56 51 48 -13AL MAXWELL AFB/MONTGOM 53 38 36 58 53 50 -6AL MOBILE REGIONAL AP 67 36 34 56 51 48 -7AL MONTGOMERY DANNELLY FIELD 62 37 35 57 52 49 -9AL MUSCLE SHOALS REGIONAL AP 171 37 35 57 52 49 -12AL TUSCALOOSA MUNICIPAL AP 57 37 35 57 52 49 -11AR BATESVILLE (AWOS) 141 38 35 57 52 49 -13AR BENTONVILLE (AWOS) 395 36 34 56 51 48 -16AR EAKER AFB 80 39 36 58 53 50 -15AR EL DORADO GOODWIN FIELD 87 38 36 58 53 50 -9AR FAYETTEVILLE DRAKE FIELD 384 37 34 56 51 48 -17AR FLIPPIN (AWOS) 350 38 35 57 52 49 -15AR FORT SMITH REGIONAL AP 141 39 36 58 53 50 -13AR HARRISON FAA AP 422 36 34 56 51 48 -15AR JONESBORO MUNI 82 37 35 57 52 49 -15AR LITTLE ROCK ADAMS FIELD 78 39 36 58 53 50 -11AR LITTLE ROCK AFB 103 40 37 59 54 51 -13AR LITTLE ROCK/ADAMS F 351 37 34 56 51 48 -12AR PINE BLUFF FAA AP 65 38 36 58 53 50 -9AR ROGERS (AWOS) 415 36 33 55 50 47 -15AR SILOAM SPRING(AWOS) 364 37 34 56 51 48 -15AR STUTTGART (AWOS) 68 37 35 57 52 49 -9AR TEXARKANA WEBB FIELD 122 39 36 58 53 50 -9AR WALNUT RIDGE (AWOS) 83 37 34 56 51 48 -13AZ CASA GRANDA (AWOS) 446 44 42 64 59 56 -4AZ DAVIS-MONTHAN AFB 809 42 40 62 57 54 -3AZ DOUGLAS BISBEE-DOUGLAS INTL A 1250 39 37 59 54 51 -9AZ FLAGSTAFF AIRPORT 2135 32 29 51 46 43 -21AZ GRAND CANYON NATL P 2065 34 32 54 49 46 -22AZ KINGMAN (AMOS) 1050 41 38 60 55 52 -8AZ LUKE AFB/PHOENIX 331 46 43 65 60 57 -1AZ NOGALES INTL 1236 39 37 59 54 51 -6AZ PAGE MUNI (AMOS) 1304 40 37 59 54 51 -9AZ PHOENIX SKY HARBOR INTL AP 337 45 43 65 60 57 1AZ PRESCOTT LOVE FIELD 1540 37 34 56 51 48 -12AZ SAFFORD (AMOS) 950 42 39 61 56 53 -7AZ TUCSON INTERNATIONAL AP 779 43 41 63 58 55 -3AZ WINSLOW MUNICIPAL AP 1488 39 36 58 53 50 -15AZ YUMA INTL AIRPORT 63 46 43 65 60 57 2AZ YUMA MCAS 65 46 43 65 60 57 2CA ALAMEDA NAS 4 30 26 48 43 40 3CA ARCATA AIRPORT 64 21 19 41 36 33 -3CA BAKERSFIELD MEADOWS FIELD 150 42 39 61 56 53 -2CA BEALE AFB/MARYSVILE 38 41 38 60 55 52 -3CA BISHOP AIRPORT 1263 40 38 60 55 52 -13CA BLUE CANYON AP 1610 31 28 50 45 42 -8CA BLYTHE RIVERSIDE CO ARPT 120 47 44 66 61 58 -1CA BURBANK-GLENDALE-PASSADENA AP 223 38 35 57 52 49 1CA CAMARILLO (AWOS) 23 28 27 49 44 41 1CA CAMP PENDLETON MCAS 24 32 29 51 46 43 -2CA CARLSBAD/PALOMAR 100 28 25 47 42 39 4CA CASTLE AFB/MERCED 60 40 37 59 54 51 -3CA CRESCENT CITY FAA AI 17 19 18 40 35 32 -1CA DAGGETT BARSTOW-DAGGETT AP 588 45 42 64 59 56 -5CA EDWARDS AFB 706 43 40 62 57 54 -10CA EL TORO MCAS 117 34 31 53 48 45 3CA EUREKA 18 19 18 40 35 32 -1CA FRESNO YOSEMITE INTL AP 100 42 39 61 56 53 -2CA FULLERTON MUNICIPAL 29 34 31 53 48 45 2
Temperature Table Continued

Expedited Permit Process for PV Systems 68
ASHRAE DATA
Elev Extreme(M) 0.4% 2% Avg 0.5" 3.5" 12" Min (°C)
Distance above roofHigh Temp (°C)State Station
CA GEORGE AFB 876 42 38 60 55 52 -6CA HAYWARD AIR TERM 14 33 28 50 45 42 1CA IMPERIAL -17 46 44 66 61 58 -1CA JACK NORTHROP FLD H 21 31 26 48 43 40 4CA LANCASTER GEN WM FOX FIELD 713 42 38 60 55 52 -9CA LEMOORE REEVES NAS 71 41 39 61 56 53 -3CA LIVERMORE MUNICIPAL 121 41 36 58 53 50 -3CA LOMPOC (AWOS) 27 26 23 45 40 37 -2CA LONG BEACH DAUGHERTY FLD 12 33 30 52 47 44 2CA LOS ANGELES INTL ARPT 99 28 26 48 43 40 4CA MARCH AFB/RIVERSIDE 462 40 37 59 54 51 -2CA MCCLELLAN AFB 25 41 38 60 55 52 -3CA MODESTO CITY-COUNTY AP 30 42 38 60 55 52 -2CA MONTAGUE SISKIYOU COUNTY AP 805 38 34 56 51 48 N/ACA MONTEREY PENINSULA 50 24 22 44 39 36 1CA MOUNT SHASTA 1078 35 31 53 48 45 -12CA MOUNTAIN VIEW MOFFETT FLD NAS 10 33 29 51 46 43 0CA NAPA CO. AIRPORT 17 35 31 53 48 45 -4CA NORTON AFB/SAN BERN 353 41 38 60 55 52 -2CA OAKLAND METROPOLITAN ARPT 27 29 25 47 42 39 1CA ONTARIO 304 39 37 59 54 51 -1CA PALM SPRINGS INTL 145 47 44 66 61 58 3CA PALM SPRINGS THERMAL AP -36 47 44 66 61 58 -5CA PASO ROBLES MUNICIPAL ARPT 249 42 38 60 55 52 -6CA POINT ARENA 19 17 15 37 32 29 2CA POINT ARGUELLO 34 21 18 40 35 32 5CA POINT MUGU NF 4 26 24 46 41 38 2CA PORTERVILLE (AWOS) 135 41 38 60 55 52 -2CA PT.PIEDRAS BLANCA 21 21 20 42 37 34 3CA RED BLUFF MUNICIPAL ARPT 108 44 40 62 57 54 -4CA REDDING MUNICIPAL ARPT 153 44 40 62 57 54 -4CA RIVERSIDE MUNI 256 39 36 58 53 50 -1CA SACRAMENTO EXECUTIVE ARPT 8 41 37 59 54 51 -3CA SACRAMENTO MATHER AIRPORT 29 42 38 60 55 52 -3CA SACRAMENTO METROPOLITAN AP 10 41 37 59 54 51 -3CA SALINAS MUNICIPAL AP 24 29 25 47 42 39 -1CA SAN DIEGO LINDBERGH FIELD 9 29 26 48 43 40 5CA SAN DIEGO MIRAMAR NAS 146 32 30 52 47 44 1CA SAN DIEGO NORTH ISLAND NAS 8 28 25 47 42 39 4CA SAN DIEGO/BROWN FLD 159 31 28 50 45 42 2CA SAN DIEGO/MONTGOMER 129 32 28 50 45 42 3CA SAN FRANCISCO INTL AP 6 29 25 47 42 39 2CA SAN JOSE INTL AP 15 36 32 54 49 46 0CA SAN LUIS CO RGNL 66 32 28 50 45 42 -2CA SANDBERG 1379 35 32 54 49 46 -5CA SANTA BARBARA MUNICIPAL AP 6 29 26 48 43 40 -1CA SANTA MARIA PUBLIC ARPT 73 29 25 47 42 39 -3CA SANTA ROSA (AWOS) 45 38 34 56 51 48 -3CA STOCKTON METROPOLITAN ARPT 8 41 38 60 55 52 -3CA TRAVIS AFB/FAIRFLD 18 40 36 58 53 50 -3CA TRUCKEE-TAHOE 1798 34 30 52 47 44 N/ACA TUSTIN MCAF 17 34 31 53 48 45 2CA UKIAH MUNICIPAL AP 191 41 37 59 54 51 -3CA VISALIA MUNI (AWOS) 89 39 37 59 54 51 -3CO AKRON WASHINGTON CO AP 1409 38 34 56 51 48 -23CO ALAMOSA SAN LUIS VALLEY RGNL 2299 32 29 51 46 43 -30CO ASPEN PITKIN CO SAR 2444 32 28 50 45 42 -24CO BUCKLEY ANGB/DENVER 1726 36 33 55 50 47 -22CO COLORADO SPRINGS MUNI AP 1881 35 32 54 49 46 -23CO CORTEZ/MONTEZUMA CO 1803 37 34 56 51 48 -19CO CRAIG-MOFFAT 1915 35 31 53 48 45 -31CO DENVER INTL AP 1655 37 34 56 51 48 -23CO DENVER STAPLETON INT'L ARPT 1611 36 34 56 51 48 -25CO DENVER/CENTENNIAL 1793 36 33 55 50 47 -23CO DURANGO/LA PLATA CO 2038 34 32 54 49 46 -21CO EAGLE COUNTY AP 1992 33 30 52 47 44 -28CO FORT COLLINS (AWOS) 1529 38 34 56 51 48 -23CO FORT COLLINS(SAWRS) 1525 34 32 54 49 46 -23CO GRAND JUNCTION WALKER FIELD 1475 39 36 58 53 50 -17CO GREELEY/WELD (AWOS) 1420 38 35 57 52 49 -27
Temperature Table Continued
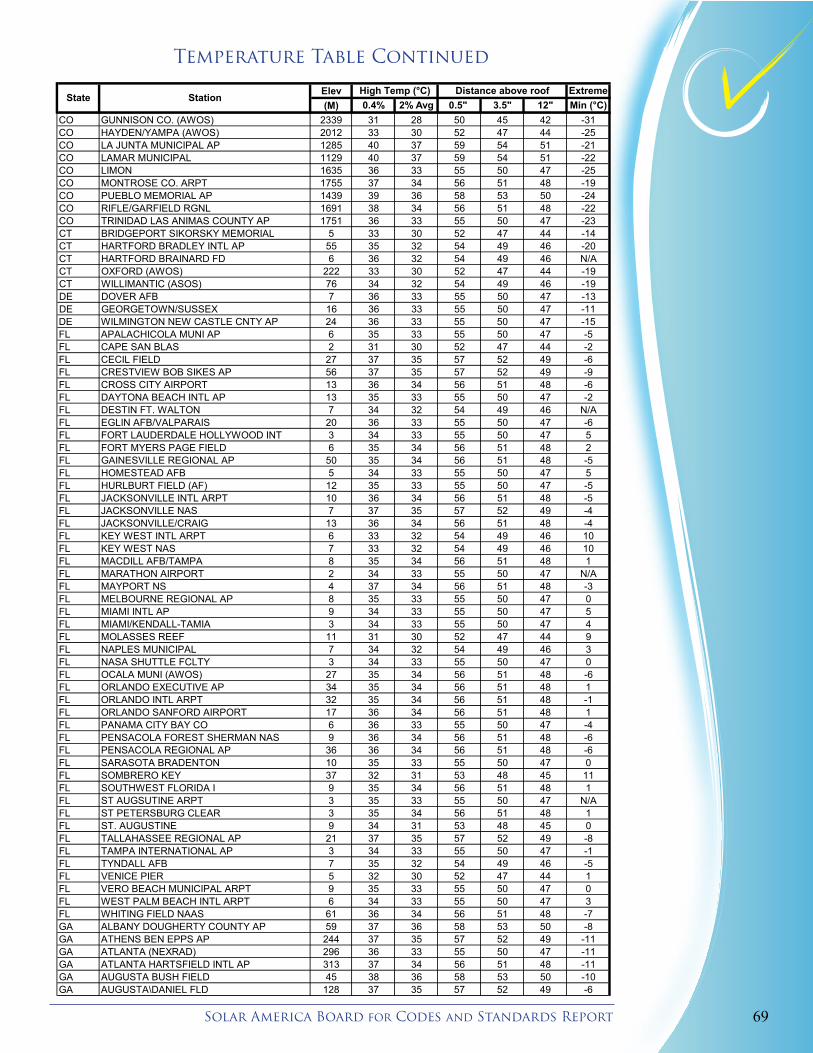
69Solar America Board for Codes and Standards Report
ASHRAE DATA
Elev Extreme(M) 0.4% 2% Avg 0.5" 3.5" 12" Min (°C)
Distance above roofHigh Temp (°C)State Station
CO GUNNISON CO. (AWOS) 2339 31 28 50 45 42 -31CO HAYDEN/YAMPA (AWOS) 2012 33 30 52 47 44 -25CO LA JUNTA MUNICIPAL AP 1285 40 37 59 54 51 -21CO LAMAR MUNICIPAL 1129 40 37 59 54 51 -22CO LIMON 1635 36 33 55 50 47 -25CO MONTROSE CO. ARPT 1755 37 34 56 51 48 -19CO PUEBLO MEMORIAL AP 1439 39 36 58 53 50 -24CO RIFLE/GARFIELD RGNL 1691 38 34 56 51 48 -22CO TRINIDAD LAS ANIMAS COUNTY AP 1751 36 33 55 50 47 -23CT BRIDGEPORT SIKORSKY MEMORIAL 5 33 30 52 47 44 -14CT HARTFORD BRADLEY INTL AP 55 35 32 54 49 46 -20CT HARTFORD BRAINARD FD 6 36 32 54 49 46 N/ACT OXFORD (AWOS) 222 33 30 52 47 44 -19CT WILLIMANTIC (ASOS) 76 34 32 54 49 46 -19DE DOVER AFB 7 36 33 55 50 47 -13DE GEORGETOWN/SUSSEX 16 36 33 55 50 47 -11DE WILMINGTON NEW CASTLE CNTY AP 24 36 33 55 50 47 -15FL APALACHICOLA MUNI AP 6 35 33 55 50 47 -5FL CAPE SAN BLAS 2 31 30 52 47 44 -2FL CECIL FIELD 27 37 35 57 52 49 -6FL CRESTVIEW BOB SIKES AP 56 37 35 57 52 49 -9FL CROSS CITY AIRPORT 13 36 34 56 51 48 -6FL DAYTONA BEACH INTL AP 13 35 33 55 50 47 -2FL DESTIN FT. WALTON 7 34 32 54 49 46 N/AFL EGLIN AFB/VALPARAIS 20 36 33 55 50 47 -6FL FORT LAUDERDALE HOLLYWOOD INT 3 34 33 55 50 47 5FL FORT MYERS PAGE FIELD 6 35 34 56 51 48 2FL GAINESVILLE REGIONAL AP 50 35 34 56 51 48 -5FL HOMESTEAD AFB 5 34 33 55 50 47 5FL HURLBURT FIELD (AF) 12 35 33 55 50 47 -5FL JACKSONVILLE INTL ARPT 10 36 34 56 51 48 -5FL JACKSONVILLE NAS 7 37 35 57 52 49 -4FL JACKSONVILLE/CRAIG 13 36 34 56 51 48 -4FL KEY WEST INTL ARPT 6 33 32 54 49 46 10FL KEY WEST NAS 7 33 32 54 49 46 10FL MACDILL AFB/TAMPA 8 35 34 56 51 48 1FL MARATHON AIRPORT 2 34 33 55 50 47 N/AFL MAYPORT NS 4 37 34 56 51 48 -3FL MELBOURNE REGIONAL AP 8 35 33 55 50 47 0FL MIAMI INTL AP 9 34 33 55 50 47 5FL MIAMI/KENDALL-TAMIA 3 34 33 55 50 47 4FL MOLASSES REEF 11 31 30 52 47 44 9FL NAPLES MUNICIPAL 7 34 32 54 49 46 3FL NASA SHUTTLE FCLTY 3 34 33 55 50 47 0FL OCALA MUNI (AWOS) 27 35 34 56 51 48 -6FL ORLANDO EXECUTIVE AP 34 35 34 56 51 48 1FL ORLANDO INTL ARPT 32 35 34 56 51 48 -1FL ORLANDO SANFORD AIRPORT 17 36 34 56 51 48 1FL PANAMA CITY BAY CO 6 36 33 55 50 47 -4FL PENSACOLA FOREST SHERMAN NAS 9 36 34 56 51 48 -6FL PENSACOLA REGIONAL AP 36 36 34 56 51 48 -6FL SARASOTA BRADENTON 10 35 33 55 50 47 0FL SOMBRERO KEY 37 32 31 53 48 45 11FL SOUTHWEST FLORIDA I 9 35 34 56 51 48 1FL ST AUGSUTINE ARPT 3 35 33 55 50 47 N/AFL ST PETERSBURG CLEAR 3 35 34 56 51 48 1FL ST. AUGUSTINE 9 34 31 53 48 45 0FL TALLAHASSEE REGIONAL AP 21 37 35 57 52 49 -8FL TAMPA INTERNATIONAL AP 3 34 33 55 50 47 -1FL TYNDALL AFB 7 35 32 54 49 46 -5FL VENICE PIER 5 32 30 52 47 44 1FL VERO BEACH MUNICIPAL ARPT 9 35 33 55 50 47 0FL WEST PALM BEACH INTL ARPT 6 34 33 55 50 47 3FL WHITING FIELD NAAS 61 36 34 56 51 48 -7GA ALBANY DOUGHERTY COUNTY AP 59 37 36 58 53 50 -8GA ATHENS BEN EPPS AP 244 37 35 57 52 49 -11GA ATLANTA (NEXRAD) 296 36 33 55 50 47 -11GA ATLANTA HARTSFIELD INTL AP 313 37 34 56 51 48 -11GA AUGUSTA BUSH FIELD 45 38 36 58 53 50 -10GA AUGUSTA\DANIEL FLD 128 37 35 57 52 49 -6
Temperature Table Continued
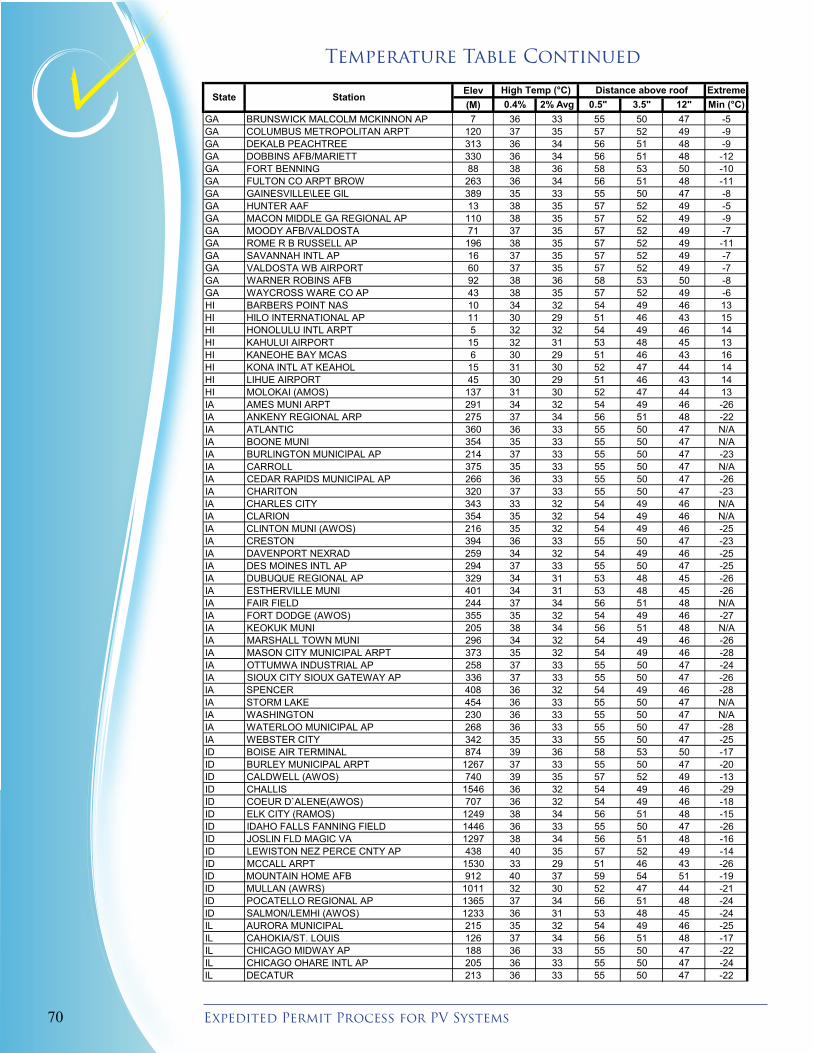
Expedited Permit Process for PV Systems 70
ASHRAE DATA
Elev Extreme(M) 0.4% 2% Avg 0.5" 3.5" 12" Min (°C)
Distance above roofHigh Temp (°C)State Station
GA BRUNSWICK MALCOLM MCKINNON AP 7 36 33 55 50 47 -5GA COLUMBUS METROPOLITAN ARPT 120 37 35 57 52 49 -9GA DEKALB PEACHTREE 313 36 34 56 51 48 -9GA DOBBINS AFB/MARIETT 330 36 34 56 51 48 -12GA FORT BENNING 88 38 36 58 53 50 -10GA FULTON CO ARPT BROW 263 36 34 56 51 48 -11GA GAINESVILLE\LEE GIL 389 35 33 55 50 47 -8GA HUNTER AAF 13 38 35 57 52 49 -5GA MACON MIDDLE GA REGIONAL AP 110 38 35 57 52 49 -9GA MOODY AFB/VALDOSTA 71 37 35 57 52 49 -7GA ROME R B RUSSELL AP 196 38 35 57 52 49 -11GA SAVANNAH INTL AP 16 37 35 57 52 49 -7GA VALDOSTA WB AIRPORT 60 37 35 57 52 49 -7GA WARNER ROBINS AFB 92 38 36 58 53 50 -8GA WAYCROSS WARE CO AP 43 38 35 57 52 49 -6HI BARBERS POINT NAS 10 34 32 54 49 46 13HI HILO INTERNATIONAL AP 11 30 29 51 46 43 15HI HONOLULU INTL ARPT 5 32 32 54 49 46 14HI KAHULUI AIRPORT 15 32 31 53 48 45 13HI KANEOHE BAY MCAS 6 30 29 51 46 43 16HI KONA INTL AT KEAHOL 15 31 30 52 47 44 14HI LIHUE AIRPORT 45 30 29 51 46 43 14HI MOLOKAI (AMOS) 137 31 30 52 47 44 13IA AMES MUNI ARPT 291 34 32 54 49 46 -26IA ANKENY REGIONAL ARP 275 37 34 56 51 48 -22IA ATLANTIC 360 36 33 55 50 47 N/AIA BOONE MUNI 354 35 33 55 50 47 N/AIA BURLINGTON MUNICIPAL AP 214 37 33 55 50 47 -23IA CARROLL 375 35 33 55 50 47 N/AIA CEDAR RAPIDS MUNICIPAL AP 266 36 33 55 50 47 -26IA CHARITON 320 37 33 55 50 47 -23IA CHARLES CITY 343 33 32 54 49 46 N/AIA CLARION 354 35 32 54 49 46 N/AIA CLINTON MUNI (AWOS) 216 35 32 54 49 46 -25IA CRESTON 394 36 33 55 50 47 -23IA DAVENPORT NEXRAD 259 34 32 54 49 46 -25IA DES MOINES INTL AP 294 37 33 55 50 47 -25IA DUBUQUE REGIONAL AP 329 34 31 53 48 45 -26IA ESTHERVILLE MUNI 401 34 31 53 48 45 -26IA FAIR FIELD 244 37 34 56 51 48 N/AIA FORT DODGE (AWOS) 355 35 32 54 49 46 -27IA KEOKUK MUNI 205 38 34 56 51 48 N/AIA MARSHALL TOWN MUNI 296 34 32 54 49 46 -26IA MASON CITY MUNICIPAL ARPT 373 35 32 54 49 46 -28IA OTTUMWA INDUSTRIAL AP 258 37 33 55 50 47 -24IA SIOUX CITY SIOUX GATEWAY AP 336 37 33 55 50 47 -26IA SPENCER 408 36 32 54 49 46 -28IA STORM LAKE 454 36 33 55 50 47 N/AIA WASHINGTON 230 36 33 55 50 47 N/AIA WATERLOO MUNICIPAL AP 268 36 33 55 50 47 -28IA WEBSTER CITY 342 35 33 55 50 47 -25ID BOISE AIR TERMINAL 874 39 36 58 53 50 -17ID BURLEY MUNICIPAL ARPT 1267 37 33 55 50 47 -20ID CALDWELL (AWOS) 740 39 35 57 52 49 -13ID CHALLIS 1546 36 32 54 49 46 -29ID COEUR D`ALENE(AWOS) 707 36 32 54 49 46 -18ID ELK CITY (RAMOS) 1249 38 34 56 51 48 -15ID IDAHO FALLS FANNING FIELD 1446 36 33 55 50 47 -26ID JOSLIN FLD MAGIC VA 1297 38 34 56 51 48 -16ID LEWISTON NEZ PERCE CNTY AP 438 40 35 57 52 49 -14ID MCCALL ARPT 1530 33 29 51 46 43 -26ID MOUNTAIN HOME AFB 912 40 37 59 54 51 -19ID MULLAN (AWRS) 1011 32 30 52 47 44 -21ID POCATELLO REGIONAL AP 1365 37 34 56 51 48 -24ID SALMON/LEMHI (AWOS) 1233 36 31 53 48 45 -24IL AURORA MUNICIPAL 215 35 32 54 49 46 -25IL CAHOKIA/ST. LOUIS 126 37 34 56 51 48 -17IL CHICAGO MIDWAY AP 188 36 33 55 50 47 -22IL CHICAGO OHARE INTL AP 205 36 33 55 50 47 -24IL DECATUR 213 36 33 55 50 47 -22
Temperature Table Continued

71Solar America Board for Codes and Standards Report
ASHRAE DATA
Elev Extreme(M) 0.4% 2% Avg 0.5" 3.5" 12" Min (°C)
Distance above roofHigh Temp (°C)State Station
IL GLENVIEW NAS 199 36 33 55 50 47 -24IL LAWRENCEVILLE\VIN. 131 36 33 55 50 47 -18IL MARSEILLES ISLAND 225 36 33 55 50 47 -25IL MATTOON/CHARLESTON 220 35 32 54 49 46 -20IL MOLINE QUAD CITY INTL AP 181 37 34 56 51 48 -25IL MOUNT VERNON (AWOS) 146 36 34 56 51 48 -21IL PEORIA GREATER PEORIA AP 202 36 33 55 50 47 -23IL QUINCY MUNI BALDWIN FLD 234 37 33 55 50 47 -23IL ROCKFORD GREATER ROCKFORD AP 227 35 33 55 50 47 -26IL SCOTT AFB/BELLEVILL 135 37 35 57 52 49 -19IL SOUTHERN ILLINOIS 128 36 34 56 51 48 -17IL SPRINGFIELD CAPITAL AP 187 36 33 55 50 47 -23IL STERLING ROCKFALLS 197 35 32 54 49 46 -25IL UNIV OF ILLINOIS WI 236 36 33 55 50 47 -23IL W. CHICAGO/DU PAGE 231 35 32 54 49 46 -24IN EVANSVILLE REGIONAL AP 118 36 34 56 51 48 -19IN FORT WAYNE INTL AP 252 35 32 54 49 46 -23IN GRISSOM ARB 253 36 33 55 50 47 -23IN HUNTINGBURG 161 35 33 55 50 47 N/AIN INDIANAPOLIS INTL AP 246 35 32 54 49 46 -22IN LAFAYETTE PURDUE UNIV AP 194 36 33 55 50 47 -23IN MONROE CO 264 34 32 54 49 46 -21IN SOUTH BEND MICHIANA RGNL AP 236 36 32 54 49 46 -22IN TERRE HAUTE/HULMAN 175 36 33 55 50 47 -23KS CHANUTE MARTIN JOHNSON AP 308 38 35 57 52 49 -19KS COFFEYVILLE MUNI 230 38 36 58 53 50 -17KS CONCORDIA BLOSSER MUNI AP 452 40 37 59 54 51 -21KS DODGE CITY REGIONAL AP 790 40 37 59 54 51 -20KS ELKHART (AWOS) 1099 39 37 59 54 51 N/AKS FT RILEY/MARSHALL A 324 40 37 59 54 51 -20KS GARDEN CITY MUNICIPAL AP 878 39 37 59 54 51 -22KS GOODLAND RENNER FIELD 1124 39 36 58 53 50 -23KS GREAT BEND (AWOS) 575 41 37 59 54 51 -19KS HAYS MUNI (AWOS) 609 41 38 60 55 52 -20KS HILL CITY MUNICIPAL AP 677 42 38 60 55 52 -21KS LAWRENCE MUNI ARPT 254 39 36 58 53 50 -21KS LIBERAL MUNI 901 39 37 59 54 51 -18KS MANHATTAN RGNL 330 40 37 59 54 51 -22KS MCCONNELL AFB 414 40 37 59 54 51 -17KS MEDICINE LODGE ASOS 469 41 38 60 55 52 -17KS NEWTON (AWOS) 467 40 36 58 53 50 -17KS OLATHE/JOHNSON CO. 334 37 35 57 52 49 -20KS PARSONS\TRI CITY 274 38 36 58 53 50 -19KS RUSSELL MUNICIPAL AP 568 41 37 59 54 51 -21KS SALINA MUNICIPAL AP 391 41 38 60 55 52 -20KS TOPEKA FORBES FIELD 329 38 35 57 52 49 -20KS TOPEKA MUNICIPAL AP 270 38 35 57 52 49 -21KS WICHITA MID-CONTINENT AP 408 41 37 59 54 51 -18KS WICHITA/COL. JABARA 433 41 36 58 53 50 -17KS WINFIELD\ARK CITY 353 40 37 59 54 51 -17KY BOWLING GREEN WARREN CO AP 164 36 33 55 50 47 -17KY CAPITAL CITY ARPT 245 35 32 54 49 46 -17KY CINCINNATI NORTHERN KY AP 269 36 32 54 49 46 -21KY FORT CAMPBELL (AAF) 173 37 34 56 51 48 -16KY FORT KNOX/GODMAN 239 37 33 55 50 47 -18KY HENDERSON CITY 117 35 33 55 50 47 -19KY JACKSON JULIAN CARROLL AP 414 34 31 53 48 45 -18KY LEXINGTON BLUEGRASS AP 301 35 33 55 50 47 -19KY LONDON-CORBIN AP 369 34 32 54 49 46 -18KY LOUISVILLE BOWMAN FIELD 170 37 34 56 51 48 -18KY LOUISVILLE STANDIFORD FIELD 149 36 34 56 51 48 -17KY PADUCAH BARKLEY REGIONAL AP 126 36 34 56 51 48 -17KY SOMERSET(AWOS) 283 37 34 56 51 48 -13LA ALEXANDRIA ESLER REGIONAL AP 36 38 35 57 52 49 -7LA ALEXANDRIA INTERNATIONAL 27 37 35 57 52 49 -7LA BARKSDALE AFB 54 38 35 57 52 49 -9LA BATON ROUGE RYAN ARPT 23 35 34 56 51 48 -6LA FORT POLK (ARMY) 102 37 35 57 52 49 -6LA GRAND ISLE 10 32 31 53 48 45 0LA LAFAYETTE REGIONAL AP 13 35 34 56 51 48 -6
Temperature Table Continued
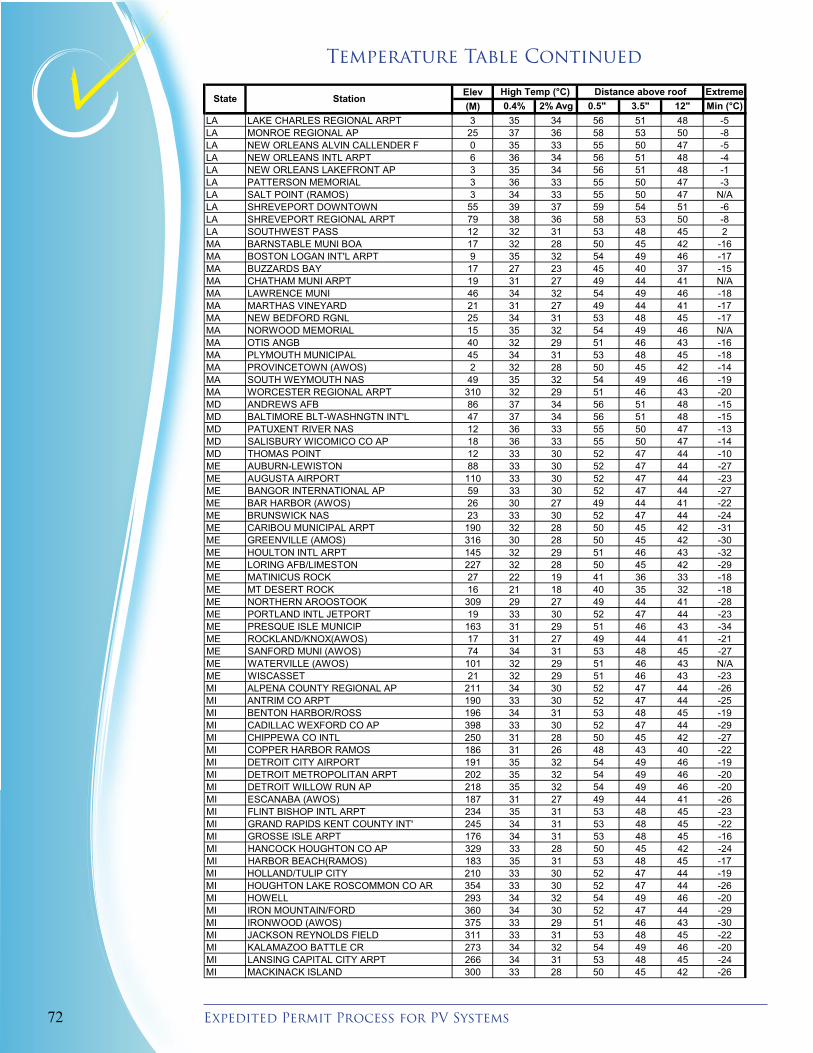
Expedited Permit Process for PV Systems 72
ASHRAE DATA
Elev Extreme(M) 0.4% 2% Avg 0.5" 3.5" 12" Min (°C)
Distance above roofHigh Temp (°C)State Station
LA LAKE CHARLES REGIONAL ARPT 3 35 34 56 51 48 -5LA MONROE REGIONAL AP 25 37 36 58 53 50 -8LA NEW ORLEANS ALVIN CALLENDER F 0 35 33 55 50 47 -5LA NEW ORLEANS INTL ARPT 6 36 34 56 51 48 -4LA NEW ORLEANS LAKEFRONT AP 3 35 34 56 51 48 -1LA PATTERSON MEMORIAL 3 36 33 55 50 47 -3LA SALT POINT (RAMOS) 3 34 33 55 50 47 N/ALA SHREVEPORT DOWNTOWN 55 39 37 59 54 51 -6LA SHREVEPORT REGIONAL ARPT 79 38 36 58 53 50 -8LA SOUTHWEST PASS 12 32 31 53 48 45 2MA BARNSTABLE MUNI BOA 17 32 28 50 45 42 -16MA BOSTON LOGAN INT'L ARPT 9 35 32 54 49 46 -17MA BUZZARDS BAY 17 27 23 45 40 37 -15MA CHATHAM MUNI ARPT 19 31 27 49 44 41 N/AMA LAWRENCE MUNI 46 34 32 54 49 46 -18MA MARTHAS VINEYARD 21 31 27 49 44 41 -17MA NEW BEDFORD RGNL 25 34 31 53 48 45 -17MA NORWOOD MEMORIAL 15 35 32 54 49 46 N/AMA OTIS ANGB 40 32 29 51 46 43 -16MA PLYMOUTH MUNICIPAL 45 34 31 53 48 45 -18MA PROVINCETOWN (AWOS) 2 32 28 50 45 42 -14MA SOUTH WEYMOUTH NAS 49 35 32 54 49 46 -19MA WORCESTER REGIONAL ARPT 310 32 29 51 46 43 -20MD ANDREWS AFB 86 37 34 56 51 48 -15MD BALTIMORE BLT-WASHNGTN INT'L 47 37 34 56 51 48 -15MD PATUXENT RIVER NAS 12 36 33 55 50 47 -13MD SALISBURY WICOMICO CO AP 18 36 33 55 50 47 -14MD THOMAS POINT 12 33 30 52 47 44 -10ME AUBURN-LEWISTON 88 33 30 52 47 44 -27ME AUGUSTA AIRPORT 110 33 30 52 47 44 -23ME BANGOR INTERNATIONAL AP 59 33 30 52 47 44 -27ME BAR HARBOR (AWOS) 26 30 27 49 44 41 -22ME BRUNSWICK NAS 23 33 30 52 47 44 -24ME CARIBOU MUNICIPAL ARPT 190 32 28 50 45 42 -31ME GREENVILLE (AMOS) 316 30 28 50 45 42 -30ME HOULTON INTL ARPT 145 32 29 51 46 43 -32ME LORING AFB/LIMESTON 227 32 28 50 45 42 -29ME MATINICUS ROCK 27 22 19 41 36 33 -18ME MT DESERT ROCK 16 21 18 40 35 32 -18ME NORTHERN AROOSTOOK 309 29 27 49 44 41 -28ME PORTLAND INTL JETPORT 19 33 30 52 47 44 -23ME PRESQUE ISLE MUNICIP 163 31 29 51 46 43 -34ME ROCKLAND/KNOX(AWOS) 17 31 27 49 44 41 -21ME SANFORD MUNI (AWOS) 74 34 31 53 48 45 -27ME WATERVILLE (AWOS) 101 32 29 51 46 43 N/AME WISCASSET 21 32 29 51 46 43 -23MI ALPENA COUNTY REGIONAL AP 211 34 30 52 47 44 -26MI ANTRIM CO ARPT 190 33 30 52 47 44 -25MI BENTON HARBOR/ROSS 196 34 31 53 48 45 -19MI CADILLAC WEXFORD CO AP 398 33 30 52 47 44 -29MI CHIPPEWA CO INTL 250 31 28 50 45 42 -27MI COPPER HARBOR RAMOS 186 31 26 48 43 40 -22MI DETROIT CITY AIRPORT 191 35 32 54 49 46 -19MI DETROIT METROPOLITAN ARPT 202 35 32 54 49 46 -20MI DETROIT WILLOW RUN AP 218 35 32 54 49 46 -20MI ESCANABA (AWOS) 187 31 27 49 44 41 -26MI FLINT BISHOP INTL ARPT 234 35 31 53 48 45 -23MI GRAND RAPIDS KENT COUNTY INT' 245 34 31 53 48 45 -22MI GROSSE ISLE ARPT 176 34 31 53 48 45 -16MI HANCOCK HOUGHTON CO AP 329 33 28 50 45 42 -24MI HARBOR BEACH(RAMOS) 183 35 31 53 48 45 -17MI HOLLAND/TULIP CITY 210 33 30 52 47 44 -19MI HOUGHTON LAKE ROSCOMMON CO AR 354 33 30 52 47 44 -26MI HOWELL 293 34 32 54 49 46 -20MI IRON MOUNTAIN/FORD 360 34 30 52 47 44 -29MI IRONWOOD (AWOS) 375 33 29 51 46 43 -30MI JACKSON REYNOLDS FIELD 311 33 31 53 48 45 -22MI KALAMAZOO BATTLE CR 273 34 32 54 49 46 -20MI LANSING CAPITAL CITY ARPT 266 34 31 53 48 45 -24MI MACKINACK ISLAND 300 33 28 50 45 42 -26
Temperature Table Continued

73Solar America Board for Codes and Standards Report
ASHRAE DATA
Elev Extreme(M) 0.4% 2% Avg 0.5" 3.5" 12" Min (°C)
Distance above roofHigh Temp (°C)State Station
MI MANISTEE (AWOS) 189 32 29 51 46 43 -21MI MANISTIQUE (AMOS) 178 28 25 47 42 39 -22MI MARQUETTE COUNTY ARPT 431 33 29 51 46 43 -30MI MENOMINEE (AWOS) 191 33 29 51 46 43 -26MI MUSKEGON COUNTY ARPT 193 32 30 52 47 44 -20MI NEWBERRY LUCE CO. 265 32 28 50 45 42 -26MI OAKLAND CO INTL 306 34 31 53 48 45 -20MI OSCODA WURTSMITH AFB 193 35 31 53 48 45 -22MI PASSAGE ISLAND 209 22 19 41 36 33 -24MI PELLSTON EMMET COUNTY AP 218 33 30 52 47 44 -29MI ROCK OF AGES 223 25 21 43 38 35 -26MI SAGINAW TRI CITY INTL AP 204 35 32 54 49 46 -21MI SAULT STE MARIE SANDERSON FIE 221 32 28 50 45 42 -29MI SELFRIDGE ANGB 177 35 32 54 49 46 -20MI ST.CLAIR COUNTY INT 198 33 32 54 49 46 -22MI STANNARD ROCK 212 26 23 45 40 37 -20MI STURGIS\KIRSH MUNI 282 33 32 54 49 46 -21MI TRAVERSE CITY CHERRY CAPITAL 192 34 31 53 48 45 -23MN AITKIN NDB(AWOS) 367 32 29 51 46 43 -33MN ALBERT LEA (AWOS) 383 34 31 53 48 45 -28MN ALEXANDRIA MUNICIPAL AP 436 35 31 53 48 45 -31MN AUSTIN MUNI 375 34 31 53 48 45 -28MN BAUDETTE INTERNATIONAL AP 330 32 29 51 46 43 -35MN BEMIDJI MUNICIPAL 420 33 30 52 47 44 -34MN BENSON MUNI 317 36 32 54 49 46 -30MN BRAINERD/WIELAND 374 34 30 52 47 44 -33MN CAMBRIDGE MUNI 287 37 32 54 49 46 -31MN CLOQUET (AWOS) 390 33 29 51 46 43 -31MN CRANE LAKE (AWOS) 350 33 29 51 46 43 -34MN CROOKSTON MUNI FLD 273 32 30 52 47 44 -34MN DETROIT LAKES(AWOS) 426 33 30 52 47 44 -32MN DULUTH HARBOR (CGS) 186 33 29 51 46 43 -27MN DULUTH INTERNATIONAL ARPT 432 32 28 50 45 42 -32MN ELY MUNI 455 32 29 51 46 43 -37MN EVELETH MUNI (AWOS) 421 33 29 51 46 43 -35MN FAIRMONT MUNI(AWOS) 354 33 31 53 48 45 -26MN FARIBAULT MUNI AWOS 322 34 31 53 48 45 -29MN FERGUS FALLS(AWOS) 361 35 31 53 48 45 -31MN FLYING CLOUD 283 35 32 54 49 46 -27MN FOSSTON(AWOS) 388 33 30 52 47 44 -35MN GLENWOOD (ASOS) 425 36 31 53 48 45 -30MN GRAND MARAIS MUNI 548 29 26 48 43 40 -30MN GRAND RAPIDS(AWOS) 413 32 28 50 45 42 -32MN HALLOCK 250 33 31 53 48 45 -34MN HIBBING CHISHOLM-HIBBING AP 414 32 29 51 46 43 -36MN HUTCHINSON (AWOS) 323 34 32 54 49 46 -30MN INTERNATIONAL FALLS INTL AP 361 32 29 51 46 43 -37MN LITCHFIELD MUNI 347 34 31 53 48 45 -28MN LITTLE FALLS (AWOS) 342 35 32 54 49 46 -32MN MANKATO(AWOS) 311 33 31 53 48 45 -26MN MARSHALL/RYAN(AWOS) 359 35 32 54 49 46 -27MN MINNEAPOLIS/BLAINE 278 35 32 54 49 46 -26MN MINNEAPOLIS/CRYSTAL 265 36 32 54 49 46 -26MN MINNEAPOLIS-ST PAUL INT'L ARP 255 36 32 54 49 46 -28MN MONTEVIDEO (AWOS) 315 34 32 54 49 46 -28MN MORA MUNI (AWOS) 309 33 31 53 48 45 -31MN MORRIS MUNI (AWOS) 347 33 31 53 48 45 -30MN NEW ULM MUNI (AWOS) 308 34 32 54 49 46 -27MN ORR 397 33 29 51 46 43 -35MN OWATONNA (AWOS) 350 33 31 53 48 45 -28MN PARK RAPIDS MUNICIPAL AP 440 33 30 52 47 44 -34MN PEQUOT LAKE (AMOS) 390 36 31 53 48 45 -35MN PIPESTONE (AWOS) 529 34 31 53 48 45 -28MN PRINCETON MUNI 306 35 31 53 48 45 -29MN RED WING 239 35 32 54 49 46 -28MN REDWOOD FALLS MUNI 314 36 33 55 50 47 -29MN ROCHESTER INTERNATIONAL ARPT 402 33 31 53 48 45 -29MN ROSEAU MUNI (AWOS) 323 33 29 51 46 43 -35MN SILVER BAY 331 32 28 50 45 42 -34MN SOUTH ST PAUL MUNI 250 35 32 54 49 46 -26
Temperature Table Continued
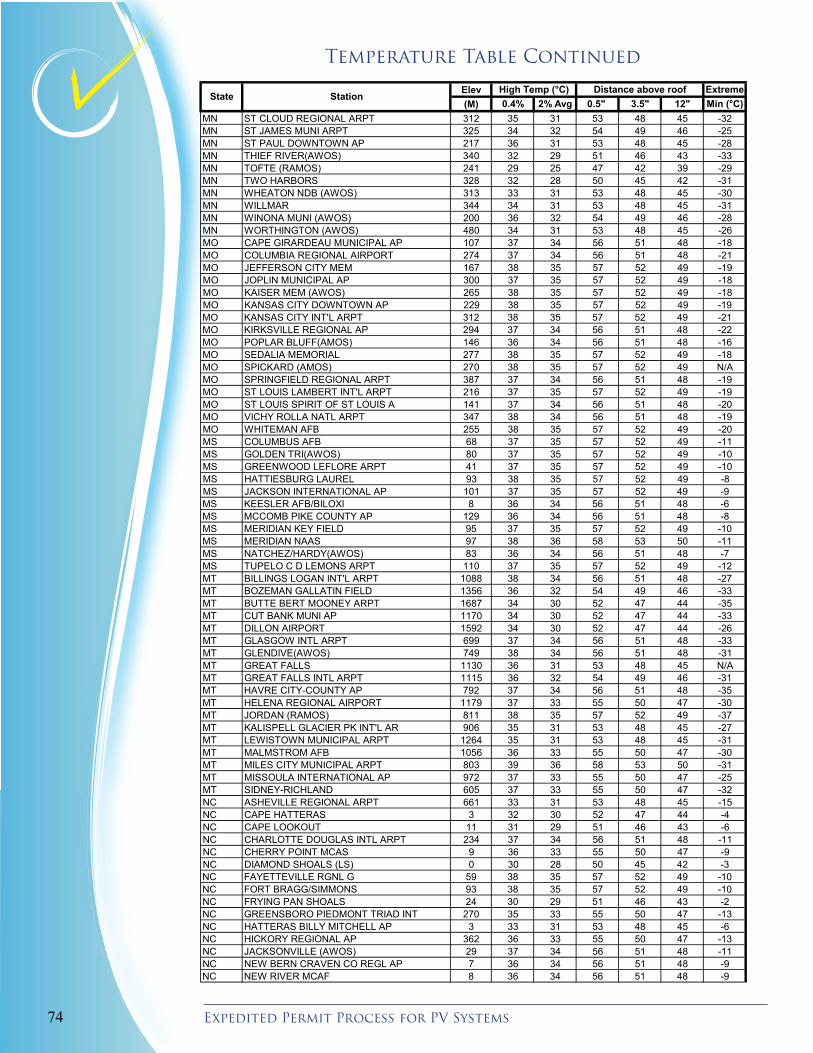
Expedited Permit Process for PV Systems 74
ASHRAE DATA
Elev Extreme(M) 0.4% 2% Avg 0.5" 3.5" 12" Min (°C)
Distance above roofHigh Temp (°C)State Station
MN ST CLOUD REGIONAL ARPT 312 35 31 53 48 45 -32MN ST JAMES MUNI ARPT 325 34 32 54 49 46 -25MN ST PAUL DOWNTOWN AP 217 36 31 53 48 45 -28MN THIEF RIVER(AWOS) 340 32 29 51 46 43 -33MN TOFTE (RAMOS) 241 29 25 47 42 39 -29MN TWO HARBORS 328 32 28 50 45 42 -31MN WHEATON NDB (AWOS) 313 33 31 53 48 45 -30MN WILLMAR 344 34 31 53 48 45 -31MN WINONA MUNI (AWOS) 200 36 32 54 49 46 -28MN WORTHINGTON (AWOS) 480 34 31 53 48 45 -26MO CAPE GIRARDEAU MUNICIPAL AP 107 37 34 56 51 48 -18MO COLUMBIA REGIONAL AIRPORT 274 37 34 56 51 48 -21MO JEFFERSON CITY MEM 167 38 35 57 52 49 -19MO JOPLIN MUNICIPAL AP 300 37 35 57 52 49 -18MO KAISER MEM (AWOS) 265 38 35 57 52 49 -18MO KANSAS CITY DOWNTOWN AP 229 38 35 57 52 49 -19MO KANSAS CITY INT'L ARPT 312 38 35 57 52 49 -21MO KIRKSVILLE REGIONAL AP 294 37 34 56 51 48 -22MO POPLAR BLUFF(AMOS) 146 36 34 56 51 48 -16MO SEDALIA MEMORIAL 277 38 35 57 52 49 -18MO SPICKARD (AMOS) 270 38 35 57 52 49 N/AMO SPRINGFIELD REGIONAL ARPT 387 37 34 56 51 48 -19MO ST LOUIS LAMBERT INT'L ARPT 216 37 35 57 52 49 -19MO ST LOUIS SPIRIT OF ST LOUIS A 141 37 34 56 51 48 -20MO VICHY ROLLA NATL ARPT 347 38 34 56 51 48 -19MO WHITEMAN AFB 255 38 35 57 52 49 -20MS COLUMBUS AFB 68 37 35 57 52 49 -11MS GOLDEN TRI(AWOS) 80 37 35 57 52 49 -10MS GREENWOOD LEFLORE ARPT 41 37 35 57 52 49 -10MS HATTIESBURG LAUREL 93 38 35 57 52 49 -8MS JACKSON INTERNATIONAL AP 101 37 35 57 52 49 -9MS KEESLER AFB/BILOXI 8 36 34 56 51 48 -6MS MCCOMB PIKE COUNTY AP 129 36 34 56 51 48 -8MS MERIDIAN KEY FIELD 95 37 35 57 52 49 -10MS MERIDIAN NAAS 97 38 36 58 53 50 -11MS NATCHEZ/HARDY(AWOS) 83 36 34 56 51 48 -7MS TUPELO C D LEMONS ARPT 110 37 35 57 52 49 -12MT BILLINGS LOGAN INT'L ARPT 1088 38 34 56 51 48 -27MT BOZEMAN GALLATIN FIELD 1356 36 32 54 49 46 -33MT BUTTE BERT MOONEY ARPT 1687 34 30 52 47 44 -35MT CUT BANK MUNI AP 1170 34 30 52 47 44 -33MT DILLON AIRPORT 1592 34 30 52 47 44 -26MT GLASGOW INTL ARPT 699 37 34 56 51 48 -33MT GLENDIVE(AWOS) 749 38 34 56 51 48 -31MT GREAT FALLS 1130 36 31 53 48 45 N/AMT GREAT FALLS INTL ARPT 1115 36 32 54 49 46 -31MT HAVRE CITY-COUNTY AP 792 37 34 56 51 48 -35MT HELENA REGIONAL AIRPORT 1179 37 33 55 50 47 -30MT JORDAN (RAMOS) 811 38 35 57 52 49 -37MT KALISPELL GLACIER PK INT'L AR 906 35 31 53 48 45 -27MT LEWISTOWN MUNICIPAL ARPT 1264 35 31 53 48 45 -31MT MALMSTROM AFB 1056 36 33 55 50 47 -30MT MILES CITY MUNICIPAL ARPT 803 39 36 58 53 50 -31MT MISSOULA INTERNATIONAL AP 972 37 33 55 50 47 -25MT SIDNEY-RICHLAND 605 37 33 55 50 47 -32NC ASHEVILLE REGIONAL ARPT 661 33 31 53 48 45 -15NC CAPE HATTERAS 3 32 30 52 47 44 -4NC CAPE LOOKOUT 11 31 29 51 46 43 -6NC CHARLOTTE DOUGLAS INTL ARPT 234 37 34 56 51 48 -11NC CHERRY POINT MCAS 9 36 33 55 50 47 -9NC DIAMOND SHOALS (LS) 0 30 28 50 45 42 -3NC FAYETTEVILLE RGNL G 59 38 35 57 52 49 -10NC FORT BRAGG/SIMMONS 93 38 35 57 52 49 -10NC FRYING PAN SHOALS 24 30 29 51 46 43 -2NC GREENSBORO PIEDMONT TRIAD INT 270 35 33 55 50 47 -13NC HATTERAS BILLY MITCHELL AP 3 33 31 53 48 45 -6NC HICKORY REGIONAL AP 362 36 33 55 50 47 -13NC JACKSONVILLE (AWOS) 29 37 34 56 51 48 -11NC NEW BERN CRAVEN CO REGL AP 7 36 34 56 51 48 -9NC NEW RIVER MCAF 8 36 34 56 51 48 -9
Temperature Table Continued
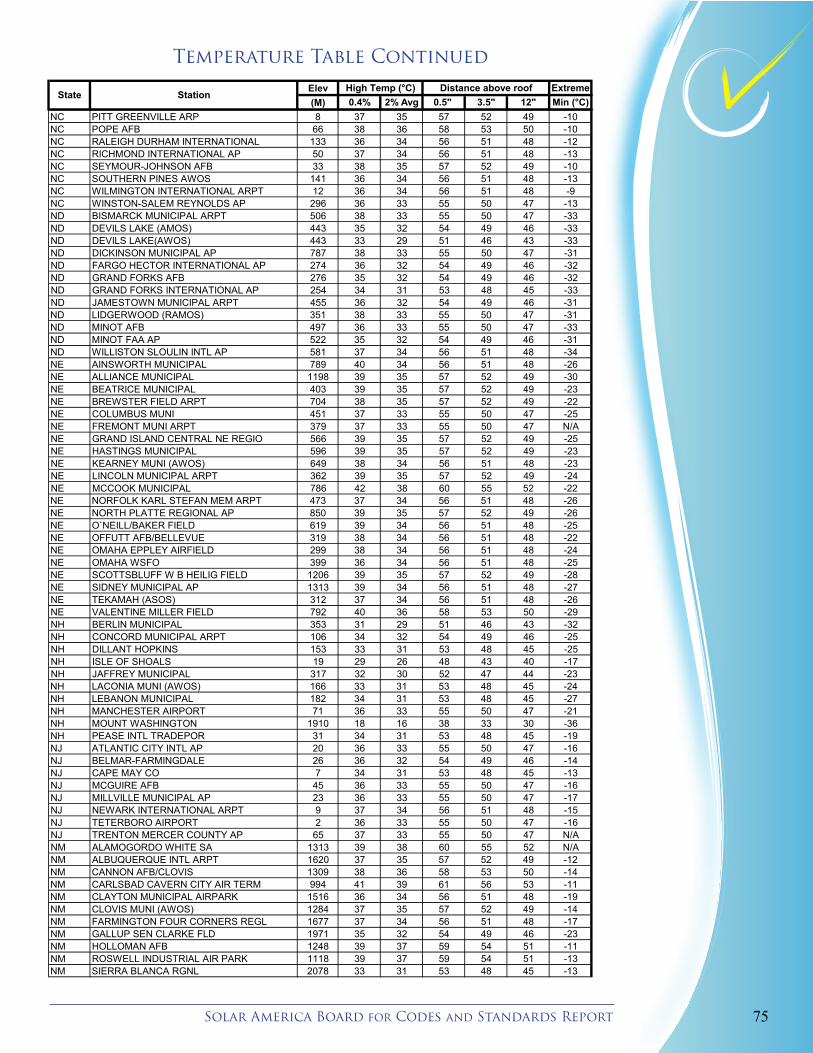
75Solar America Board for Codes and Standards Report
ASHRAE DATA
Elev Extreme(M) 0.4% 2% Avg 0.5" 3.5" 12" Min (°C)
Distance above roofHigh Temp (°C)State Station
NC PITT GREENVILLE ARP 8 37 35 57 52 49 -10NC POPE AFB 66 38 36 58 53 50 -10NC RALEIGH DURHAM INTERNATIONAL 133 36 34 56 51 48 -12NC RICHMOND INTERNATIONAL AP 50 37 34 56 51 48 -13NC SEYMOUR-JOHNSON AFB 33 38 35 57 52 49 -10NC SOUTHERN PINES AWOS 141 36 34 56 51 48 -13NC WILMINGTON INTERNATIONAL ARPT 12 36 34 56 51 48 -9NC WINSTON-SALEM REYNOLDS AP 296 36 33 55 50 47 -13ND BISMARCK MUNICIPAL ARPT 506 38 33 55 50 47 -33ND DEVILS LAKE (AMOS) 443 35 32 54 49 46 -33ND DEVILS LAKE(AWOS) 443 33 29 51 46 43 -33ND DICKINSON MUNICIPAL AP 787 38 33 55 50 47 -31ND FARGO HECTOR INTERNATIONAL AP 274 36 32 54 49 46 -32ND GRAND FORKS AFB 276 35 32 54 49 46 -32ND GRAND FORKS INTERNATIONAL AP 254 34 31 53 48 45 -33ND JAMESTOWN MUNICIPAL ARPT 455 36 32 54 49 46 -31ND LIDGERWOOD (RAMOS) 351 38 33 55 50 47 -31ND MINOT AFB 497 36 33 55 50 47 -33ND MINOT FAA AP 522 35 32 54 49 46 -31ND WILLISTON SLOULIN INTL AP 581 37 34 56 51 48 -34NE AINSWORTH MUNICIPAL 789 40 34 56 51 48 -26NE ALLIANCE MUNICIPAL 1198 39 35 57 52 49 -30NE BEATRICE MUNICIPAL 403 39 35 57 52 49 -23NE BREWSTER FIELD ARPT 704 38 35 57 52 49 -22NE COLUMBUS MUNI 451 37 33 55 50 47 -25NE FREMONT MUNI ARPT 379 37 33 55 50 47 N/ANE GRAND ISLAND CENTRAL NE REGIO 566 39 35 57 52 49 -25NE HASTINGS MUNICIPAL 596 39 35 57 52 49 -23NE KEARNEY MUNI (AWOS) 649 38 34 56 51 48 -23NE LINCOLN MUNICIPAL ARPT 362 39 35 57 52 49 -24NE MCCOOK MUNICIPAL 786 42 38 60 55 52 -22NE NORFOLK KARL STEFAN MEM ARPT 473 37 34 56 51 48 -26NE NORTH PLATTE REGIONAL AP 850 39 35 57 52 49 -26NE O`NEILL/BAKER FIELD 619 39 34 56 51 48 -25NE OFFUTT AFB/BELLEVUE 319 38 34 56 51 48 -22NE OMAHA EPPLEY AIRFIELD 299 38 34 56 51 48 -24NE OMAHA WSFO 399 36 34 56 51 48 -25NE SCOTTSBLUFF W B HEILIG FIELD 1206 39 35 57 52 49 -28NE SIDNEY MUNICIPAL AP 1313 39 34 56 51 48 -27NE TEKAMAH (ASOS) 312 37 34 56 51 48 -26NE VALENTINE MILLER FIELD 792 40 36 58 53 50 -29NH BERLIN MUNICIPAL 353 31 29 51 46 43 -32NH CONCORD MUNICIPAL ARPT 106 34 32 54 49 46 -25NH DILLANT HOPKINS 153 33 31 53 48 45 -25NH ISLE OF SHOALS 19 29 26 48 43 40 -17NH JAFFREY MUNICIPAL 317 32 30 52 47 44 -23NH LACONIA MUNI (AWOS) 166 33 31 53 48 45 -24NH LEBANON MUNICIPAL 182 34 31 53 48 45 -27NH MANCHESTER AIRPORT 71 36 33 55 50 47 -21NH MOUNT WASHINGTON 1910 18 16 38 33 30 -36NH PEASE INTL TRADEPOR 31 34 31 53 48 45 -19NJ ATLANTIC CITY INTL AP 20 36 33 55 50 47 -16NJ BELMAR-FARMINGDALE 26 36 32 54 49 46 -14NJ CAPE MAY CO 7 34 31 53 48 45 -13NJ MCGUIRE AFB 45 36 33 55 50 47 -16NJ MILLVILLE MUNICIPAL AP 23 36 33 55 50 47 -17NJ NEWARK INTERNATIONAL ARPT 9 37 34 56 51 48 -15NJ TETERBORO AIRPORT 2 36 33 55 50 47 -16NJ TRENTON MERCER COUNTY AP 65 37 33 55 50 47 N/ANM ALAMOGORDO WHITE SA 1313 39 38 60 55 52 N/ANM ALBUQUERQUE INTL ARPT 1620 37 35 57 52 49 -12NM CANNON AFB/CLOVIS 1309 38 36 58 53 50 -14NM CARLSBAD CAVERN CITY AIR TERM 994 41 39 61 56 53 -11NM CLAYTON MUNICIPAL AIRPARK 1516 36 34 56 51 48 -19NM CLOVIS MUNI (AWOS) 1284 37 35 57 52 49 -14NM FARMINGTON FOUR CORNERS REGL 1677 37 34 56 51 48 -17NM GALLUP SEN CLARKE FLD 1971 35 32 54 49 46 -23NM HOLLOMAN AFB 1248 39 37 59 54 51 -11NM ROSWELL INDUSTRIAL AIR PARK 1118 39 37 59 54 51 -13NM SIERRA BLANCA RGNL 2078 33 31 53 48 45 -13
Temperature Table Continued
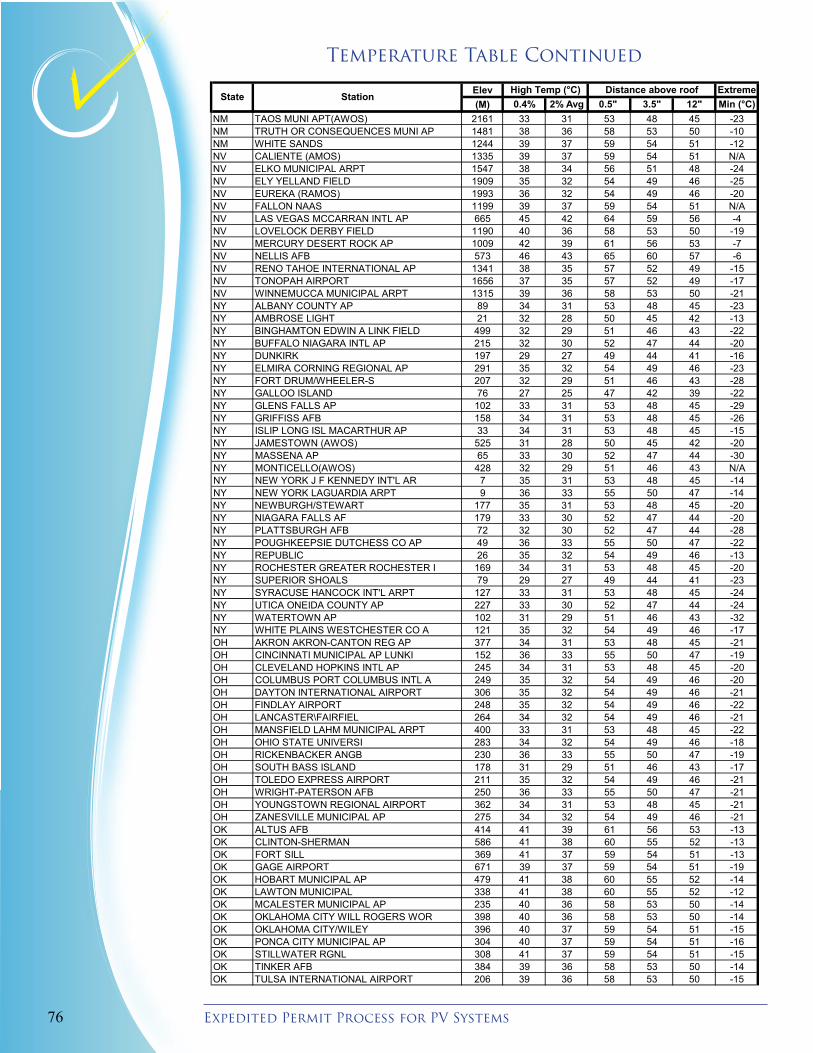
Expedited Permit Process for PV Systems 76
ASHRAE DATA
Elev Extreme(M) 0.4% 2% Avg 0.5" 3.5" 12" Min (°C)
Distance above roofHigh Temp (°C)State Station
NM TAOS MUNI APT(AWOS) 2161 33 31 53 48 45 -23NM TRUTH OR CONSEQUENCES MUNI AP 1481 38 36 58 53 50 -10NM WHITE SANDS 1244 39 37 59 54 51 -12NV CALIENTE (AMOS) 1335 39 37 59 54 51 N/ANV ELKO MUNICIPAL ARPT 1547 38 34 56 51 48 -24NV ELY YELLAND FIELD 1909 35 32 54 49 46 -25NV EUREKA (RAMOS) 1993 36 32 54 49 46 -20NV FALLON NAAS 1199 39 37 59 54 51 N/ANV LAS VEGAS MCCARRAN INTL AP 665 45 42 64 59 56 -4NV LOVELOCK DERBY FIELD 1190 40 36 58 53 50 -19NV MERCURY DESERT ROCK AP 1009 42 39 61 56 53 -7NV NELLIS AFB 573 46 43 65 60 57 -6NV RENO TAHOE INTERNATIONAL AP 1341 38 35 57 52 49 -15NV TONOPAH AIRPORT 1656 37 35 57 52 49 -17NV WINNEMUCCA MUNICIPAL ARPT 1315 39 36 58 53 50 -21NY ALBANY COUNTY AP 89 34 31 53 48 45 -23NY AMBROSE LIGHT 21 32 28 50 45 42 -13NY BINGHAMTON EDWIN A LINK FIELD 499 32 29 51 46 43 -22NY BUFFALO NIAGARA INTL AP 215 32 30 52 47 44 -20NY DUNKIRK 197 29 27 49 44 41 -16NY ELMIRA CORNING REGIONAL AP 291 35 32 54 49 46 -23NY FORT DRUM/WHEELER-S 207 32 29 51 46 43 -28NY GALLOO ISLAND 76 27 25 47 42 39 -22NY GLENS FALLS AP 102 33 31 53 48 45 -29NY GRIFFISS AFB 158 34 31 53 48 45 -26NY ISLIP LONG ISL MACARTHUR AP 33 34 31 53 48 45 -15NY JAMESTOWN (AWOS) 525 31 28 50 45 42 -20NY MASSENA AP 65 33 30 52 47 44 -30NY MONTICELLO(AWOS) 428 32 29 51 46 43 N/ANY NEW YORK J F KENNEDY INT'L AR 7 35 31 53 48 45 -14NY NEW YORK LAGUARDIA ARPT 9 36 33 55 50 47 -14NY NEWBURGH/STEWART 177 35 31 53 48 45 -20NY NIAGARA FALLS AF 179 33 30 52 47 44 -20NY PLATTSBURGH AFB 72 32 30 52 47 44 -28NY POUGHKEEPSIE DUTCHESS CO AP 49 36 33 55 50 47 -22NY REPUBLIC 26 35 32 54 49 46 -13NY ROCHESTER GREATER ROCHESTER I 169 34 31 53 48 45 -20NY SUPERIOR SHOALS 79 29 27 49 44 41 -23NY SYRACUSE HANCOCK INT'L ARPT 127 33 31 53 48 45 -24NY UTICA ONEIDA COUNTY AP 227 33 30 52 47 44 -24NY WATERTOWN AP 102 31 29 51 46 43 -32NY WHITE PLAINS WESTCHESTER CO A 121 35 32 54 49 46 -17OH AKRON AKRON-CANTON REG AP 377 34 31 53 48 45 -21OH CINCINNATI MUNICIPAL AP LUNKI 152 36 33 55 50 47 -19OH CLEVELAND HOPKINS INTL AP 245 34 31 53 48 45 -20OH COLUMBUS PORT COLUMBUS INTL A 249 35 32 54 49 46 -20OH DAYTON INTERNATIONAL AIRPORT 306 35 32 54 49 46 -21OH FINDLAY AIRPORT 248 35 32 54 49 46 -22OH LANCASTER\FAIRFIEL 264 34 32 54 49 46 -21OH MANSFIELD LAHM MUNICIPAL ARPT 400 33 31 53 48 45 -22OH OHIO STATE UNIVERSI 283 34 32 54 49 46 -18OH RICKENBACKER ANGB 230 36 33 55 50 47 -19OH SOUTH BASS ISLAND 178 31 29 51 46 43 -17OH TOLEDO EXPRESS AIRPORT 211 35 32 54 49 46 -21OH WRIGHT-PATERSON AFB 250 36 33 55 50 47 -21OH YOUNGSTOWN REGIONAL AIRPORT 362 34 31 53 48 45 -21OH ZANESVILLE MUNICIPAL AP 275 34 32 54 49 46 -21OK ALTUS AFB 414 41 39 61 56 53 -13OK CLINTON-SHERMAN 586 41 38 60 55 52 -13OK FORT SILL 369 41 37 59 54 51 -13OK GAGE AIRPORT 671 39 37 59 54 51 -19OK HOBART MUNICIPAL AP 479 41 38 60 55 52 -14OK LAWTON MUNICIPAL 338 41 38 60 55 52 -12OK MCALESTER MUNICIPAL AP 235 40 36 58 53 50 -14OK OKLAHOMA CITY WILL ROGERS WOR 398 40 36 58 53 50 -14OK OKLAHOMA CITY/WILEY 396 40 37 59 54 51 -15OK PONCA CITY MUNICIPAL AP 304 40 37 59 54 51 -16OK STILLWATER RGNL 308 41 37 59 54 51 -15OK TINKER AFB 384 39 36 58 53 50 -14OK TULSA INTERNATIONAL AIRPORT 206 39 36 58 53 50 -15
Temperature Table Continued
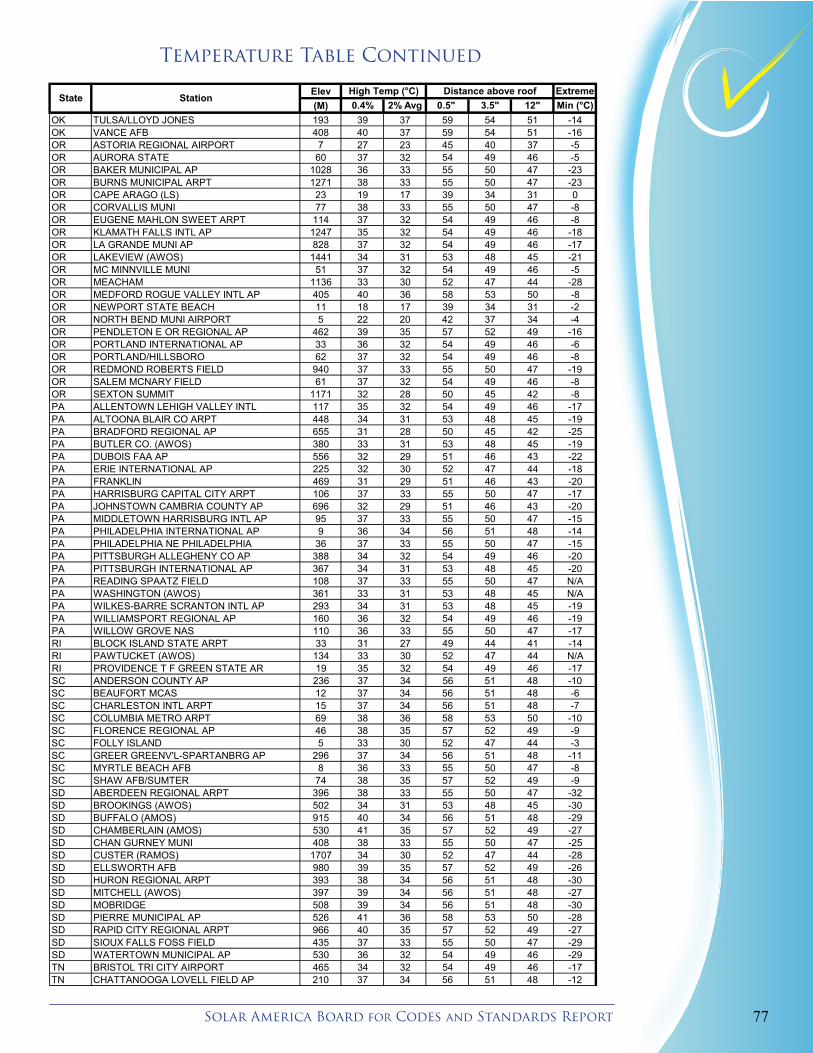
77Solar America Board for Codes and Standards Report
ASHRAE DATA
Elev Extreme(M) 0.4% 2% Avg 0.5" 3.5" 12" Min (°C)
Distance above roofHigh Temp (°C)State Station
OK TULSA/LLOYD JONES 193 39 37 59 54 51 -14OK VANCE AFB 408 40 37 59 54 51 -16OR ASTORIA REGIONAL AIRPORT 7 27 23 45 40 37 -5OR AURORA STATE 60 37 32 54 49 46 -5OR BAKER MUNICIPAL AP 1028 36 33 55 50 47 -23OR BURNS MUNICIPAL ARPT 1271 38 33 55 50 47 -23OR CAPE ARAGO (LS) 23 19 17 39 34 31 0OR CORVALLIS MUNI 77 38 33 55 50 47 -8OR EUGENE MAHLON SWEET ARPT 114 37 32 54 49 46 -8OR KLAMATH FALLS INTL AP 1247 35 32 54 49 46 -18OR LA GRANDE MUNI AP 828 37 32 54 49 46 -17OR LAKEVIEW (AWOS) 1441 34 31 53 48 45 -21OR MC MINNVILLE MUNI 51 37 32 54 49 46 -5OR MEACHAM 1136 33 30 52 47 44 -28OR MEDFORD ROGUE VALLEY INTL AP 405 40 36 58 53 50 -8OR NEWPORT STATE BEACH 11 18 17 39 34 31 -2OR NORTH BEND MUNI AIRPORT 5 22 20 42 37 34 -4OR PENDLETON E OR REGIONAL AP 462 39 35 57 52 49 -16OR PORTLAND INTERNATIONAL AP 33 36 32 54 49 46 -6OR PORTLAND/HILLSBORO 62 37 32 54 49 46 -8OR REDMOND ROBERTS FIELD 940 37 33 55 50 47 -19OR SALEM MCNARY FIELD 61 37 32 54 49 46 -8OR SEXTON SUMMIT 1171 32 28 50 45 42 -8PA ALLENTOWN LEHIGH VALLEY INTL 117 35 32 54 49 46 -17PA ALTOONA BLAIR CO ARPT 448 34 31 53 48 45 -19PA BRADFORD REGIONAL AP 655 31 28 50 45 42 -25PA BUTLER CO. (AWOS) 380 33 31 53 48 45 -19PA DUBOIS FAA AP 556 32 29 51 46 43 -22PA ERIE INTERNATIONAL AP 225 32 30 52 47 44 -18PA FRANKLIN 469 31 29 51 46 43 -20PA HARRISBURG CAPITAL CITY ARPT 106 37 33 55 50 47 -17PA JOHNSTOWN CAMBRIA COUNTY AP 696 32 29 51 46 43 -20PA MIDDLETOWN HARRISBURG INTL AP 95 37 33 55 50 47 -15PA PHILADELPHIA INTERNATIONAL AP 9 36 34 56 51 48 -14PA PHILADELPHIA NE PHILADELPHIA 36 37 33 55 50 47 -15PA PITTSBURGH ALLEGHENY CO AP 388 34 32 54 49 46 -20PA PITTSBURGH INTERNATIONAL AP 367 34 31 53 48 45 -20PA READING SPAATZ FIELD 108 37 33 55 50 47 N/APA WASHINGTON (AWOS) 361 33 31 53 48 45 N/APA WILKES-BARRE SCRANTON INTL AP 293 34 31 53 48 45 -19PA WILLIAMSPORT REGIONAL AP 160 36 32 54 49 46 -19PA WILLOW GROVE NAS 110 36 33 55 50 47 -17RI BLOCK ISLAND STATE ARPT 33 31 27 49 44 41 -14RI PAWTUCKET (AWOS) 134 33 30 52 47 44 N/ARI PROVIDENCE T F GREEN STATE AR 19 35 32 54 49 46 -17SC ANDERSON COUNTY AP 236 37 34 56 51 48 -10SC BEAUFORT MCAS 12 37 34 56 51 48 -6SC CHARLESTON INTL ARPT 15 37 34 56 51 48 -7SC COLUMBIA METRO ARPT 69 38 36 58 53 50 -10SC FLORENCE REGIONAL AP 46 38 35 57 52 49 -9SC FOLLY ISLAND 5 33 30 52 47 44 -3SC GREER GREENV'L-SPARTANBRG AP 296 37 34 56 51 48 -11SC MYRTLE BEACH AFB 8 36 33 55 50 47 -8SC SHAW AFB/SUMTER 74 38 35 57 52 49 -9SD ABERDEEN REGIONAL ARPT 396 38 33 55 50 47 -32SD BROOKINGS (AWOS) 502 34 31 53 48 45 -30SD BUFFALO (AMOS) 915 40 34 56 51 48 -29SD CHAMBERLAIN (AMOS) 530 41 35 57 52 49 -27SD CHAN GURNEY MUNI 408 38 33 55 50 47 -25SD CUSTER (RAMOS) 1707 34 30 52 47 44 -28SD ELLSWORTH AFB 980 39 35 57 52 49 -26SD HURON REGIONAL ARPT 393 38 34 56 51 48 -30SD MITCHELL (AWOS) 397 39 34 56 51 48 -27SD MOBRIDGE 508 39 34 56 51 48 -30SD PIERRE MUNICIPAL AP 526 41 36 58 53 50 -28SD RAPID CITY REGIONAL ARPT 966 40 35 57 52 49 -27SD SIOUX FALLS FOSS FIELD 435 37 33 55 50 47 -29SD WATERTOWN MUNICIPAL AP 530 36 32 54 49 46 -29TN BRISTOL TRI CITY AIRPORT 465 34 32 54 49 46 -17TN CHATTANOOGA LOVELL FIELD AP 210 37 34 56 51 48 -12
Temperature Table Continued
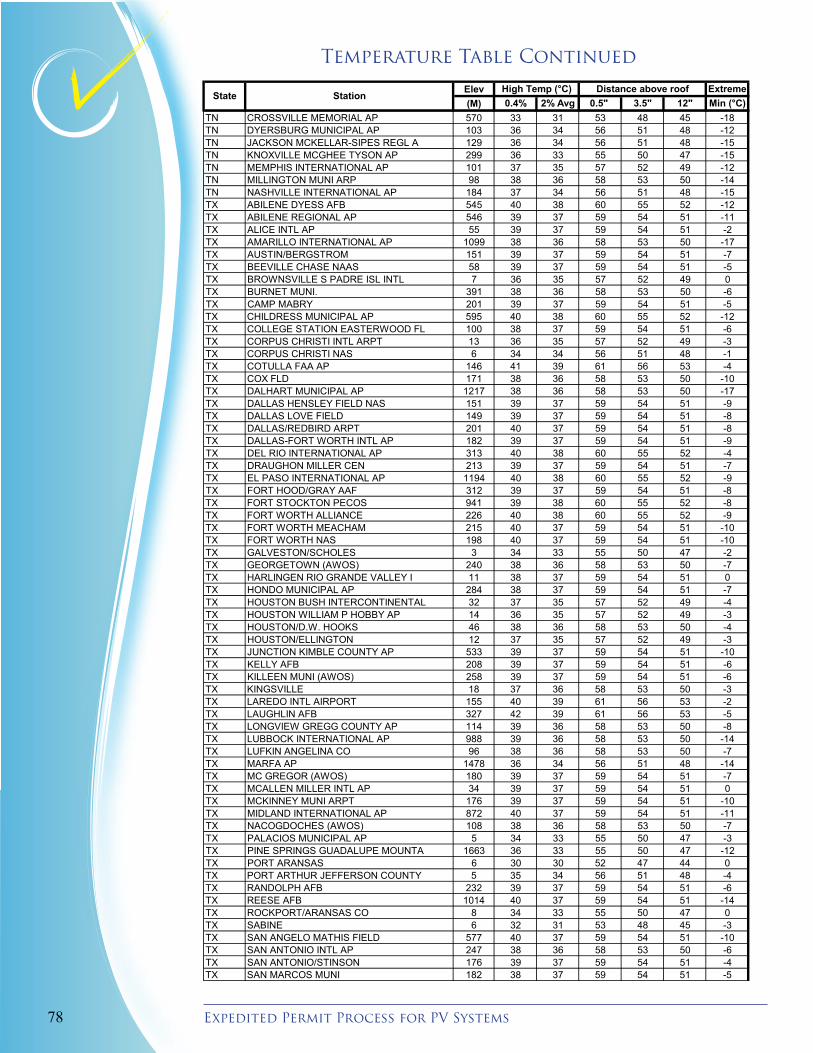
Expedited Permit Process for PV Systems 78
ASHRAE DATA
Elev Extreme(M) 0.4% 2% Avg 0.5" 3.5" 12" Min (°C)
Distance above roofHigh Temp (°C)State Station
TN CROSSVILLE MEMORIAL AP 570 33 31 53 48 45 -18TN DYERSBURG MUNICIPAL AP 103 36 34 56 51 48 -12TN JACKSON MCKELLAR-SIPES REGL A 129 36 34 56 51 48 -15TN KNOXVILLE MCGHEE TYSON AP 299 36 33 55 50 47 -15TN MEMPHIS INTERNATIONAL AP 101 37 35 57 52 49 -12TN MILLINGTON MUNI ARP 98 38 36 58 53 50 -14TN NASHVILLE INTERNATIONAL AP 184 37 34 56 51 48 -15TX ABILENE DYESS AFB 545 40 38 60 55 52 -12TX ABILENE REGIONAL AP 546 39 37 59 54 51 -11TX ALICE INTL AP 55 39 37 59 54 51 -2TX AMARILLO INTERNATIONAL AP 1099 38 36 58 53 50 -17TX AUSTIN/BERGSTROM 151 39 37 59 54 51 -7TX BEEVILLE CHASE NAAS 58 39 37 59 54 51 -5TX BROWNSVILLE S PADRE ISL INTL 7 36 35 57 52 49 0TX BURNET MUNI. 391 38 36 58 53 50 -6TX CAMP MABRY 201 39 37 59 54 51 -5TX CHILDRESS MUNICIPAL AP 595 40 38 60 55 52 -12TX COLLEGE STATION EASTERWOOD FL 100 38 37 59 54 51 -6TX CORPUS CHRISTI INTL ARPT 13 36 35 57 52 49 -3TX CORPUS CHRISTI NAS 6 34 34 56 51 48 -1TX COTULLA FAA AP 146 41 39 61 56 53 -4TX COX FLD 171 38 36 58 53 50 -10TX DALHART MUNICIPAL AP 1217 38 36 58 53 50 -17TX DALLAS HENSLEY FIELD NAS 151 39 37 59 54 51 -9TX DALLAS LOVE FIELD 149 39 37 59 54 51 -8TX DALLAS/REDBIRD ARPT 201 40 37 59 54 51 -8TX DALLAS-FORT WORTH INTL AP 182 39 37 59 54 51 -9TX DEL RIO INTERNATIONAL AP 313 40 38 60 55 52 -4TX DRAUGHON MILLER CEN 213 39 37 59 54 51 -7TX EL PASO INTERNATIONAL AP 1194 40 38 60 55 52 -9TX FORT HOOD/GRAY AAF 312 39 37 59 54 51 -8TX FORT STOCKTON PECOS 941 39 38 60 55 52 -8TX FORT WORTH ALLIANCE 226 40 38 60 55 52 -9TX FORT WORTH MEACHAM 215 40 37 59 54 51 -10TX FORT WORTH NAS 198 40 37 59 54 51 -10TX GALVESTON/SCHOLES 3 34 33 55 50 47 -2TX GEORGETOWN (AWOS) 240 38 36 58 53 50 -7TX HARLINGEN RIO GRANDE VALLEY I 11 38 37 59 54 51 0TX HONDO MUNICIPAL AP 284 38 37 59 54 51 -7TX HOUSTON BUSH INTERCONTINENTAL 32 37 35 57 52 49 -4TX HOUSTON WILLIAM P HOBBY AP 14 36 35 57 52 49 -3TX HOUSTON/D.W. HOOKS 46 38 36 58 53 50 -4TX HOUSTON/ELLINGTON 12 37 35 57 52 49 -3TX JUNCTION KIMBLE COUNTY AP 533 39 37 59 54 51 -10TX KELLY AFB 208 39 37 59 54 51 -6TX KILLEEN MUNI (AWOS) 258 39 37 59 54 51 -6TX KINGSVILLE 18 37 36 58 53 50 -3TX LAREDO INTL AIRPORT 155 40 39 61 56 53 -2TX LAUGHLIN AFB 327 42 39 61 56 53 -5TX LONGVIEW GREGG COUNTY AP 114 39 36 58 53 50 -8TX LUBBOCK INTERNATIONAL AP 988 39 36 58 53 50 -14TX LUFKIN ANGELINA CO 96 38 36 58 53 50 -7TX MARFA AP 1478 36 34 56 51 48 -14TX MC GREGOR (AWOS) 180 39 37 59 54 51 -7TX MCALLEN MILLER INTL AP 34 39 37 59 54 51 0TX MCKINNEY MUNI ARPT 176 39 37 59 54 51 -10TX MIDLAND INTERNATIONAL AP 872 40 37 59 54 51 -11TX NACOGDOCHES (AWOS) 108 38 36 58 53 50 -7TX PALACIOS MUNICIPAL AP 5 34 33 55 50 47 -3TX PINE SPRINGS GUADALUPE MOUNTA 1663 36 33 55 50 47 -12TX PORT ARANSAS 6 30 30 52 47 44 0TX PORT ARTHUR JEFFERSON COUNTY 5 35 34 56 51 48 -4TX RANDOLPH AFB 232 39 37 59 54 51 -6TX REESE AFB 1014 40 37 59 54 51 -14TX ROCKPORT/ARANSAS CO 8 34 33 55 50 47 0TX SABINE 6 32 31 53 48 45 -3TX SAN ANGELO MATHIS FIELD 577 40 37 59 54 51 -10TX SAN ANTONIO INTL AP 247 38 36 58 53 50 -6TX SAN ANTONIO/STINSON 176 39 37 59 54 51 -4TX SAN MARCOS MUNI 182 38 37 59 54 51 -5
Temperature Table Continued
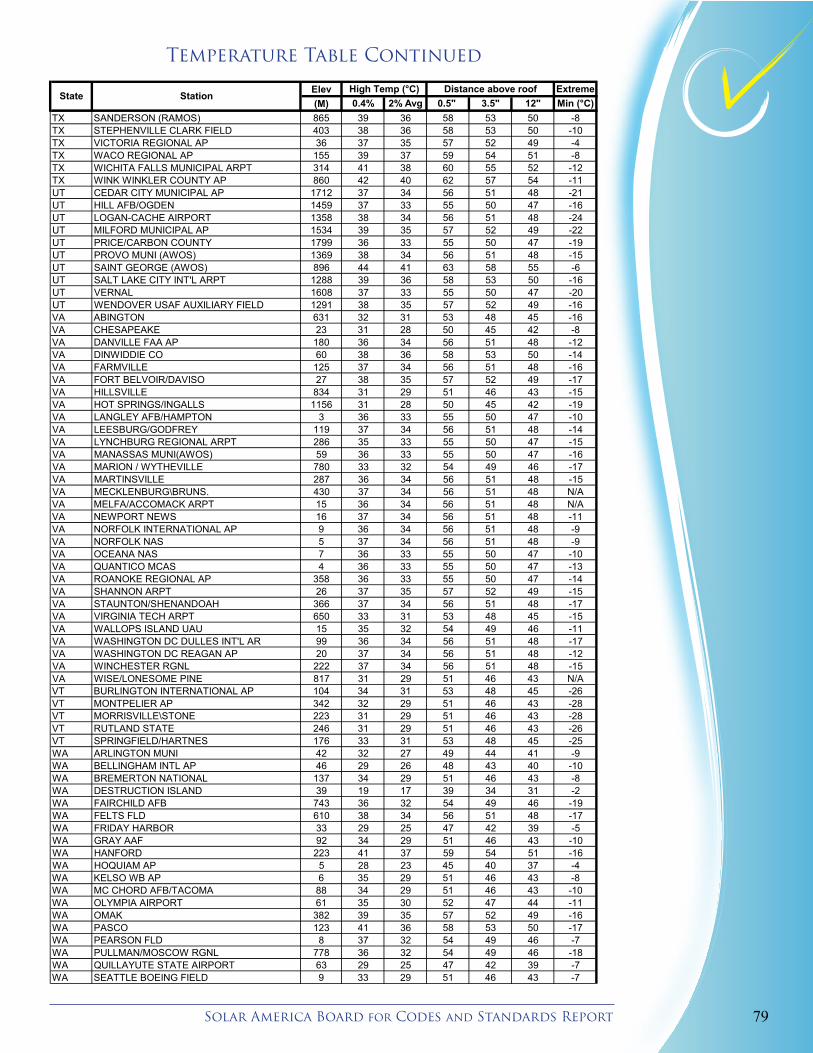
79Solar America Board for Codes and Standards Report
ASHRAE DATA
Elev Extreme(M) 0.4% 2% Avg 0.5" 3.5" 12" Min (°C)
Distance above roofHigh Temp (°C)State Station
TX SANDERSON (RAMOS) 865 39 36 58 53 50 -8TX STEPHENVILLE CLARK FIELD 403 38 36 58 53 50 -10TX VICTORIA REGIONAL AP 36 37 35 57 52 49 -4TX WACO REGIONAL AP 155 39 37 59 54 51 -8TX WICHITA FALLS MUNICIPAL ARPT 314 41 38 60 55 52 -12TX WINK WINKLER COUNTY AP 860 42 40 62 57 54 -11UT CEDAR CITY MUNICIPAL AP 1712 37 34 56 51 48 -21UT HILL AFB/OGDEN 1459 37 33 55 50 47 -16UT LOGAN-CACHE AIRPORT 1358 38 34 56 51 48 -24UT MILFORD MUNICIPAL AP 1534 39 35 57 52 49 -22UT PRICE/CARBON COUNTY 1799 36 33 55 50 47 -19UT PROVO MUNI (AWOS) 1369 38 34 56 51 48 -15UT SAINT GEORGE (AWOS) 896 44 41 63 58 55 -6UT SALT LAKE CITY INT'L ARPT 1288 39 36 58 53 50 -16UT VERNAL 1608 37 33 55 50 47 -20UT WENDOVER USAF AUXILIARY FIELD 1291 38 35 57 52 49 -16VA ABINGTON 631 32 31 53 48 45 -16VA CHESAPEAKE 23 31 28 50 45 42 -8VA DANVILLE FAA AP 180 36 34 56 51 48 -12VA DINWIDDIE CO 60 38 36 58 53 50 -14VA FARMVILLE 125 37 34 56 51 48 -16VA FORT BELVOIR/DAVISO 27 38 35 57 52 49 -17VA HILLSVILLE 834 31 29 51 46 43 -15VA HOT SPRINGS/INGALLS 1156 31 28 50 45 42 -19VA LANGLEY AFB/HAMPTON 3 36 33 55 50 47 -10VA LEESBURG/GODFREY 119 37 34 56 51 48 -14VA LYNCHBURG REGIONAL ARPT 286 35 33 55 50 47 -15VA MANASSAS MUNI(AWOS) 59 36 33 55 50 47 -16VA MARION / WYTHEVILLE 780 33 32 54 49 46 -17VA MARTINSVILLE 287 36 34 56 51 48 -15VA MECKLENBURG\BRUNS. 430 37 34 56 51 48 N/AVA MELFA/ACCOMACK ARPT 15 36 34 56 51 48 N/AVA NEWPORT NEWS 16 37 34 56 51 48 -11VA NORFOLK INTERNATIONAL AP 9 36 34 56 51 48 -9VA NORFOLK NAS 5 37 34 56 51 48 -9VA OCEANA NAS 7 36 33 55 50 47 -10VA QUANTICO MCAS 4 36 33 55 50 47 -13VA ROANOKE REGIONAL AP 358 36 33 55 50 47 -14VA SHANNON ARPT 26 37 35 57 52 49 -15VA STAUNTON/SHENANDOAH 366 37 34 56 51 48 -17VA VIRGINIA TECH ARPT 650 33 31 53 48 45 -15VA WALLOPS ISLAND UAU 15 35 32 54 49 46 -11VA WASHINGTON DC DULLES INT'L AR 99 36 34 56 51 48 -17VA WASHINGTON DC REAGAN AP 20 37 34 56 51 48 -12VA WINCHESTER RGNL 222 37 34 56 51 48 -15VA WISE/LONESOME PINE 817 31 29 51 46 43 N/AVT BURLINGTON INTERNATIONAL AP 104 34 31 53 48 45 -26VT MONTPELIER AP 342 32 29 51 46 43 -28VT MORRISVILLE\STONE 223 31 29 51 46 43 -28VT RUTLAND STATE 246 31 29 51 46 43 -26VT SPRINGFIELD/HARTNES 176 33 31 53 48 45 -25WA ARLINGTON MUNI 42 32 27 49 44 41 -9WA BELLINGHAM INTL AP 46 29 26 48 43 40 -10WA BREMERTON NATIONAL 137 34 29 51 46 43 -8WA DESTRUCTION ISLAND 39 19 17 39 34 31 -2WA FAIRCHILD AFB 743 36 32 54 49 46 -19WA FELTS FLD 610 38 34 56 51 48 -17WA FRIDAY HARBOR 33 29 25 47 42 39 -5WA GRAY AAF 92 34 29 51 46 43 -10WA HANFORD 223 41 37 59 54 51 -16WA HOQUIAM AP 5 28 23 45 40 37 -4WA KELSO WB AP 6 35 29 51 46 43 -8WA MC CHORD AFB/TACOMA 88 34 29 51 46 43 -10WA OLYMPIA AIRPORT 61 35 30 52 47 44 -11WA OMAK 382 39 35 57 52 49 -16WA PASCO 123 41 36 58 53 50 -17WA PEARSON FLD 8 37 32 54 49 46 -7WA PULLMAN/MOSCOW RGNL 778 36 32 54 49 46 -18WA QUILLAYUTE STATE AIRPORT 63 29 25 47 42 39 -7WA SEATTLE BOEING FIELD 9 33 29 51 46 43 -7
Temperature Table Continued
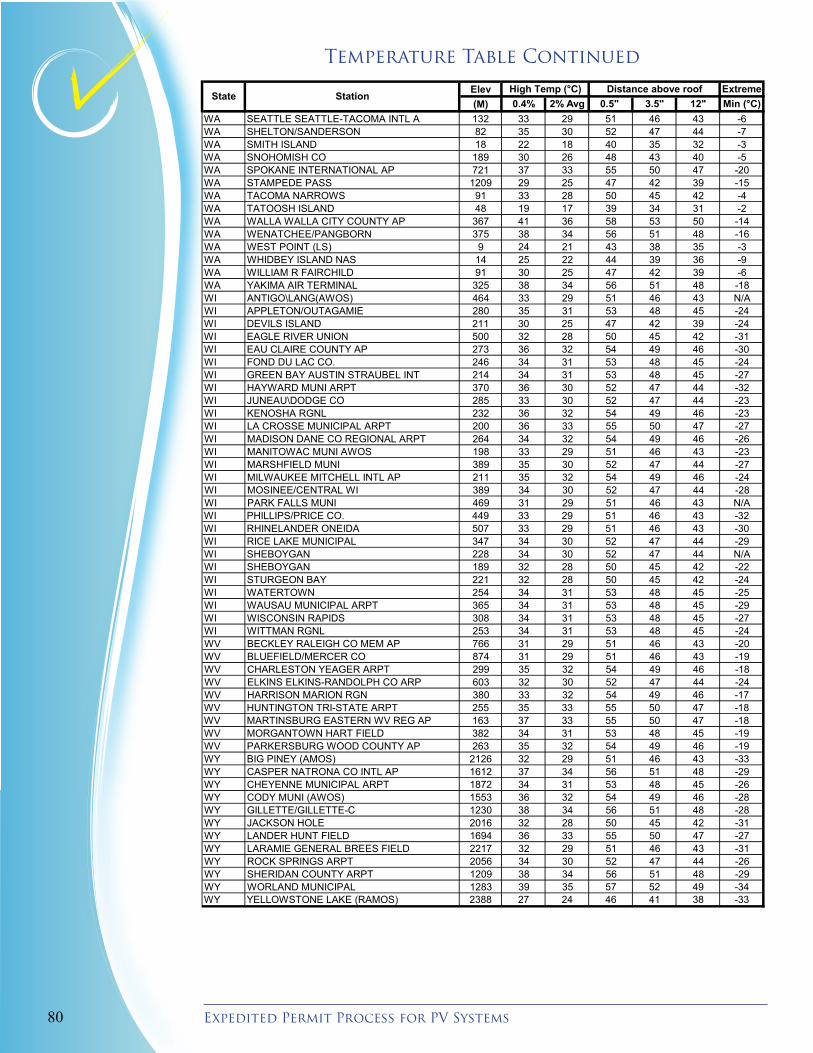
Expedited Permit Process for PV Systems 80
ASHRAE DATA
Elev Extreme(M) 0.4% 2% Avg 0.5" 3.5" 12" Min (°C)
Distance above roofHigh Temp (°C)State Station
WA SEATTLE SEATTLE-TACOMA INTL A 132 33 29 51 46 43 -6WA SHELTON/SANDERSON 82 35 30 52 47 44 -7WA SMITH ISLAND 18 22 18 40 35 32 -3WA SNOHOMISH CO 189 30 26 48 43 40 -5WA SPOKANE INTERNATIONAL AP 721 37 33 55 50 47 -20WA STAMPEDE PASS 1209 29 25 47 42 39 -15WA TACOMA NARROWS 91 33 28 50 45 42 -4WA TATOOSH ISLAND 48 19 17 39 34 31 -2WA WALLA WALLA CITY COUNTY AP 367 41 36 58 53 50 -14WA WENATCHEE/PANGBORN 375 38 34 56 51 48 -16WA WEST POINT (LS) 9 24 21 43 38 35 -3WA WHIDBEY ISLAND NAS 14 25 22 44 39 36 -9WA WILLIAM R FAIRCHILD 91 30 25 47 42 39 -6WA YAKIMA AIR TERMINAL 325 38 34 56 51 48 -18WI ANTIGO\LANG(AWOS) 464 33 29 51 46 43 N/AWI APPLETON/OUTAGAMIE 280 35 31 53 48 45 -24WI DEVILS ISLAND 211 30 25 47 42 39 -24WI EAGLE RIVER UNION 500 32 28 50 45 42 -31WI EAU CLAIRE COUNTY AP 273 36 32 54 49 46 -30WI FOND DU LAC CO. 246 34 31 53 48 45 -24WI GREEN BAY AUSTIN STRAUBEL INT 214 34 31 53 48 45 -27WI HAYWARD MUNI ARPT 370 36 30 52 47 44 -32WI JUNEAU\DODGE CO 285 33 30 52 47 44 -23WI KENOSHA RGNL 232 36 32 54 49 46 -23WI LA CROSSE MUNICIPAL ARPT 200 36 33 55 50 47 -27WI MADISON DANE CO REGIONAL ARPT 264 34 32 54 49 46 -26WI MANITOWAC MUNI AWOS 198 33 29 51 46 43 -23WI MARSHFIELD MUNI 389 35 30 52 47 44 -27WI MILWAUKEE MITCHELL INTL AP 211 35 32 54 49 46 -24WI MOSINEE/CENTRAL WI 389 34 30 52 47 44 -28WI PARK FALLS MUNI 469 31 29 51 46 43 N/AWI PHILLIPS/PRICE CO. 449 33 29 51 46 43 -32WI RHINELANDER ONEIDA 507 33 29 51 46 43 -30WI RICE LAKE MUNICIPAL 347 34 30 52 47 44 -29WI SHEBOYGAN 228 34 30 52 47 44 N/AWI SHEBOYGAN 189 32 28 50 45 42 -22WI STURGEON BAY 221 32 28 50 45 42 -24WI WATERTOWN 254 34 31 53 48 45 -25WI WAUSAU MUNICIPAL ARPT 365 34 31 53 48 45 -29WI WISCONSIN RAPIDS 308 34 31 53 48 45 -27WI WITTMAN RGNL 253 34 31 53 48 45 -24WV BECKLEY RALEIGH CO MEM AP 766 31 29 51 46 43 -20WV BLUEFIELD/MERCER CO 874 31 29 51 46 43 -19WV CHARLESTON YEAGER ARPT 299 35 32 54 49 46 -18WV ELKINS ELKINS-RANDOLPH CO ARP 603 32 30 52 47 44 -24WV HARRISON MARION RGN 380 33 32 54 49 46 -17WV HUNTINGTON TRI-STATE ARPT 255 35 33 55 50 47 -18WV MARTINSBURG EASTERN WV REG AP 163 37 33 55 50 47 -18WV MORGANTOWN HART FIELD 382 34 31 53 48 45 -19WV PARKERSBURG WOOD COUNTY AP 263 35 32 54 49 46 -19WY BIG PINEY (AMOS) 2126 32 29 51 46 43 -33WY CASPER NATRONA CO INTL AP 1612 37 34 56 51 48 -29WY CHEYENNE MUNICIPAL ARPT 1872 34 31 53 48 45 -26WY CODY MUNI (AWOS) 1553 36 32 54 49 46 -28WY GILLETTE/GILLETTE-C 1230 38 34 56 51 48 -28WY JACKSON HOLE 2016 32 28 50 45 42 -31WY LANDER HUNT FIELD 1694 36 33 55 50 47 -27WY LARAMIE GENERAL BREES FIELD 2217 32 29 51 46 43 -31WY ROCK SPRINGS ARPT 2056 34 30 52 47 44 -26WY SHERIDAN COUNTY ARPT 1209 38 34 56 51 48 -29WY WORLAND MUNICIPAL 1283 39 35 57 52 49 -34WY YELLOWSTONE LAKE (RAMOS) 2388 27 24 46 41 38 -33
Temperature Table Continued

Solar America Board for Codes and Standardswww.solarabcs.org
Expedited PermitProcess for PV Systems
A Standardized Process for the Review of Small-Scale PV Systems
Prepared by
Bill Brooks, P.E.Brooks Engineering
Revision 2July 2012
Solar America Board for Codes and Standardswww.solarabcs.org
ABCS-11-SR