Expected Results on 14 August 2015 Co Name Co Name Co Name Results on 140815.pdf · Co Name Co Name...
70
Co Name Co Name Co Name 7Seas Entertainment Atlanta Infrastructure and Finance Capricorn Systems Global Solutions A2Z Infra Engineering Atlanta Caprolactam Chemicals Aadi Industries Aurangabad Paper Mills Castex Technologies Aarey Drugs & Pharmaceuticals Aurum Soft Systems Cat Technologies ABC India Autolite (India) CCL International ABG Infralogistics Autopal Industries Ceenik Exports (India) ACE EduTrend Aviva Industries Ceeta Industries Acknit Industries Avon Mercantile Centron Industrial Alliance Acrow India Avonmore Capital & Management Services Cerebra Integrated Technologies Acrysil Axis Capital Markets (India) CES Adarsh Mercantile Axis Rail India Chartered Logistics Adinath Exim Resources Ayoki Merchantile CHD Developers Adinath Textiles Azure Exim Services Chemiesynth (Vapi) ADS Diagnostic B Nanji Enterprises Chennai Ferrous Industries Advance Multitech B2B Software Technologies Chordia Food Products Advance Petrochemicals Bacil Pharma Cipla Advance Powerinfra Tech Bagalkot Udyog Citadel Realty & Developers Advanced Micronic Devices Bajrang Finance City Online Services AF Enterprises Balaji Galvanising Industries Classic Global Finance & Capital Aftek Balasore Alloys Clio Infotech Agarwal Industrial Corporation Balurghat Technologies Clutch Auto Agio Paper & Industries Bang Overseas Combat Drugs Agro Dutch Industries Banswara Syntex Commex Technology Aikyam Intellectual Property Consultancy Barak Cement Concord Drugs Aimco Pesticides Baroda Extrusion Confidence Petroleum India Aishwarya Technologies and Telecom Baron Infotech Continental Securities Ajel BCL Industries & Infrastructures Cords Cable Industries AK Capital Services BCPL International Core Education & Technologies Akzo Nobel India Beeyu Overseas Covidh Technologies Alfavision Overseas (India) Bell Agromachina Cranes Software International Allied Digital Services BEML Cravatex Alufluoride Best Eastern Hotels Creative Merchants Amara Raja Batteries Betex India Crescent Leasing Ambalal Sarabhai Enterprises Bhagawati Oxygen Cressanda Solutions Ambica Agarbathies & Aroma Industries Bhagyodaya Infrastructure Development Crimson Metal Engineering Company Amit International Bharat Petroleum Corporation Datamatics Global Services Amrapali Industries Bharati Shipyard DCM Shriram Industries Amtek Auto Bharatiya Global Infomedia DCW Anar Industries Bhushan Steel Deccan Gold Mines ANG Industries Bhuwalka Steel Industries Deccan Polypacks Anik Industries BIL Continental Deep Industries Apex Buildsys BIL Energy Systems Delma Infrastructure APT Packaging Bilpower Dera Paints & Chemicals Apte Amalgamations Binayak Tex Processors Devine Impex Arcee Industries Birla Corporation DFL Infrastructure Finance Archidply Industries Birla Shloka Edutech Dhanada Corporation Archon Industries Bliss GVS Pharma Dhanlaxmi Cotex Ardi Investments & Trading Company Blue Blends (India) Dhanlaxmi Fabrics Arihant Avenues & Credit Blue Chip India Dhoot Industrial Finance Arihant Multi Commercial BMB Music & Magnetics Dhoot Industries Arora Fibres Bodhtree Consulting DHP India Arrow Coated Products Bombay Cycle & Motor Agency Dhunseri Tea & Industries Artech Power Products Bombay Rayon Fashions Diana Tea Company Artefact Projects Bombay Swadeshi Stores DIL Aseem Global Boston Teknowsys (India) Diligent Industries Ashiana Ispat BPL Donear Industries Asis Logistics Brahmanand Himghar Dredging Corporation Of India ASM Technologies Broadcast Initiatives Duncans Industries Associated Alcohols & Breweries Brushman (India) Duropack Associated Ceramics Camphor & Allied Products Dwarikesh Sugar Industries Asya Infosoft Capman Financials Dynacons Systems & Solutions Atlanta Devcon Capri Global Capital Dynamatic Technologies Expected Results on 14 August 2015 Expected Results on 14 August 2015
Transcript of Expected Results on 14 August 2015 Co Name Co Name Co Name Results on 140815.pdf · Co Name Co Name...

Co Name Co Name Co Name
7Seas Entertainment Atlanta Infrastructure and Finance Capricorn Systems Global Solutions
A2Z Infra Engineering Atlanta Caprolactam Chemicals
Aadi Industries Aurangabad Paper Mills Castex Technologies
Aarey Drugs & Pharmaceuticals Aurum Soft Systems Cat Technologies
ABC India Autolite (India) CCL International
ABG Infralogistics Autopal Industries Ceenik Exports (India)
ACE EduTrend Aviva Industries Ceeta Industries
Acknit Industries Avon Mercantile Centron Industrial Alliance
Acrow India Avonmore Capital & Management Services Cerebra Integrated Technologies
Acrysil Axis Capital Markets (India) CES
Adarsh Mercantile Axis Rail India Chartered Logistics
Adinath Exim Resources Ayoki Merchantile CHD Developers
Adinath Textiles Azure Exim Services Chemiesynth (Vapi)
ADS Diagnostic B Nanji Enterprises Chennai Ferrous Industries
Advance Multitech B2B Software Technologies Chordia Food Products
Advance Petrochemicals Bacil Pharma Cipla
Advance Powerinfra Tech Bagalkot Udyog Citadel Realty & Developers
Advanced Micronic Devices Bajrang Finance City Online Services
AF Enterprises Balaji Galvanising Industries Classic Global Finance & Capital
Aftek Balasore Alloys Clio Infotech
Agarwal Industrial Corporation Balurghat Technologies Clutch Auto
Agio Paper & Industries Bang Overseas Combat Drugs
Agro Dutch Industries Banswara Syntex Commex Technology
Aikyam Intellectual Property Consultancy Barak Cement Concord Drugs
Aimco Pesticides Baroda Extrusion Confidence Petroleum India
Aishwarya Technologies and Telecom Baron Infotech Continental Securities
Ajel BCL Industries & Infrastructures Cords Cable Industries
AK Capital Services BCPL International Core Education & Technologies
Akzo Nobel India Beeyu Overseas Covidh Technologies
Alfavision Overseas (India) Bell Agromachina Cranes Software International
Allied Digital Services BEML Cravatex
Alufluoride Best Eastern Hotels Creative Merchants
Amara Raja Batteries Betex India Crescent Leasing
Ambalal Sarabhai Enterprises Bhagawati Oxygen Cressanda Solutions
Ambica Agarbathies & Aroma Industries Bhagyodaya Infrastructure Development Crimson Metal Engineering Company
Amit International Bharat Petroleum Corporation Datamatics Global Services
Amrapali Industries Bharati Shipyard DCM Shriram Industries
Amtek Auto Bharatiya Global Infomedia DCW
Anar Industries Bhushan Steel Deccan Gold Mines
ANG Industries Bhuwalka Steel Industries Deccan Polypacks
Anik Industries BIL Continental Deep Industries
Apex Buildsys BIL Energy Systems Delma Infrastructure
APT Packaging Bilpower Dera Paints & Chemicals
Apte Amalgamations Binayak Tex Processors Devine Impex
Arcee Industries Birla Corporation DFL Infrastructure Finance
Archidply Industries Birla Shloka Edutech Dhanada Corporation
Archon Industries Bliss GVS Pharma Dhanlaxmi Cotex
Ardi Investments & Trading Company Blue Blends (India) Dhanlaxmi Fabrics
Arihant Avenues & Credit Blue Chip India Dhoot Industrial Finance
Arihant Multi Commercial BMB Music & Magnetics Dhoot Industries
Arora Fibres Bodhtree Consulting DHP India
Arrow Coated Products Bombay Cycle & Motor Agency Dhunseri Tea & Industries
Artech Power Products Bombay Rayon Fashions Diana Tea Company
Artefact Projects Bombay Swadeshi Stores DIL
Aseem Global Boston Teknowsys (India) Diligent Industries
Ashiana Ispat BPL Donear Industries
Asis Logistics Brahmanand Himghar Dredging Corporation Of India
ASM Technologies Broadcast Initiatives Duncans Industries
Associated Alcohols & Breweries Brushman (India) Duropack
Associated Ceramics Camphor & Allied Products Dwarikesh Sugar Industries
Asya Infosoft Capman Financials Dynacons Systems & Solutions
Atlanta Devcon Capri Global Capital Dynamatic Technologies
Exp
ecte
d R
esu
lts
on
14
Au
gu
st 2
015
Expected Results on 14 August 2015

Exp
ecte
d R
esu
lts
on
14
Au
gu
st 2
015
Co Name Co Name Co Name
Eastern Gases Globus Corporation IVRCL
Easun Reyrolle GOL Offshore Jai Balaji Industries
Effingo Textile & Trading Gold Line International Finvest Jaipan Industries
Effulgent Infomedia Goldcrest Corporation James Warren Tea
Elecon Engineering Company Golechha Global Finance Jauss Polymers
Electrotherm (India) Gopal Iron & Steels Company (Gujarat) Jayabharat Credit
Enbee Trade & Finance GR Cables Jayant Mercantile Company
Energy Development Company Grandma Trading & Agencies JCT Electronics
Entegra GS Auto International JD Orgochem
Era Infra Engineering GSL Nova Petrochemicals Jet Airways (India)
Esha Media Research Gufic Biosciences Jhaveri Credits & Capital
Ess Dee Aluminium Gujarat Industries Power Company Jindal Cotex
Essar Shipping Gujarat Metallic Coal & Coke Jindal Worldwide
Euro Asia Exports Gujarat Natural Resources JMT Auto
Euro Ceramics Gujarat Raffia Industries Jog Engineering
Euro Multivision Gujarat Terce Laboratories Joindre Capital Services
Eurotex Industries & Exports Gujarat Toolroom Jolly Plastic Industries
Excel Castronics GV Films JostS Engineering Company
Extol Commercials Haria Apparels JRI Industries & Infrastructure
Farmax India Haria Exports Jumbo Bag
FCS Software Solutions Hasti Finance Kabra Drugs
FE India HBL Power Systems Kailash Auto Finance
Filatex Fashions Heera Ispat Kallam Spinning Mills
Filatex India Hemang Resources Kalpa commercial
First Custodian Fund (India) High Ground Enterprise Kanishk Steel Industries
First Financial Services Himalaya Granites Kapil Cotex
Fluidomat Hind Aluminium Industries Kartik Investments Trust
Fomento Resorts & Hotels Hindalco Industries Karur KCP Packkagings
Freshtrop Fruits Hindustan Adhesives Karuturi Global
Frontier Springs Hindustan Dorr-Oliver Kashyap Tele-Medicines
Frontline Corporation Hindustan Everest Tools Kausambi Vanijya
Futuristic Offshore Services & Chemical Hindustan Fluorocarbons Kay Power and Paper
Gaekwar Mills Hindustan Motors KBS India
Gajanan Securities Services IB Infotech Enterprises KDDL
Gajra Bevel Gears IDream Film Infrastructure Company Kemp & Company
Galada Power & Telecommunication IL&FS Engineering and Construction Company Kemrock Industries & Exports
Gallops Enterprises Inani Marbles & Industries Ken Financial Services
Gammon India Inanna Fashion and Trends KG Petrochem
Ganesh Benzoplast Indag Rubber Khator Fibre & Fabrics
Ganesh Housing Corporation India Infraspace KIC Metaliks
Ganga Papers India India Tourism Development Corporation Kiduja India
Gangotri Cement Indiaco Ventures Kilitch Drugs (India)
Ganon Trading & Finance Company Indian Bright Steel Company Kings Infra Ventures
Garnet Construction Indian Infotech & Software KK Fincorp
Garware Marine Industries Indian Polyfins Kkalpana lndustries (India)
Gayatri Bio Organics Indian Sucrose KMC Speciality Hospitals (India)
Gayatri Projects Indianivesh KMF Builders & Developers
Gayatri Sugars Indo Euro Indchem KMG Milk Food
Gayatri Tissue & Papers Indo Rama Synthetics (India) KND Engineering Technologies
GEI Industrial Systems Indo Tech Transformers KNR Construction
Gem Spinners India Indus Fila Konark Synthetic
Gemmia Oiltech (India) Info-Drive Software Kothari Fermentation & Biochem
Gemstone Investments Infotrek Syscom Kridhan Infra
Genera Agri Corp Infra Industries KSK Energy Ventures
Genesys International Corporation Infraquest International KSS
Gennex Laboratories Infronics Systems Kumar Wire Cloth Mfg. Company
Genus Paper & Boards Inland Printers Kusam Electrical Industries
Genus Prime Infrastructures Integrated Thermoplastics Kwality
GI Engineering Solutions International Housing Finance Corporation Kyra Landscapes
Gita Renewable Energy Invicta Meditek KZ Leasing & Finance
Gitanjali Gems ISC Udyog Laffans Petrochemicals
Global Films & Broadcasting ITL Industries Lakshmi Precision Screws

Exp
ecte
d R
esu
lts
on
14
Au
gu
st 2
015
Co Name Co Name Co Name
Lalit Polymers & Electronics MSP Steel & Power Palred Technologies
Lancor Holdings MSR India Panchsheel Organics
Lawreshwar Polymers Mudit Finlease Paragon Finance
Lead Financial Services Mukesh Babu Financial Services Paramount Printpackaging
Lloyd Rockfibres Mukesh Strips Parnami Credits
Lohia Securities Multiplus Holdings Parnax Lab
Lok Housing & Constructions Munoth Capital Markets Parth Aluminium
Lokesh Machines MW Unitexx Pasupati Spinning & Weaving Mills
Lumax Automotive Systems My Money Securities Patels Airtemp (India)
Maa Jagdambe Tradelinks Nagarjuna Agri Tech Pawansut Holdings
Maan Aluminium Nakoda PBA Infrastructure
Macro International NAM Securities PDS Multinational Fashions
Madhucon Projects National Fittings Pearl Agriculture
Madhur Capital & Finance National Plastic Industries Pearl Electronics
Madhur Industries National Standard (India) Perfect-Octave Media Projects
Magna Industries & Exports NB Footwear Phaarmasia
Mahalaxmi Seamless ND Metal Industries Pharmaids Pharmaceuticals
Mahan Industries Nectar Lifesciences Photoquip (India)
Mahanagar Telephone Nigam Neelkanth Technologies Piccadily Agro Industries
Maharashtra Corporation Neha International Piccadily Sugar & Allied Industries
Mahaveer Infoway Neo Corp International Pipavav Defence and Offshore Engineering Company
Mahavir Industries Net 4 India PM Telelinks
Maithan Alloys Networth Stock Broking Polo Hotels
Majestic Auto Neuland Laboratories Polson
Malwa Cotton Spinning Mills New Markets Advisory Polyplex Corporation
Manappuram Finance Nexus Commodities And Technologies Power Finance Corporation
Mangal Credit and Fincorp Neycer India Prag Bosimi Synthetics
Mangalam Organics NHC Foods Prajay Engineers Syndicate
Manipal Finance Corporation Nicco Uco Alliance Credit Prakash Woollen & Synthetic Mills
Mansoon Trading Company Nihar Info Global Prashant India
Marathon Nextgen Realty Nikhil Adhesives Pratiksha Chemicals
Maruti Infrastructure Nila Infrastructures Precious Trading & Investments
Mathew Easow Research Securities Nimbus Foods Industries Precision Electronics
Maximaa Systems Nissan Copper Prime Capital Market
Mayur Leather Products Nitin Fire Protection Industries Prime Property Development Corporation
Mazda Properties Noida Medicare Centre Prism Medico and Pharmacy
MBI Intercorp Northlink Fiscal and Capital Services Professional Diamonds
MBL Infrastructures Northward Technologies Proto Developers & Technologies
Mcdowell Holdings Nouveau Global Ventures Punj Lloyd
Medicamen Biotech NR International Puravankara Projects
Megh Mayur Infra NTC Industries Purshottam Investofin
Meglon Infra-Real (India) Nutraplus India Quasar India
Melstar Information Technologies Nuway Organic Naturals India Radaan Mediaworks India
Mercury Metals Odyssey Corporation Radha Madhav Corporation
Metal Coatings (India) OK Play India Radhe Developers (India)
Metalyst Forgings Olympia Capitals Raghunath International
Metropoli Overseas Olympia Industries Rai Saheb Rekhchand Mohota Spinning & Weaving Mills
MIC Electronics Omega Ag-Seeds (Punjab) Rain Industries
Midland Polymers Omnitex Industries (India) Rainbow Foundations
Midwest Gold Onelife Capital Advisors Raj Oil Mills
Milk Partners India Opto Circuits (India) Raj Rayon Industries
Milkfood Orbit Corporation Raja Bahadur International
Minal Industries Oricon Enterprises Rajesh Solvex
Mini Diamonds (India) Orient Green Power Company Rajlaxmi Industries
Minolta Finance Oriental Veneer Products Rajoo Engineers
Modern Malleables Ortin Laboratories Rajvir Industries
Mohite Industries Oxford Industries Ram Info
Monnet Ispat & Energy Pacific Industries Ramsons Projects
Moving Picture Company (India) Padmanabh Industries Ranjit Securities
MP Agro Industries Pagaria Energy Rap Media
MPF Systems Pal Credit & Capital Rashel Agrotech
MPL Plastics Palco Metals Rathi Steel & Power

Exp
ecte
d R
esu
lts
on
14
Au
gu
st 2
015
Co Name Co Name Co Name
Ravindra Energy Sharad Fibres & Yarn Processors Sunraj Diamond Exports
RDB Rasayans Sharda Ispat Sunrise Asian
Regal Entertainment & Consultants Sharma East India Hospitals & Medical Research Superhouse
Rekvina Laboratories Sharp India Superspace Infrastructure
Reliance Capital Sharp Investments Supreme Infrastructure India
Reliance Communications Shilchar Technologies Surya Funcity
Remi Edelstahl Tubulars Shilpi Cable Technologies Surya Industrial Corporation
Remi Elektrotechnik Shiva Cement Suryakrupa Finance
Remi Process Plant & Machinery Shiva Global Agro Industries Suryanagri Fin-Lease
Remi Sales & Engg. Shivalik Rasayan Suven Life Sciences
Remi Securities Shiv-Vani Oil & Gas Exploration Services SVP Global Ventures
Responsive Industries Shree Metalloys Syncom Healthcare
Richa Industries Shree Rajivlochan Oil Extraction Synthiko Foils
RISA International Shree Salasar Investments Syschem (India)
Rishab Special Yarns Shreejal Info Hubs T&I Global
Rishabhdev Technocable Shreyas Intermediates Taaza International
Ritesh International Shri Krishna Devcon Taneja Aerospace & Aviation
Ritesh Properties & Industries Shri Lakshmi Cotsyn Tarai Foods
Rolta India Shricon Industries Tarang Projects & Consultant
Roopa Industries Shyamal Holdings & Trading Tarapur Transformers
Royale Manor Hotels & Industries Siddhartha Tubes Tarrif Cine & Finance
RPP Infra Projects SIEL Financial Services Tej Infoways
RR Securities Silver Oak (India) TeleCanor Global
RT Exports Silverline Technologies Terai Tea Company
RTCL Simbhaoli Sugars Thakkers Developers
Ruby Traders & Exporters Simran Farms Thomas Scott (India)
Ruchi Infrastructure Skypak Service Specialists Tilaknagar Industries
Ruchi Soya Industries Smilax Industries Tips Industries
Saboo Brothers Solid Stone Company Tirupati Foam
Saboo Sodium Chloro Som Datt Finance Corporation Tirupati Industries (India)
Sagar Soya Products Somi Conveyor Beltings Tirupati Inks
Sagar Systech Southern Ispat & Energy Total Hospitality
Sagar Tourist Resorts Sowbhagya Media Trans Financial Resources
Sahara Housingfina Corporation Speciality Papers Transchem
Sai Capital Spectacle Ventures Transgene Biotek
Sai Industries Spenta International Trend Electronics
Salguti Industries Spisys TRF
Sam Industries Splash Media & Infra Tricom Fruit Products
Sam Leaseco SPML Infra Tricom India
Sambhaav Media Sportking India Trio Mercantile & Trading
Samrat Pharmachem Springform Technology Triochem Products
Sanblue Corporation SPS International Triveni Engineering & Industries
Sanco Trans Square Four Projects India Triveni Turbine
Sanjivani Paranteral Sree Rayalaseema Hi-Strength Hypo Tuni Textile Mills
Sanmit Infra Sreeleathers Twinstar Industries
Sanmitra Commercial Sri Arumuga Enterprise Tyroon Tea Company
Sanwaria Agro Oils Sri Ganapathy Mills Company Unimin India
Sarda Papers SSK Lifestyles Unistar Multimedia
Sarthak Industries Star Paper Mills Unisys Softwares & Holding Industries
Sarvamangal Mercantile Company Starlite Components Unitech International
Sathavahana Ispat Starvox Electronics United Van Der Horst
Savera Industries Steel Authority Of India Universal Prime Aluminium
Scandent Imaging Stellant Securities (India) Upasana Finance
SDF Industries Sterling Biotech UTL Industries
Sea Gold Infrastructure Suchak Trading Uttam Value Steels
Selan Exploration Technology Suchitra Finance & Trading Co Vadilal Dairy International
Sen Pet (India) Sudar Industries Vaghani Techno-Build
Senbo Industries Sudarshan Chemical Industries Vakrangee
Shah Construction Company Sudev Industries Vallabh Steels
Shahi Shipping Sundram Fasteners Valson Industries
Shakti Press Sungold Capital Value Industries
Shamrock Industrial Company Sunil Industries Vantage Corporate Services

Exp
ecte
d R
esu
lts
on
14
Au
gu
st 2
015
Co Name Co Name
Vardhaman Laboratories VMS Industries
Vardhman Industries Voltamp Transformers
VB Industries Vora Constructions
Veer Energy & Infrastructure Walchandnagar Industries
Veerhealth Care Warner Multimedia
VenkyS (India) Websol Energy Systems
Vertical Industries Welterman International
Vibros Organics Winsome Yarns
Viceroy Hotels Yarn Syndicate
Videocon Industries YKM Industries
Vikas Granaries Yogi Infra Projects
Vimal Oil & Foods York Exports
Vinaditya Trading Company Yuvraaj Hygiene Product
Vinayak Polycon International Zen Technologies
Virgo Global Media Zenith Capitals
Virtual Global Education Zenith Computers
Virtualsoft Systems Zigma Software
Visa Steel Zodiac Ventures
Visagar Financial Services Zyden Gentec
Visu International Zylog Systems
Vital Communications
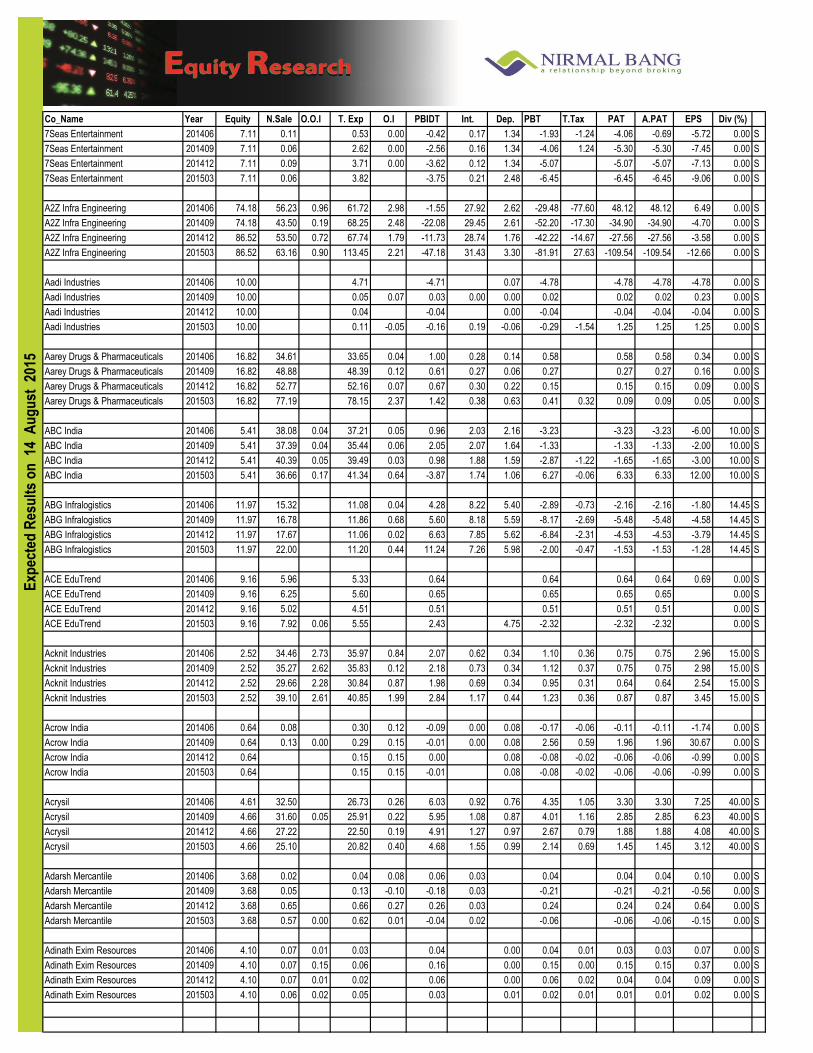
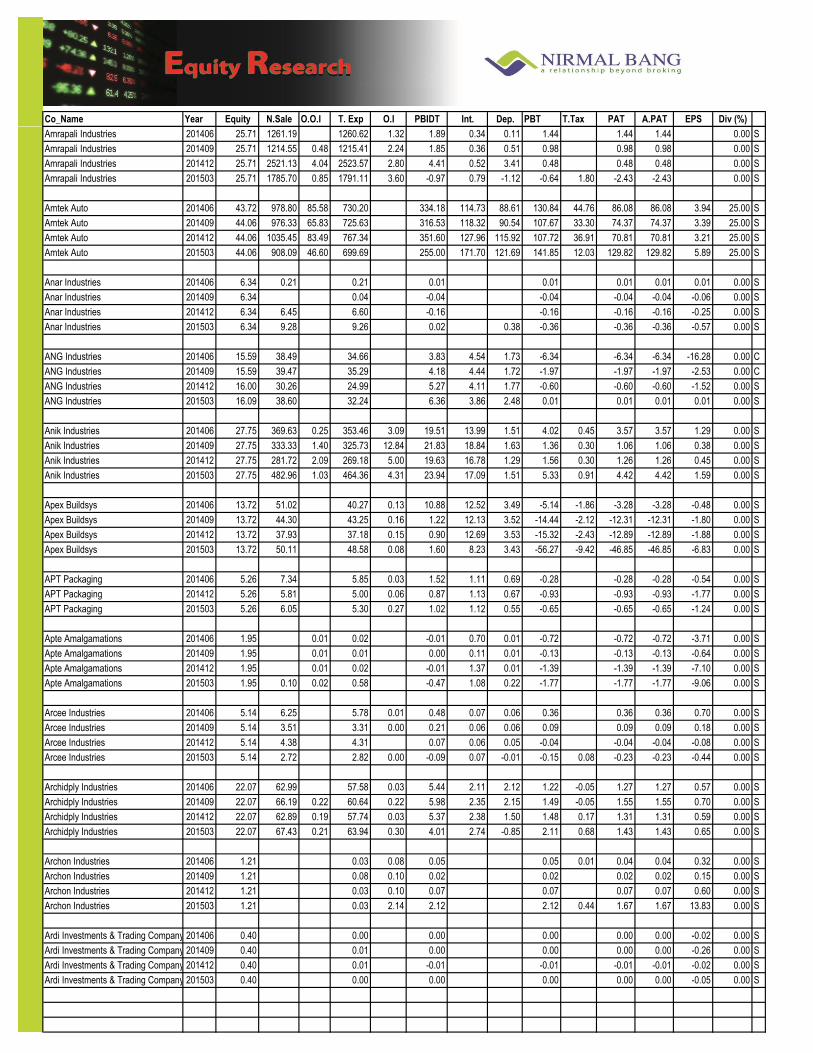
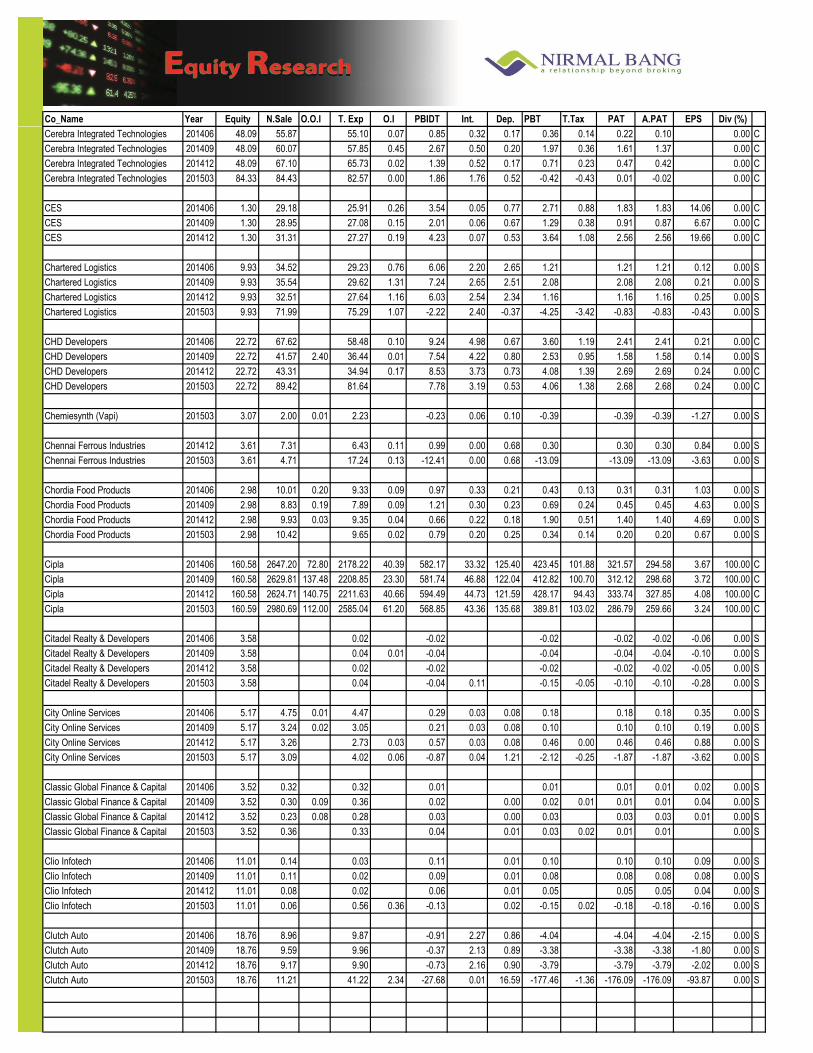
Co_Name Year Equity N.Sale O.O.I T. Exp O.I PBIDT Int. Dep. PBT T.Tax PAT A.PAT EPS Div (%)
7Seas Entertainment 201406 7.11 0.11 0.53 0.00 -0.42 0.17 1.34 -1.93 -1.24 -4.06 -0.69 -5.72 0.00 S
7Seas Entertainment 201409 7.11 0.06 2.62 0.00 -2.56 0.16 1.34 -4.06 1.24 -5.30 -5.30 -7.45 0.00 S
7Seas Entertainment 201412 7.11 0.09 3.71 0.00 -3.62 0.12 1.34 -5.07 -5.07 -5.07 -7.13 0.00 S
7Seas Entertainment 201503 7.11 0.06 3.82 -3.75 0.21 2.48 -6.45 -6.45 -6.45 -9.06 0.00 S
A2Z Infra Engineering 201406 74.18 56.23 0.96 61.72 2.98 -1.55 27.92 2.62 -29.48 -77.60 48.12 48.12 6.49 0.00 S
A2Z Infra Engineering 201409 74.18 43.50 0.19 68.25 2.48 -22.08 29.45 2.61 -52.20 -17.30 -34.90 -34.90 -4.70 0.00 S
A2Z Infra Engineering 201412 86.52 53.50 0.72 67.74 1.79 -11.73 28.74 1.76 -42.22 -14.67 -27.56 -27.56 -3.58 0.00 S
A2Z Infra Engineering 201503 86.52 63.16 0.90 113.45 2.21 -47.18 31.43 3.30 -81.91 27.63 -109.54 -109.54 -12.66 0.00 S
Aadi Industries 201406 10.00 4.71 -4.71 0.07 -4.78 -4.78 -4.78 -4.78 0.00 S
Aadi Industries 201409 10.00 0.05 0.07 0.03 0.00 0.00 0.02 0.02 0.02 0.23 0.00 S
Aadi Industries 201412 10.00 0.04 -0.04 0.00 -0.04 -0.04 -0.04 -0.04 0.00 S
Aadi Industries 201503 10.00 0.11 -0.05 -0.16 0.19 -0.06 -0.29 -1.54 1.25 1.25 1.25 0.00 S
Aarey Drugs & Pharmaceuticals 201406 16.82 34.61 33.65 0.04 1.00 0.28 0.14 0.58 0.58 0.58 0.34 0.00 S
Aarey Drugs & Pharmaceuticals 201409 16.82 48.88 48.39 0.12 0.61 0.27 0.06 0.27 0.27 0.27 0.16 0.00 S
Aarey Drugs & Pharmaceuticals 201412 16.82 52.77 52.16 0.07 0.67 0.30 0.22 0.15 0.15 0.15 0.09 0.00 S
Aarey Drugs & Pharmaceuticals 201503 16.82 77.19 78.15 2.37 1.42 0.38 0.63 0.41 0.32 0.09 0.09 0.05 0.00 S
ABC India 201406 5.41 38.08 0.04 37.21 0.05 0.96 2.03 2.16 -3.23 -3.23 -3.23 -6.00 10.00 S
ABC India 201409 5.41 37.39 0.04 35.44 0.06 2.05 2.07 1.64 -1.33 -1.33 -1.33 -2.00 10.00 S
ABC India 201412 5.41 40.39 0.05 39.49 0.03 0.98 1.88 1.59 -2.87 -1.22 -1.65 -1.65 -3.00 10.00 S
ABC India 201503 5.41 36.66 0.17 41.34 0.64 -3.87 1.74 1.06 6.27 -0.06 6.33 6.33 12.00 10.00 S
ABG Infralogistics 201406 11.97 15.32 11.08 0.04 4.28 8.22 5.40 -2.89 -0.73 -2.16 -2.16 -1.80 14.45 S
ABG Infralogistics 201409 11.97 16.78 11.86 0.68 5.60 8.18 5.59 -8.17 -2.69 -5.48 -5.48 -4.58 14.45 S
ABG Infralogistics 201412 11.97 17.67 11.06 0.02 6.63 7.85 5.62 -6.84 -2.31 -4.53 -4.53 -3.79 14.45 S
ABG Infralogistics 201503 11.97 22.00 11.20 0.44 11.24 7.26 5.98 -2.00 -0.47 -1.53 -1.53 -1.28 14.45 S
ACE EduTrend 201406 9.16 5.96 5.33 0.64 0.64 0.64 0.64 0.69 0.00 S
ACE EduTrend 201409 9.16 6.25 5.60 0.65 0.65 0.65 0.65 0.00 S
ACE EduTrend 201412 9.16 5.02 4.51 0.51 0.51 0.51 0.51 0.00 S
ACE EduTrend 201503 9.16 7.92 0.06 5.55 2.43 4.75 -2.32 -2.32 -2.32 0.00 S
Acknit Industries 201406 2.52 34.46 2.73 35.97 0.84 2.07 0.62 0.34 1.10 0.36 0.75 0.75 2.96 15.00 S
Acknit Industries 201409 2.52 35.27 2.62 35.83 0.12 2.18 0.73 0.34 1.12 0.37 0.75 0.75 2.98 15.00 S
Acknit Industries 201412 2.52 29.66 2.28 30.84 0.87 1.98 0.69 0.34 0.95 0.31 0.64 0.64 2.54 15.00 S
Acknit Industries 201503 2.52 39.10 2.61 40.85 1.99 2.84 1.17 0.44 1.23 0.36 0.87 0.87 3.45 15.00 S
Acrow India 201406 0.64 0.08 0.30 0.12 -0.09 0.00 0.08 -0.17 -0.06 -0.11 -0.11 -1.74 0.00 S
Acrow India 201409 0.64 0.13 0.00 0.29 0.15 -0.01 0.00 0.08 2.56 0.59 1.96 1.96 30.67 0.00 S
Acrow India 201412 0.64 0.15 0.15 0.00 0.08 -0.08 -0.02 -0.06 -0.06 -0.99 0.00 S
Acrow India 201503 0.64 0.15 0.15 -0.01 0.08 -0.08 -0.02 -0.06 -0.06 -0.99 0.00 S
Acrysil 201406 4.61 32.50 26.73 0.26 6.03 0.92 0.76 4.35 1.05 3.30 3.30 7.25 40.00 S
Acrysil 201409 4.66 31.60 0.05 25.91 0.22 5.95 1.08 0.87 4.01 1.16 2.85 2.85 6.23 40.00 S
Acrysil 201412 4.66 27.22 22.50 0.19 4.91 1.27 0.97 2.67 0.79 1.88 1.88 4.08 40.00 S
Acrysil 201503 4.66 25.10 20.82 0.40 4.68 1.55 0.99 2.14 0.69 1.45 1.45 3.12 40.00 S
Adarsh Mercantile 201406 3.68 0.02 0.04 0.08 0.06 0.03 0.04 0.04 0.04 0.10 0.00 S
Adarsh Mercantile 201409 3.68 0.05 0.13 -0.10 -0.18 0.03 -0.21 -0.21 -0.21 -0.56 0.00 S
Adarsh Mercantile 201412 3.68 0.65 0.66 0.27 0.26 0.03 0.24 0.24 0.24 0.64 0.00 S
Adarsh Mercantile 201503 3.68 0.57 0.00 0.62 0.01 -0.04 0.02 -0.06 -0.06 -0.06 -0.15 0.00 S
Adinath Exim Resources 201406 4.10 0.07 0.01 0.03 0.04 0.00 0.04 0.01 0.03 0.03 0.07 0.00 S
Adinath Exim Resources 201409 4.10 0.07 0.15 0.06 0.16 0.00 0.15 0.00 0.15 0.15 0.37 0.00 S
Adinath Exim Resources 201412 4.10 0.07 0.01 0.02 0.06 0.00 0.06 0.02 0.04 0.04 0.09 0.00 S
Adinath Exim Resources 201503 4.10 0.06 0.02 0.05 0.03 0.01 0.02 0.01 0.01 0.01 0.02 0.00 S
Exp
ecte
d R
esu
lts
on
14
Au
gu
st 2
015

Co_Name Year Equity N.Sale O.O.I T. Exp O.I PBIDT Int. Dep. PBT T.Tax PAT A.PAT EPS Div (%)
Exp
ecte
d R
esu
lts
on
14
Au
gu
st 2
015
Adinath Textiles 201406 6.81 0.22 0.25 0.29 0.19 0.04 0.14 0.03 0.11 0.11 0.16 0.00 S
Adinath Textiles 201409 6.81 0.19 0.27 0.33 0.13 0.04 0.09 0.03 0.05 0.05 0.08 0.00 S
Adinath Textiles 201412 6.81 0.22 0.28 0.36 0.14 0.04 0.10 0.00 0.09 0.09 0.14 0.00 S
Adinath Textiles 201503 6.84 0.26 0.30 0.42 0.00 0.14 0.04 0.10 0.03 0.06 0.06 0.09 0.00 S
ADS Diagnostic 201406 2.19 1.47 0.01 1.37 0.12 0.02 0.07 0.03 0.03 0.03 0.14 0.00 S
ADS Diagnostic 201409 2.19 2.74 0.02 2.50 0.26 0.11 0.07 0.09 0.09 0.09 0.40 0.00 S
ADS Diagnostic 201412 2.19 1.21 0.02 1.09 0.13 0.03 0.08 0.02 0.02 0.02 0.09 0.00 S
ADS Diagnostic 201503 2.19 2.01 0.08 1.79 0.31 0.16 0.08 0.06 0.06 0.06 0.26 0.00 S
Advance Multitech 201406 4.03 3.29 2.90 0.39 0.18 0.13 0.08 0.08 0.08 0.02 0.00 S
Advance Multitech 201409 4.03 2.33 0.01 1.98 0.36 0.21 0.13 0.02 0.02 0.02 0.00 S
Advance Multitech 201412 4.03 3.60 0.01 3.05 0.56 0.20 0.13 0.23 0.08 0.15 0.15 0.37 0.00 S
Advance Multitech 201503 4.03 3.86 0.06 3.38 0.55 0.26 0.35 -0.07 -0.11 0.06 0.05 0.01 0.00 S
Advance Petrochemicals 201406 0.90 2.64 2.50 0.14 0.09 0.03 0.02 0.02 0.02 0.02 0.00 S
Advance Petrochemicals 201409 0.90 3.37 3.22 0.01 0.16 0.10 0.03 0.03 0.03 0.03 0.03 0.00 S
Advance Petrochemicals 201412 0.90 3.56 3.40 0.16 0.10 0.03 0.03 0.03 0.03 0.03 0.00 S
Advance Petrochemicals 201503 0.90 2.84 0.00 2.51 0.33 0.16 0.10 0.07 0.09 -0.01 -0.02 -0.01 0.00 S
Advance Powerinfra Tech 201406 11.64 0.53 0.55 0.06 0.05 0.02 0.03 0.01 0.02 0.02 0.02 0.00 S
Advance Powerinfra Tech 201409 11.64 0.12 0.19 0.10 0.02 0.00 0.02 0.01 0.00 0.00 0.00 0.01 0.00 S
Advance Powerinfra Tech 201412 11.64 3.13 3.17 0.08 0.04 0.02 0.03 0.01 0.02 0.02 0.01 0.00 S
Advance Powerinfra Tech 201503 11.64 6.74 0.99 7.68 0.05 0.00 0.01 0.03 0.01 0.03 0.03 0.00 S
Advanced Micronic Devices 201406 5.28 2.19 4.14 1.05 -0.90 0.29 0.94 -2.13 0.33 -2.45 -2.45 -4.64 0.00 S
Advanced Micronic Devices 201409 5.28 1.68 2.41 2.10 1.37 0.25 0.94 2.11 -0.33 2.44 2.44 4.61 0.00 S
Advanced Micronic Devices 201412 5.28 1.95 2.58 0.58 -0.06 0.19 0.96 -1.21 -1.21 -1.21 -2.29 0.00 S
Advanced Micronic Devices 201503 5.28 1.67 3.96 1.26 -1.03 0.62 0.94 -2.58 -2.58 -2.58 -4.88 0.00 S
AF Enterprises 201406 4.00 0.95 0.07 1.01 0.01 0.01 0.00 0.01 0.01 0.02 0.00 S
AF Enterprises 201409 4.00 1.05 0.07 1.11 0.01 0.00 0.01 0.00 0.01 0.01 0.02 0.00 S
AF Enterprises 201412 4.00 1.32 0.07 1.37 0.02 0.02 0.01 0.01 0.01 0.03 0.00 S
AF Enterprises 201503 4.00 7.53 0.02 7.52 0.01 0.01 0.01 0.01 0.03 0.00 S
Aftek 201406 22.04 15.32 0.98 0.01 14.35 1.97 14.44 -2.07 -2.07 -2.07 -0.19 0.00 S
Aftek 201409 22.04 12.41 1.07 5.08 16.42 1.96 14.59 -0.13 -0.13 -0.13 -0.01 0.00 S
Aftek 201412 22.04 12.39 1.08 5.11 16.42 1.93 14.59 -0.11 -0.11 -0.11 -0.01 0.00 S
Aftek 201503 22.04 12.43 18.02 2.68 -2.91 1.92 12.36 -17.19 -17.19 -17.19 -1.56 0.00 S
Agarwal Industrial Corporation 201406 5.51 52.33 8.64 55.97 0.02 5.02 0.89 1.02 3.11 0.76 2.35 2.35 4.26 14.00 C
Agarwal Industrial Corporation 201409 5.51 10.66 9.48 17.27 0.02 2.90 0.79 1.02 1.09 0.35 0.74 0.74 1.33 14.00 C
Agarwal Industrial Corporation 201412 5.51 60.00 9.54 66.10 0.16 3.60 1.14 1.15 1.32 0.45 0.87 0.87 1.58 14.00 C
Agarwal Industrial Corporation 201503 5.51 63.13 10.70 69.12 0.36 5.07 1.14 1.11 2.83 0.91 1.92 1.92 14.00 C
Agio Paper & Industries 201406 16.13 0.21 0.02 -0.19 1.35 0.08 -1.61 -1.61 -1.61 -1.00 0.00 S
Agio Paper & Industries 201409 16.13 0.03 0.32 0.03 -0.27 1.41 0.07 -1.75 -1.75 -1.75 -1.08 0.00 S
Agio Paper & Industries 201412 16.13 0.00 0.18 0.03 -0.15 1.47 0.07 -1.69 -1.69 -1.69 -1.05 0.00 S
Agio Paper & Industries 201503 16.13 0.03 0.31 8.85 8.56 0.07 8.48 8.48 8.48 5.26 0.00 S
Agro Dutch Industries 201406 54.37 1.97 0.01 3.71 0.01 -1.72 11.07 3.97 -14.95 -14.95 -14.95 -2.75 0.00 S
Agro Dutch Industries 201409 54.37 2.64 4.36 0.15 -1.58 11.48 3.94 -17.00 -17.00 -17.00 -2.72 0.00 S
Agro Dutch Industries 201412 54.37 2.56 0.01 3.35 -0.16 -0.93 11.76 3.91 -14.71 -14.71 -14.71 -2.71 0.00 S
Agro Dutch Industries 201503 54.37 1.64 6.65 1.59 -3.42 11.78 8.46 -24.06 -2.86 -21.20 -21.20 -3.90 0.00 S
Aikyam Intellectual Property Consultancy201406 4.36 0.02 0.03 0.01 0.01 0.01 0.01 0.00 S
Aikyam Intellectual Property Consultancy201409 4.61 0.05 0.04 0.01 0.01 0.01 0.01 0.00 S
Aikyam Intellectual Property Consultancy201412 4.61 0.02 -0.02 -0.02 -0.02 -0.02 0.00 S
Aikyam Intellectual Property Consultancy201503 4.61 0.03 0.04 -0.01 -0.01 -0.01 -0.01 0.00 S

Co_Name Year Equity N.Sale O.O.I T. Exp O.I PBIDT Int. Dep. PBT T.Tax PAT A.PAT EPS Div (%)
Exp
ecte
d R
esu
lts
on
14
Au
gu
st 2
015
Aimco Pesticides 201406 9.24 46.30 0.19 44.84 0.01 1.65 0.06 0.11 1.48 -0.02 1.51 1.51 1.63 0.00 S
Aimco Pesticides 201409 9.24 51.41 0.07 49.57 0.01 1.92 0.05 0.07 1.79 -0.03 1.82 1.82 1.97 0.00 S
Aimco Pesticides 201412 9.24 38.39 0.07 37.93 0.01 0.53 0.06 0.11 0.37 0.01 0.35 0.35 0.38 0.00 S
Aimco Pesticides 201503 9.24 28.36 0.13 28.24 0.01 0.26 0.13 0.32 -0.19 0.41 -0.59 -0.59 -0.64 0.00 S
Aishwarya Technologies and Telecom201406 10.78 5.41 5.05 0.00 0.37 0.26 0.22 -0.11 -0.10 -0.01 -0.01 -0.01 0.00 S
Aishwarya Technologies and Telecom201409 10.78 6.17 5.72 0.06 0.51 0.28 0.43 -0.20 -0.20 -0.20 -0.09 0.00 S
Aishwarya Technologies and Telecom201412 10.78 9.44 9.44 0.04 0.03 0.27 0.17 -0.42 -0.12 -0.29 -0.29 -0.14 0.00 S
Aishwarya Technologies and Telecom201503 10.78 10.72 11.47 0.15 -0.60 0.31 0.34 -1.24 0.28 -1.52 -1.52 -0.71 0.00 S
Ajel 201406 11.65 8.21 8.06 0.15 0.11 0.04 0.04 0.04 0.03 0.00 C
Ajel 201409 11.65 7.11 6.92 0.19 0.03 0.16 0.16 0.16 0.13 0.00 C
Ajel 201412 11.65 8.20 8.15 0.05 0.02 0.02 0.02 0.02 0.02 0.00 C
Ajel 201503 11.65 0.83 2.37 4.24 2.70 0.08 0.93 1.69 1.69 1.69 1.45 0.00 C
AK Capital Services 201406 6.60 20.03 10.93 0.71 9.81 2.56 0.55 6.70 1.35 5.35 5.35 8.11 60.00 S
AK Capital Services 201409 6.60 17.74 8.58 0.73 9.89 3.07 0.53 6.29 2.10 4.19 4.19 6.35 60.00 S
AK Capital Services 201412 6.60 22.99 10.52 0.78 13.26 6.56 0.50 6.20 2.17 4.03 4.03 6.11 60.00 S
AK Capital Services 201503 6.60 251.12 115.96 3.55 138.71 76.84 2.77 59.10 17.64 41.46 41.14 62.34 60.00 C
Akzo Nobel India 201406 46.66 627.93 13.17 574.62 29.17 95.65 0.63 13.31 84.38 29.20 55.18 55.18 11.83 200.00 S
Akzo Nobel India 201409 46.66 592.69 14.02 553.63 15.42 68.50 0.41 12.71 55.38 19.63 35.75 35.75 7.66 200.00 S
Akzo Nobel India 201412 46.66 671.41 15.61 606.64 6.78 87.16 0.30 12.86 74.00 23.26 50.74 50.74 10.87 200.00 S
Akzo Nobel India 201503 44.66 577.78 14.40 530.67 13.63 75.12 0.15 13.71 61.26 16.62 44.64 44.64 9.67 200.00 S
Alfavision Overseas (India) 201406 3.15 9.92 0.06 9.79 0.19 0.00 0.18 0.18 0.18 0.58 0.00 S
Alfavision Overseas (India) 201409 3.15 14.48 0.06 14.52 0.02 0.00 0.02 0.02 0.02 0.06 0.00 S
Alfavision Overseas (India) 201412 3.15 11.77 0.10 11.85 0.03 0.00 0.02 0.02 0.02 0.08 0.00 S
Alfavision Overseas (India) 201503 3.15 11.85 0.29 12.10 0.04 0.01 0.03 0.03 0.03 0.08 0.00 S
Allied Digital Services 201406 23.09 68.17 -1.51 65.49 1.57 2.74 3.44 6.24 -7.13 0.19 -7.32 -7.29 -1.58 0.00 C
Allied Digital Services 201409 23.09 60.63 6.26 49.62 0.03 17.30 4.07 6.84 6.33 0.10 6.23 6.14 1.33 0.00 C
Allied Digital Services 201412 23.09 54.00 -1.79 50.52 0.34 2.03 2.88 7.78 -8.80 -1.36 -7.44 -7.81 -1.69 0.00 C
Allied Digital Services 201503 23.09 50.96 -0.12 34.01 6.06 22.89 5.72 6.84 10.94 -1.28 12.22 12.95 2.80 0.00 C
Alufluoride 201406 7.00 6.24 6.05 0.27 0.45 0.00 0.12 0.34 -0.31 0.65 0.65 0.92 0.00 S
Alufluoride 201409 7.00 5.78 4.68 0.53 1.63 0.00 0.13 1.50 0.48 1.02 1.02 1.46 0.00 S
Alufluoride 201412 7.00 5.67 5.26 0.51 0.92 0.00 0.11 0.81 0.08 0.73 0.73 1.04 0.00 S
Alufluoride 201503 7.00 4.24 3.57 0.50 1.17 0.26 0.90 0.29 0.61 0.61 0.87 0.00 S
Amara Raja Batteries 201406 17.08 1024.85 4.18 853.50 5.88 181.41 0.02 30.96 150.43 44.47 105.96 105.96 6.20 361.00 S
Amara Raja Batteries 201409 17.08 1060.23 5.36 880.26 5.58 190.91 0.04 36.64 154.23 53.93 100.30 100.30 5.87 361.00 S
Amara Raja Batteries 201412 17.08 1059.55 6.90 886.40 4.70 184.75 0.06 28.80 155.89 53.55 102.34 102.34 5.99 361.00 S
Amara Raja Batteries 201503 17.08 1066.70 3.14 882.09 6.56 194.31 0.12 37.60 149.31 47.05 102.26 102.26 5.99 361.00 S
Ambalal Sarabhai Enterprises 201406 76.63 4.26 7.48 0.35 -2.87 2.95 0.75 -6.57 -6.57 -6.57 -0.86 0.00 S
Ambalal Sarabhai Enterprises 201409 76.63 4.23 7.25 0.45 -2.58 2.96 0.75 -6.29 -6.29 -6.29 -0.82 0.00 S
Ambalal Sarabhai Enterprises 201412 76.63 4.96 7.76 0.31 -2.49 3.27 0.72 -6.48 -6.48 -6.48 -0.85 0.00 S
Ambalal Sarabhai Enterprises 201503 76.63 1.81 4.81 14.33 11.33 1.14 10.19 10.19 10.19 1.33 0.00 S
Ambica Agarbathies & Aroma Industries 201406 17.13 26.92 0.11 23.29 0.00 3.74 2.19 0.94 0.61 0.20 0.41 0.41 0.24 0.00 S
Ambica Agarbathies & Aroma Industries 201412 17.13 32.43 0.22 29.62 3.03 2.26 0.96 -0.19 -0.19 -0.19 -0.11 0.00 S
Ambica Agarbathies & Aroma Industries 201503 17.13 26.91 0.12 22.85 4.18 2.39 0.73 1.06 0.50 0.56 0.56 0.33 0.00 S
Amit International 201406 18.95 0.04 -0.04 0.01 -0.05 -0.05 -0.05 -0.10 0.00 S
Amit International 201409 18.95 0.02 0.00 -0.02 0.01 -0.03 -0.03 -0.03 -0.02 0.00 S
Amit International 201412 18.95 0.03 -0.03 0.01 -0.04 -0.04 -0.04 -0.02 0.00 S
Amit International 201503 18.95 0.75 0.92 0.22 0.05 0.06 -0.01 -0.01 -0.01 -0.01 0.00 S
Co_Name Year Equity N.Sale O.O.I T. Exp O.I PBIDT Int. Dep. PBT T.Tax PAT A.PAT EPS Div (%)
Exp
ecte
d R
esu
lts
on
14
Au
gu
st 2
015
Amrapali Industries 201406 25.71 1261.19 1260.62 1.32 1.89 0.34 0.11 1.44 1.44 1.44 0.00 S
Amrapali Industries 201409 25.71 1214.55 0.48 1215.41 2.24 1.85 0.36 0.51 0.98 0.98 0.98 0.00 S
Amrapali Industries 201412 25.71 2521.13 4.04 2523.57 2.80 4.41 0.52 3.41 0.48 0.48 0.48 0.00 S
Amrapali Industries 201503 25.71 1785.70 0.85 1791.11 3.60 -0.97 0.79 -1.12 -0.64 1.80 -2.43 -2.43 0.00 S
Amtek Auto 201406 43.72 978.80 85.58 730.20 334.18 114.73 88.61 130.84 44.76 86.08 86.08 3.94 25.00 S
Amtek Auto 201409 44.06 976.33 65.83 725.63 316.53 118.32 90.54 107.67 33.30 74.37 74.37 3.39 25.00 S
Amtek Auto 201412 44.06 1035.45 83.49 767.34 351.60 127.96 115.92 107.72 36.91 70.81 70.81 3.21 25.00 S
Amtek Auto 201503 44.06 908.09 46.60 699.69 255.00 171.70 121.69 141.85 12.03 129.82 129.82 5.89 25.00 S
Anar Industries 201406 6.34 0.21 0.21 0.01 0.01 0.01 0.01 0.01 0.00 S
Anar Industries 201409 6.34 0.04 -0.04 -0.04 -0.04 -0.04 -0.06 0.00 S
Anar Industries 201412 6.34 6.45 6.60 -0.16 -0.16 -0.16 -0.16 -0.25 0.00 S
Anar Industries 201503 6.34 9.28 9.26 0.02 0.38 -0.36 -0.36 -0.36 -0.57 0.00 S
ANG Industries 201406 15.59 38.49 34.66 3.83 4.54 1.73 -6.34 -6.34 -6.34 -16.28 0.00 C
ANG Industries 201409 15.59 39.47 35.29 4.18 4.44 1.72 -1.97 -1.97 -1.97 -2.53 0.00 C
ANG Industries 201412 16.00 30.26 24.99 5.27 4.11 1.77 -0.60 -0.60 -0.60 -1.52 0.00 S
ANG Industries 201503 16.09 38.60 32.24 6.36 3.86 2.48 0.01 0.01 0.01 0.01 0.00 S
Anik Industries 201406 27.75 369.63 0.25 353.46 3.09 19.51 13.99 1.51 4.02 0.45 3.57 3.57 1.29 0.00 S
Anik Industries 201409 27.75 333.33 1.40 325.73 12.84 21.83 18.84 1.63 1.36 0.30 1.06 1.06 0.38 0.00 S
Anik Industries 201412 27.75 281.72 2.09 269.18 5.00 19.63 16.78 1.29 1.56 0.30 1.26 1.26 0.45 0.00 S
Anik Industries 201503 27.75 482.96 1.03 464.36 4.31 23.94 17.09 1.51 5.33 0.91 4.42 4.42 1.59 0.00 S
Apex Buildsys 201406 13.72 51.02 40.27 0.13 10.88 12.52 3.49 -5.14 -1.86 -3.28 -3.28 -0.48 0.00 S
Apex Buildsys 201409 13.72 44.30 43.25 0.16 1.22 12.13 3.52 -14.44 -2.12 -12.31 -12.31 -1.80 0.00 S
Apex Buildsys 201412 13.72 37.93 37.18 0.15 0.90 12.69 3.53 -15.32 -2.43 -12.89 -12.89 -1.88 0.00 S
Apex Buildsys 201503 13.72 50.11 48.58 0.08 1.60 8.23 3.43 -56.27 -9.42 -46.85 -46.85 -6.83 0.00 S
APT Packaging 201406 5.26 7.34 5.85 0.03 1.52 1.11 0.69 -0.28 -0.28 -0.28 -0.54 0.00 S
APT Packaging 201412 5.26 5.81 5.00 0.06 0.87 1.13 0.67 -0.93 -0.93 -0.93 -1.77 0.00 S
APT Packaging 201503 5.26 6.05 5.30 0.27 1.02 1.12 0.55 -0.65 -0.65 -0.65 -1.24 0.00 S
Apte Amalgamations 201406 1.95 0.01 0.02 -0.01 0.70 0.01 -0.72 -0.72 -0.72 -3.71 0.00 S
Apte Amalgamations 201409 1.95 0.01 0.01 0.00 0.11 0.01 -0.13 -0.13 -0.13 -0.64 0.00 S
Apte Amalgamations 201412 1.95 0.01 0.02 -0.01 1.37 0.01 -1.39 -1.39 -1.39 -7.10 0.00 S
Apte Amalgamations 201503 1.95 0.10 0.02 0.58 -0.47 1.08 0.22 -1.77 -1.77 -1.77 -9.06 0.00 S
Arcee Industries 201406 5.14 6.25 5.78 0.01 0.48 0.07 0.06 0.36 0.36 0.36 0.70 0.00 S
Arcee Industries 201409 5.14 3.51 3.31 0.00 0.21 0.06 0.06 0.09 0.09 0.09 0.18 0.00 S
Arcee Industries 201412 5.14 4.38 4.31 0.07 0.06 0.05 -0.04 -0.04 -0.04 -0.08 0.00 S
Arcee Industries 201503 5.14 2.72 2.82 0.00 -0.09 0.07 -0.01 -0.15 0.08 -0.23 -0.23 -0.44 0.00 S
Archidply Industries 201406 22.07 62.99 57.58 0.03 5.44 2.11 2.12 1.22 -0.05 1.27 1.27 0.57 0.00 S
Archidply Industries 201409 22.07 66.19 0.22 60.64 0.22 5.98 2.35 2.15 1.49 -0.05 1.55 1.55 0.70 0.00 S
Archidply Industries 201412 22.07 62.89 0.19 57.74 0.03 5.37 2.38 1.50 1.48 0.17 1.31 1.31 0.59 0.00 S
Archidply Industries 201503 22.07 67.43 0.21 63.94 0.30 4.01 2.74 -0.85 2.11 0.68 1.43 1.43 0.65 0.00 S
Archon Industries 201406 1.21 0.03 0.08 0.05 0.05 0.01 0.04 0.04 0.32 0.00 S
Archon Industries 201409 1.21 0.08 0.10 0.02 0.02 0.02 0.02 0.15 0.00 S
Archon Industries 201412 1.21 0.03 0.10 0.07 0.07 0.07 0.07 0.60 0.00 S
Archon Industries 201503 1.21 0.03 2.14 2.12 2.12 0.44 1.67 1.67 13.83 0.00 S
Ardi Investments & Trading Company 201406 0.40 0.00 0.00 0.00 0.00 0.00 -0.02 0.00 S
Ardi Investments & Trading Company 201409 0.40 0.01 0.00 0.00 0.00 0.00 -0.26 0.00 S
Ardi Investments & Trading Company 201412 0.40 0.01 -0.01 -0.01 -0.01 -0.01 -0.02 0.00 S
Ardi Investments & Trading Company 201503 0.40 0.00 0.00 0.00 0.00 0.00 -0.05 0.00 S

Co_Name Year Equity N.Sale O.O.I T. Exp O.I PBIDT Int. Dep. PBT T.Tax PAT A.PAT EPS Div (%)
Exp
ecte
d R
esu
lts
on
14
Au
gu
st 2
015
Arihant Avenues & Credit 201406 7.32 0.11 0.06 0.05 0.05 0.02 0.03 0.03 0.04 0.00 S
Arihant Avenues & Credit 201409 7.32 0.11 0.02 0.10 0.10 0.04 0.06 0.06 0.00 S
Arihant Avenues & Credit 201412 7.32 0.11 0.06 0.05 0.05 0.02 0.04 0.04 0.05 0.00 S
Arihant Avenues & Credit 201503 7.32 0.11 0.23 -0.12 -0.12 -0.12 -0.12 0.00 S
Arihant Multi Commercial 201406 3.62 13.84 13.73 0.44 0.55 0.00 0.55 0.55 0.55 0.15 0.00 S
Arihant Multi Commercial 201409 3.62 11.25 11.23 0.44 0.46 0.00 0.46 0.46 0.46 0.13 0.00 S
Arihant Multi Commercial 201412 3.62 8.82 0.45 8.79 0.47 0.00 0.47 0.47 0.47 0.13 0.00 S
Arihant Multi Commercial 201503 3.62 8.80 9.69 0.33 -0.57 0.00 -0.57 -0.57 -0.57 -0.16 0.00 S
Arora Fibres 201406 10.05 13.46 13.41 0.05 0.23 0.23 -0.41 -0.41 -0.41 -0.40 0.00 S
Arora Fibres 201409 10.05 11.01 10.04 0.96 0.30 0.23 0.43 3.45 0.43 3.44 0.00 S
Arora Fibres 201412 10.05 5.15 5.14 0.04 0.05 0.30 0.23 -0.48 -0.48 -0.48 -0.48 0.00 S
Arora Fibres 201503 10.05 5.89 6.00 -0.11 -0.11 0.40 -0.40 -0.40 -0.40 -0.39 0.00 S
Arrow Coated Products 201406 11.74 2.71 1.12 0.22 1.81 0.08 1.73 0.45 1.28 1.28 1.09 15.00 S
Arrow Coated Products 201409 11.74 5.86 3.38 0.34 2.82 0.09 2.72 0.75 1.97 1.97 1.68 15.00 S
Arrow Coated Products 201412 11.74 6.03 3.57 0.24 2.71 0.13 2.57 0.45 2.12 2.12 1.81 15.00 S
Arrow Coated Products 201503 11.74 5.29 2.73 0.37 2.93 0.54 2.34 1.20 1.14 1.14 0.97 15.00 S
Artech Power Products 201406 3.77 0.02 -0.02 -0.02 -0.02 -0.02 -0.06 0.00 S
Artech Power Products 201409 3.77 0.01 -0.01 -0.01 -0.01 -0.01 0.00 S
Artech Power Products 201412 14.84 0.13 -0.13 -0.13 -0.13 -0.13 -0.09 0.00 S
Artech Power Products 201503 14.84 0.19 -0.19 -0.19 -0.19 -0.19 -0.12 0.00 S
Artefact Projects 201406 5.53 5.05 3.87 0.51 1.68 0.73 0.20 0.76 0.34 0.42 0.42 0.75 7.50 S
Artefact Projects 201409 5.53 5.45 4.20 0.11 1.36 0.82 0.23 0.31 0.19 0.13 0.13 0.23 7.50 S
Artefact Projects 201412 5.53 4.71 3.89 0.43 1.25 0.74 0.20 0.31 0.11 0.20 0.20 0.36 7.50 S
Artefact Projects 201503 5.53 4.66 3.73 0.11 1.03 0.79 0.22 0.03 -0.13 0.16 0.16 0.31 7.50 S
Aseem Global 201406 10.58 48.45 0.13 47.17 0.01 1.42 1.24 0.06 0.12 0.03 0.09 0.09 0.08 1.00 S
Aseem Global 201409 10.58 87.70 0.13 89.12 0.02 -1.27 1.36 0.06 -2.69 -0.02 -2.67 -2.67 -2.52 1.00 S
Aseem Global 201412 10.58 42.37 0.03 43.50 0.01 -1.10 1.34 0.06 -2.44 0.03 -2.47 -2.47 -2.33 1.00 S
Aseem Global 201503 10.58 55.35 0.24 59.25 0.01 -3.66 1.02 0.11 -4.79 0.01 -4.80 -4.80 -4.54 1.00 S
Ashiana Ispat 201406 4.26 68.52 65.50 3.02 1.60 0.39 1.03 0.33 0.70 0.70 6.53 0.00 S
Ashiana Ispat 201409 4.26 69.29 67.72 1.57 1.01 0.39 0.16 0.01 0.16 0.16 3.91 0.00 S
Ashiana Ispat 201412 4.26 64.42 0.06 62.90 1.59 0.93 0.39 0.26 0.07 0.19 0.19 1.80 0.00 S
Ashiana Ispat 201503 4.26 65.93 2.46 64.01 4.38 2.56 0.35 1.47 0.53 0.95 0.95 2.22 0.00 S
Asis Logistics 201406 0.75 8.15 8.67 0.05 -0.47 0.02 2.05 -2.54 -2.54 -2.54 -803.33 0.00 S
Asis Logistics 201409 0.75 7.86 7.76 0.02 0.12 0.02 1.45 -1.35 -1.35 -1.35 -178.74 0.00 S
Asis Logistics 201412 0.75 10.24 9.75 0.02 0.51 0.02 1.75 -1.26 -1.26 -1.26 -167.14 0.00 S
Asis Logistics 201503 0.75 22.10 35.02 0.10 -12.83 1.23 3.78 -17.83 -17.83 -17.83 -356.68 0.00 S
ASM Technologies 201406 5.00 41.63 0.00 35.51 0.36 6.48 1.61 0.35 4.52 1.59 2.93 2.93 5.86 20.00 C
ASM Technologies 201409 5.00 40.75 0.01 36.34 0.58 5.00 0.97 0.36 3.68 1.08 2.60 2.60 5.19 20.00 C
ASM Technologies 201412 5.00 38.79 0.00 35.75 0.00 3.05 1.26 0.36 1.43 0.90 0.53 0.53 1.06 20.00 C
ASM Technologies 201503 5.00 42.68 0.03 39.52 -0.91 2.27 1.55 0.65 0.08 1.10 -1.02 -1.02 -2.04 20.00 C
Associated Alcohols & Breweries 201406 9.04 79.50 0.91 71.48 8.93 2.00 1.87 5.06 1.08 3.99 3.99 4.41 0.00 C
Associated Alcohols & Breweries 201409 9.04 67.01 0.38 57.12 10.27 1.66 2.32 6.29 3.80 2.48 2.48 2.75 0.00 C
Associated Alcohols & Breweries 201412 9.04 76.74 0.20 69.74 7.21 1.50 2.10 3.61 0.90 2.71 2.71 3.00 0.00 C
Associated Alcohols & Breweries 201503 9.04 75.24 0.17 69.20 6.21 1.38 3.81 3.47 0.32 3.15 3.15 3.48 0.00 C
Associated Ceramics 201406 4.26 3.09 0.02 2.94 0.17 0.01 0.16 0.00 0.00 0.00 0.01 0.00 S
Associated Ceramics 201409 4.26 6.37 0.16 6.26 0.26 0.01 0.16 0.09 0.03 0.06 0.06 0.31 0.00 S
Associated Ceramics 201412 3.01 4.04 0.03 3.77 0.31 0.01 0.16 0.14 0.04 0.10 0.10 0.00 S
Associated Ceramics 201503 3.01 3.81 3.67 0.02 0.16 0.02 0.15 -0.02 -0.02 -0.02 -0.05 0.00 S

Co_Name Year Equity N.Sale O.O.I T. Exp O.I PBIDT Int. Dep. PBT T.Tax PAT A.PAT EPS Div (%)
Exp
ecte
d R
esu
lts
on
14
Au
gu
st 2
015
Asya Infosoft 201406 3.00 0.03 0.02 0.00 0.00 0.00 0.00 0.01 0.00 S
Asya Infosoft 201409 3.00 0.02 0.02 0.00 0.00 0.00 0.00 0.00 S
Asya Infosoft 201412 3.00 0.02 0.01 0.00 0.00 0.00 0.00 0.01 0.00 S
Asya Infosoft 201503 3.00 0.03 0.14 0.06 0.10 0.10 0.00 0.11 0.11 0.36 0.00 S
Atlanta Devcon 201406 14.06 0.02 -0.02 -0.02 -0.02 -0.02 0.00 S
Atlanta Devcon 201409 14.06 0.01 -0.01 -0.01 -0.01 -0.01 0.00 S
Atlanta Devcon 201412 14.06 0.01 -0.01 -0.01 -0.01 -0.01 0.00 S
Atlanta Devcon 201503 14.06 0.01 -0.01 -0.01 -0.01 -0.01 0.00 S
Atlanta Infrastructure and Finance 201406 11.55 4.08 4.08 0.01 0.00 0.00 0.00 0.00 0.00 S
Atlanta Infrastructure and Finance 201409 11.55 0.23 0.43 -0.21 0.00 -0.21 -0.21 -0.21 -0.02 0.00 S
Atlanta Infrastructure and Finance 201412 11.55 0.34 0.37 -0.03 0.00 -0.03 -0.03 -0.03 0.00 S
Atlanta Infrastructure and Finance 201503 11.55 0.32 0.20 0.12 0.00 0.12 0.00 0.12 0.12 0.01 0.00 S
Atlanta 201406 16.30 129.82 100.93 0.23 29.12 3.49 2.63 23.01 3.77 19.23 19.23 2.34 12.00 S
Atlanta 201409 16.30 62.52 47.42 0.46 15.56 3.31 2.63 9.62 0.87 8.75 8.75 1.03 12.00 S
Atlanta 201412 16.30 86.03 37.90 0.46 48.59 4.80 2.63 41.17 1.08 13.99 40.08 1.65 12.00 S
Atlanta 201503 16.30 217.79 197.92 1.26 21.13 12.36 3.01 5.76 1.21 4.56 4.56 0.47 12.00 S
Aurangabad Paper Mills 201406 5.81 0.06 -0.06 0.12 -0.18 -0.18 -0.18 0.00 S
Aurangabad Paper Mills 201409 5.81 0.11 0.01 -0.10 0.13 -0.23 -0.23 -0.23 0.00 S
Aurangabad Paper Mills 201412 5.81 0.04 0.01 -0.04 0.13 -0.17 -0.17 -0.17 0.00 S
Aurangabad Paper Mills 201503 5.81 0.67 0.01 -0.67 0.13 -0.80 -0.80 -0.80 0.00 S
Aurum Soft Systems 201406 13.02 2.82 2.68 0.12 0.26 0.27 -0.01 0.00 -0.01 -0.01 0.06 0.00 S
Aurum Soft Systems 201409 13.02 2.48 2.34 0.13 0.28 0.27 0.01 0.02 -0.01 -0.01 0.00 S
Aurum Soft Systems 201412 13.02 2.56 2.40 0.17 0.33 0.27 0.06 0.02 0.04 0.04 0.01 0.00 S
Aurum Soft Systems 201503 13.02 2.72 2.58 -0.03 0.12 0.28 -0.17 -0.05 -0.12 -0.12 -0.02 0.00 S
Autolite (India) 201406 9.86 21.41 0.85 22.41 0.16 0.01 0.95 0.81 -1.75 -1.75 -1.75 -1.78 0.00 S
Autolite (India) 201409 9.86 29.55 1.57 29.38 0.44 2.18 1.26 0.84 0.08 0.08 0.08 0.08 0.00 S
Autolite (India) 201412 9.86 29.63 1.63 29.05 0.13 2.34 1.36 0.87 0.11 0.11 0.11 0.11 0.00 S
Autolite (India) 201503 10.59 33.43 3.43 34.34 0.52 3.04 1.43 -0.48 2.09 0.18 1.91 1.91 1.85 0.00 S
Autopal Industries 201406 3.50 4.90 4.43 0.00 0.48 0.38 0.08 0.03 0.01 0.02 0.02 0.06 0.00 S
Autopal Industries 201409 3.50 11.14 10.35 0.07 0.86 0.45 0.09 0.32 0.08 0.24 0.24 0.67 0.00 S
Autopal Industries 201412 3.50 7.39 6.29 1.10 0.42 0.08 0.60 0.10 0.50 0.50 1.42 0.00 S
Autopal Industries 201503 3.50 9.63 8.72 -0.05 0.86 0.52 0.20 0.15 0.11 -0.04 0.04 -0.12 0.00 S
Aviva Industries 201406 1.50 0.01 0.01 0.00 0.00 0.00 0.00 0.00 S
Aviva Industries 201409 1.50 0.00 0.00 0.00 0.00 0.00 S
Aviva Industries 201412 1.50 0.01 -0.01 -0.01 -0.01 -0.01 0.00 S
Aviva Industries 201503 1.50 0.02 0.00 -0.02 -0.02 -0.02 -0.02 0.00 S
Avon Mercantile 201406 7.48 0.27 0.13 0.14 0.14 0.05 0.09 0.09 0.01 0.00 S
Avon Mercantile 201409 7.48 0.27 0.08 0.19 0.19 0.06 0.13 0.13 0.17 0.00 S
Avon Mercantile 201412 7.48 0.27 0.17 0.10 0.10 0.03 0.07 0.07 0.10 0.00 S
Avon Mercantile 201503 7.48 0.83 0.23 0.60 0.01 0.59 0.02 0.57 0.57 0.77 0.00 S
Avonmore Capital & Management Services201406 21.92 1.07 0.74 0.30 0.01 1.52 0.17 1.35 1.35 7.15 3.36 0.00 C
Avonmore Capital & Management Services201409 24.92 0.19 1.40 0.28 1.31 0.10 1.21 1.21 1.42 0.67 0.00 C
Avonmore Capital & Management Services201412 24.92 0.13 0.11 0.02 0.02 0.02 -0.83 -0.39 0.00 C
Avonmore Capital & Management Services201503 24.92 0.38 0.69 0.22 0.01 0.85 0.03 0.83 0.18 0.65 -0.68 -0.32 0.00 C
Axis Capital Markets (India) 201406 5.78 4.26 0.08 0.34 4.00 0.02 0.11 3.87 1.14 2.73 2.01 3.48 12.50 C
Axis Capital Markets (India) 201409 5.78 2.47 0.20 0.43 2.25 0.01 0.11 2.11 0.71 1.40 1.02 1.77 12.50 C
Axis Capital Markets (India) 201412 5.78 2.47 0.49 0.10 2.08 0.01 0.11 1.96 0.68 1.28 0.95 1.64 12.50 C
Axis Capital Markets (India) 201503 5.80 2.05 0.02 0.56 0.08 1.59 0.01 0.14 1.44 0.22 1.22 0.92 1.59 12.50 C

Co_Name Year Equity N.Sale O.O.I T. Exp O.I PBIDT Int. Dep. PBT T.Tax PAT A.PAT EPS Div (%)
Exp
ecte
d R
esu
lts
on
14
Au
gu
st 2
015
Axis Rail India 201406 4.39 0.00 0.00 0.00 0.00 0.00 -0.01 0.00 S
Axis Rail India 201409 4.39 0.01 -0.01 -0.01 -0.01 -0.01 -0.02 0.00 S
Axis Rail India 201412 4.39 0.02 -0.02 -0.02 -0.02 -0.02 -0.05 0.00 S
Axis Rail India 201503 1.10 5.64 5.81 1.02 0.86 0.14 0.32 0.41 0.14 0.27 0.27 0.61 0.00 S
Ayoki Merchantile 201406 0.25 0.01 0.01 -0.01 -0.01 -0.01 -0.01 -0.29 0.00 S
Ayoki Merchantile 201409 0.25 0.00 0.01 0.00 0.00 0.00 0.00 0.05 0.00 S
Ayoki Merchantile 201412 0.25 0.00 0.01 0.01 0.01 0.01 0.01 0.21 0.00 S
Ayoki Merchantile 201503 0.25 0.01 0.01 -0.01 -0.01 -0.01 -0.01 -0.56 0.00 S
Azure Exim Services 201406 8.96 0.02 0.00 -0.02 0.07 -0.09 -0.09 -0.09 -0.10 0.00 S
Azure Exim Services 201409 8.96 0.02 -0.02 0.07 -0.08 -0.08 -0.08 -0.10 0.00 S
Azure Exim Services 201412 8.96 0.02 -0.02 0.07 -0.08 -0.08 -0.08 -0.09 0.00 S
Azure Exim Services 201503 8.96 0.04 0.18 0.14 0.07 0.08 0.08 0.08 0.09 0.00 S
B Nanji Enterprises 201406 5.50 4.41 2.33 0.01 2.09 1.30 0.06 0.73 0.00 0.73 0.73 1.33 0.00 S
B Nanji Enterprises 201409 5.50 2.90 2.18 0.02 0.73 0.82 0.06 -0.15 -0.15 -0.15 -0.03 0.00 S
B Nanji Enterprises 201412 5.50 5.86 4.43 0.13 1.55 2.39 0.06 -0.90 -0.90 -0.90 -1.64 0.00 S
B Nanji Enterprises 201503 5.52 11.18 0.68 7.68 0.04 4.22 2.21 0.21 1.81 0.60 1.21 1.21 2.19 0.00 S
B2B Software Technologies 201406 11.59 1.32 1.26 0.06 0.13 0.01 0.12 0.12 0.12 0.10 0.00 S
B2B Software Technologies 201409 11.59 1.23 1.10 0.07 0.19 0.01 0.18 0.18 0.18 0.15 0.00 S
B2B Software Technologies 201412 11.59 1.10 1.06 0.07 0.12 0.03 0.09 0.09 0.09 0.07 0.00 S
B2B Software Technologies 201503 11.59 1.81 1.44 0.05 0.42 0.07 0.35 0.35 0.35 0.30 0.00 S
Bacil Pharma 201406 5.89 0.03 0.01 -0.02 -0.02 -0.02 -0.02 -0.03 0.00 S
Bacil Pharma 201409 5.89 0.03 0.02 0.00 0.00 -0.01 -0.01 -0.01 -0.01 0.00 S
Bacil Pharma 201412 5.89 0.02 0.02 0.00 0.00 0.00 0.00 0.00 0.00 S
Bacil Pharma 201503 5.89 0.03 0.03 -0.01 -0.01 -0.01 -0.01 -0.01 0.00 S
Bagalkot Udyog 201406 0.85 0.01 -0.01 -0.01 -0.01 -0.01 0.00 S
Bagalkot Udyog 201409 0.85 0.03 0.01 0.02 0.02 0.02 0.02 0.00 S
Bagalkot Udyog 201412 0.85 0.01 -0.01 -0.01 -0.01 -0.01 0.00 S
Bagalkot Udyog 201503 0.85 0.00 0.06 -0.06 -0.06 -0.06 -0.06 0.00 S
Bajrang Finance 201406 1.40 0.13 0.02 0.11 0.11 0.04 0.08 0.08 0.55 0.00 S
Bajrang Finance 201409 1.40 0.16 0.03 0.14 1.40 0.04 1.36 1.36 9.68 0.00 S
Bajrang Finance 201412 1.40 0.16 0.07 0.10 0.10 0.03 0.07 0.07 0.48 0.00 S
Bajrang Finance 201503 1.40 0.12 0.05 0.12 0.19 0.19 0.01 0.18 0.18 1.27 0.00 S
Balaji Galvanising Industries 201406 4.96 1.84 1.97 0.00 -0.13 0.03 0.05 -0.21 -0.21 -0.21 0.00 S
Balaji Galvanising Industries 201409 4.96 1.98 0.20 2.33 0.00 -0.14 0.03 0.05 -0.22 -0.22 -0.22 -1.62 0.00 S
Balaji Galvanising Industries 201412 4.96 2.21 2.24 0.00 -0.03 0.03 0.05 -0.11 -0.11 -0.11 0.00 S
Balasore Alloys 201406 35.45 197.11 1.49 169.10 4.69 34.19 10.63 4.73 18.83 7.55 11.28 11.28 1.62 12.00 S
Balasore Alloys 201409 35.45 219.04 2.32 187.55 40.96 74.77 8.68 4.91 17.50 6.25 11.25 11.25 1.59 12.00 S
Balasore Alloys 201412 35.45 210.67 1.08 182.09 2.01 31.67 9.35 5.77 16.55 6.95 9.60 9.60 1.35 12.00 S
Balasore Alloys 201503 35.45 221.04 4.06 200.68 -22.80 1.63 9.18 5.65 -13.21 -10.32 -2.89 -2.89 -0.41 12.00 S
Balurghat Technologies 201406 17.41 10.12 9.85 0.03 0.30 0.03 0.04 0.23 0.04 0.19 0.19 0.11 0.00 S
Balurghat Technologies 201409 17.41 9.32 9.11 0.03 0.24 0.03 0.04 0.17 0.03 0.14 0.14 0.08 0.00 S
Balurghat Technologies 201412 17.41 10.93 10.65 0.02 0.30 0.03 0.04 0.23 0.04 0.18 0.18 0.11 0.00 S
Balurghat Technologies 201503 17.41 11.07 10.79 0.05 0.34 0.04 0.06 0.23 0.05 0.18 0.18 0.11 0.00 S
Bang Overseas 201406 13.56 44.84 0.22 46.24 0.84 -0.34 1.20 0.31 -1.84 0.00 -1.84 -1.84 -1.36 0.00 S
Bang Overseas 201409 13.56 28.12 0.20 26.35 0.51 2.47 1.20 0.30 0.97 0.97 0.97 0.71 0.00 S
Bang Overseas 201412 13.56 19.45 0.33 20.62 0.67 -0.17 1.12 0.31 -1.60 -1.60 -1.60 -1.18 0.00 S
Bang Overseas 201503 13.56 35.32 0.42 36.60 0.77 -0.09 1.34 1.72 -3.15 -0.31 -2.85 -2.85 -2.10 0.00 S

Co_Name Year Equity N.Sale O.O.I T. Exp O.I PBIDT Int. Dep. PBT T.Tax PAT A.PAT EPS Div (%)
Exp
ecte
d R
esu
lts
on
14
Au
gu
st 2
015
Banswara Syntex 201406 15.51 287.09 12.71 258.79 1.64 42.65 19.98 14.11 8.56 3.74 4.83 4.87 3.14 30.00 C
Banswara Syntex 201409 15.51 308.93 12.53 281.09 1.96 42.33 20.54 16.61 5.17 2.21 2.96 2.92 1.88 30.00 C
Banswara Syntex 201412 16.43 289.10 11.07 261.88 1.17 39.46 20.58 15.95 2.94 1.27 1.67 1.67 1.05 30.00 C
Banswara Syntex 201503 16.43 294.84 14.33 281.19 5.34 33.32 19.86 15.89 -2.43 -0.92 -1.51 -1.51 -0.95 30.00 C
Barak Cement 201406 22.16 40.52 35.59 0.02 4.96 2.76 1.96 0.23 0.23 0.23 0.10 0.00 C
Barak Cement 201409 22.16 33.85 0.00 30.82 0.16 3.20 2.62 1.97 -1.38 -1.38 -1.38 -0.62 0.00 C
Barak Cement 201412 22.16 38.89 33.23 0.43 6.09 3.27 1.95 0.86 0.86 0.86 0.39 0.00 C
Barak Cement 201503 22.16 44.10 0.02 39.92 0.08 4.27 2.65 0.47 -0.64 0.05 -0.69 -0.69 -0.31 0.00 C
Baroda Extrusion 201406 14.91 6.21 0.04 6.39 -0.14 0.04 -0.18 -0.18 -0.18 0.00 S
Baroda Extrusion 201409 14.95 3.19 3.38 -0.20 0.04 -0.23 -0.23 -0.23 0.00 S
Baroda Extrusion 201412 14.95 2.42 2.85 -0.43 0.04 -0.46 -0.46 -0.46 0.00 S
Baroda Extrusion 201503 14.95 11.90 0.19 12.98 -0.89 0.00 0.09 -0.98 0.56 -1.54 -1.54 0.00 S
Baron Infotech 201406 10.20 0.02 0.04 0.02 -0.01 0.00 0.00 -0.01 0.00 -0.01 -0.01 -0.01 0.00 S
Baron Infotech 201409 10.20 0.01 0.04 0.01 -0.02 0.00 -0.02 -0.02 -0.02 -0.02 0.00 S
Baron Infotech 201412 10.20 0.02 0.01 0.01 0.02 0.01 0.00 0.00 0.00 0.00 S
Baron Infotech 201503 10.20 0.00 0.01 0.06 0.08 0.03 0.06 -2.20 -0.68 -1.52 -1.52 -1.49 0.00 S
BCL Industries & Infrastructures 201406 14.15 147.26 139.43 0.99 8.82 4.50 2.62 1.70 0.25 1.45 1.45 5.00 S
BCL Industries & Infrastructures 201409 14.15 133.41 128.43 1.56 6.53 2.48 2.55 1.51 0.20 1.31 1.31 5.00 S
BCL Industries & Infrastructures 201412 14.15 160.18 151.44 0.97 9.72 4.35 2.58 2.79 0.31 2.48 2.48 1.75 5.00 S
BCL Industries & Infrastructures 201503 14.15 236.05 220.92 2.60 17.73 12.99 0.54 4.21 2.53 1.68 1.68 1.19 5.00 S
BCPL International 201406 3.25 0.01 0.03 -0.02 -0.02 -0.02 -0.02 -0.07 0.00 S
BCPL International 201409 3.25 0.27 0.26 0.01 0.01 0.01 0.01 0.02 0.00 S
BCPL International 201412 3.25 0.09 0.03 0.06 0.06 0.06 0.06 0.18 0.00 S
Beeyu Overseas 201406 14.14 0.03 0.02 -0.01 0.01 -0.02 -0.02 -0.02 -0.01 0.00 S
Beeyu Overseas 201409 14.14 0.02 0.02 0.00 0.01 -0.01 -0.01 -0.01 -0.08 0.00 S
Beeyu Overseas 201412 14.14 0.01 0.02 0.01 0.01 0.00 0.00 0.00 -0.02 0.00 S
Beeyu Overseas 201503 14.14 0.03 0.02 -0.01 -0.01 -0.01 -0.01 -0.09 0.00 S
Bell Agromachina 201406 3.50 0.03 0.02 0.00 0.00 0.00 0.00 0.00 0.00 S
Bell Agromachina 201409 3.50 0.03 0.01 0.00 0.01 0.01 0.01 0.00 S
Bell Agromachina 201412 3.50 0.02 0.02 0.00 0.00 0.00 0.00 0.00 0.00 S
Bell Agromachina 201503 3.50 0.02 0.02 -0.01 0.00 -0.01 -0.01 -0.01 -0.15 0.00 S
BEML 201406 41.64 498.08 3.61 569.00 5.63 -61.68 21.38 12.47 -95.53 -95.53 -95.53 -22.94 10.00 S
BEML 201409 41.64 447.04 4.24 482.37 7.50 -23.59 18.30 13.25 -55.14 0.00 -55.14 -55.14 -13.24 10.00 S
BEML 201412 41.64 563.15 13.74 571.53 14.56 19.92 18.32 13.02 -11.42 0.00 -11.42 -11.42 -2.74 10.00 S
BEML 201503 41.64 1268.28 11.05 1116.38 31.81 194.76 12.51 13.40 169.00 0.15 168.85 168.85 40.55 10.00 S
Best Eastern Hotels 201406 1.69 1.70 1.12 0.57 0.05 0.14 0.39 0.14 0.25 0.25 0.15 10.00 S
Best Eastern Hotels 201409 1.69 0.70 0.00 0.71 -0.01 0.05 0.14 -0.19 -0.10 -0.09 -0.09 -0.05 10.00 S
Best Eastern Hotels 201412 1.69 1.32 0.00 0.91 0.00 0.41 0.07 0.14 0.21 0.10 0.11 0.11 0.06 10.00 S
Best Eastern Hotels 201503 1.69 1.13 0.00 0.78 0.03 0.38 0.07 0.21 0.10 0.00 0.11 0.11 0.06 10.00 S
Betex India 201406 1.50 10.08 9.32 0.00 0.77 0.07 0.33 0.36 -0.03 0.39 0.39 2.59 0.00 S
Betex India 201409 1.50 9.79 9.02 0.00 0.77 0.05 0.35 0.37 -0.03 0.41 0.41 2.71 0.00 S
Betex India 201412 1.50 12.16 11.34 0.00 0.82 0.08 0.35 0.40 0.09 0.32 0.32 2.10 0.00 S
Betex India 201503 1.50 11.97 11.16 0.24 1.05 0.73 0.28 0.05 -0.15 0.19 0.19 1.29 0.00 S
Bhagawati Oxygen 201406 2.31 2.74 2.64 0.07 0.17 0.09 0.09 0.01 0.08 0.08 0.34 0.00 S
Bhagawati Oxygen 201409 2.31 3.00 2.76 0.04 0.28 0.00 0.09 0.19 0.03 0.16 0.16 0.70 0.00 S
Bhagawati Oxygen 201412 2.31 3.32 3.02 0.02 0.32 0.01 0.09 0.22 0.04 0.18 0.18 0.78 0.00 S
Bhagawati Oxygen 201503 2.31 2.64 0.21 2.44 0.38 0.79 0.01 -0.04 0.82 0.22 0.60 0.60 2.58 0.00 S

Co_Name Year Equity N.Sale O.O.I T. Exp O.I PBIDT Int. Dep. PBT T.Tax PAT A.PAT EPS Div (%)
Exp
ecte
d R
esu
lts
on
14
Au
gu
st 2
015
Bhagyodaya Infrastructure Development201406 0.15 0.17 0.24 0.02 -0.05 0.38 0.18 -0.61 -0.20 -0.41 -0.41 -27.03 0.00 S
Bhagyodaya Infrastructure Development201409 0.15 0.48 0.51 -0.04 0.34 0.18 -0.55 -0.17 -0.38 -0.38 -25.37 0.00 S
Bhagyodaya Infrastructure Development201412 0.15 0.49 0.63 -0.14 0.42 0.18 -0.73 -0.23 -0.51 -0.51 -33.78 0.00 S
Bhagyodaya Infrastructure Development201503 0.15 0.39 0.90 0.07 -0.45 0.43 0.18 -1.05 -0.33 -0.73 -0.73 -48.50 0.00 S
Bharat Petroleum Corporation 201406 723.08 66749.65 40.57 65270.08 1023.24 2543.38 194.81 557.22 1791.35 575.09 1216.26 1216.26 16.82 225.00 S
Bharat Petroleum Corporation 201409 723.08 61978.51 46.65 60907.59 255.12 1372.69 129.16 633.29 610.24 146.04 464.20 464.20 6.42 225.00 S
Bharat Petroleum Corporation 201412 723.08 57872.82 41.69 56744.49 350.49 1520.51 120.06 626.45 774.00 222.84 551.16 551.16 7.62 225.00 S
Bharat Petroleum Corporation 201503 723.08 51304.28 41.84 46850.07 582.00 5078.05 139.07 699.06 4239.92 1387.03 2852.89 2852.89 39.45 225.00 S
Bharati Shipyard 201406 50.30 10.01 7.02 41.47 4.87 -19.57 146.43 14.47 -180.47 -180.47 -180.47 -35.88 0.00 S
Bharati Shipyard 201409 50.30 5.41 1.19 22.30 -2.94 -18.65 15.50 15.63 -44.96 -44.96 -44.96 -8.94 0.00 S
Bharati Shipyard 201412 50.30 2.02 0.96 23.30 0.35 -19.97 63.25 15.63 -98.85 -98.85 -98.85 -19.65 0.00 S
Bharati Shipyard 201503 50.30 11.69 0.44 71.27 4.68 -54.47 69.62 16.55 -682.40 -142.11 -540.30 -540.30 -107.42 0.00 S
Bharatiya Global Infomedia 201406 15.84 8.34 7.81 0.01 0.54 0.09 1.09 -0.63 -0.63 -0.63 -0.40 0.00 S
Bharatiya Global Infomedia 201409 15.84 10.45 9.90 0.03 0.58 0.09 1.09 -0.59 -0.59 -0.59 -0.37 0.00 S
Bharatiya Global Infomedia 201412 15.84 5.42 6.03 0.19 -0.42 0.09 1.09 -1.60 -1.60 -1.60 -1.01 0.00 S
Bharatiya Global Infomedia 201503 15.84 12.31 8.85 0.03 3.49 0.10 2.52 0.87 -0.16 2.69 2.69 1.70 0.00 C
Bhushan Steel 201406 45.30 2671.28 130.40 2086.34 2.04 717.38 552.49 306.52 -141.63 -141.63 -141.63 -6.37 25.00 S
Bhushan Steel 201409 45.30 2757.58 206.41 2379.61 2.56 586.94 565.41 318.72 -297.19 0.00 -297.19 -297.19 -13.24 25.00 S
Bhushan Steel 201412 45.30 2345.13 115.06 2013.61 1.81 448.39 580.13 322.50 -454.24 -454.24 -454.24 -20.18 25.00 S
Bhushan Steel 201503 45.30 2341.02 78.89 1992.24 7.10 434.77 796.00 -9.34 -361.89 -1.12 -360.77 -360.77 -16.05 25.00 S
Bhuwalka Steel Industries 201406 10.38 137.60 0.00 134.81 0.05 2.84 4.91 1.32 -3.39 0.00 -3.39 -3.39 -3.27 0.00 S
Bhuwalka Steel Industries 201409 10.37 117.68 0.00 115.08 0.14 2.74 7.99 1.33 -6.57 6.55 -6.57 -6.34 0.00 S
Bhuwalka Steel Industries 201412 10.38 81.84 0.05 83.11 -1.22 5.01 1.34 -7.57 -7.57 -7.57 -7.30 0.00 S
Bhuwalka Steel Industries 201503 10.38 55.30 0.10 73.69 17.95 -0.34 1.23 -1.57 -9.32 7.75 7.75 7.47 0.00 S
BIL Continental 201406 4.80 5.68 5.30 0.38 0.23 0.10 0.05 0.05 0.05 0.10 0.00 S
BIL Continental 201409 4.80 6.79 0.25 6.63 0.40 0.21 0.08 0.11 0.11 0.11 0.22 0.00 S
BIL Continental 201412 4.80 5.31 0.04 5.13 0.22 0.05 0.10 0.07 0.07 0.07 0.15 0.00 S
BIL Continental 201503 4.80 14.06 0.55 15.11 0.02 -0.48 -0.24 0.04 -0.29 0.01 -0.30 -0.30 -0.62 0.00 S
BIL Energy Systems 201406 10.57 13.36 13.76 4.42 4.02 0.15 5.33 -1.46 -1.46 -1.46 -0.14 0.00 S
BIL Energy Systems 201409 10.57 10.65 9.75 0.55 1.45 0.11 1.19 1.72 1.72 1.72 0.16 0.00 S
BIL Energy Systems 201412 10.57 13.03 13.40 1.14 0.78 0.15 1.09 -1.20 -1.20 -1.20 -0.11 0.00 S
BIL Energy Systems 201503 10.57 4.90 5.02 -0.75 -0.87 0.25 1.28 -2.27 -2.27 -2.27 -0.21 0.00 S
Bilpower 201406 21.00 6.17 6.74 0.32 -0.26 0.08 0.40 -29.07 -29.07 -29.07 -13.84 0.00 S
Bilpower 201409 21.00 5.97 6.02 0.37 0.31 0.09 0.17 -5.59 -5.59 -5.59 -2.66 0.00 S
Bilpower 201412 21.00 6.39 6.45 0.48 0.43 0.08 0.14 -28.52 -28.52 -28.52 -13.58 0.00 S
Bilpower 201503 21.00 0.19 1.01 0.82 0.08 0.08 -49.71 -0.06 -49.64 -49.64 -23.64 0.00 S
Binayak Tex Processors 201406 0.71 37.13 35.70 0.30 1.74 0.60 0.22 0.92 0.30 0.62 0.62 8.72 20.00 S
Binayak Tex Processors 201409 0.71 64.95 62.51 0.30 2.74 1.37 0.22 1.15 0.33 0.82 0.82 11.46 20.00 S
Binayak Tex Processors 201412 0.71 45.24 42.70 0.31 2.84 1.50 0.22 1.12 0.22 0.90 0.90 12.60 20.00 S
Binayak Tex Processors 201503 0.71 56.57 52.76 0.30 4.11 1.20 0.67 2.24 0.76 1.48 1.48 20.74 20.00 S
Birla Corporation 201406 77.01 859.32 15.50 731.03 42.12 185.91 19.21 39.13 127.57 28.05 99.52 99.52 12.92 60.00 S
Birla Corporation 201409 77.01 767.11 14.00 709.10 29.19 101.20 19.61 39.14 42.45 9.99 32.46 32.46 4.22 60.00 S
Birla Corporation 201412 77.01 743.18 13.63 717.10 26.01 65.72 20.90 37.21 7.61 -7.39 15.00 15.00 1.95 60.00 S
Birla Corporation 201503 77.01 782.64 14.51 751.05 58.62 104.72 18.65 37.98 35.25 6.79 28.46 28.46 3.70 60.00 S
Birla Shloka Edutech 201406 20.95 2.88 0.00 0.88 0.16 2.16 0.15 1.50 0.52 0.15 0.36 0.36 0.17 0.00 S
Birla Shloka Edutech 201409 20.95 2.11 0.63 0.17 1.65 0.36 1.51 -0.22 -0.04 -0.18 -0.18 -0.09 0.00 S
Birla Shloka Edutech 201412 20.95 0.27 1.60 0.45 -0.87 0.10 1.50 -2.47 -0.79 -1.69 -1.69 -0.80 0.00 S
Birla Shloka Edutech 201503 20.95 1.16 0.51 1.30 -0.08 0.30 0.31 1.47 -1.48 0.90 -2.38 -2.38 -1.14 0.00 S

Co_Name Year Equity N.Sale O.O.I T. Exp O.I PBIDT Int. Dep. PBT T.Tax PAT A.PAT EPS Div (%)
Exp
ecte
d R
esu
lts
on
14
Au
gu
st 2
015
Bliss GVS Pharma 201406 10.32 69.81 1.06 49.42 2.50 23.95 2.24 1.13 20.58 6.59 14.00 14.00 1.36 50.00 S
Bliss GVS Pharma 201409 10.32 87.56 1.74 60.35 7.13 36.08 2.51 1.19 32.38 10.81 21.57 21.57 2.09 50.00 S
Bliss GVS Pharma 201412 10.32 84.13 1.68 61.37 7.98 32.43 3.50 1.31 27.62 9.63 17.99 17.99 1.74 50.00 S
Bliss GVS Pharma 201503 10.32 67.96 0.69 55.69 2.13 15.09 2.96 1.45 10.68 4.22 6.46 6.46 0.63 50.00 S
Blue Blends (India) 201406 19.41 40.10 0.47 36.08 0.03 4.53 1.93 1.11 1.49 1.49 1.49 0.77 0.00 S
Blue Blends (India) 201409 19.41 41.90 0.52 38.52 0.24 4.14 1.83 1.11 1.20 1.20 1.20 0.62 0.00 S
Blue Blends (India) 201412 19.41 41.98 0.59 38.39 0.15 4.33 1.97 1.12 1.24 1.24 1.24 0.64 0.00 S
Blue Blends (India) 201503 19.41 50.08 0.51 44.96 -0.27 5.37 3.38 1.12 1.12 -0.43 1.55 1.55 0.80 0.00 S
Blue Chip India 201406 11.06 1.29 0.58 0.01 0.72 0.01 0.72 0.72 0.72 0.13 0.00 S
Blue Chip India 201409 11.06 0.33 0.56 0.02 -0.22 0.01 -0.23 -0.23 -0.23 -0.04 0.00 S
Blue Chip India 201412 11.06 0.78 0.83 0.02 -0.03 0.01 -0.04 -0.04 -0.04 -0.01 0.00 S
Blue Chip India 201503 11.06 4.88 5.14 0.01 -0.25 0.12 -0.37 -0.37 -0.37 -0.07 0.00 S
BMB Music & Magnetics 201406 6.06 0.03 -0.03 0.05 -0.08 -0.08 -0.08 0.00 S
BMB Music & Magnetics 201409 6.06 0.04 -0.04 0.05 -0.08 -0.08 -0.08 0.00 S
BMB Music & Magnetics 201412 6.06 0.02 -0.02 0.05 -0.07 -0.07 -0.07 0.00 S
BMB Music & Magnetics 201503 6.06 1.19 1.87 -0.68 1.58 -3.42 -0.53 -2.89 -2.89 0.00 S
Bodhtree Consulting 201412 17.55 9.49 0.22 8.81 0.90 0.55 0.30 0.08 0.02 0.05 0.05 0.03 0.00 S
Bodhtree Consulting 201503 17.55 15.03 0.16 14.02 1.16 0.24 0.68 0.24 -0.11 0.35 0.35 0.20 0.00 S
Bombay Cycle & Motor Agency 201406 0.20 1.52 1.24 0.26 0.54 0.04 0.46 0.14 0.32 0.32 15.93 40.00 S
Bombay Cycle & Motor Agency 201409 0.20 1.63 1.31 0.27 0.59 0.01 0.03 0.53 0.16 0.37 0.37 18.91 40.00 S
Bombay Cycle & Motor Agency 201412 0.20 1.86 1.38 0.27 0.75 0.04 0.70 0.21 0.49 0.49 24.19 40.00 S
Bombay Cycle & Motor Agency 201503 0.20 1.80 1.57 0.29 0.52 0.03 0.69 0.19 0.50 0.50 24.77 40.00 S
Bombay Rayon Fashions 201406 134.60 798.06 687.50 2.30 112.86 126.01 44.41 -57.56 -19.56 -38.00 -38.00 0.00 S
Bombay Rayon Fashions 201409 134.60 829.01 688.63 4.38 144.76 137.78 44.53 -37.55 -12.43 -25.12 -25.12 0.00 S
Bombay Rayon Fashions 201412 134.60 880.07 743.33 6.66 143.40 133.70 44.69 -34.99 -12.23 -22.76 -22.76 0.00 S
Bombay Rayon Fashions 201503 134.60 1025.53 850.41 26.74 201.86 160.11 32.70 9.05 1.91 7.14 7.14 0.53 0.00 S
Bombay Swadeshi Stores 201406 0.99 2.55 0.08 2.33 0.00 0.31 0.22 0.05 0.04 0.01 0.03 0.03 0.05 0.00 S
Bombay Swadeshi Stores 201409 0.99 3.24 0.06 2.83 0.00 0.47 0.20 0.05 0.22 0.07 0.16 0.16 0.32 0.00 S
Bombay Swadeshi Stores 201412 0.99 4.00 0.03 3.79 0.02 0.25 0.18 0.05 0.02 0.01 0.01 0.01 0.02 0.00 S
Bombay Swadeshi Stores 201503 0.99 3.06 0.13 3.04 0.07 0.23 0.36 0.05 -0.18 -0.07 -0.10 -0.10 -0.21 0.00 S
Boston Teknowsys (India) 201406 5.24 0.72 0.71 0.00 0.01 0.00 0.01 0.01 0.00 0.00 0.00 0.00 S
Boston Teknowsys (India) 201409 5.24 0.93 0.92 0.01 0.01 0.00 0.00 0.00 0.00 0.00 S
Boston Teknowsys (India) 201412 5.24 0.18 0.17 0.02 0.01 0.01 0.00 0.01 0.01 0.02 0.00 S
Boston Teknowsys (India) 201503 5.24 0.03 0.02 0.01 0.01 0.00 0.00 0.00 0.00 0.01 0.00 S
BPL 201406 48.89 5.56 0.44 5.29 0.71 0.01 0.22 0.48 0.48 0.48 0.01 0.00 S
BPL 201409 48.89 7.64 5.05 7.45 5.25 0.01 1.13 4.11 4.11 4.11 0.84 0.00 S
BPL 201412 48.89 6.11 0.16 5.74 0.54 0.01 0.17 0.35 0.35 0.35 0.07 0.00 S
BPL 201503 48.89 4.57 4.79 1.01 0.78 0.02 0.14 0.62 2.85 0.62 0.13 0.00 S
Brahmanand Himghar 201406 7.00 0.67 0.05 0.52 0.20 0.17 0.05 -0.01 -0.01 -0.01 0.00 S
Brahmanand Himghar 201409 7.00 0.84 0.03 0.40 0.00 0.47 0.02 0.04 0.41 0.00 0.41 0.41 0.29 0.00 S
Brahmanand Himghar 201412 7.00 0.90 0.02 0.30 0.62 0.32 0.04 0.26 0.26 0.26 0.18 0.00 S
Brahmanand Himghar 201503 7.00 0.02 0.48 0.50 0.00 0.19 0.03 -0.22 -0.22 -0.22 0.00 S
Broadcast Initiatives 201406 25.31 1.49 11.63 0.03 -10.11 0.00 1.91 -12.04 -0.27 -11.77 -11.77 -4.65 0.00 S
Broadcast Initiatives 201409 25.31 2.66 13.10 0.04 -10.40 1.98 -12.41 -0.34 -12.06 -12.06 -4.77 0.00 S
Broadcast Initiatives 201412 25.31 3.42 15.70 0.04 -12.24 0.00 2.01 -14.33 -0.09 -14.24 -14.24 -5.63 0.00 S
Broadcast Initiatives 201503 25.31 3.85 18.16 0.65 -13.66 0.06 2.14 -15.86 -0.16 -15.70 -15.70 -6.20 0.00 S

Co_Name Year Equity N.Sale O.O.I T. Exp O.I PBIDT Int. Dep. PBT T.Tax PAT A.PAT EPS Div (%)
Exp
ecte
d R
esu
lts
on
14
Au
gu
st 2
015
Brushman (India) 201406 14.76 0.67 1.09 0.47 0.05 0.28 -0.23 -0.23 -0.23 -0.15 0.00 S
Brushman (India) 201409 14.76 0.85 1.24 0.46 0.06 0.28 -0.22 -0.22 -0.22 -0.15 0.00 S
Brushman (India) 201412 14.76 0.28 0.69 0.45 0.04 0.28 -0.25 -0.25 -0.25 -0.17 0.00 S
Brushman (India) 201503 14.76 0.19 2.80 0.48 -2.13 0.28 -2.41 -2.41 -2.41 -1.63 0.00 S
Camphor & Allied Products 201406 5.13 80.31 0.20 70.59 0.04 9.96 2.09 2.42 5.86 1.77 4.09 4.09 7.97 20.00 S
Camphor & Allied Products 201409 5.13 92.38 0.20 85.76 0.00 6.83 2.33 2.33 3.43 1.13 2.30 2.30 4.48 20.00 S
Camphor & Allied Products 201412 5.13 86.32 0.14 75.98 0.02 10.50 2.30 2.00 5.77 1.86 3.91 3.91 7.61 20.00 S
Camphor & Allied Products 201503 5.13 96.05 0.20 80.43 0.06 15.88 2.30 2.03 11.88 2.92 8.96 8.96 17.45 20.00 S
Capman Financials 201406 3.52 0.22 0.04 0.19 0.19 0.06 0.13 0.13 0.36 0.00 S
Capman Financials 201409 3.52 0.22 0.05 0.17 0.17 0.17 0.17 0.33 0.00 S
Capman Financials 201412 3.52 0.23 0.04 0.19 0.19 0.06 0.13 0.13 0.38 0.00 S
Capman Financials 201503 3.52 0.23 0.16 0.08 0.08 0.02 0.05 0.05 0.15 0.00 S
Capri Global Capital 201406 35.01 42.86 1.12 9.22 1.43 36.19 0.37 1.08 34.74 12.05 22.69 22.69 6.48 15.00 C
Capri Global Capital 201409 35.01 50.77 1.37 16.80 4.30 39.63 0.74 1.07 37.82 14.24 23.58 23.58 6.74 15.00 C
Capri Global Capital 201412 35.03 44.43 4.83 10.33 1.24 40.17 1.60 1.01 37.56 12.02 25.54 25.54 7.29 15.00 C
Capri Global Capital 201503 35.03 46.60 6.28 16.15 4.87 41.59 1.94 0.67 38.98 15.55 23.43 23.43 6.70 15.00 C
Capricorn Systems Global Solutions 201406 3.40 0.96 0.89 0.03 0.09 0.03 0.02 0.04 0.01 0.03 0.03 0.06 0.00 S
Capricorn Systems Global Solutions 201409 4.00 1.00 0.90 0.03 0.13 0.02 0.02 0.09 0.03 0.06 0.06 0.15 0.00 S
Capricorn Systems Global Solutions 201412 4.00 1.02 0.94 0.08 0.02 0.05 0.02 0.04 0.04 0.09 0.00 S
Capricorn Systems Global Solutions 201503 4.00 0.96 0.95 0.00 0.01 0.03 -0.01 0.00 -0.02 -0.02 -0.04 0.00 S
Caprolactam Chemicals 201406 4.59 0.12 0.53 0.07 -0.34 0.01 0.04 -0.59 -0.59 -0.59 -1.29 0.00 S
Caprolactam Chemicals 201409 4.59 0.47 0.01 0.57 0.00 -0.08 0.01 0.05 -0.15 -0.15 -0.15 -0.03 0.00 S
Caprolactam Chemicals 201412 4.59 0.98 0.02 0.65 -0.01 0.34 0.02 0.07 0.25 0.25 0.25 -0.06 0.00 S
Caprolactam Chemicals 201503 4.59 1.18 0.06 0.73 0.01 0.52 0.02 0.07 0.43 0.43 0.43 0.93 0.00 S
Castex Technologies 201406 55.51 757.95 40.65 550.57 248.03 95.34 61.53 91.16 27.72 63.44 63.44 2.29 5.00 S
Castex Technologies 201409 55.59 760.09 43.63 539.29 264.43 103.90 67.64 92.89 31.07 61.82 61.82 2.23 5.00 S
Castex Technologies 201412 55.59 772.62 48.79 545.90 275.51 109.32 82.08 84.11 29.19 54.92 54.92 1.98 5.00 S
Castex Technologies 201503 55.59 716.70 26.13 542.04 200.79 112.75 82.97 5.07 1.69 3.38 3.38 0.12 5.00 S
Cat Technologies 201406 79.44 0.77 1.37 -0.60 0.02 0.16 -0.78 -0.78 -0.78 -0.10 0.00 S
Cat Technologies 201409 79.44 1.11 1.59 -0.48 0.02 0.10 -0.60 -0.60 -0.60 -0.08 0.00 S
Cat Technologies 201412 79.44 1.23 1.74 -0.51 0.02 0.05 -0.58 -0.58 -0.58 -0.07 0.00 S
Cat Technologies 201503 79.44 1.54 1.91 0.17 -0.20 0.08 0.05 -0.34 -0.34 -0.34 -0.04 0.00 S
CCL International 201406 19.19 19.85 0.15 19.12 0.88 0.24 0.43 0.21 0.06 0.15 0.15 0.02 2.50 S
CCL International 201409 19.19 18.36 0.17 17.19 1.34 0.36 0.98 0.00 0.01 -0.01 -0.01 2.50 S
CCL International 201412 19.19 23.10 0.18 22.46 0.81 0.31 0.72 -0.22 -0.22 -0.22 -0.02 2.50 S
CCL International 201503 19.19 33.03 0.09 32.05 1.06 0.40 -0.85 1.52 0.63 0.89 0.89 0.09 2.50 S
Ceenik Exports (India) 201406 3.35 2.26 2.27 -0.01 0.45 0.07 -0.53 -0.53 -0.53 -1.58 0.00 S
Ceenik Exports (India) 201409 3.35 3.80 2.35 1.45 0.60 0.14 0.71 0.71 0.71 2.12 0.00 S
Ceenik Exports (India) 201412 3.35 1.77 1.74 0.04 0.58 0.12 -0.67 -0.67 -0.67 -1.99 0.00 S
Ceenik Exports (India) 201503 3.35 2.25 0.05 1.03 1.28 1.02 0.60 -0.35 -1.20 0.85 0.85 2.55 0.00 S
Ceeta Industries 201406 1.45 0.41 0.87 1.17 0.28 0.38 0.00 0.06 0.33 0.33 0.33 0.22 0.00 S
Ceeta Industries 201409 1.45 1.37 1.39 0.71 0.69 0.00 0.06 0.63 0.63 0.63 0.43 0.00 S
Ceeta Industries 201412 1.45 1.51 1.57 0.49 0.43 0.06 0.38 0.38 0.38 0.26 0.00 S
Ceeta Industries 201503 1.45 2.23 2.04 0.34 0.53 0.00 -0.02 0.55 0.55 0.55 0.38 0.00 S
Centron Industrial Alliance 201406 9.96 3.56 0.32 3.76 0.13 0.00 0.13 0.13 0.13 0.01 0.00 S
Centron Industrial Alliance 201409 9.96 5.58 0.35 5.74 0.19 0.00 0.19 0.19 0.19 0.02 0.00 S
Centron Industrial Alliance 201412 9.96 5.67 0.45 5.91 0.20 0.00 0.20 0.20 0.20 0.02 0.00 S
Centron Industrial Alliance 201503 9.96 4.87 0.50 5.27 0.10 0.03 0.08 0.12 -0.04 -0.04 0.00 S
Co_Name Year Equity N.Sale O.O.I T. Exp O.I PBIDT Int. Dep. PBT T.Tax PAT A.PAT EPS Div (%)
Exp
ecte
d R
esu
lts
on
14
Au
gu
st 2
015
Cerebra Integrated Technologies 201406 48.09 55.87 55.10 0.07 0.85 0.32 0.17 0.36 0.14 0.22 0.10 0.00 C
Cerebra Integrated Technologies 201409 48.09 60.07 57.85 0.45 2.67 0.50 0.20 1.97 0.36 1.61 1.37 0.00 C
Cerebra Integrated Technologies 201412 48.09 67.10 65.73 0.02 1.39 0.52 0.17 0.71 0.23 0.47 0.42 0.00 C
Cerebra Integrated Technologies 201503 84.33 84.43 82.57 0.00 1.86 1.76 0.52 -0.42 -0.43 0.01 -0.02 0.00 C
CES 201406 1.30 29.18 25.91 0.26 3.54 0.05 0.77 2.71 0.88 1.83 1.83 14.06 0.00 C
CES 201409 1.30 28.95 27.08 0.15 2.01 0.06 0.67 1.29 0.38 0.91 0.87 6.67 0.00 C
CES 201412 1.30 31.31 27.27 0.19 4.23 0.07 0.53 3.64 1.08 2.56 2.56 19.66 0.00 C
Chartered Logistics 201406 9.93 34.52 29.23 0.76 6.06 2.20 2.65 1.21 1.21 1.21 0.12 0.00 S
Chartered Logistics 201409 9.93 35.54 29.62 1.31 7.24 2.65 2.51 2.08 2.08 2.08 0.21 0.00 S
Chartered Logistics 201412 9.93 32.51 27.64 1.16 6.03 2.54 2.34 1.16 1.16 1.16 0.25 0.00 S
Chartered Logistics 201503 9.93 71.99 75.29 1.07 -2.22 2.40 -0.37 -4.25 -3.42 -0.83 -0.83 -0.43 0.00 S
CHD Developers 201406 22.72 67.62 58.48 0.10 9.24 4.98 0.67 3.60 1.19 2.41 2.41 0.21 0.00 C
CHD Developers 201409 22.72 41.57 2.40 36.44 0.01 7.54 4.22 0.80 2.53 0.95 1.58 1.58 0.14 0.00 S
CHD Developers 201412 22.72 43.31 34.94 0.17 8.53 3.73 0.73 4.08 1.39 2.69 2.69 0.24 0.00 C
CHD Developers 201503 22.72 89.42 81.64 7.78 3.19 0.53 4.06 1.38 2.68 2.68 0.24 0.00 C
Chemiesynth (Vapi) 201503 3.07 2.00 0.01 2.23 -0.23 0.06 0.10 -0.39 -0.39 -0.39 -1.27 0.00 S
Chennai Ferrous Industries 201412 3.61 7.31 6.43 0.11 0.99 0.00 0.68 0.30 0.30 0.30 0.84 0.00 S
Chennai Ferrous Industries 201503 3.61 4.71 17.24 0.13 -12.41 0.00 0.68 -13.09 -13.09 -13.09 -3.63 0.00 S
Chordia Food Products 201406 2.98 10.01 0.20 9.33 0.09 0.97 0.33 0.21 0.43 0.13 0.31 0.31 1.03 0.00 S
Chordia Food Products 201409 2.98 8.83 0.19 7.89 0.09 1.21 0.30 0.23 0.69 0.24 0.45 0.45 4.63 0.00 S
Chordia Food Products 201412 2.98 9.93 0.03 9.35 0.04 0.66 0.22 0.18 1.90 0.51 1.40 1.40 4.69 0.00 S
Chordia Food Products 201503 2.98 10.42 9.65 0.02 0.79 0.20 0.25 0.34 0.14 0.20 0.20 0.67 0.00 S
Cipla 201406 160.58 2647.20 72.80 2178.22 40.39 582.17 33.32 125.40 423.45 101.88 321.57 294.58 3.67 100.00 C
Cipla 201409 160.58 2629.81 137.48 2208.85 23.30 581.74 46.88 122.04 412.82 100.70 312.12 298.68 3.72 100.00 C
Cipla 201412 160.58 2624.71 140.75 2211.63 40.66 594.49 44.73 121.59 428.17 94.43 333.74 327.85 4.08 100.00 C
Cipla 201503 160.59 2980.69 112.00 2585.04 61.20 568.85 43.36 135.68 389.81 103.02 286.79 259.66 3.24 100.00 C
Citadel Realty & Developers 201406 3.58 0.02 -0.02 -0.02 -0.02 -0.02 -0.06 0.00 S
Citadel Realty & Developers 201409 3.58 0.04 0.01 -0.04 -0.04 -0.04 -0.04 -0.10 0.00 S
Citadel Realty & Developers 201412 3.58 0.02 -0.02 -0.02 -0.02 -0.02 -0.05 0.00 S
Citadel Realty & Developers 201503 3.58 0.04 -0.04 0.11 -0.15 -0.05 -0.10 -0.10 -0.28 0.00 S
City Online Services 201406 5.17 4.75 0.01 4.47 0.29 0.03 0.08 0.18 0.18 0.18 0.35 0.00 S
City Online Services 201409 5.17 3.24 0.02 3.05 0.21 0.03 0.08 0.10 0.10 0.10 0.19 0.00 S
City Online Services 201412 5.17 3.26 2.73 0.03 0.57 0.03 0.08 0.46 0.00 0.46 0.46 0.88 0.00 S
City Online Services 201503 5.17 3.09 4.02 0.06 -0.87 0.04 1.21 -2.12 -0.25 -1.87 -1.87 -3.62 0.00 S
Classic Global Finance & Capital 201406 3.52 0.32 0.32 0.01 0.01 0.01 0.01 0.02 0.00 S
Classic Global Finance & Capital 201409 3.52 0.30 0.09 0.36 0.02 0.00 0.02 0.01 0.01 0.01 0.04 0.00 S
Classic Global Finance & Capital 201412 3.52 0.23 0.08 0.28 0.03 0.00 0.03 0.03 0.03 0.01 0.00 S
Classic Global Finance & Capital 201503 3.52 0.36 0.33 0.04 0.01 0.03 0.02 0.01 0.01 0.00 S
Clio Infotech 201406 11.01 0.14 0.03 0.11 0.01 0.10 0.10 0.10 0.09 0.00 S
Clio Infotech 201409 11.01 0.11 0.02 0.09 0.01 0.08 0.08 0.08 0.08 0.00 S
Clio Infotech 201412 11.01 0.08 0.02 0.06 0.01 0.05 0.05 0.05 0.04 0.00 S
Clio Infotech 201503 11.01 0.06 0.56 0.36 -0.13 0.02 -0.15 0.02 -0.18 -0.18 -0.16 0.00 S
Clutch Auto 201406 18.76 8.96 9.87 -0.91 2.27 0.86 -4.04 -4.04 -4.04 -2.15 0.00 S
Clutch Auto 201409 18.76 9.59 9.96 -0.37 2.13 0.89 -3.38 -3.38 -3.38 -1.80 0.00 S
Clutch Auto 201412 18.76 9.17 9.90 -0.73 2.16 0.90 -3.79 -3.79 -3.79 -2.02 0.00 S
Clutch Auto 201503 18.76 11.21 41.22 2.34 -27.68 0.01 16.59 -177.46 -1.36 -176.09 -176.09 -93.87 0.00 S

Co_Name Year Equity N.Sale O.O.I T. Exp O.I PBIDT Int. Dep. PBT T.Tax PAT A.PAT EPS Div (%)
Exp
ecte
d R
esu
lts
on
14
Au
gu
st 2
015
Combat Drugs 201406 8.00 0.03 0.01 -0.02 0.05 -0.07 -0.07 -0.07 -0.09 0.00 S
Combat Drugs 201409 8.00 0.03 0.09 -0.06 0.05 -0.11 -0.11 -0.11 0.00 S
Combat Drugs 201412 8.00 0.06 0.12 0.03 -0.03 0.05 -1.18 -1.18 -1.18 0.00 S
Combat Drugs 201503 8.00 0.01 0.04 0.05 0.02 0.08 -2.32 -2.32 -2.32 -0.40 0.00 S
Commex Technology 201406 31.02 2.10 1.14 0.96 0.00 0.46 0.50 0.17 0.33 0.33 0.02 0.00 C
Commex Technology 201409 31.02 1.08 0.38 0.70 0.00 0.47 0.23 0.08 0.15 0.15 0.01 0.00 C
Commex Technology 201412 31.02 1.11 0.25 0.86 0.00 0.46 0.40 0.40 0.40 0.03 0.00 C
Commex Technology 201503 31.02 0.90 0.00 0.90 0.77 0.77 0.00 0.46 0.31 -0.23 0.54 0.54 0.00 C
Concord Drugs 201412 7.24 10.08 0.03 8.64 1.48 0.64 0.67 0.16 0.04 0.13 0.13 0.18 0.00 S
Concord Drugs 201503 7.24 10.72 0.27 7.86 3.12 0.93 1.62 0.58 0.25 0.33 0.33 0.45 0.00 S
Confidence Petroleum India 201406 25.88 76.82 69.50 0.19 7.51 2.68 5.22 -0.39 -0.06 -0.33 -0.32 -0.01 0.00 C
Confidence Petroleum India 201409 25.88 62.77 56.46 0.18 6.49 2.70 5.18 -1.40 -0.06 -1.34 -1.33 -0.05 0.00 C
Confidence Petroleum India 201412 25.88 65.01 58.22 0.18 6.97 2.70 4.06 0.21 -22.45 -22.43 -0.87 0.00 C
Confidence Petroleum India 201503 25.88 101.88 90.09 1.17 12.96 3.64 14.28 -4.96 0.71 1.14 1.38 -0.22 0.00 C
Continental Securities 201409 3.25 0.08 0.05 0.03 0.02 0.00 0.00 0.00 0.01 0.00 S
Continental Securities 201412 3.25 0.07 0.04 0.04 0.02 0.01 0.00 0.01 0.01 0.04 0.00 S
Continental Securities 201503 3.25 0.19 0.13 0.07 0.01 0.06 0.00 0.01 -0.01 -0.01 -0.02 0.00 S
Cords Cable Industries 201406 11.43 56.93 50.90 0.50 6.53 4.58 1.58 0.37 0.12 0.25 0.25 0.18 0.00 S
Cords Cable Industries 201409 11.43 66.33 59.21 0.44 7.56 5.23 1.59 0.74 0.24 0.50 0.50 0.40 0.00 S
Cords Cable Industries 201412 11.43 62.09 55.41 0.44 7.11 4.76 1.59 0.76 0.25 0.52 0.52 0.41 0.00 S
Cords Cable Industries 201503 11.43 79.68 72.22 0.55 8.01 5.43 0.65 1.93 0.49 1.44 1.44 1.21 0.00 S
Core Education & Technologies 201406 22.90 100.10 52.49 0.31 47.93 48.75 39.47 -63.35 -63.35 -63.35 -5.53 0.00 S
Core Education & Technologies 201409 22.90 93.96 49.43 21.34 65.87 45.80 48.37 -73.29 -73.29 -73.29 -6.40 0.00 S
Core Education & Technologies 201412 22.90 95.89 63.67 24.92 57.13 44.08 42.40 -29.34 -29.34 -29.34 -2.56 0.00 S
Covidh Technologies 201406 10.60 2.97 2.88 0.02 0.11 0.06 0.06 0.02 0.04 0.04 0.04 0.00 C
Covidh Technologies 201409 10.60 1.97 0.01 1.95 0.02 0.02 0.00 0.00 0.00 C
Covidh Technologies 201412 10.60 3.86 0.01 3.80 0.06 0.02 0.04 0.01 0.03 0.03 0.03 0.00 C
Covidh Technologies 201503 10.60 2.28 -0.01 1.66 -0.02 0.58 0.00 0.56 0.02 -0.04 0.06 0.06 0.00 C
Cranes Software International 201406 23.55 89.49 88.12 3.16 4.53 27.18 7.72 -30.36 -14.23 -16.14 -16.14 -1.37 0.00 C
Cranes Software International 201409 23.55 86.73 90.99 25.35 21.09 27.97 7.93 -14.81 -14.10 -0.71 -0.71 -0.06 0.00 C
Cranes Software International 201412 23.55 93.55 95.48 9.48 7.56 27.99 7.94 -28.38 -7.51 -20.87 -20.87 -1.77 0.00 C
Cranes Software International 201503 23.55 97.86 95.78 42.57 44.65 30.50 7.20 6.04 7.92 -1.88 -1.88 -1.77 0.00 C
Cravatex 201406 2.58 41.55 0.63 38.73 0.03 3.48 2.01 0.88 0.59 0.21 0.38 0.38 1.47 20.00 S
Cravatex 201409 2.58 49.44 0.63 45.90 0.10 4.27 2.65 0.93 0.70 0.25 0.45 0.45 1.74 20.00 S
Cravatex 201412 2.58 40.52 0.63 37.60 0.03 3.58 2.26 0.83 0.49 0.22 0.27 0.27 1.05 20.00 S
Cravatex 201503 2.58 54.23 0.63 50.06 0.05 4.85 2.63 0.95 1.27 0.09 1.18 1.18 4.55 20.00 S
Creative Merchants 201406 5.00 0.21 0.20 0.01 0.01 0.01 0.01 0.02 0.00 S
Creative Merchants 201409 5.00 0.28 0.25 0.02 0.02 0.00 0.02 0.02 0.00 S
Creative Merchants 201412 5.00 0.10 0.09 0.01 0.00 0.01 0.01 0.01 0.02 0.00 S
Creative Merchants 201503 5.00 11.35 0.09 11.32 0.12 0.12 0.03 0.09 0.09 0.18 0.00 S
Crescent Leasing 201412 4.07 0.34 0.03 0.00 0.31 0.19 0.12 0.00 0.12 0.12 0.29 0.00 S
Crescent Leasing 201503 4.07 0.09 0.02 0.06 0.05 0.02 0.07 -0.05 -0.05 -0.13 0.00 S
Cressanda Solutions 201406 30.36 0.03 -0.03 0.00 -0.03 -0.03 -0.03 0.00 S
Cressanda Solutions 201409 30.36 0.09 -0.09 0.00 -0.09 -0.09 -0.09 0.00 S
Cressanda Solutions 201412 30.36 0.03 0.09 0.06 0.00 0.06 0.06 0.06 0.00 S
Cressanda Solutions 201503 30.36 0.12 0.08 -0.04 0.00 -0.04 -0.04 -0.04 0.00 S

Co_Name Year Equity N.Sale O.O.I T. Exp O.I PBIDT Int. Dep. PBT T.Tax PAT A.PAT EPS Div (%)
Exp
ecte
d R
esu
lts
on
14
Au
gu
st 2
015
Crimson Metal Engineering Company 201406 4.43 7.94 7.08 0.02 0.87 0.54 0.28 0.06 0.06 0.06 0.00 S
Crimson Metal Engineering Company 201409 4.43 13.86 13.00 0.02 0.89 0.54 0.28 0.07 0.02 0.04 0.04 0.15 0.00 S
Crimson Metal Engineering Company 201412 4.43 12.69 11.83 0.02 0.88 0.54 0.28 0.06 0.06 0.06 0.11 0.00 S
Crimson Metal Engineering Company 201503 4.43 9.82 8.30 0.14 1.67 1.04 0.11 0.52 -0.19 0.71 0.71 1.61 0.00 S
Datamatics Global Services 201406 29.48 204.25 178.36 3.25 29.14 1.08 5.42 22.65 4.54 18.11 14.17 2.40 20.00 C
Datamatics Global Services 201409 29.48 212.37 186.73 2.06 27.70 3.05 5.38 19.28 4.32 14.96 12.22 2.07 20.00 C
Datamatics Global Services 201412 29.48 213.40 192.04 1.89 23.26 1.90 5.70 15.65 3.06 12.59 11.78 2.00 20.00 C
Datamatics Global Services 201503 29.48 197.98 187.61 1.33 11.69 0.73 4.49 6.48 3.63 2.85 5.05 2.00 20.00 C
DCM Shriram Industries 201406 17.40 329.36 7.24 308.88 2.76 30.48 10.15 4.23 16.10 2.51 13.59 13.59 7.81 35.00 S
DCM Shriram Industries 201409 17.40 317.59 8.01 303.58 0.47 22.49 11.05 4.55 6.89 1.24 5.65 5.65 3.25 35.00 S
DCM Shriram Industries 201412 17.40 305.23 9.44 312.23 0.86 3.30 8.59 4.54 -9.83 -1.73 -8.10 -8.10 -4.66 35.00 S
DCM Shriram Industries 201503 17.40 309.95 11.68 310.13 2.84 14.34 10.88 4.96 -1.50 5.26 -6.76 -6.76 -3.89 35.00 S
DCW 201406 41.96 313.59 284.96 0.21 28.84 5.15 13.16 10.53 3.00 7.53 7.53 0.36 0.00 S
DCW 201409 42.70 317.28 0.67 299.23 0.30 19.03 5.72 13.08 3.86 1.19 2.67 2.67 0.12 0.00 S
DCW 201412 42.70 255.86 2.42 271.14 0.53 -12.33 3.68 14.04 -37.92 -4.19 -33.73 -33.73 -1.58 0.00 S
DCW 201503 42.70 364.08 0.56 334.47 0.81 30.99 4.13 11.72 18.77 1.16 17.62 17.62 0.83 0.00 S
Deccan Gold Mines 201406 5.92 0.20 0.28 0.08 0.00 0.01 0.07 0.07 0.07 0.01 0.00 S
Deccan Gold Mines 201409 5.92 0.19 -0.19 0.00 0.01 -0.20 -0.20 -0.20 -0.03 0.00 S
Deccan Gold Mines 201412 5.92 0.32 -0.32 0.01 -0.32 -0.32 -0.32 -0.05 0.00 S
Deccan Gold Mines 201503 5.92 1.25 0.10 -1.15 0.00 0.01 -1.15 -1.15 -1.15 -0.19 0.00 S
Deccan Polypacks 201406 2.12 1.47 1.85 -0.38 0.39 0.08 -0.85 -0.85 -0.85 -4.00 0.00 S
Deccan Polypacks 201409 2.12 0.37 0.07 -0.30 0.47 0.04 -0.81 -0.81 -0.81 -3.83 0.00 S
Deccan Polypacks 201412 2.12 0.23 0.00 -0.23 0.38 0.05 -0.66 -0.66 -0.66 -3.13 0.00 S
Deccan Polypacks 201503 2.12 12.65 0.02 -12.63 0.37 0.05 -13.04 0.19 -13.23 -13.23 -62.55 0.00 S
Deep Industries 201406 29.20 27.00 12.38 0.24 14.85 2.46 4.17 8.21 2.38 5.84 5.84 2.00 10.00 S
Deep Industries 201409 29.20 25.43 11.60 0.34 14.16 2.98 2.78 8.41 3.09 5.32 5.32 1.82 10.00 S
Deep Industries 201412 29.20 26.08 11.63 0.32 14.78 3.08 3.34 8.36 2.79 5.58 5.58 1.91 10.00 S
Deep Industries 201503 29.20 22.75 10.65 0.43 12.53 2.25 1.86 8.41 3.88 4.53 4.53 1.55 10.00 S
Delma Infrastructure 201406 0.25 0.10 -0.10 -0.38 -0.38 -0.38 -15.38 0.00 S
Delma Infrastructure 201409 0.25 0.12 -0.12 -0.12 -0.12 -0.12 -4.92 0.00 S
Delma Infrastructure 201412 0.25 0.11 -0.11 -0.11 -0.11 -0.11 -4.35 0.00 S
Delma Infrastructure 201503 0.25 0.25 0.14 0.11 0.05 0.05 0.05 2.04 0.00 S
Dera Paints & Chemicals 201406 5.76 0.06 0.09 -0.03 0.00 -0.03 -0.03 -0.03 -0.05 0.00 S
Dera Paints & Chemicals 201409 5.76 0.06 0.09 -0.03 0.00 -0.03 -0.03 -0.03 -0.06 0.00 S
Dera Paints & Chemicals 201412 5.76 0.03 0.05 -0.02 0.00 -0.02 -0.02 -0.02 -0.03 0.00 S
Dera Paints & Chemicals 201503 5.76 0.03 0.18 -0.14 0.01 -0.15 0.00 -0.15 -0.15 -0.26 0.00 S
Devine Impex 201406 9.53 0.10 0.11 -0.01 0.00 -0.01 0.00 -0.01 -0.01 -0.01 0.00 S
Devine Impex 201409 9.53 0.13 0.14 -0.02 0.00 -0.02 0.01 -0.01 -0.01 -0.01 0.00 S
Devine Impex 201412 9.53 0.35 0.36 0.00 0.00 0.00 0.00 0.00 0.00 0.00 S
Devine Impex 201503 9.53 4.07 4.01 0.06 0.00 0.06 0.02 0.04 0.04 0.04 0.00 S
DFL Infrastructure Finance 201406 5.95 0.00 0.68 0.03 -0.66 2.73 0.05 -3.43 -3.43 -3.43 -5.75 0.00 S
DFL Infrastructure Finance 201409 5.95 0.00 0.65 0.05 -0.59 2.73 0.05 -3.36 -3.36 -3.36 -5.64 0.00 S
DFL Infrastructure Finance 201412 5.95 0.28 0.16 0.03 0.16 2.72 0.05 -2.61 -2.61 -2.61 -4.39 0.00 S
DFL Infrastructure Finance 201503 5.95 0.00 22.12 0.05 -22.07 2.73 0.02 -24.81 -24.81 -24.81 -41.68 0.00 S
Dhanada Corporation 201406 5.59 2.04 0.00 1.55 0.02 0.51 0.52 0.34 -0.35 -0.35 -0.30 -0.05 0.00 C
Dhanada Corporation 201409 5.59 1.78 0.00 1.56 0.02 0.24 0.38 0.34 -0.48 -0.48 -0.43 -0.08 0.00 C
Dhanada Corporation 201412 5.59 2.45 0.00 1.83 0.01 0.64 0.68 0.34 -0.38 -0.38 -0.33 -0.06 0.00 C
Dhanada Corporation 201503 5.59 2.36 0.06 2.12 0.34 0.65 1.03 1.62 -6.41 -0.09 -6.32 -6.21 -1.11 0.00 C

Co_Name Year Equity N.Sale O.O.I T. Exp O.I PBIDT Int. Dep. PBT T.Tax PAT A.PAT EPS Div (%)
Exp
ecte
d R
esu
lts
on
14
Au
gu
st 2
015
Dhanlaxmi Cotex 201406 4.87 12.31 0.58 12.48 0.42 0.42 0.42 0.42 0.86 0.00 S
Dhanlaxmi Cotex 201409 4.87 5.52 1.22 5.80 0.94 0.94 0.94 0.94 1.92 0.00 S
Dhanlaxmi Cotex 201412 4.87 3.20 0.63 3.11 0.72 0.72 0.72 0.72 1.48 0.00 S
Dhanlaxmi Cotex 201503 4.87 8.35 0.38 9.09 -0.37 -0.37 -0.37 -0.37 -0.76 0.00 S
Dhanlaxmi Fabrics 201406 8.58 20.09 0.12 17.42 0.16 2.94 0.76 1.77 0.41 0.41 0.41 0.48 0.00 C
Dhanlaxmi Fabrics 201409 8.58 19.37 0.29 18.01 0.16 1.82 0.71 1.50 -0.38 -0.38 -0.38 -0.44 0.00 C
Dhanlaxmi Fabrics 201412 8.58 22.24 0.10 19.54 0.17 2.97 0.71 1.91 0.36 0.36 0.36 0.42 0.00 C
Dhanlaxmi Fabrics 201503 8.58 37.27 0.35 34.53 0.17 3.26 0.92 -0.27 2.60 0.79 1.82 1.82 0.00 C
Dhoot Industrial Finance 201406 5.42 40.26 0.49 34.51 0.17 6.39 0.28 0.13 5.98 1.69 4.29 4.29 7.91 0.00 S
Dhoot Industrial Finance 201409 5.42 25.03 -1.13 24.17 0.42 0.15 0.24 0.13 -0.23 0.09 -0.32 -0.32 -0.59 0.00 S
Dhoot Industrial Finance 201412 5.42 29.10 0.81 29.48 0.66 1.08 0.84 0.14 0.11 -0.90 1.00 1.00 1.85 0.00 S
Dhoot Industrial Finance 201503 5.42 34.80 0.87 36.43 0.66 -0.10 0.85 0.13 -1.08 -0.25 -0.83 -0.83 -1.53 0.00 S
Dhoot Industries 201406 3.73 0.12 0.10 0.02 0.02 0.00 0.01 0.01 0.03 0.00 S
Dhoot Industries 201409 3.73 0.11 0.08 0.03 0.03 0.01 0.02 0.02 0.01 0.00 S
Dhoot Industries 201412 3.73 0.14 0.11 0.02 0.02 0.02 0.02 0.06 0.00 S
Dhoot Industries 201503 3.73 0.10 0.01 0.06 0.05 0.05 0.02 0.03 0.03 0.09 0.00 S
DHP India 201406 3.00 9.40 1.52 8.45 0.25 2.72 0.03 0.36 2.33 0.76 1.57 1.57 5.23 15.00 S
DHP India 201409 3.00 8.77 1.54 7.85 0.25 2.71 0.08 0.28 2.36 0.94 1.42 1.42 4.73 15.00 S
DHP India 201412 3.00 8.69 1.24 8.27 0.53 2.20 0.04 0.46 1.70 0.47 1.23 1.23 4.10 15.00 S
DHP India 201503 3.00 7.99 1.63 7.04 0.55 3.13 0.04 0.90 2.19 0.64 1.55 1.55 5.16 15.00 S
Dhunseri Tea & Industries 201412 7.01 53.37 0.04 38.22 0.36 15.56 0.95 1.30 13.31 1.29 12.02 12.02 17.16 75.00 S
Dhunseri Tea & Industries 201503 7.01 28.68 0.07 43.38 0.67 -13.96 0.82 1.05 -15.83 -1.61 -14.21 -14.21 -20.29 75.00 S
Diana Tea Company 201406 7.50 9.67 0.00 9.16 0.57 1.08 0.27 0.27 0.55 0.55 0.55 0.37 5.00 S
Diana Tea Company 201409 7.50 14.17 0.03 6.91 0.35 7.64 0.28 0.19 7.16 7.16 7.16 4.78 5.00 S
Diana Tea Company 201412 7.50 14.04 0.00 12.51 0.63 2.16 0.33 0.30 1.54 0.47 1.07 1.07 0.71 5.00 S
Diana Tea Company 201503 7.50 6.63 0.13 13.64 0.39 -6.49 0.23 0.24 -6.96 0.02 -6.98 -6.98 -4.66 5.00 S
DIL 201406 2.29 37.12 0.20 32.42 0.04 4.94 1.16 2.69 1.09 0.21 0.88 0.83 3.63 100.00 C
DIL 201409 2.29 38.06 0.06 34.17 0.01 3.96 1.18 2.51 0.27 0.11 0.16 -0.08 -0.34 100.00 C
DIL 201412 2.29 25.64 0.04 25.77 0.01 -0.07 1.13 2.32 -3.52 -0.05 -3.47 -2.57 -11.20 100.00 C
DIL 201503 2.29 40.71 0.07 33.69 0.04 7.13 1.03 1.06 5.05 1.66 3.39 2.28 9.93 100.00 C
Diligent Industries 201406 11.44 17.79 16.78 0.07 1.08 0.65 0.12 0.31 0.10 0.21 0.21 0.19 0.00 S
Diligent Industries 201409 11.44 1.32 1.58 0.04 -0.22 0.57 0.12 -0.91 -0.91 -0.91 -0.80 0.00 S
Diligent Industries 201412 11.44 1.40 2.20 0.20 -0.60 0.58 0.12 -1.30 -1.30 -1.30 -1.13 0.00 S
Diligent Industries 201503 11.44 63.38 0.13 60.62 0.02 2.92 0.56 0.09 2.27 0.40 1.86 1.86 1.63 0.00 S
Donear Industries 201406 10.40 127.15 1.54 114.87 1.30 15.12 7.64 5.83 3.32 -0.64 3.96 3.96 0.76 10.00 S
Donear Industries 201409 10.40 121.71 1.16 109.85 2.11 15.14 7.79 5.93 1.42 0.35 1.07 1.07 0.21 10.00 S
Donear Industries 201412 10.40 117.13 1.52 105.78 2.19 15.07 7.43 6.40 1.24 -1.31 2.55 2.55 0.49 10.00 S
Donear Industries 201503 10.40 142.13 1.52 131.02 1.59 14.23 7.43 7.39 -0.58 -0.74 0.16 0.16 0.03 10.00 S
Dredging Corporation Of India 201406 28.00 184.45 4.89 147.76 0.89 42.47 7.23 23.60 11.64 0.50 11.14 11.14 3.98 30.00 S
Dredging Corporation Of India 201409 28.00 165.51 3.45 138.88 1.43 31.51 6.77 22.33 3.55 0.31 3.24 3.24 1.16 30.00 S
Dredging Corporation Of India 201412 28.00 181.80 3.41 150.36 2.24 37.09 6.88 22.58 7.63 0.35 7.28 7.28 2.60 30.00 S
Dredging Corporation Of India 201503 28.00 193.76 -2.31 124.76 4.27 70.96 4.78 23.63 42.55 1.80 40.75 40.75 14.56 30.00 S
Duncans Industries 201406 55.51 20.51 1.45 18.30 0.25 3.91 5.17 0.75 -2.01 -2.01 -2.01 -0.36 0.00 S
Duncans Industries 201409 60.76 54.88 0.34 55.40 1.11 0.93 5.30 0.70 -5.07 -5.07 -5.07 -0.84 0.00 S
Duncans Industries 201412 60.76 52.63 0.10 52.57 0.16 5.48 0.75 -6.07 -6.07 -6.07 -1.00 0.00 S
Duncans Industries 201503 60.76 40.43 0.38 82.05 -41.24 4.78 0.75 -46.77 -46.77 -46.77 -7.70 0.00 S

Co_Name Year Equity N.Sale O.O.I T. Exp O.I PBIDT Int. Dep. PBT T.Tax PAT A.PAT EPS Div (%)
Exp
ecte
d R
esu
lts
on
14
Au
gu
st 2
015
Duropack 201406 4.65 2.54 2.39 0.03 0.19 0.08 0.11 0.02 0.09 0.09 0.19 0.00 S
Duropack 201409 4.65 2.63 2.53 0.04 0.15 0.00 0.09 0.05 0.01 0.04 0.04 0.09 0.00 S
Duropack 201412 4.65 3.70 3.29 0.04 0.44 0.09 0.35 0.07 0.29 0.29 0.61 0.00 S
Duropack 201503 4.65 3.00 2.72 0.04 0.32 0.18 0.14 -0.02 0.15 0.15 0.33 0.00 S
Dwarikesh Sugar Industries 201406 16.32 262.35 0.91 239.01 0.18 24.44 13.11 7.74 3.59 3.59 3.59 1.75 0.00 S
Dwarikesh Sugar Industries 201409 16.32 99.21 0.29 95.05 0.47 4.93 10.76 7.72 -13.56 -13.56 -13.56 -8.76 0.00 S
Dwarikesh Sugar Industries 201412 16.32 152.59 1.31 159.63 0.68 -5.05 10.55 7.84 -23.44 -23.44 -23.44 -14.83 0.00 S
Dwarikesh Sugar Industries 201503 16.32 201.33 3.90 181.23 0.10 24.10 15.51 7.75 0.84 -11.66 12.50 12.50 7.18 0.00 S
Dynacons Systems & Solutions 201406 5.92 22.55 0.05 21.68 0.92 0.44 0.28 0.21 0.05 0.16 0.16 0.28 0.00 S
Dynacons Systems & Solutions 201409 5.92 29.40 0.09 28.41 1.08 0.48 0.30 0.31 0.06 0.25 0.25 0.42 0.00 S
Dynacons Systems & Solutions 201412 5.92 36.25 0.13 34.73 1.65 0.82 0.34 0.49 0.10 0.39 0.39 0.16 0.00 S
Dynacons Systems & Solutions 201503 5.92 27.44 0.19 26.59 1.04 0.53 0.33 0.18 0.18 0.00 0.00 0.00 S
Dynamatic Technologies 201406 5.76 421.70 3.26 378.66 1.13 47.43 21.36 12.20 -8.68 2.33 -11.01 -11.01 -19.64 0.00 C
Dynamatic Technologies 201409 6.04 427.02 4.88 394.49 1.05 38.46 21.29 12.74 46.08 12.03 34.05 34.05 56.75 0.00 C
Dynamatic Technologies 201412 6.34 378.97 4.52 349.21 2.02 36.30 18.75 12.61 4.94 4.37 0.57 0.57 0.91 0.00 C
Dynamatic Technologies 201503 6.34 383.78 4.70 355.39 6.41 39.50 18.55 13.36 7.59 2.55 5.04 5.04 7.95 0.00 C
Eastern Gases 201406 15.00 41.70 0.56 39.91 2.35 1.61 0.23 0.51 0.51 0.51 0.00 S
Eastern Gases 201409 15.00 57.08 0.57 55.40 2.26 1.40 0.23 0.63 0.63 0.63 0.00 S
Eastern Gases 201412 15.00 57.63 54.26 3.37 1.56 0.23 1.58 1.58 1.58 1.05 0.00 S
Eastern Gases 201503 15.00 71.99 68.33 0.21 3.87 1.55 0.99 1.33 1.33 1.33 0.88 0.00 S
Easun Reyrolle 201406 6.16 23.10 5.68 26.30 2.48 4.75 1.91 -5.09 -5.09 -5.09 -2.44 0.00 S
Easun Reyrolle 201409 6.16 17.52 0.78 16.54 1.76 7.39 1.89 -9.10 -9.10 -9.10 -2.96 0.00 S
Easun Reyrolle 201412 6.16 13.02 16.71 -3.69 6.85 1.80 -14.16 -14.16 -14.16 -4.60 0.00 S
Easun Reyrolle 201503 6.16 8.77 0.50 12.08 -2.81 7.00 1.74 -13.25 -4.30 -8.95 -8.95 -4.30 0.00 S
Effingo Textile & Trading 201406 11.00 5.04 5.05 0.07 0.06 0.06 0.02 0.04 0.04 0.00 S
Effingo Textile & Trading 201409 11.00 4.17 4.17 0.10 0.09 0.09 0.03 0.06 0.06 0.01 0.00 S
Effingo Textile & Trading 201412 11.00 5.10 5.08 0.08 0.10 0.10 0.03 0.07 0.07 0.01 0.00 S
Effingo Textile & Trading 201503 11.00 5.60 5.31 0.29 0.29 0.09 0.19 0.19 0.02 0.00 S
Effulgent Infomedia 201406 2.65 0.01 -0.01 -0.01 -0.01 -0.01 -0.03 0.00 S
Effulgent Infomedia 201409 2.65 0.02 -0.02 -0.02 -0.02 -0.02 -0.09 0.00 S
Effulgent Infomedia 201412 2.65 0.02 -0.02 -0.02 -0.02 -0.02 -0.06 0.00 S
Effulgent Infomedia 201503 2.65 0.01 -0.01 -0.01 -0.01 -0.01 -0.05 0.00 S
Elecon Engineering Company 201406 21.79 94.80 1.12 78.32 5.84 23.45 7.61 13.99 1.85 0.60 1.25 1.25 0.11 50.00 S
Elecon Engineering Company 201409 21.79 116.32 1.50 98.62 2.38 21.58 7.03 10.62 3.93 1.25 2.67 2.67 0.25 50.00 S
Elecon Engineering Company 201412 21.79 112.06 1.43 85.81 1.34 29.02 7.46 12.05 9.50 3.02 6.48 6.48 0.59 50.00 S
Elecon Engineering Company 201503 21.79 174.60 1.35 133.94 13.12 55.14 7.85 14.92 32.37 9.58 22.79 22.79 2.09 50.00 S
Electrotherm (India) 201406 11.48 378.43 472.98 0.63 -93.92 1.04 34.74 -129.70 -129.70 -129.70 -112.98 0.00 S
Electrotherm (India) 201409 11.48 482.60 561.64 0.29 -78.75 5.36 34.74 -118.85 -118.85 -118.85 -103.53 0.00 S
Electrotherm (India) 201412 11.48 465.68 527.62 0.14 -61.80 3.72 34.78 -100.30 -100.30 -100.30 -87.37 0.00 S
Electrotherm (India) 201503 11.48 502.50 559.84 6.74 -50.60 41.92 -92.52 0.02 -91.66 -92.54 -80.61 0.00 S
Enbee Trade & Finance 201406 0.25 0.04 0.02 0.02 0.02 0.01 0.02 0.02 0.61 0.00 S
Enbee Trade & Finance 201409 0.25 0.06 0.00 0.70 0.75 0.75 0.14 0.61 0.61 24.98 0.00 S
Enbee Trade & Finance 201412 0.25 0.06 0.01 0.05 0.05 0.01 0.04 0.04 1.66 0.00 S
Enbee Trade & Finance 201503 0.25 0.06 0.13 -0.07 -0.07 0.01 -0.06 -0.06 -2.30 0.00 S
Energy Development Company 201406 27.50 2.62 3.83 1.39 0.18 2.37 1.13 -3.31 -0.15 -3.16 -3.16 -1.15 5.00 S
Energy Development Company 201409 27.50 9.70 3.22 1.62 8.09 2.62 0.99 4.49 0.26 4.23 4.23 1.54 5.00 S
Energy Development Company 201412 27.50 5.09 2.72 1.54 3.91 2.42 0.95 0.54 0.30 0.24 0.24 0.09 5.00 S
Energy Development Company 201503 27.50 4.35 5.03 1.64 0.97 0.30 1.00 -0.33 -0.40 0.07 0.07 0.03 5.00 S
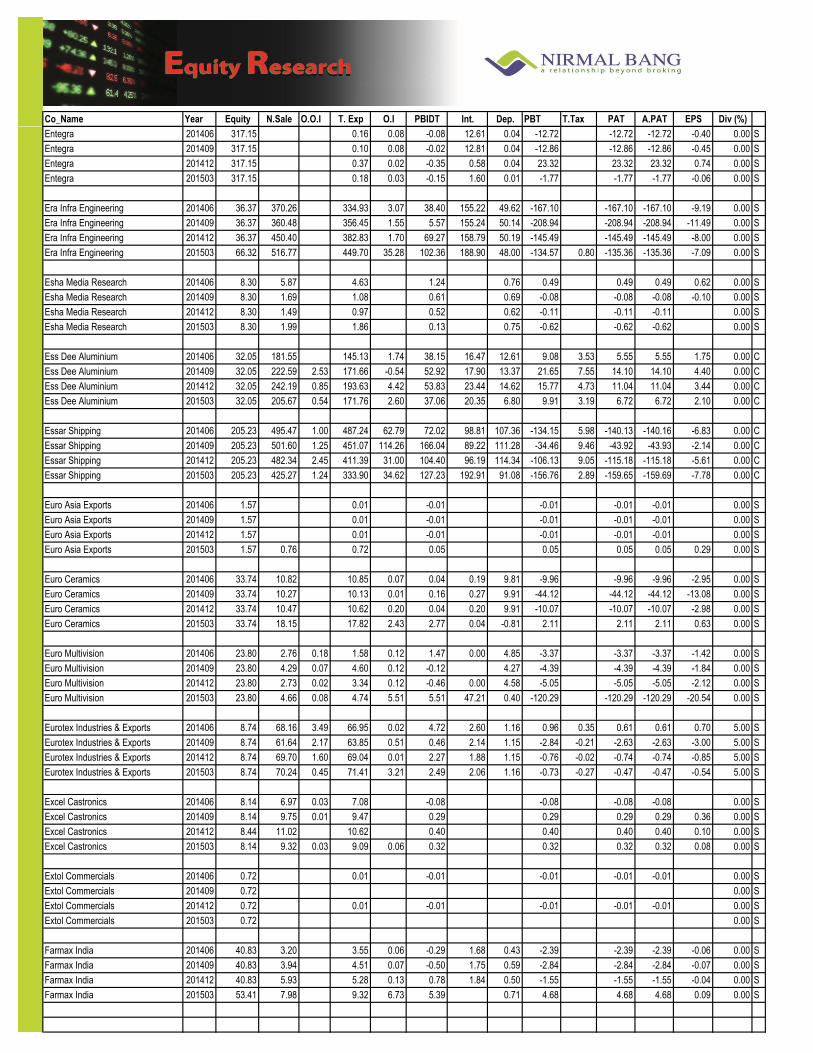
Co_Name Year Equity N.Sale O.O.I T. Exp O.I PBIDT Int. Dep. PBT T.Tax PAT A.PAT EPS Div (%)
Exp
ecte
d R
esu
lts
on
14
Au
gu
st 2
015
Entegra 201406 317.15 0.16 0.08 -0.08 12.61 0.04 -12.72 -12.72 -12.72 -0.40 0.00 S
Entegra 201409 317.15 0.10 0.08 -0.02 12.81 0.04 -12.86 -12.86 -12.86 -0.45 0.00 S
Entegra 201412 317.15 0.37 0.02 -0.35 0.58 0.04 23.32 23.32 23.32 0.74 0.00 S
Entegra 201503 317.15 0.18 0.03 -0.15 1.60 0.01 -1.77 -1.77 -1.77 -0.06 0.00 S
Era Infra Engineering 201406 36.37 370.26 334.93 3.07 38.40 155.22 49.62 -167.10 -167.10 -167.10 -9.19 0.00 S
Era Infra Engineering 201409 36.37 360.48 356.45 1.55 5.57 155.24 50.14 -208.94 -208.94 -208.94 -11.49 0.00 S
Era Infra Engineering 201412 36.37 450.40 382.83 1.70 69.27 158.79 50.19 -145.49 -145.49 -145.49 -8.00 0.00 S
Era Infra Engineering 201503 66.32 516.77 449.70 35.28 102.36 188.90 48.00 -134.57 0.80 -135.36 -135.36 -7.09 0.00 S
Esha Media Research 201406 8.30 5.87 4.63 1.24 0.76 0.49 0.49 0.49 0.62 0.00 S
Esha Media Research 201409 8.30 1.69 1.08 0.61 0.69 -0.08 -0.08 -0.08 -0.10 0.00 S
Esha Media Research 201412 8.30 1.49 0.97 0.52 0.62 -0.11 -0.11 -0.11 0.00 S
Esha Media Research 201503 8.30 1.99 1.86 0.13 0.75 -0.62 -0.62 -0.62 0.00 S
Ess Dee Aluminium 201406 32.05 181.55 145.13 1.74 38.15 16.47 12.61 9.08 3.53 5.55 5.55 1.75 0.00 C
Ess Dee Aluminium 201409 32.05 222.59 2.53 171.66 -0.54 52.92 17.90 13.37 21.65 7.55 14.10 14.10 4.40 0.00 C
Ess Dee Aluminium 201412 32.05 242.19 0.85 193.63 4.42 53.83 23.44 14.62 15.77 4.73 11.04 11.04 3.44 0.00 C
Ess Dee Aluminium 201503 32.05 205.67 0.54 171.76 2.60 37.06 20.35 6.80 9.91 3.19 6.72 6.72 2.10 0.00 C
Essar Shipping 201406 205.23 495.47 1.00 487.24 62.79 72.02 98.81 107.36 -134.15 5.98 -140.13 -140.16 -6.83 0.00 C
Essar Shipping 201409 205.23 501.60 1.25 451.07 114.26 166.04 89.22 111.28 -34.46 9.46 -43.92 -43.93 -2.14 0.00 C
Essar Shipping 201412 205.23 482.34 2.45 411.39 31.00 104.40 96.19 114.34 -106.13 9.05 -115.18 -115.18 -5.61 0.00 C
Essar Shipping 201503 205.23 425.27 1.24 333.90 34.62 127.23 192.91 91.08 -156.76 2.89 -159.65 -159.69 -7.78 0.00 C
Euro Asia Exports 201406 1.57 0.01 -0.01 -0.01 -0.01 -0.01 0.00 S
Euro Asia Exports 201409 1.57 0.01 -0.01 -0.01 -0.01 -0.01 0.00 S
Euro Asia Exports 201412 1.57 0.01 -0.01 -0.01 -0.01 -0.01 0.00 S
Euro Asia Exports 201503 1.57 0.76 0.72 0.05 0.05 0.05 0.05 0.29 0.00 S
Euro Ceramics 201406 33.74 10.82 10.85 0.07 0.04 0.19 9.81 -9.96 -9.96 -9.96 -2.95 0.00 S
Euro Ceramics 201409 33.74 10.27 10.13 0.01 0.16 0.27 9.91 -44.12 -44.12 -44.12 -13.08 0.00 S
Euro Ceramics 201412 33.74 10.47 10.62 0.20 0.04 0.20 9.91 -10.07 -10.07 -10.07 -2.98 0.00 S
Euro Ceramics 201503 33.74 18.15 17.82 2.43 2.77 0.04 -0.81 2.11 2.11 2.11 0.63 0.00 S
Euro Multivision 201406 23.80 2.76 0.18 1.58 0.12 1.47 0.00 4.85 -3.37 -3.37 -3.37 -1.42 0.00 S
Euro Multivision 201409 23.80 4.29 0.07 4.60 0.12 -0.12 4.27 -4.39 -4.39 -4.39 -1.84 0.00 S
Euro Multivision 201412 23.80 2.73 0.02 3.34 0.12 -0.46 0.00 4.58 -5.05 -5.05 -5.05 -2.12 0.00 S
Euro Multivision 201503 23.80 4.66 0.08 4.74 5.51 5.51 47.21 0.40 -120.29 -120.29 -120.29 -20.54 0.00 S
Eurotex Industries & Exports 201406 8.74 68.16 3.49 66.95 0.02 4.72 2.60 1.16 0.96 0.35 0.61 0.61 0.70 5.00 S
Eurotex Industries & Exports 201409 8.74 61.64 2.17 63.85 0.51 0.46 2.14 1.15 -2.84 -0.21 -2.63 -2.63 -3.00 5.00 S
Eurotex Industries & Exports 201412 8.74 69.70 1.60 69.04 0.01 2.27 1.88 1.15 -0.76 -0.02 -0.74 -0.74 -0.85 5.00 S
Eurotex Industries & Exports 201503 8.74 70.24 0.45 71.41 3.21 2.49 2.06 1.16 -0.73 -0.27 -0.47 -0.47 -0.54 5.00 S
Excel Castronics 201406 8.14 6.97 0.03 7.08 -0.08 -0.08 -0.08 -0.08 0.00 S
Excel Castronics 201409 8.14 9.75 0.01 9.47 0.29 0.29 0.29 0.29 0.36 0.00 S
Excel Castronics 201412 8.44 11.02 10.62 0.40 0.40 0.40 0.40 0.10 0.00 S
Excel Castronics 201503 8.14 9.32 0.03 9.09 0.06 0.32 0.32 0.32 0.32 0.08 0.00 S
Extol Commercials 201406 0.72 0.01 -0.01 -0.01 -0.01 -0.01 0.00 S
Extol Commercials 201409 0.72 0.00 S
Extol Commercials 201412 0.72 0.01 -0.01 -0.01 -0.01 -0.01 0.00 S
Extol Commercials 201503 0.72 0.00 S
Farmax India 201406 40.83 3.20 3.55 0.06 -0.29 1.68 0.43 -2.39 -2.39 -2.39 -0.06 0.00 S
Farmax India 201409 40.83 3.94 4.51 0.07 -0.50 1.75 0.59 -2.84 -2.84 -2.84 -0.07 0.00 S
Farmax India 201412 40.83 5.93 5.28 0.13 0.78 1.84 0.50 -1.55 -1.55 -1.55 -0.04 0.00 S
Farmax India 201503 53.41 7.98 9.32 6.73 5.39 0.71 4.68 4.68 4.68 0.09 0.00 S

Co_Name Year Equity N.Sale O.O.I T. Exp O.I PBIDT Int. Dep. PBT T.Tax PAT A.PAT EPS Div (%)
Exp
ecte
d R
esu
lts
on
14
Au
gu
st 2
015
FCS Software Solutions 201406 165.96 20.29 21.35 0.88 -0.18 0.25 10.01 -10.43 0.12 -10.56 -10.56 -0.06 0.00 C
FCS Software Solutions 201409 165.96 16.06 17.16 0.71 -0.39 0.17 10.23 -10.80 0.04 -10.84 -10.84 -0.07 0.00 C
FCS Software Solutions 201412 165.96 23.15 27.37 2.76 -1.47 0.38 9.94 -11.79 0.73 -12.52 -12.52 -0.08 0.00 C
FCS Software Solutions 201503 165.96 19.91 22.68 1.98 -0.79 0.04 10.39 -11.23 -0.18 -11.05 -11.05 -0.07 0.00 C
FE India 201406 8.20 224.76 0.46 219.02 0.24 6.44 4.48 0.15 2.21 0.72 1.49 1.49 1.82 0.00 S
FE India 201409 8.20 189.65 0.26 184.64 0.00 5.27 3.69 0.15 1.43 0.47 0.97 0.97 1.18 0.00 S
FE India 201412 8.20 197.72 0.79 193.23 0.04 5.31 3.66 0.15 1.51 0.49 1.02 1.02 1.18 0.00 S
FE India 201503 16.08 242.90 0.25 235.96 1.86 9.05 6.74 0.20 2.11 0.55 1.55 1.55 0.97 0.00 S
Filatex Fashions 201406 5.95 5.50 5.58 0.00 -0.08 0.16 -0.24 0.00 -0.24 -0.24 -0.20 0.00 S
Filatex Fashions 201409 6.90 5.31 5.19 0.00 0.12 0.16 -0.04 -0.04 -0.04 -0.03 0.00 S
Filatex Fashions 201412 6.90 6.62 5.90 0.00 0.72 0.07 0.16 0.50 0.50 0.50 0.42 0.00 S
Filatex Fashions 201503 6.90 7.47 7.19 0.15 0.42 0.20 0.22 0.22 0.22 0.00 S
Filatex India 201406 28.24 435.70 1.18 416.34 2.33 22.87 13.50 5.29 4.08 1.34 2.74 2.74 0.97 0.00 S
Filatex India 201409 32.00 480.73 1.77 461.12 2.55 23.93 14.03 5.14 4.76 1.60 3.16 3.16 1.07 0.00 S
Filatex India 201412 32.00 383.04 1.13 367.13 2.39 19.43 13.06 5.19 1.18 0.40 0.78 0.78 0.24 0.00 S
Filatex India 201503 32.00 268.93 1.01 250.03 2.42 22.33 13.01 4.95 4.37 1.45 2.92 2.92 0.95 0.00 S
First Custodian Fund (India) 201406 1.50 0.14 0.07 0.11 0.10 0.01 0.01 0.09 0.09 0.09 0.57 0.00 S
First Custodian Fund (India) 201409 1.50 -0.08 0.07 0.07 -0.08 0.00 0.01 -0.09 -0.09 -0.09 -0.58 0.00 S
First Custodian Fund (India) 201412 1.50 -0.06 0.07 0.06 -0.05 0.00 0.01 -0.06 -0.06 -0.06 -0.43 0.00 S
First Custodian Fund (India) 201503 1.50 0.01 0.12 0.06 0.08 0.00 0.01 0.07 0.00 0.07 0.07 0.05 0.00 S
First Financial Services 201406 8.08 0.12 0.04 0.08 0.00 0.08 0.08 0.08 0.01 0.00 S
First Financial Services 201409 8.08 3.00 0.08 3.02 0.00 0.05 0.00 0.05 0.00 0.05 0.05 0.01 0.00 S
First Financial Services 201412 8.08 3.52 0.21 3.55 0.17 0.17 0.17 0.17 0.02 0.00 S
First Financial Services 201503 8.08 0.30 0.67 -0.37 0.00 -0.37 -0.37 -0.37 0.02 0.00 S
Fluidomat 201406 4.93 5.81 0.00 4.45 0.29 1.66 0.00 0.18 1.47 0.46 1.01 1.01 2.05 27.50 S
Fluidomat 201409 4.93 8.36 0.02 5.64 0.19 2.91 0.16 2.75 0.91 1.85 1.85 3.74 27.50 S
Fluidomat 201412 4.93 6.12 0.03 4.50 0.28 1.93 0.18 1.74 0.56 1.18 1.18 2.39 27.50 S
Fluidomat 201503 4.93 6.75 0.02 4.95 0.32 2.14 0.00 0.19 1.95 0.66 1.29 1.29 2.63 27.50 S
Fomento Resorts & Hotels 201406 16.00 12.31 0.14 8.84 1.21 4.82 0.95 3.87 1.31 2.56 2.56 1.60 10.00 S
Fomento Resorts & Hotels 201409 16.00 8.30 0.38 8.57 1.21 1.32 0.47 0.85 0.29 0.56 0.56 0.35 10.00 S
Fomento Resorts & Hotels 201412 16.00 16.52 0.08 10.78 1.32 7.14 0.62 6.52 1.81 4.71 4.71 2.95 10.00 S
Fomento Resorts & Hotels 201503 16.00 17.34 0.42 12.07 1.65 7.34 0.31 1.60 9.38 3.79 5.59 5.59 2.86 10.00 S
Freshtrop Fruits 201406 12.15 65.46 4.32 58.20 0.50 12.08 0.64 1.21 10.23 3.40 6.83 6.83 5.62 10.00 S
Freshtrop Fruits 201409 12.15 8.43 1.80 8.17 0.14 2.20 0.30 1.18 0.72 0.42 0.30 0.30 0.24 10.00 S
Freshtrop Fruits 201412 12.15 5.33 0.81 6.04 0.30 0.40 0.44 1.16 -1.20 -0.41 -0.79 -0.79 -0.65 10.00 S
Freshtrop Fruits 201503 12.15 34.38 -0.04 32.09 1.67 3.92 0.56 0.23 2.66 1.40 1.25 1.25 1.03 10.00 S
Frontier Springs 201406 3.96 6.92 6.68 0.03 0.27 0.20 0.41 -0.34 0.15 -0.49 -0.49 -1.25 0.00 S
Frontier Springs 201409 3.96 8.13 7.92 0.12 0.33 0.22 0.32 -0.21 -0.03 -0.18 -0.18 -0.46 0.00 S
Frontier Springs 201412 3.96 8.60 8.16 0.03 0.47 0.23 0.36 -0.12 -0.03 -0.09 -0.09 -0.23 0.00 S
Frontier Springs 201503 3.96 12.64 10.93 0.04 1.74 0.21 0.24 1.29 0.07 1.22 1.22 3.11 0.00 S
Frontline Corporation 201406 4.98 10.63 0.03 10.34 0.30 0.61 1.27 0.44 -1.10 -0.71 -1.10 -1.43 0.00 S
Frontline Corporation 201409 4.98 8.72 0.02 7.95 0.31 1.10 1.30 0.22 -0.42 -0.46 -0.42 -0.92 0.00 S
Frontline Corporation 201412 4.98 9.07 0.02 9.09 0.29 0.30 1.28 0.21 -1.19 -1.02 -1.19 -2.05 0.00 S
Frontline Corporation 201503 4.98 9.01 0.04 8.57 1.03 1.49 1.29 0.17 0.04 -0.23 0.22 0.27 0.45 0.00 S
Futuristic Offshore Services & Chemical201406 17.32 0.00 S
Futuristic Offshore Services & Chemical201409 17.32 0.00 S
Futuristic Offshore Services & Chemical201412 17.32 0.00 0.00 0.00 0.00 0.00 0.00 S
Futuristic Offshore Services & Chemical201503 17.32 0.09 -0.09 -0.09 -0.10 -0.09 -0.06 0.00 S

Co_Name Year Equity N.Sale O.O.I T. Exp O.I PBIDT Int. Dep. PBT T.Tax PAT A.PAT EPS Div (%)
Exp
ecte
d R
esu
lts
on
14
Au
gu
st 2
015
Gaekwar Mills 201406 2.00 0.02 0.05 0.03 0.67 -0.63 -0.63 -0.63 -31.66 0.00 S
Gaekwar Mills 201409 2.00 0.04 0.06 0.02 0.67 -0.65 -0.65 -0.65 -32.33 0.00 S
Gaekwar Mills 201412 2.00 0.11 0.17 0.06 0.88 -0.82 -0.82 -0.82 -40.98 0.00 S
Gaekwar Mills 201503 2.00 0.04 0.16 0.13 0.93 -0.80 -0.80 -0.80 -40.11 0.00 S
Gajanan Securities Services 201406 3.10 0.02 0.11 0.02 -0.07 0.00 0.00 -0.07 -0.07 -0.07 -0.22 0.00 S
Gajanan Securities Services 201409 3.10 0.01 0.04 0.02 -0.01 0.00 0.00 -0.01 -0.01 -0.01 -0.03 0.00 S
Gajanan Securities Services 201412 3.10 0.02 0.04 0.02 0.01 0.00 0.01 0.01 0.01 0.02 0.00 S
Gajanan Securities Services 201503 3.10 0.00 0.11 0.02 -0.08 0.00 0.01 -0.09 -0.09 -0.09 -0.27 0.00 S
Gajra Bevel Gears 201406 9.40 0.06 -0.06 0.01 -0.08 -0.08 -0.08 -0.08 0.00 S
Gajra Bevel Gears 201409 9.40 0.06 -0.06 0.01 -0.07 -0.07 -0.07 -0.08 0.00 S
Gajra Bevel Gears 201412 9.40 0.06 -0.06 0.01 -0.07 -0.07 -0.07 -0.08 0.00 S
Gajra Bevel Gears 201503 9.40 0.03 0.00 -0.03 0.03 3.96 3.96 3.96 4.21 0.00 S
Galada Power & Telecommunication 201406 7.49 1.50 0.13 1.86 0.19 -0.04 1.26 0.13 16.80 16.80 16.80 22.43 0.00 S
Galada Power & Telecommunication 201409 7.49 2.20 0.10 2.37 0.17 0.10 1.27 0.10 -3.76 -3.76 -3.76 -5.03 0.00 S
Galada Power & Telecommunication 201412 7.49 1.30 0.03 1.81 1.94 1.46 1.73 0.11 63.57 63.57 63.57 84.89 0.00 S
Galada Power & Telecommunication 201503 7.49 1.15 1.88 0.93 0.20 -1.37 0.34 -1.38 -1.38 -1.38 -1.84 0.00 S
Gallops Enterprises 201406 5.01 0.01 -0.01 -0.01 -0.01 -0.01 0.00 S
Gallops Enterprises 201409 5.01 0.01 -0.01 -0.01 -0.01 -0.01 0.00 S
Gallops Enterprises 201412 5.01 0.01 -0.01 -0.01 -0.01 -0.01 0.00 S
Gammon India 201406 27.16 922.82 896.94 43.13 69.01 147.90 27.21 -106.10 14.17 -120.27 -120.27 -8.86 0.00 S
Gammon India 201409 27.16 902.97 978.02 632.02 556.97 161.40 27.02 368.55 6.89 361.66 361.66 26.64 0.00 S
Gammon India 201412 27.16 699.37 728.64 52.03 22.76 164.06 36.50 -177.80 -17.05 -160.75 -160.75 -11.84 0.00 S
Gammon India 201503 27.16 1019.02 922.44 61.11 157.69 168.56 46.86 -62.16 11.37 -73.53 -73.53 -5.42 0.00 S
Ganesh Benzoplast 201406 5.18 28.25 19.84 0.08 8.48 3.35 4.92 -0.22 -0.22 -0.22 0.04 0.00 S
Ganesh Benzoplast 201409 5.18 26.73 18.24 0.09 8.58 3.74 4.93 -0.46 -0.46 -0.46 -0.09 0.00 S
Ganesh Benzoplast 201412 5.18 28.65 20.13 0.05 8.57 3.50 4.93 1.05 1.05 1.05 0.20 0.00 S
Ganesh Benzoplast 201503 5.18 38.64 41.85 0.11 -3.10 4.13 4.25 -0.29 -0.29 -0.29 -0.06 0.00 S
Ganesh Housing Corporation 201406 32.66 58.72 2.70 28.79 0.08 32.71 15.02 0.78 16.92 4.43 12.49 10.55 3.23 26.00 C
Ganesh Housing Corporation 201409 32.67 65.91 0.28 32.14 0.10 34.14 15.29 0.99 17.86 5.14 12.73 13.03 3.99 26.00 C
Ganesh Housing Corporation 201412 32.67 51.05 1.90 19.33 0.18 33.80 15.40 0.97 17.43 3.97 13.45 13.50 4.13 26.00 C
Ganesh Housing Corporation 201503 32.67 75.62 1.96 38.61 0.22 39.18 14.83 0.99 23.36 6.82 16.54 14.95 4.57 26.00 C
Ganga Papers India 201406 10.79 17.19 0.02 16.55 0.07 0.74 0.44 0.14 0.16 0.16 0.16 0.15 0.00 S
Ganga Papers India 201409 10.79 19.17 0.04 18.67 0.07 0.61 0.41 0.14 0.06 0.06 0.06 0.05 0.00 S
Ganga Papers India 201412 10.79 18.76 0.04 17.96 0.05 0.89 0.39 0.14 0.35 0.35 0.35 0.32 0.00 S
Ganga Papers India 201503 10.79 19.83 0.04 18.85 0.21 1.23 0.44 0.21 0.59 0.13 0.46 0.46 0.42 0.00 S
Gangotri Cement 201406 3.34 0.30 0.02 0.30 0.01 0.02 0.01 0.01 0.01 0.01 0.02 0.00 S
Gangotri Cement 201409 3.34 0.76 0.73 0.03 0.03 0.00 0.00 0.00 0.01 0.00 S
Gangotri Cement 201412 3.34 0.90 0.88 0.01 0.03 0.00 0.02 0.01 0.01 0.01 0.04 0.00 S
Gangotri Cement 201503 3.34 0.12 -0.02 0.12 0.11 0.09 0.04 0.05 0.01 -0.01 0.02 0.02 0.00 S
Ganon Trading & Finance Company 201406 9.33 0.02 -0.02 -0.02 -0.02 -0.02 0.40 S
Ganon Trading & Finance Company 201409 9.33 13.10 13.21 -0.12 -0.12 -0.12 -0.12 -0.12 0.40 S
Ganon Trading & Finance Company 201412 9.33 94.85 94.73 0.12 0.12 0.12 0.12 0.13 0.40 S
Ganon Trading & Finance Company 201503 9.33 43.32 43.08 0.25 0.06 0.19 0.06 0.13 0.13 0.13 0.40 S
Garnet Construction 201406 13.90 4.91 3.17 0.00 1.74 0.62 0.13 1.00 0.15 0.85 0.85 0.61 0.00 S
Garnet Construction 201409 13.90 1.08 0.16 0.02 0.94 0.72 0.13 0.09 0.09 0.09 0.07 0.00 S
Garnet Construction 201412 13.90 9.00 8.57 0.08 0.51 0.26 0.13 0.12 0.12 0.12 0.08 0.00 S
Garnet Construction 201503 13.90 13.61 10.76 0.06 2.91 1.01 0.56 1.34 1.72 -0.38 -0.38 -0.27 0.00 S

Co_Name Year Equity N.Sale O.O.I T. Exp O.I PBIDT Int. Dep. PBT T.Tax PAT A.PAT EPS Div (%)
Exp
ecte
d R
esu
lts
on
14
Au
gu
st 2
015
Garware Marine Industries 201406 5.77 0.55 1.82 0.04 -1.24 0.02 0.00 -1.26 -0.13 -1.13 -1.13 -1.95 0.00 S
Garware Marine Industries 201409 5.77 0.27 0.25 0.18 0.20 0.01 0.00 0.18 0.18 0.18 0.32 0.00 S
Garware Marine Industries 201412 5.77 0.24 0.29 0.07 0.02 0.01 0.00 0.01 0.01 0.01 0.01 0.00 S
Garware Marine Industries 201503 5.77 0.44 1.26 0.03 -0.80 0.01 0.01 -0.82 0.14 -0.95 -0.95 -1.65 0.00 S
Gayatri Bio Organics 201406 50.93 123.24 0.16 120.33 0.08 3.14 1.41 1.07 0.66 0.66 0.66 0.02 0.00 S
Gayatri Bio Organics 201409 50.93 48.17 0.16 43.55 0.05 4.83 1.83 1.08 1.92 0.48 1.44 1.44 0.18 0.00 S
Gayatri Bio Organics 201412 50.93 47.65 0.34 45.65 0.04 2.40 2.25 0.32 0.84 0.15 0.69 0.69 0.03 0.00 S
Gayatri Bio Organics 201503 50.93 36.64 0.20 31.72 0.09 5.21 3.91 -0.10 1.39 0.26 1.14 1.14 0.12 0.00 S
Gayatri Projects 201406 30.23 340.98 1.21 291.86 0.23 50.56 38.94 7.74 3.89 1.65 2.24 2.24 0.74 20.00 S
Gayatri Projects 201409 30.23 303.55 2.77 261.19 0.45 45.58 37.32 7.24 1.02 -0.11 1.14 1.14 0.38 20.00 S
Gayatri Projects 201412 30.23 391.60 0.94 361.34 1.13 32.34 20.99 6.73 4.62 1.90 2.73 2.73 0.90 20.00 S
Gayatri Projects 201503 30.23 559.21 0.87 485.40 2.58 77.26 45.21 6.49 25.56 9.60 15.96 15.96 5.28 20.00 S
Gayatri Sugars 201406 43.70 85.50 0.15 92.77 0.01 -7.11 5.54 3.20 -23.41 -23.41 -23.41 -5.42 0.00 S
Gayatri Sugars 201409 43.70 23.61 30.41 -6.80 5.91 3.21 -15.92 -15.92 -15.92 -3.71 0.00 S
Gayatri Sugars 201412 43.70 35.70 0.21 39.20 -3.29 5.70 3.23 -12.22 -12.22 -12.22 -2.92 0.00 S
Gayatri Sugars 201503 43.70 85.71 0.37 84.64 0.21 1.65 4.58 1.85 -10.84 -10.84 -10.84 -2.62 0.00 S
Gayatri Tissue & Papers 201406 1.50 1.15 1.06 0.09 0.09 0.03 0.06 0.06 0.43 0.00 S
Gayatri Tissue & Papers 201409 1.50 0.91 0.84 0.07 0.07 0.02 0.05 0.05 0.33 0.00 S
Gayatri Tissue & Papers 201412 1.50 0.76 0.68 0.08 0.08 0.02 0.05 0.05 0.36 0.00 S
Gayatri Tissue & Papers 201503 1.50 1.03 0.04 1.01 0.06 0.06 0.02 0.04 0.04 0.28 0.00 S
GEI Industrial Systems 201406 19.68 9.55 12.21 0.01 -2.65 7.84 1.80 -12.29 -12.29 -12.29 0.00 C
GEI Industrial Systems 201409 19.68 7.89 10.62 0.13 -2.61 8.58 1.80 -12.99 -12.99 -12.99 0.00 C
GEI Industrial Systems 201412 19.68 5.29 5.92 0.02 -0.60 4.19 1.80 -6.60 -6.60 -6.60 0.00 C
GEI Industrial Systems 201503 19.68 6.59 0.90 15.65 0.61 -7.55 0.21 5.37 -13.13 -13.13 -13.13 -6.67 0.00 C
Gem Spinners India 201406 30.69 4.91 5.26 0.00 -0.35 0.00 -0.35 0.00 -0.35 -0.35 -0.06 0.00 S
Gem Spinners India 201409 30.69 4.26 4.61 0.22 -0.14 0.00 0.07 -0.21 -0.21 -0.21 -0.03 0.00 S
Gem Spinners India 201412 30.69 2.37 2.71 0.00 -0.33 0.00 0.07 -0.41 -0.41 -0.41 -0.07 0.00 S
Gem Spinners India 201503 30.69 1.82 2.12 0.02 -0.29 0.01 8.05 -8.34 0.94 -8.34 0.15 0.00 S
Gemmia Oiltech (India) 201406 346.29 1.01 0.66 0.36 0.22 0.01 0.12 0.02 0.10 0.10 0.00 S
Gemmia Oiltech (India) 201409 346.29 -1.01 -0.26 0.06 -0.70 0.03 -0.73 -0.01 -0.72 -0.72 -0.02 0.00 S
Gemmia Oiltech (India) 201412 346.29 0.04 -0.04 0.06 0.01 -0.11 -0.11 -0.11 0.00 S
Gemmia Oiltech (India) 201503 346.29 -0.02 0.02 0.05 0.01 -0.05 0.00 -0.05 -0.05 0.00 S
Gemstone Investments 201406 7.48 0.42 0.08 0.34 0.03 0.00 0.31 0.31 0.31 0.04 0.00 S
Gemstone Investments 201409 7.48 0.47 0.09 0.38 0.03 0.00 0.35 0.35 0.35 0.05 0.00 S
Gemstone Investments 201412 7.48 0.90 0.09 0.81 0.03 0.00 0.77 0.77 0.77 0.10 0.00 S
Gemstone Investments 201503 7.48 0.53 1.32 -0.78 0.03 0.01 -0.81 0.21 -1.02 -1.02 -0.14 0.00 S
Genera Agri Corp 201406 9.00 7.28 6.98 0.31 0.11 0.20 0.01 0.20 0.20 0.22 0.00 S
Genera Agri Corp 201409 9.00 6.81 6.53 0.29 0.11 0.18 0.01 0.18 0.18 0.20 0.00 S
Genera Agri Corp 201412 9.00 5.62 5.40 0.22 0.11 0.12 0.01 0.11 0.11 0.12 0.00 S
Genera Agri Corp 201503 9.00 12.59 12.03 0.56 0.11 0.45 0.04 0.41 0.41 0.46 0.00 S
Genesys International Corporation 201406 14.92 15.96 12.13 0.59 4.43 0.42 2.10 1.91 0.16 1.75 1.75 0.58 2.50 S
Genesys International Corporation 201409 14.92 15.53 12.86 0.53 3.21 0.52 2.06 0.63 0.34 0.29 0.29 0.10 2.50 S
Genesys International Corporation 201412 14.22 14.70 12.48 1.47 3.69 0.48 2.14 1.08 -0.14 1.21 1.21 0.41 2.50 S
Genesys International Corporation 201503 15.22 14.07 10.08 -0.04 3.95 0.45 1.98 1.53 0.19 1.33 1.33 0.44 2.50 S
Gennex Laboratories 201406 12.65 7.69 0.01 7.17 0.02 0.56 0.07 0.15 0.35 0.35 0.35 0.03 0.00 S
Gennex Laboratories 201409 12.65 8.30 0.01 7.64 0.01 0.68 0.10 0.28 0.30 0.05 0.25 0.25 0.02 0.00 S
Gennex Laboratories 201412 12.65 6.63 0.01 6.35 0.12 0.41 0.10 0.26 0.05 0.05 0.05 0.00 S
Gennex Laboratories 201503 12.65 9.24 0.01 8.72 0.03 0.57 0.21 0.20 0.16 0.15 0.01 0.01 0.02 0.00 S
Genus Paper & Boards 201503 25.71 82.28 74.82 0.84 8.30 1.90 3.02 3.38 1.11 2.27 2.27 0.09 0.00 S

Co_Name Year Equity N.Sale O.O.I T. Exp O.I PBIDT Int. Dep. PBT T.Tax PAT A.PAT EPS Div (%)
Exp
ecte
d R
esu
lts
on
14
Au
gu
st 2
015
Genus Prime Infrastructures 201406 2.82 0.03 -0.03 -0.03 -0.03 -0.03 -0.02 0.00 S
Genus Prime Infrastructures 201409 2.82 0.03 -0.03 -0.03 -0.03 -0.03 -0.02 0.00 S
Genus Prime Infrastructures 201412 2.82 0.03 -0.03 -0.03 -0.03 -0.03 -0.02 0.00 S
Genus Prime Infrastructures 201503 2.82 0.05 -0.05 -0.05 -0.05 -0.05 -0.04 0.00 S
GI Engineering Solutions 201406 8.61 0.01 0.03 0.00 -0.02 0.00 -0.02 -0.02 -0.02 -0.03 0.00 S
GI Engineering Solutions 201409 8.61 0.01 0.03 -0.02 -0.02 -0.02 -0.02 -0.02 0.00 S
GI Engineering Solutions 201412 8.61 0.01 0.05 -0.04 0.00 -0.04 0.00 -0.04 -0.04 -0.05 0.00 S
GI Engineering Solutions 201503 8.61 0.01 0.03 0.00 -0.01 -0.01 -0.01 -0.01 -0.02 0.00 S
Gita Renewable Energy 201412 4.11 0.31 0.19 0.12 0.61 0.98 -1.46 -1.46 -1.46 -3.43 0.00 S
Gita Renewable Energy 201503 4.11 0.09 0.15 0.33 0.27 0.82 0.98 -1.52 -1.52 -1.52 -3.58 0.00 S
Gitanjali Gems 201406 98.12 2072.87 1842.94 8.73 238.66 208.09 7.43 12.94 2.20 10.74 10.15 1.08 0.00 C
Gitanjali Gems 201409 98.12 2471.11 2190.30 -26.25 254.57 222.21 10.49 24.31 4.90 19.41 18.34 1.91 0.00 C
Gitanjali Gems 201412 98.12 3449.71 3229.27 154.98 375.43 269.80 9.29 96.19 -0.83 97.02 96.02 9.93 0.00 C
Gitanjali Gems 201503 98.12 3487.37 3207.87 -38.93 240.57 204.06 19.67 -45.02 -7.44 -37.58 -29.01 -2.99 0.00 C
Global Films & Broadcasting 201412 6.00 1.23 1.21 0.01 0.01 0.01 0.01 0.00 S
Global Films & Broadcasting 201503 6.00 1.13 1.14 -0.01 0.00 -0.01 -0.01 -0.01 0.00 S
Globus Corporation 201406 12.75 0.09 0.93 -0.83 -0.83 -0.83 -0.83 -0.13 0.00 S
Globus Corporation 201409 12.75 0.02 2.19 0.00 -2.17 0.06 -2.23 -2.23 -2.23 -0.35 0.00 S
Globus Corporation 201412 12.75 0.01 0.29 -0.28 -0.28 -0.28 -0.28 -0.04 0.00 S
Globus Corporation 201503 12.75 0.03 0.17 0.00 -0.14 0.30 -0.43 -0.43 -0.43 -0.07 0.00 S
GOL Offshore 201406 37.24 228.66 122.23 11.09 117.52 64.86 44.94 7.72 4.20 3.52 3.52 0.95 0.00 S
GOL Offshore 201409 37.24 249.79 155.67 9.61 103.73 57.21 44.45 2.07 4.77 -2.70 -2.70 -0.73 0.00 S
GOL Offshore 201412 37.24 277.90 205.13 9.15 81.92 59.30 39.29 -16.67 -0.09 -16.58 -16.58 -4.45 0.00 S
GOL Offshore 201503 37.24 301.14 0.26 225.51 10.91 86.80 60.03 36.36 -9.59 -12.56 2.97 2.97 0.80 0.00 S
Gold Line International Finvest 201406 52.10 0.29 0.26 0.03 0.01 0.02 0.02 0.02 0.00 S
Gold Line International Finvest 201409 52.10 0.33 0.21 0.12 0.01 0.11 0.04 0.07 0.07 0.01 0.00 S
Gold Line International Finvest 201412 52.10 0.41 0.15 0.25 0.01 0.24 0.24 0.24 0.05 0.00 S
Gold Line International Finvest 201503 52.10 4.86 0.00 4.61 0.25 0.06 0.19 0.14 0.05 0.05 0.01 0.00 S
Goldcrest Corporation 201406 7.56 6.09 1.96 6.22 0.04 1.88 0.01 0.43 1.44 0.30 1.14 1.14 1.51 10.00 C
Goldcrest Corporation 201409 7.56 1.67 3.09 2.86 0.08 1.99 0.02 0.44 1.53 0.30 1.23 1.23 1.63 10.00 C
Goldcrest Corporation 201412 7.56 14.84 0.79 12.82 0.02 2.82 0.02 -0.61 3.41 0.70 2.71 2.71 3.59 10.00 C
Goldcrest Corporation 201503 7.56 6.11 0.15 8.42 0.15 -2.01 0.12 -2.13 -0.83 -1.30 -1.30 -1.72 10.00 C
Golechha Global Finance 201406 5.50 0.16 0.10 0.07 0.07 0.02 0.05 0.05 0.08 0.00 S
Golechha Global Finance 201409 5.50 0.16 0.10 0.06 0.06 0.02 0.04 0.04 0.08 0.00 S
Golechha Global Finance 201412 5.50 0.16 0.09 0.00 0.07 0.07 0.02 0.05 0.05 0.08 0.00 S
Golechha Global Finance 201503 5.50 0.15 0.09 0.06 0.06 0.02 0.04 0.04 0.07 0.00 S
Gopal Iron & Steels Company (Gujarat)201406 4.92 6.60 0.20 6.11 0.02 0.71 0.90 0.31 -0.50 0.01 -0.51 -0.51 -1.03 0.00 S
Gopal Iron & Steels Company (Gujarat)201409 4.92 2.68 0.19 2.56 0.30 0.60 0.73 0.31 -0.43 0.01 -0.43 -0.43 -0.88 0.00 S
Gopal Iron & Steels Company (Gujarat)201412 4.92 2.12 0.15 1.52 0.00 0.75 0.71 0.31 -0.26 0.00 -0.27 -0.27 -0.54 0.00 S
Gopal Iron & Steels Company (Gujarat)201503 4.92 2.44 0.09 2.65 0.10 -0.02 0.87 0.31 -1.20 0.10 -1.29 -1.29 -2.63 0.00 S
GR Cables 201406 28.90 0.06 -0.06 0.03 -0.08 -0.08 -0.08 -0.03 0.00 S
GR Cables 201409 28.90 0.06 -0.06 0.03 -0.08 -0.08 -0.08 -0.03 0.00 S
GR Cables 201412 28.90 0.06 -0.06 0.03 -0.08 -0.08 -0.08 -0.03 0.00 S
GR Cables 201503 28.90 0.09 0.07 -0.02 0.01 -0.03 -0.03 -0.03 -0.01 0.00 S
Grandma Trading & Agencies 201406 13.06 0.09 0.18 0.10 0.10 0.00 0.10 0.10 0.07 0.00 S
Grandma Trading & Agencies 201409 13.06 0.07 0.23 0.19 0.03 0.03 0.03 0.03 0.02 0.00 S
Grandma Trading & Agencies 201412 13.06 0.03 0.18 0.15 0.15 0.15 0.15 0.12 0.00 S
Grandma Trading & Agencies 201503 13.06 0.04 0.29 0.20 -0.04 -0.04 0.07 -0.12 -0.12 -0.01 0.00 S

Co_Name Year Equity N.Sale O.O.I T. Exp O.I PBIDT Int. Dep. PBT T.Tax PAT A.PAT EPS Div (%)
Exp
ecte
d R
esu
lts
on
14
Au
gu
st 2
015
GS Auto International 201406 7.26 36.42 0.02 35.15 0.12 1.41 1.55 1.15 -1.29 -0.29 -1.00 -1.00 -0.69 0.00 S
GS Auto International 201409 7.26 36.30 0.08 36.12 0.05 0.31 1.49 0.98 -2.16 -0.11 -2.05 -2.05 -1.41 0.00 S
GS Auto International 201412 7.26 36.84 0.00 36.00 0.09 0.93 0.97 1.39 -1.43 -0.25 -1.18 -1.18 -0.82 0.00 S
GS Auto International 201503 7.26 45.51 0.05 43.97 0.11 1.70 1.91 0.90 -1.11 -0.44 -0.67 -0.67 -0.46 0.00 S
GSL Nova Petrochemicals 201406 13.50 0.44 -0.44 2.24 0.89 -3.57 -3.57 -3.57 -1.32 0.00 S
GSL Nova Petrochemicals 201409 13.50 1.38 1.54 0.49 0.33 2.55 0.89 -3.11 -3.11 -3.11 -1.15 0.00 S
GSL Nova Petrochemicals 201412 13.50 0.13 0.02 -0.12 2.58 0.88 -3.58 -3.58 -3.58 -1.32 0.00 S
GSL Nova Petrochemicals 201503 13.50 0.06 0.76 0.40 -0.30 3.30 2.30 -5.90 -5.90 -5.90 -1.11 0.00 S
Gufic Biosciences 201406 7.74 39.08 0.02 35.16 0.29 4.23 1.06 0.99 2.18 0.99 1.19 1.19 0.15 5.00 S
Gufic Biosciences 201409 7.74 42.64 0.13 38.52 -0.12 4.13 1.11 1.03 1.99 0.80 1.19 1.19 0.15 5.00 S
Gufic Biosciences 201412 7.74 34.23 0.11 30.90 -0.02 3.43 1.01 1.06 1.36 0.68 0.68 0.68 0.09 5.00 S
Gufic Biosciences 201503 7.74 35.48 0.07 32.71 0.21 3.05 1.28 0.77 1.00 0.30 0.70 0.70 0.09 5.00 S
Gujarat Industries Power Company 201406 151.25 345.33 1.46 217.86 8.96 137.89 20.69 38.81 78.39 29.82 48.57 48.57 3.21 25.00 S
Gujarat Industries Power Company 201409 151.25 332.81 1.00 231.12 17.39 120.08 23.61 28.28 68.19 27.75 40.44 40.44 2.67 25.00 S
Gujarat Industries Power Company 201412 151.25 284.44 1.64 201.11 8.26 93.23 20.81 27.64 44.78 23.44 21.34 21.34 1.41 25.00 S
Gujarat Industries Power Company 201503 151.25 246.48 1.50 139.27 8.62 117.33 12.89 27.85 58.08 42.11 15.97 15.97 1.06 25.00 S
Gujarat Metallic Coal & Coke 201406 19.81 15.15 14.61 0.00 0.54 0.46 0.00 0.08 0.08 0.08 0.38 0.00 S
Gujarat Metallic Coal & Coke 201409 19.81 160.95 161.04 0.12 0.03 0.34 -0.30 -0.30 -0.30 -1.54 0.00 S
Gujarat Metallic Coal & Coke 201412 19.81 23.27 23.32 0.00 -0.04 -0.17 0.00 0.13 0.00 0.13 0.13 0.66 0.00 S
Gujarat Metallic Coal & Coke 201503 19.81 5.93 5.36 0.57 0.46 0.00 0.11 0.11 0.11 0.57 0.00 S
Gujarat Natural Resources 201406 38.75 4.46 0.56 2.05 0.92 3.89 1.54 0.71 1.64 0.34 1.30 1.30 0.34 2.50 C
Gujarat Natural Resources 201409 38.75 3.11 0.27 1.21 0.85 3.02 2.17 0.70 0.34 0.05 0.29 0.29 0.08 2.50 C
Gujarat Natural Resources 201412 38.75 2.89 3.91 0.72 -0.31 -0.76 0.65 -0.20 -0.01 -0.18 -0.18 -0.05 2.50 C
Gujarat Natural Resources 201503 38.75 2.97 1.08 1.16 3.77 6.67 2.30 3.14 1.22 0.01 1.21 1.21 0.31 2.50 C
Gujarat Raffia Industries 201406 5.00 11.25 10.11 0.02 1.16 0.44 0.48 0.24 0.05 0.19 0.19 0.39 0.00 S
Gujarat Raffia Industries 201409 5.00 10.07 0.01 9.13 0.00 0.96 0.33 0.48 0.15 0.03 0.12 0.12 0.24 0.00 S
Gujarat Raffia Industries 201412 5.00 10.00 0.01 8.65 0.00 1.36 0.61 0.49 0.26 0.05 0.21 0.21 0.42 0.00 S
Gujarat Raffia Industries 201503 5.00 7.18 0.23 6.53 0.08 0.96 0.00 0.61 0.34 0.06 0.28 0.28 0.55 0.00 S
Gujarat Terce Laboratories 201406 7.42 5.81 0.01 5.76 0.07 0.06 0.06 -0.05 -0.05 -0.05 0.00 S
Gujarat Terce Laboratories 201409 7.42 6.99 0.06 6.77 0.27 0.14 0.06 0.07 0.07 0.07 0.00 S
Gujarat Terce Laboratories 201412 7.42 6.19 0.00 5.97 0.21 0.08 0.06 0.07 0.07 0.07 0.10 0.00 S
Gujarat Terce Laboratories 201503 7.42 7.50 -0.02 7.20 0.28 0.13 -0.01 0.16 0.20 -0.04 -0.04 0.00 S
Gujarat Toolroom 201406 3.48 0.01 -0.01 -0.01 -0.01 -0.01 -0.02 0.00 S
Gujarat Toolroom 201409 3.48 0.15 -0.15 -0.15 -0.15 -0.15 -0.43 0.00 S
Gujarat Toolroom 201412 3.48 0.02 -0.02 -0.02 -0.02 -0.02 -0.05 0.00 S
Gujarat Toolroom 201503 3.48 0.02 -0.02 -0.02 -0.02 -0.02 -0.05 0.00 S
GV Films 201406 368.63 1.26 2.44 0.05 -1.14 0.02 -1.16 -1.16 -1.16 0.00 S
GV Films 201409 368.63 1.36 1.37 0.04 0.03 0.30 0.02 -0.30 -0.30 -0.30 0.00 S
GV Films 201412 368.63 1.19 2.94 0.04 -1.71 0.10 0.02 -1.84 -1.84 -1.84 0.00 C
GV Films 201503 368.63 1.87 2.83 0.23 -0.72 0.00 1.14 -1.87 -1.87 -1.87 0.00 C
Haria Apparels 201406 15.29 0.00 0.13 0.48 0.35 0.08 0.12 0.15 0.00 0.15 0.15 0.10 0.00 S
Haria Apparels 201409 15.29 0.17 0.46 0.29 0.09 0.12 0.08 0.08 0.08 0.00 S
Haria Apparels 201412 15.29 0.01 0.42 0.57 0.17 0.10 0.12 -0.06 -0.06 -0.06 0.00 S
Haria Apparels 201503 15.29 0.20 0.56 0.70 0.34 0.11 1.73 -1.50 -1.50 -1.50 0.00 S
Haria Exports 201406 11.55 0.11 0.12 0.02 0.01 0.01 0.01 0.01 0.00 S
Haria Exports 201409 11.55 0.00 0.04 0.02 -0.02 -0.02 -0.02 -0.02 -0.02 0.00 S
Haria Exports 201412 11.55 0.19 -0.19 -0.19 -0.19 -0.19 -0.16 0.00 S
Haria Exports 201503 11.55 0.06 0.07 -0.02 -0.02 -0.02 -0.02 -0.01 0.00 S

Co_Name Year Equity N.Sale O.O.I T. Exp O.I PBIDT Int. Dep. PBT T.Tax PAT A.PAT EPS Div (%)
Exp
ecte
d R
esu
lts
on
14
Au
gu
st 2
015
Hasti Finance 201406 10.84 0.45 0.42 0.03 0.02 0.01 0.01 0.00 0.00 0.00 S
Hasti Finance 201409 10.84 0.22 0.21 0.02 0.01 0.01 0.00 0.01 0.01 0.01 0.00 S
Hasti Finance 201412 10.84 0.33 0.30 0.04 0.03 0.01 0.00 0.01 0.01 0.00 S
Hasti Finance 201503 10.84 0.55 0.51 0.04 0.04 0.01 0.02 -0.01 -0.01 -0.01 0.00 S
HBL Power Systems 201406 25.30 285.57 271.76 3.37 17.18 17.76 12.81 -17.94 -0.60 -17.34 -17.34 -0.69 20.00 S
HBL Power Systems 201409 25.30 377.64 338.54 -0.55 38.55 17.05 13.26 8.12 -0.59 8.71 8.71 0.34 20.00 S
HBL Power Systems 201412 25.30 321.84 274.27 7.00 54.57 18.25 13.47 17.21 2.65 14.56 14.56 0.58 20.00 S
HBL Power Systems 201503 25.30 345.02 300.05 6.79 51.76 17.60 11.51 17.94 9.24 8.70 8.70 0.34 20.00 S
Heera Ispat 201406 5.88 0.01 -0.01 -0.01 -0.01 -0.01 -0.02 0.00 S
Heera Ispat 201409 5.88 0.01 -0.01 -0.01 -0.01 -0.01 -0.02 0.00 S
Heera Ispat 201412 5.88 0.01 -0.01 -0.01 -0.01 -0.01 -0.01 0.00 S
Heera Ispat 201503 5.88 0.11 0.43 0.33 0.33 0.09 0.23 0.23 0.40 0.00 S
Hemang Resources 201406 13.20 178.60 171.99 0.62 7.22 2.10 5.12 1.66 3.46 3.46 2.62 5.00 S
Hemang Resources 201409 13.20 166.48 162.80 0.47 4.15 2.09 2.07 0.78 1.28 1.28 0.97 5.00 S
Hemang Resources 201412 13.20 126.84 124.11 0.55 3.29 2.74 0.00 0.55 0.07 0.48 0.48 0.37 5.00 S
Hemang Resources 201503 13.20 155.87 154.91 0.50 1.46 0.63 0.00 0.84 0.31 0.53 0.53 0.25 5.00 S
High Ground Enterprise 201406 8.60 24.11 21.84 0.01 2.28 0.35 0.15 1.78 0.58 1.21 1.21 1.98 0.00 S
High Ground Enterprise 201409 8.60 52.96 48.71 0.26 4.50 0.48 0.35 3.68 1.20 2.48 2.48 2.88 0.00 S
High Ground Enterprise 201412 8.60 47.18 44.57 0.20 2.81 0.64 0.33 1.84 0.60 1.24 1.24 1.62 0.00 S
High Ground Enterprise 201503 9.41 38.29 31.92 0.15 6.52 0.75 0.12 5.65 1.97 3.68 3.68 4.34 0.00 S
Himalaya Granites 201406 3.01 0.14 0.20 0.10 0.03 0.05 -0.02 -0.19 0.18 0.18 0.58 0.00 S
Himalaya Granites 201409 3.01 0.13 0.13 0.10 0.10 0.05 -0.10 0.38 -0.48 -0.48 -1.60 0.00 S
Himalaya Granites 201412 3.01 0.14 0.15 0.12 0.11 0.05 0.06 0.00 0.06 0.06 0.18 0.00 S
Himalaya Granites 201503 3.01 0.02 0.15 0.19 0.06 0.04 0.02 0.02 0.02 0.05 0.00 S
Hind Aluminium Industries 201406 6.30 79.87 1.31 79.10 0.87 2.95 1.32 0.77 0.87 0.87 0.87 15.00 S
Hind Aluminium Industries 201409 6.30 99.29 1.56 97.29 0.17 3.72 0.68 0.81 2.24 0.65 1.58 1.58 15.00 S
Hind Aluminium Industries 201412 6.30 102.76 2.45 102.41 0.56 3.36 1.20 0.80 1.36 0.57 0.80 0.80 15.00 S
Hind Aluminium Industries 201503 6.30 153.56 0.67 146.97 1.32 8.57 2.24 0.78 5.55 1.51 4.04 4.04 15.00 S
Hindalco Industries 201406 206.49 7930.55 65.59 7247.73 216.30 964.71 337.56 187.06 440.09 112.59 327.50 327.50 1.59 100.00 S
Hindalco Industries 201409 206.51 8472.90 81.41 7657.31 223.35 1120.35 385.72 196.04 107.37 28.60 78.77 78.77 0.38 100.00 S
Hindalco Industries 201412 206.52 8471.71 131.32 7679.70 212.48 1135.81 447.47 216.26 472.08 112.72 359.36 359.36 1.74 100.00 S
Hindalco Industries 201503 206.52 9219.25 152.30 8523.77 230.08 1077.86 466.34 237.67 227.37 67.84 159.53 159.53 0.77 100.00 S
Hindustan Adhesives 201406 5.12 19.09 17.37 0.07 1.79 0.78 0.52 0.49 0.10 0.39 0.39 0.76 0.00 S
Hindustan Adhesives 201409 5.12 21.66 19.19 0.43 2.90 0.81 0.37 1.72 0.62 1.10 1.10 2.15 0.00 S
Hindustan Adhesives 201412 5.12 18.16 15.99 0.05 2.22 0.93 0.54 0.75 0.45 0.30 0.30 0.59 0.00 S
Hindustan Adhesives 201503 5.12 17.39 14.69 0.21 2.91 0.88 2.14 -0.11 -0.19 0.08 0.08 0.16 0.00 S
Hindustan Dorr-Oliver 201406 14.40 188.63 210.87 8.90 -13.34 25.18 0.26 -38.78 108.94 -147.72 -147.72 -20.52 0.00 S
Hindustan Dorr-Oliver 201409 14.40 68.93 0.60 98.36 0.08 -28.75 24.73 0.24 -53.72 -53.72 -53.72 -7.46 0.00 S
Hindustan Dorr-Oliver 201412 11.40 62.73 0.25 100.55 3.55 -34.02 25.80 0.23 -60.05 0.03 -60.08 -60.08 -8.34 0.00 S
Hindustan Dorr-Oliver 201503 14.40 26.70 0.46 304.37 3.15 -274.06 34.84 0.43 -510.45 1.19 -511.64 -511.64 -71.05 0.00 S
Hindustan Everest Tools 201406 1.61 10.94 0.03 10.54 0.00 0.44 0.34 0.15 -0.05 -0.05 -0.05 -0.31 0.00 S
Hindustan Everest Tools 201409 1.61 11.22 0.00 10.70 0.52 0.42 0.15 -0.05 -0.05 -0.05 -0.34 0.00 S
Hindustan Everest Tools 201412 1.61 9.69 0.04 9.87 -0.14 0.40 0.15 -0.69 -0.69 -0.69 -4.28 0.00 S
Hindustan Everest Tools 201503 1.61 9.72 2.01 11.85 0.10 -0.03 0.39 0.15 -0.57 0.08 -0.65 -0.65 -4.06 0.00 S
Hindustan Fluorocarbons 201406 19.62 8.76 0.05 9.37 -0.56 0.35 0.27 -1.18 -1.18 -1.18 -0.60 0.00 S
Hindustan Fluorocarbons 201409 19.62 5.96 0.05 7.91 -1.90 0.43 0.28 -2.60 -2.60 -2.60 -1.33 0.00 S
Hindustan Fluorocarbons 201412 19.62 5.34 0.05 7.61 -2.22 0.45 0.28 3.95 3.95 3.95 2.01 0.00 S
Hindustan Fluorocarbons 201503 19.62 9.08 0.41 12.30 -2.81 0.86 0.27 -3.94 -3.94 -3.94 -2.01 0.00 S

Co_Name Year Equity N.Sale O.O.I T. Exp O.I PBIDT Int. Dep. PBT T.Tax PAT A.PAT EPS Div (%)
Exp
ecte
d R
esu
lts
on
14
Au
gu
st 2
015
Hindustan Motors 201406 92.39 8.05 0.73 22.85 0.97 -13.10 2.02 0.56 -15.68 -15.68 -15.68 -0.85 0.00 S
Hindustan Motors 201409 104.33 6.07 0.03 10.41 1.10 -3.21 1.97 0.51 -5.69 -5.69 -5.69 -0.31 0.00 S
Hindustan Motors 201412 104.33 0.15 12.94 3.48 -9.31 2.14 0.52 -11.97 -11.97 -11.97 -0.57 0.00 S
Hindustan Motors 201503 104.33 0.07 6.76 0.33 -6.36 1.69 0.51 -8.56 -8.56 -8.56 -0.41 0.00 S
IB Infotech Enterprises 201406 0.61 0.06 -0.06 -0.06 -0.06 -0.06 -1.04 0.00 S
IB Infotech Enterprises 201409 0.61 0.02 -0.02 -0.02 -0.02 -0.02 -0.04 0.00 S
IB Infotech Enterprises 201412 1.28 0.01 0.01 0.00 0.00 0.00 0.00 0.01 0.00 S
IB Infotech Enterprises 201503 1.28 0.03 0.02 -0.01 -0.01 -0.01 -0.01 -0.11 0.00 S
IDream Film Infrastructure Company 201406 0.15 0.02 -0.02 -0.02 -0.02 -0.02 -1.34 0.00 S
IDream Film Infrastructure Company 201409 0.15 0.01 -0.01 -0.01 -0.01 -0.01 -0.72 0.00 S
IDream Film Infrastructure Company 201412 0.15 0.01 -0.01 -0.01 -0.01 -0.01 -0.95 0.00 S
IDream Film Infrastructure Company 201503 0.15 0.03 -0.03 0.00 -0.03 -0.03 -0.03 -2.09 0.00 S
IL&FS Engineering and Construction Company201406 89.86 538.41 1.44 524.06 18.71 34.50 60.83 10.72 -37.05 -36.81 -37.05 -4.69 0.00 S
IL&FS Engineering and Construction Company201409 89.86 556.27 0.59 537.27 20.43 40.02 66.82 11.21 -38.01 -37.89 -38.01 -4.72 0.00 S
IL&FS Engineering and Construction Company201412 89.86 675.79 3.84 575.46 52.60 156.77 69.82 10.49 76.46 76.52 76.46 8.01 0.00 S
IL&FS Engineering and Construction Company201503 112.12 577.73 5.83 526.26 25.69 82.99 70.84 11.31 0.84 0.85 0.84 0.55 0.00 S
Inani Marbles & Industries 201406 3.25 21.58 0.03 18.35 0.01 3.27 0.75 2.52 0.82 1.70 1.70 5.24 10.00 S
Inani Marbles & Industries 201409 3.25 19.67 0.21 17.08 0.07 2.86 0.79 2.07 0.67 1.40 1.40 4.30 10.00 S
Inani Marbles & Industries 201412 3.25 15.54 0.02 13.26 0.30 2.60 0.74 1.85 0.75 1.11 1.11 3.41 10.00 S
Inani Marbles & Industries 201503 3.25 13.51 0.00 11.81 0.16 1.86 0.67 1.19 0.24 0.94 0.94 2.90 10.00 S
Inanna Fashion and Trends 201406 10.66 3.91 3.92 -0.01 0.02 -0.03 -0.03 -0.03 -0.03 0.00 C
Inanna Fashion and Trends 201409 10.66 5.11 5.02 0.09 0.02 0.07 0.07 0.07 0.07 0.00 C
Inanna Fashion and Trends 201412 10.66 1.37 1.32 0.05 0.02 0.03 0.03 0.03 0.03 0.00 C
Inanna Fashion and Trends 201503 10.66 7.41 4.39 0.00 3.03 0.02 3.01 3.01 3.01 2.82 0.00 S
Indag Rubber 201406 5.25 58.11 0.90 49.53 0.12 9.61 0.02 0.24 9.35 2.43 6.91 6.91 13.17 120.00 S
Indag Rubber 201409 5.25 58.31 0.03 48.06 1.99 12.27 0.03 0.59 11.66 2.90 8.76 8.76 16.68 120.00 S
Indag Rubber 201412 5.25 59.66 0.08 50.08 0.48 10.15 0.02 0.57 9.56 2.13 7.43 7.43 14.16 120.00 S
Indag Rubber 201503 5.25 65.73 0.06 54.26 0.63 12.15 0.09 0.57 11.49 2.00 9.48 9.48 18.07 120.00 S
India Infraspace 201406 10.00 0.08 0.05 0.03 0.03 0.03 0.03 0.03 0.00 S
India Infraspace 201409 10.00 8.90 8.89 0.01 0.01 0.01 0.01 0.01 0.00 S
India Infraspace 201412 10.00 8.57 8.59 -0.03 -0.03 0.00 -0.03 -0.03 -0.03 0.00 S
India Infraspace 201503 10.00 9.51 9.57 -0.06 -0.06 -0.06 -0.06 -0.06 0.00 S
India Tourism Development Corporation201406 85.77 96.19 101.83 7.45 1.81 1.50 0.30 0.30 0.30 5.00 S
India Tourism Development Corporation201409 85.77 102.43 110.87 12.27 3.83 1.52 2.31 0.68 1.63 1.63 0.27 5.00 S
India Tourism Development Corporation201412 85.77 129.67 123.41 8.61 14.87 1.58 13.29 2.92 10.37 10.37 1.21 5.00 S
India Tourism Development Corporation201503 85.77 142.52 1.47 120.68 3.59 26.90 5.66 23.05 0.98 22.07 22.07 2.57 5.00 S
Indiaco Ventures 201406 3.71 0.10 0.07 0.03 0.06 -0.03 -0.03 -0.03 -0.02 0.00 S
Indiaco Ventures 201409 3.71 0.10 0.05 0.05 0.06 -0.01 -0.01 -0.01 -0.01 0.00 S
Indiaco Ventures 201412 3.71 0.10 0.11 -0.01 0.06 -0.07 -0.07 -0.07 -0.04 0.00 S
Indiaco Ventures 201503 3.71 0.10 2.18 -2.09 0.06 -2.15 -2.15 -2.15 -1.16 0.00 S
Indian Bright Steel Company 201406 1.00 0.05 0.03 -0.02 -0.02 -0.02 -0.02 -0.18 0.00 S
Indian Bright Steel Company 201409 1.00 0.04 0.03 -0.01 -0.01 -0.01 -0.01 -0.07 0.00 S
Indian Bright Steel Company 201412 1.00 0.05 0.03 -0.02 -0.02 -0.02 -0.02 -0.17 0.00 S
Indian Bright Steel Company 201503 1.00 0.07 0.03 -0.04 -0.04 -0.04 -0.04 -0.35 0.00 S
Indian Infotech & Software 201406 100.34 19.02 18.76 0.26 0.01 0.26 0.08 0.18 0.18 0.00 C
Indian Infotech & Software 201409 100.34 2.14 0.27 1.87 0.01 1.87 0.58 1.29 1.29 0.01 0.00 C
Indian Infotech & Software 201412 100.34 1.93 0.28 1.65 0.01 1.64 0.51 1.14 1.14 0.01 0.00 C
Indian Infotech & Software 201503 100.34 59.42 61.99 0.00 -2.57 0.33 0.02 -2.91 -0.87 -2.04 -2.04 -0.02 0.00 C

Co_Name Year Equity N.Sale O.O.I T. Exp O.I PBIDT Int. Dep. PBT T.Tax PAT A.PAT EPS Div (%)
Exp
ecte
d R
esu
lts
on
14
Au
gu
st 2
015
Indian Polyfins 201406 4.29 1.43 0.02 1.42 0.00 0.03 0.00 0.04 -0.01 -0.01 -0.01 -0.01 0.00 S
Indian Polyfins 201409 4.29 1.41 0.03 1.38 0.00 0.06 0.00 0.04 0.02 0.02 0.02 0.05 0.00 S
Indian Polyfins 201412 4.29 1.54 0.03 1.62 0.03 -0.02 0.00 0.03 -0.05 -0.05 -0.05 -0.11 0.00 S
Indian Polyfins 201503 4.29 1.25 0.03 1.32 0.05 0.01 0.00 0.18 -0.17 0.00 -0.17 -0.17 -0.39 0.00 S
Indian Sucrose 201406 15.42 55.33 0.09 48.09 0.04 7.37 5.79 1.52 0.07 0.05 0.02 0.02 0.01 0.00 S
Indian Sucrose 201409 15.42 45.53 0.00 42.41 0.01 3.14 5.18 1.54 -3.58 -0.21 -3.37 -3.37 -1.65 0.00 S
Indian Sucrose 201412 15.42 51.80 1.50 50.68 -0.08 2.55 3.18 1.51 -2.14 0.05 -2.18 -2.18 -0.16 0.00 S
Indian Sucrose 201503 15.42 59.33 -1.59 56.66 1.15 2.23 2.10 3.66 -3.33 -0.10 -3.23 -3.23 -1.44 0.00 S
Indianivesh 201406 3.78 0.10 -0.10 0.07 0.01 -0.18 0.00 -0.17 -0.17 -0.05 10.00 S
Indianivesh 201409 3.78 0.00 0.11 -0.11 0.04 0.01 -0.16 0.00 -0.16 -0.16 -0.04 10.00 S
Indianivesh 201412 3.78 0.10 0.10 0.11 0.12 0.11 0.01 -0.01 0.01 0.01 10.00 S
Indianivesh 201503 3.78 2.29 0.10 0.94 3.14 0.41 0.01 2.72 0.78 1.94 1.94 0.51 10.00 S
Indo Euro Indchem 201406 9.04 0.08 0.11 0.00 -0.03 0.02 0.06 0.03 -0.02 0.03 -0.86 0.00 S
Indo Euro Indchem 201409 9.04 0.09 0.11 0.02 0.00 0.02 0.06 0.04 0.03 0.03 0.31 0.00 S
Indo Euro Indchem 201412 9.04 0.05 0.09 0.02 -0.03 0.02 0.01 0.02 -0.01 -0.01 -0.06 0.00 S
Indo Euro Indchem 201503 9.04 2.58 2.54 0.01 0.06 -0.05 0.19 -0.03 0.21 0.21 2.37 0.00 S
Indo Rama Synthetics (India) 201406 151.82 705.27 10.03 674.80 5.99 46.49 10.07 31.01 17.02 -5.03 22.05 22.05 1.45 10.00 S
Indo Rama Synthetics (India) 201409 151.82 716.81 11.02 697.85 7.03 37.01 11.55 32.70 -20.48 -4.46 -16.02 -16.02 -1.06 10.00 S
Indo Rama Synthetics (India) 201412 151.82 648.80 10.78 667.02 3.15 -4.29 11.46 27.20 -72.92 -14.52 -58.40 -58.40 -3.85 10.00 S
Indo Rama Synthetics (India) 201503 151.82 638.02 12.71 599.33 1.64 53.04 10.30 26.25 42.36 11.52 30.84 30.84 2.03 10.00 S
Indo Tech Transformers 201406 10.62 44.21 0.45 44.34 4.86 5.18 4.14 1.32 -0.28 -0.28 -0.28 -0.26 0.00 S
Indo Tech Transformers 201409 10.62 35.47 0.44 39.11 5.10 1.90 0.74 1.31 -0.15 -0.15 -0.15 -0.14 0.00 S
Indo Tech Transformers 201412 10.62 39.75 0.35 44.13 0.65 -3.38 1.28 -4.66 -4.66 -4.66 -4.39 0.00 S
Indo Tech Transformers 201503 10.62 35.63 0.61 39.74 6.12 2.62 1.27 1.35 1.35 1.35 1.27 0.00 S
Indus Fila 201406 20.36 2.63 1.70 0.93 10.98 2.18 -12.24 -12.24 -12.24 -6.00 0.00 S
Indus Fila 201409 20.36 -15.73 0.06 0.38 0.01 -16.04 3.15 2.18 -21.38 -21.38 -21.38 -78.91 0.00 S
Indus Fila 201412 20.36 0.32 -0.32 17.31 2.18 -19.81 -19.81 -19.81 -73.13 0.00 S
Indus Fila 201503 20.36 -49.55 0.00 11.22 25.13 -35.64 17.30 6.95 -59.88 -0.40 -59.48 -59.48 -80.18 0.00 S
Info-Drive Software 201406 45.09 5.78 5.51 0.02 0.29 0.14 0.05 0.10 0.04 0.07 0.07 0.01 0.00 S
Info-Drive Software 201409 45.09 4.05 3.80 0.00 0.25 0.12 0.05 0.08 0.03 0.05 0.05 0.01 0.00 S
Info-Drive Software 201412 45.09 4.13 3.54 0.07 0.66 0.02 0.63 0.12 0.51 0.51 0.01 0.00 S
Info-Drive Software 201503 55.91 4.10 4.47 2.35 1.98 0.26 0.21 1.50 -0.45 2.10 1.95 0.04 0.00 S
Infotrek Syscom 201406 17.54 6.96 0.22 6.97 0.17 0.38 0.22 0.07 0.09 0.09 0.09 0.05 0.00 S
Infotrek Syscom 201409 17.54 5.66 0.18 5.39 0.27 0.73 0.22 0.07 0.43 0.43 0.43 0.25 0.00 S
Infotrek Syscom 201412 17.54 8.76 0.15 8.47 -0.01 0.43 0.20 0.07 0.16 0.16 0.16 0.09 0.00 S
Infotrek Syscom 201503 17.54 8.69 0.34 8.20 0.02 0.85 0.22 0.08 0.56 0.56 0.56 0.32 0.00 S
Infra Industries 201406 5.98 1.12 1.79 0.09 -0.58 0.14 0.11 -0.83 -0.83 -0.83 -1.38 0.00 S
Infra Industries 201409 5.98 1.04 1.26 0.01 -0.21 0.24 0.09 -0.54 -0.54 -0.54 -0.91 0.00 S
Infra Industries 201412 5.98 4.11 4.40 0.10 -0.19 0.21 0.09 -0.49 -0.49 -0.49 -0.82 0.00 S
Infra Industries 201503 5.98 6.05 7.14 0.03 -1.06 0.29 0.28 -1.63 -1.63 -1.63 -2.72 0.00 S
Infraquest International 201406 8.85 0.01 -0.01 0.00 -0.01 -0.01 -0.01 -0.01 0.00 S
Infraquest International 201409 8.85 0.03 -0.03 0.00 -0.03 -0.03 -0.03 -0.03 0.00 S
Infraquest International 201412 8.85 0.01 -0.01 0.00 -0.01 -0.01 -0.01 -0.01 0.00 S
Infraquest International 201503 8.85 0.01 -0.01 0.00 0.00 0.00 0.00 0.00 S
Infronics Systems 201406 7.93 1.38 0.02 0.46 0.94 0.45 0.74 -0.25 -0.02 -0.23 -0.23 -0.15 0.00 S
Infronics Systems 201409 7.93 0.78 0.02 5.42 -4.63 0.59 0.75 -5.97 0.02 -5.99 -5.99 -3.78 0.00 S
Infronics Systems 201412 7.93 1.25 0.02 1.10 0.17 0.48 0.75 -1.06 -1.06 -1.06 -0.67 0.00 S
Infronics Systems 201503 7.93 4.49 0.03 4.11 0.41 0.25 0.74 -9.67 -0.86 -8.81 -8.81 -5.55 0.00 S
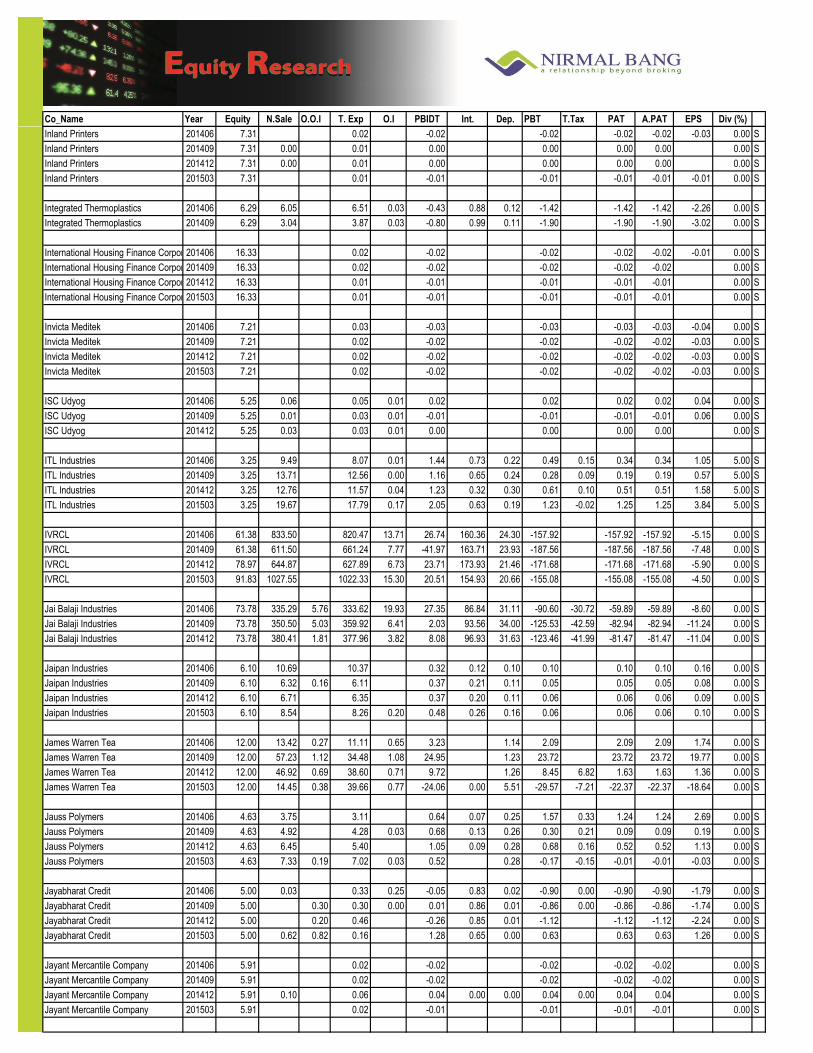
Co_Name Year Equity N.Sale O.O.I T. Exp O.I PBIDT Int. Dep. PBT T.Tax PAT A.PAT EPS Div (%)
Exp
ecte
d R
esu
lts
on
14
Au
gu
st 2
015
Inland Printers 201406 7.31 0.02 -0.02 -0.02 -0.02 -0.02 -0.03 0.00 S
Inland Printers 201409 7.31 0.00 0.01 0.00 0.00 0.00 0.00 0.00 S
Inland Printers 201412 7.31 0.00 0.01 0.00 0.00 0.00 0.00 0.00 S
Inland Printers 201503 7.31 0.01 -0.01 -0.01 -0.01 -0.01 -0.01 0.00 S
Integrated Thermoplastics 201406 6.29 6.05 6.51 0.03 -0.43 0.88 0.12 -1.42 -1.42 -1.42 -2.26 0.00 S
Integrated Thermoplastics 201409 6.29 3.04 3.87 0.03 -0.80 0.99 0.11 -1.90 -1.90 -1.90 -3.02 0.00 S
International Housing Finance Corporation201406 16.33 0.02 -0.02 -0.02 -0.02 -0.02 -0.01 0.00 S
International Housing Finance Corporation201409 16.33 0.02 -0.02 -0.02 -0.02 -0.02 0.00 S
International Housing Finance Corporation201412 16.33 0.01 -0.01 -0.01 -0.01 -0.01 0.00 S
International Housing Finance Corporation201503 16.33 0.01 -0.01 -0.01 -0.01 -0.01 0.00 S
Invicta Meditek 201406 7.21 0.03 -0.03 -0.03 -0.03 -0.03 -0.04 0.00 S
Invicta Meditek 201409 7.21 0.02 -0.02 -0.02 -0.02 -0.02 -0.03 0.00 S
Invicta Meditek 201412 7.21 0.02 -0.02 -0.02 -0.02 -0.02 -0.03 0.00 S
Invicta Meditek 201503 7.21 0.02 -0.02 -0.02 -0.02 -0.02 -0.03 0.00 S
ISC Udyog 201406 5.25 0.06 0.05 0.01 0.02 0.02 0.02 0.02 0.04 0.00 S
ISC Udyog 201409 5.25 0.01 0.03 0.01 -0.01 -0.01 -0.01 -0.01 0.06 0.00 S
ISC Udyog 201412 5.25 0.03 0.03 0.01 0.00 0.00 0.00 0.00 0.00 S
ITL Industries 201406 3.25 9.49 8.07 0.01 1.44 0.73 0.22 0.49 0.15 0.34 0.34 1.05 5.00 S
ITL Industries 201409 3.25 13.71 12.56 0.00 1.16 0.65 0.24 0.28 0.09 0.19 0.19 0.57 5.00 S
ITL Industries 201412 3.25 12.76 11.57 0.04 1.23 0.32 0.30 0.61 0.10 0.51 0.51 1.58 5.00 S
ITL Industries 201503 3.25 19.67 17.79 0.17 2.05 0.63 0.19 1.23 -0.02 1.25 1.25 3.84 5.00 S
IVRCL 201406 61.38 833.50 820.47 13.71 26.74 160.36 24.30 -157.92 -157.92 -157.92 -5.15 0.00 S
IVRCL 201409 61.38 611.50 661.24 7.77 -41.97 163.71 23.93 -187.56 -187.56 -187.56 -7.48 0.00 S
IVRCL 201412 78.97 644.87 627.89 6.73 23.71 173.93 21.46 -171.68 -171.68 -171.68 -5.90 0.00 S
IVRCL 201503 91.83 1027.55 1022.33 15.30 20.51 154.93 20.66 -155.08 -155.08 -155.08 -4.50 0.00 S
Jai Balaji Industries 201406 73.78 335.29 5.76 333.62 19.93 27.35 86.84 31.11 -90.60 -30.72 -59.89 -59.89 -8.60 0.00 S
Jai Balaji Industries 201409 73.78 350.50 5.03 359.92 6.41 2.03 93.56 34.00 -125.53 -42.59 -82.94 -82.94 -11.24 0.00 S
Jai Balaji Industries 201412 73.78 380.41 1.81 377.96 3.82 8.08 96.93 31.63 -123.46 -41.99 -81.47 -81.47 -11.04 0.00 S
Jaipan Industries 201406 6.10 10.69 10.37 0.32 0.12 0.10 0.10 0.10 0.10 0.16 0.00 S
Jaipan Industries 201409 6.10 6.32 0.16 6.11 0.37 0.21 0.11 0.05 0.05 0.05 0.08 0.00 S
Jaipan Industries 201412 6.10 6.71 6.35 0.37 0.20 0.11 0.06 0.06 0.06 0.09 0.00 S
Jaipan Industries 201503 6.10 8.54 8.26 0.20 0.48 0.26 0.16 0.06 0.06 0.06 0.10 0.00 S
James Warren Tea 201406 12.00 13.42 0.27 11.11 0.65 3.23 1.14 2.09 2.09 2.09 1.74 0.00 S
James Warren Tea 201409 12.00 57.23 1.12 34.48 1.08 24.95 1.23 23.72 23.72 23.72 19.77 0.00 S
James Warren Tea 201412 12.00 46.92 0.69 38.60 0.71 9.72 1.26 8.45 6.82 1.63 1.63 1.36 0.00 S
James Warren Tea 201503 12.00 14.45 0.38 39.66 0.77 -24.06 0.00 5.51 -29.57 -7.21 -22.37 -22.37 -18.64 0.00 S
Jauss Polymers 201406 4.63 3.75 3.11 0.64 0.07 0.25 1.57 0.33 1.24 1.24 2.69 0.00 S
Jauss Polymers 201409 4.63 4.92 4.28 0.03 0.68 0.13 0.26 0.30 0.21 0.09 0.09 0.19 0.00 S
Jauss Polymers 201412 4.63 6.45 5.40 1.05 0.09 0.28 0.68 0.16 0.52 0.52 1.13 0.00 S
Jauss Polymers 201503 4.63 7.33 0.19 7.02 0.03 0.52 0.28 -0.17 -0.15 -0.01 -0.01 -0.03 0.00 S
Jayabharat Credit 201406 5.00 0.03 0.33 0.25 -0.05 0.83 0.02 -0.90 0.00 -0.90 -0.90 -1.79 0.00 S
Jayabharat Credit 201409 5.00 0.30 0.30 0.00 0.01 0.86 0.01 -0.86 0.00 -0.86 -0.86 -1.74 0.00 S
Jayabharat Credit 201412 5.00 0.20 0.46 -0.26 0.85 0.01 -1.12 -1.12 -1.12 -2.24 0.00 S
Jayabharat Credit 201503 5.00 0.62 0.82 0.16 1.28 0.65 0.00 0.63 0.63 0.63 1.26 0.00 S
Jayant Mercantile Company 201406 5.91 0.02 -0.02 -0.02 -0.02 -0.02 0.00 S
Jayant Mercantile Company 201409 5.91 0.02 -0.02 -0.02 -0.02 -0.02 0.00 S
Jayant Mercantile Company 201412 5.91 0.10 0.06 0.04 0.00 0.00 0.04 0.00 0.04 0.04 0.00 S
Jayant Mercantile Company 201503 5.91 0.02 -0.01 -0.01 -0.01 -0.01 0.00 S

Co_Name Year Equity N.Sale O.O.I T. Exp O.I PBIDT Int. Dep. PBT T.Tax PAT A.PAT EPS Div (%)
Exp
ecte
d R
esu
lts
on
14
Au
gu
st 2
015
JCT Electronics 201406 78.83 0.85 2.51 0.07 -1.59 3.97 3.79 -9.35 -9.35 -9.35 -0.12 0.00 S
JCT Electronics 201409 78.83 0.49 2.45 0.09 -1.87 4.01 3.81 -9.69 -9.69 -9.69 -0.12 0.00 S
JCT Electronics 201412 78.83 1.03 2.25 0.04 -1.18 4.01 3.71 -8.90 0.00 -8.90 -8.90 -0.11 0.00 S
JCT Electronics 201503 78.83 0.12 0.17 3.03 2.98 3.93 3.75 -44.70 -44.70 -44.70 -0.57 0.00 S
JD Orgochem 201406 1.33 0.15 0.05 -0.10 0.18 -0.28 -0.28 -0.28 -0.21 0.00 S
JD Orgochem 201409 1.33 0.29 0.16 -0.13 0.06 0.18 -0.37 -0.37 -0.37 -0.28 0.00 S
JD Orgochem 201412 1.33 0.16 0.07 -0.09 0.01 0.19 -0.29 -0.29 -0.29 -0.22 0.00 S
JD Orgochem 201503 1.33 0.83 0.93 0.13 0.03 0.16 -0.13 0.00 -0.14 -0.14 -0.11 0.00 S
Jet Airways (India) 201406 113.60 4334.07 148.76 4616.80 257.83 123.86 194.29 186.32 -217.65 -217.65 -217.65 -19.16 0.00 S
Jet Airways (India) 201409 113.60 4402.76 122.96 4845.30 490.00 170.42 212.27 193.34 69.82 0.00 69.82 69.82 6.15 0.00 S
Jet Airways (India) 201412 113.60 4680.60 146.74 4822.14 406.87 412.07 226.40 192.34 63.11 63.11 63.11 5.56 0.00 S
Jet Airways (India) 201503 113.60 4626.79 178.56 5405.14 484.79 -115.00 251.10 190.50 -1728.99 -1728.99 -1728.99 -152.20 0.00 S
Jhaveri Credits & Capital 201406 6.46 0.25 0.33 0.13 0.05 0.03 0.01 0.01 0.01 0.01 0.02 0.00 S
Jhaveri Credits & Capital 201409 6.46 0.30 0.40 0.02 -0.09 0.03 0.01 -0.13 -0.13 -0.13 -0.19 0.00 S
Jhaveri Credits & Capital 201412 6.46 0.50 0.43 0.07 0.13 0.01 0.01 0.11 0.11 0.11 0.17 0.00 S
Jhaveri Credits & Capital 201503 6.46 0.52 0.56 0.11 0.07 0.01 0.01 0.05 0.05 0.05 0.07 0.00 S
Jindal Cotex 201406 45.00 65.19 0.28 64.54 0.93 11.16 3.17 -13.40 -13.40 -11.36 -2.98 0.00 C
Jindal Cotex 201409 45.00 61.82 0.00 101.83 -40.00 16.53 4.05 -60.59 -60.59 -60.59 -13.46 0.00 C
Jindal Cotex 201412 45.00 27.85 -0.09 42.76 -15.00 16.78 4.07 -35.84 -35.84 -28.61 -6.38 0.00 C
Jindal Cotex 201503 45.00 40.80 0.86 43.61 -1.95 14.22 8.18 -42.15 -42.15 -35.11 -7.80 0.00 C
Jindal Worldwide 201406 20.05 216.83 0.28 192.99 0.47 24.59 8.34 7.85 8.41 1.76 6.65 6.65 3.31 5.00 S
Jindal Worldwide 201409 20.05 210.79 0.66 188.24 1.40 24.61 8.04 7.93 8.64 1.82 6.83 6.83 3.40 5.00 S
Jindal Worldwide 201412 20.05 179.52 0.49 159.51 1.92 22.41 8.30 5.77 8.35 1.75 6.60 6.60 3.29 5.00 S
Jindal Worldwide 201503 20.05 230.12 1.40 211.39 2.50 22.63 2.02 10.81 9.80 3.23 6.57 6.57 3.28 5.00 S
JMT Auto 201406 14.40 121.26 0.33 106.87 0.75 15.46 4.31 5.70 5.46 1.86 3.59 3.59 2.50 0.00 S
JMT Auto 201409 50.38 119.71 0.21 107.68 0.10 12.34 4.65 5.10 2.60 0.96 1.64 1.64 0.33 0.00 S
JMT Auto 201412 50.38 102.75 0.37 88.47 0.15 14.80 5.08 7.38 2.34 0.90 1.43 1.43 0.28 0.00 S
JMT Auto 201503 50.38 85.46 0.00 73.35 1.29 13.40 5.10 6.88 1.42 -1.39 2.81 2.81 0.56 0.00 S
Jog Engineering 201406 8.50 0.18 -0.18 1.59 0.07 -1.84 -1.84 -1.84 -2.17 0.00 S
Jog Engineering 201409 8.50 0.19 -0.19 1.61 0.07 -1.87 -1.87 -1.87 -2.20 0.00 S
Jog Engineering 201412 8.50 0.14 0.00 -0.14 1.61 0.07 -1.82 -1.82 -1.82 -2.14 0.00 S
Jog Engineering 201503 8.50 0.27 0.01 -0.26 1.58 -0.20 -2.70 -2.70 -2.70 -3.18 0.00 S
Joindre Capital Services 201406 13.84 5.62 0.41 5.63 1.02 1.42 0.12 0.06 1.24 0.39 0.85 0.85 0.62 0.00 S
Joindre Capital Services 201409 13.84 4.73 0.47 4.88 1.21 1.53 0.16 0.06 1.30 0.39 0.92 0.92 0.66 0.00 S
Joindre Capital Services 201412 13.84 4.24 0.37 4.57 1.22 1.26 0.17 0.06 1.03 0.32 0.72 0.72 0.52 0.00 S
Joindre Capital Services 201503 13.84 4.99 0.37 4.40 1.14 2.10 0.20 0.05 1.86 0.59 1.27 1.27 0.91 0.00 S
Jolly Plastic Industries 201406 6.68 0.21 0.23 0.03 0.01 0.01 0.01 0.01 0.00 S
Jolly Plastic Industries 201409 6.68 0.41 0.03 0.43 0.01 0.01 0.00 0.01 0.01 0.00 S
Jolly Plastic Industries 201412 6.68 0.02 0.01 0.01 0.01 0.00 0.01 0.01 0.01 0.00 S
Jolly Plastic Industries 201503 6.68 0.01 0.05 -0.04 -0.04 -0.04 -0.04 -0.06 0.00 S
JostS Engineering Company 201406 0.77 11.92 2.03 15.00 0.05 -1.00 0.05 0.14 -1.19 -1.19 -1.19 -15.52 50.00 S
JostS Engineering Company 201409 0.77 16.59 2.46 17.89 0.02 1.18 0.06 0.15 0.98 0.98 0.98 12.77 50.00 S
JostS Engineering Company 201412 0.77 16.77 2.24 18.66 0.02 0.36 0.07 0.15 0.13 0.13 0.13 1.75 50.00 S
JostS Engineering Company 201503 0.77 21.09 2.18 21.94 0.02 1.35 0.08 0.15 1.12 0.50 0.62 0.62 8.10 50.00 S
JRI Industries & Infrastructure 201406 5.31 1.02 1.02 0.01 0.00 0.01 0.00 0.00 0.00 0.00 S
JRI Industries & Infrastructure 201409 5.31 1.82 1.78 0.04 0.00 0.04 0.01 0.03 0.03 0.01 0.00 S
JRI Industries & Infrastructure 201412 5.31 2.34 2.33 0.01 0.00 0.01 0.00 0.01 0.01 0.00 S
JRI Industries & Infrastructure 201503 5.31 1.21 1.10 0.11 0.00 0.11 0.03 0.08 0.08 0.03 0.00 S

Co_Name Year Equity N.Sale O.O.I T. Exp O.I PBIDT Int. Dep. PBT T.Tax PAT A.PAT EPS Div (%)
Exp
ecte
d R
esu
lts
on
14
Au
gu
st 2
015
Jumbo Bag 201406 8.37 20.61 1.07 20.25 0.35 1.78 1.32 0.40 0.05 0.02 0.03 0.03 0.00 S
Jumbo Bag 201409 8.37 24.08 0.69 22.91 0.30 2.16 1.69 0.40 0.07 0.03 0.05 0.05 0.01 0.00 S
Jumbo Bag 201412 8.37 21.21 0.87 21.96 0.19 0.32 1.62 0.45 -1.75 -0.04 -1.72 -1.72 -0.20 0.00 S
Jumbo Bag 201503 8.37 23.92 1.21 24.37 1.86 2.61 2.01 0.46 0.15 -0.14 0.29 0.29 0.03 0.00 S
Kabra Drugs 201406 4.39 2.16 2.03 0.12 0.07 0.06 0.06 0.06 0.13 0.00 S
Kabra Drugs 201409 4.39 1.74 1.61 0.14 0.07 0.07 0.07 0.07 0.17 0.00 S
Kabra Drugs 201412 4.39 2.31 0.00 2.19 0.12 0.07 0.06 0.06 0.06 0.12 0.00 S
Kabra Drugs 201503 4.39 2.06 0.00 2.29 -0.23 0.03 -0.27 0.04 -0.30 -0.30 -0.68 0.00 S
Kailash Auto Finance 201406 58.71 17.62 15.88 0.01 1.75 0.03 1.72 1.72 1.72 0.03 0.00 S
Kailash Auto Finance 201409 58.71 17.97 16.33 1.65 0.06 1.59 1.59 1.59 0.03 0.00 S
Kailash Auto Finance 201412 58.71 5.75 4.70 1.05 0.01 1.04 1.04 1.04 0.02 0.00 S
Kallam Spinning Mills 201406 6.85 55.81 47.28 1.25 9.78 4.05 1.97 3.76 3.76 3.76 5.49 12.00 S
Kallam Spinning Mills 201409 6.85 58.85 52.10 1.92 8.67 4.83 2.68 1.15 1.15 1.15 1.68 12.00 S
Kallam Spinning Mills 201412 6.85 61.69 53.57 2.37 10.49 7.02 3.27 0.20 0.20 0.20 0.29 12.00 S
Kallam Spinning Mills 201503 6.85 67.78 57.18 1.60 12.20 7.27 2.01 2.92 2.92 2.92 4.26 12.00 S
Kalpa commercial 201412 10.25 1.83 0.00 1.80 0.03 0.03 0.01 0.02 0.02 0.02 0.00 S
Kalpa commercial 201503 10.25 1.91 0.43 2.29 0.04 0.00 0.04 0.02 0.02 0.02 0.02 0.00 S
Kanishk Steel Industries 201406 28.47 65.21 62.89 0.12 2.45 0.93 1.03 0.48 0.16 0.32 0.32 0.11 0.00 S
Kanishk Steel Industries 201409 28.47 70.10 68.00 0.09 2.19 0.67 0.97 0.54 0.18 0.36 0.36 0.13 0.00 S
Kanishk Steel Industries 201412 28.47 55.60 53.30 0.26 2.57 0.80 1.27 0.51 0.17 0.34 0.34 0.12 0.00 S
Kanishk Steel Industries 201503 28.47 112.89 113.09 0.89 0.69 0.49 0.32 -0.12 0.63 -0.76 -0.76 -0.27 0.00 S
Kapil Cotex 201406 1.04 0.02 0.03 0.01 0.00 0.01 0.00 0.01 0.01 0.08 0.00 S
Kapil Cotex 201409 1.04 0.00 0.02 0.01 0.00 0.01 0.00 0.01 0.01 0.10 0.00 S
Kapil Cotex 201412 1.04 0.01 0.01 0.00 0.00 0.00 0.00 0.00 0.02 0.00 S
Kapil Cotex 201503 1.04 0.02 0.02 0.00 0.00 0.00 0.00 0.00 0.04 0.00 S
Kartik Investments Trust 201406 0.24 0.01 0.01 0.00 S
Kartik Investments Trust 201409 0.24 0.12 0.01 0.01 0.12 0.12 0.04 0.09 0.09 3.50 0.00 S
Kartik Investments Trust 201412 0.24 0.01 0.01 0.00 0.00 0.00 0.00 0.00 0.08 0.00 S
Kartik Investments Trust 201503 0.24 0.02 0.01 0.00 0.00 0.03 -0.03 -0.03 -1.25 0.00 S
Karur KCP Packkagings 201406 11.25 150.21 1.19 135.97 15.43 9.35 5.03 1.05 0.21 0.84 0.84 0.66 0.00 S
Karur KCP Packkagings 201409 11.25 143.99 0.49 129.20 15.28 9.17 5.04 1.07 0.21 0.86 0.86 0.68 0.00 S
Karur KCP Packkagings 201412 11.25 144.80 0.75 130.00 15.55 9.31 5.03 1.21 0.24 0.97 0.97 0.77 0.00 S
Karur KCP Packkagings 201503 11.25 139.78 7.99 132.87 14.90 11.96 2.12 0.82 0.19 0.63 0.63 0.50 0.00 S
Karuturi Global 201406 80.97 54.27 39.21 5.03 20.09 9.95 6.68 3.47 -1.06 4.56 4.56 0.06 0.00 C
Karuturi Global 201409 80.97 62.14 56.84 3.49 8.79 16.67 7.82 -0.28 0.57 -0.86 -0.86 -0.01 0.00 C
Karuturi Global 201412 80.97 56.98 42.75 1.86 16.09 -0.14 10.39 5.83 -4.49 10.31 10.31 0.13 0.00 C
Karuturi Global 201503 80.97 92.84 94.15 42.39 41.08 13.48 4.20 23.41 3.89 18.45 18.45 0.23 0.00 C
Kashyap Tele-Medicines 201406 4.77 0.03 0.03 0.00 0.00 0.00 0.00 0.00 0.00 S
Kashyap Tele-Medicines 201409 4.77 0.03 0.03 0.01 0.01 0.01 0.01 0.00 S
Kashyap Tele-Medicines 201412 4.77 0.03 0.03 0.01 0.01 0.01 0.01 0.00 S
Kashyap Tele-Medicines 201503 4.77 0.03 0.01 0.02 0.00 0.02 0.02 0.02 0.00 S
Kausambi Vanijya 201406 4.74 0.77 0.93 0.06 -0.11 -0.11 -0.11 -0.11 0.00 C
Kausambi Vanijya 201409 4.74 2.35 2.31 0.09 0.14 0.14 0.14 0.14 0.10 0.00 S
Kausambi Vanijya 201412 4.74 0.37 0.09 0.38 0.07 0.07 0.07 0.07 0.14 0.00 S
Kausambi Vanijya 201503 4.74 0.36 0.06 0.32 0.10 0.01 0.09 0.00 0.08 0.08 0.18 0.00 S
Kay Power and Paper 201406 10.64 7.65 0.02 7.52 0.00 0.14 0.11 0.04 0.04 0.04 0.03 0.00 S
Kay Power and Paper 201409 10.64 8.17 0.01 8.04 0.00 0.14 0.11 0.03 0.03 0.03 0.03 0.00 S
Kay Power and Paper 201412 10.64 7.30 0.00 7.18 0.01 0.13 0.11 0.02 0.02 0.02 0.02 0.00 S
Kay Power and Paper 201503 10.64 7.42 3.07 10.21 0.00 0.28 0.29 -0.01 -0.01 -0.01 -0.01 0.00 S
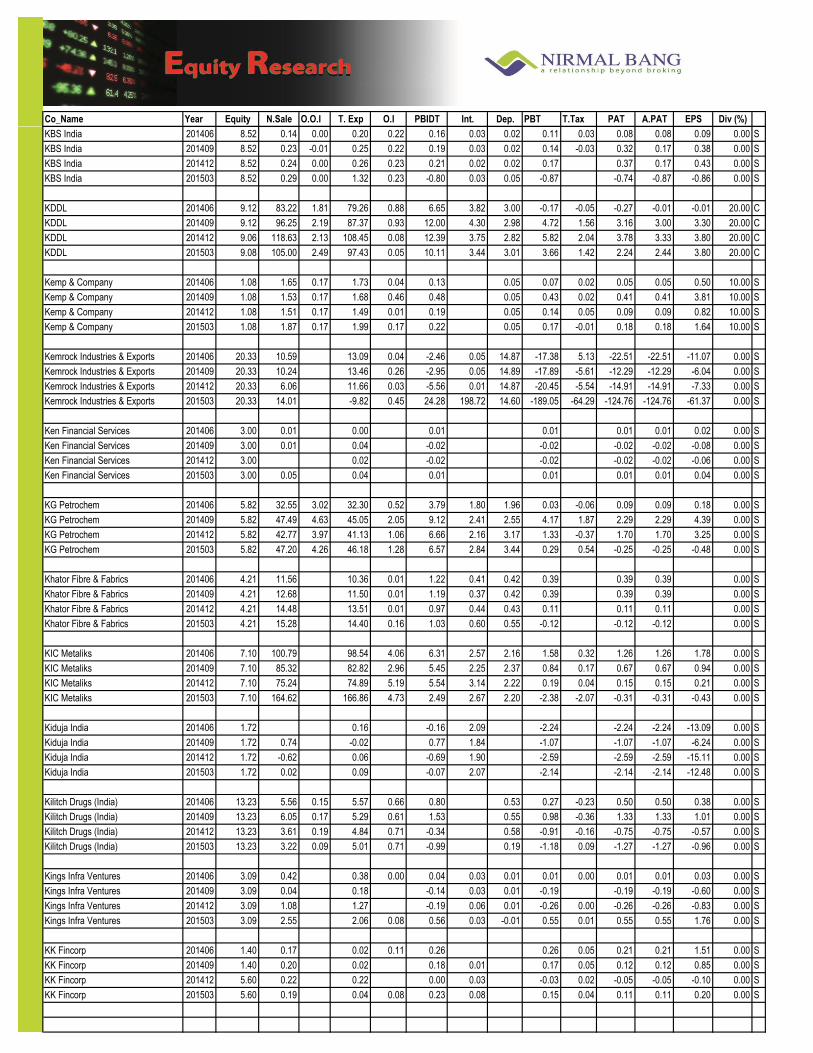
Co_Name Year Equity N.Sale O.O.I T. Exp O.I PBIDT Int. Dep. PBT T.Tax PAT A.PAT EPS Div (%)
Exp
ecte
d R
esu
lts
on
14
Au
gu
st 2
015
KBS India 201406 8.52 0.14 0.00 0.20 0.22 0.16 0.03 0.02 0.11 0.03 0.08 0.08 0.09 0.00 S
KBS India 201409 8.52 0.23 -0.01 0.25 0.22 0.19 0.03 0.02 0.14 -0.03 0.32 0.17 0.38 0.00 S
KBS India 201412 8.52 0.24 0.00 0.26 0.23 0.21 0.02 0.02 0.17 0.37 0.17 0.43 0.00 S
KBS India 201503 8.52 0.29 0.00 1.32 0.23 -0.80 0.03 0.05 -0.87 -0.74 -0.87 -0.86 0.00 S
KDDL 201406 9.12 83.22 1.81 79.26 0.88 6.65 3.82 3.00 -0.17 -0.05 -0.27 -0.01 -0.01 20.00 C
KDDL 201409 9.12 96.25 2.19 87.37 0.93 12.00 4.30 2.98 4.72 1.56 3.16 3.00 3.30 20.00 C
KDDL 201412 9.06 118.63 2.13 108.45 0.08 12.39 3.75 2.82 5.82 2.04 3.78 3.33 3.80 20.00 C
KDDL 201503 9.08 105.00 2.49 97.43 0.05 10.11 3.44 3.01 3.66 1.42 2.24 2.44 3.80 20.00 C
Kemp & Company 201406 1.08 1.65 0.17 1.73 0.04 0.13 0.05 0.07 0.02 0.05 0.05 0.50 10.00 S
Kemp & Company 201409 1.08 1.53 0.17 1.68 0.46 0.48 0.05 0.43 0.02 0.41 0.41 3.81 10.00 S
Kemp & Company 201412 1.08 1.51 0.17 1.49 0.01 0.19 0.05 0.14 0.05 0.09 0.09 0.82 10.00 S
Kemp & Company 201503 1.08 1.87 0.17 1.99 0.17 0.22 0.05 0.17 -0.01 0.18 0.18 1.64 10.00 S
Kemrock Industries & Exports 201406 20.33 10.59 13.09 0.04 -2.46 0.05 14.87 -17.38 5.13 -22.51 -22.51 -11.07 0.00 S
Kemrock Industries & Exports 201409 20.33 10.24 13.46 0.26 -2.95 0.05 14.89 -17.89 -5.61 -12.29 -12.29 -6.04 0.00 S
Kemrock Industries & Exports 201412 20.33 6.06 11.66 0.03 -5.56 0.01 14.87 -20.45 -5.54 -14.91 -14.91 -7.33 0.00 S
Kemrock Industries & Exports 201503 20.33 14.01 -9.82 0.45 24.28 198.72 14.60 -189.05 -64.29 -124.76 -124.76 -61.37 0.00 S
Ken Financial Services 201406 3.00 0.01 0.00 0.01 0.01 0.01 0.01 0.02 0.00 S
Ken Financial Services 201409 3.00 0.01 0.04 -0.02 -0.02 -0.02 -0.02 -0.08 0.00 S
Ken Financial Services 201412 3.00 0.02 -0.02 -0.02 -0.02 -0.02 -0.06 0.00 S
Ken Financial Services 201503 3.00 0.05 0.04 0.01 0.01 0.01 0.01 0.04 0.00 S
KG Petrochem 201406 5.82 32.55 3.02 32.30 0.52 3.79 1.80 1.96 0.03 -0.06 0.09 0.09 0.18 0.00 S
KG Petrochem 201409 5.82 47.49 4.63 45.05 2.05 9.12 2.41 2.55 4.17 1.87 2.29 2.29 4.39 0.00 S
KG Petrochem 201412 5.82 42.77 3.97 41.13 1.06 6.66 2.16 3.17 1.33 -0.37 1.70 1.70 3.25 0.00 S
KG Petrochem 201503 5.82 47.20 4.26 46.18 1.28 6.57 2.84 3.44 0.29 0.54 -0.25 -0.25 -0.48 0.00 S
Khator Fibre & Fabrics 201406 4.21 11.56 10.36 0.01 1.22 0.41 0.42 0.39 0.39 0.39 0.00 S
Khator Fibre & Fabrics 201409 4.21 12.68 11.50 0.01 1.19 0.37 0.42 0.39 0.39 0.39 0.00 S
Khator Fibre & Fabrics 201412 4.21 14.48 13.51 0.01 0.97 0.44 0.43 0.11 0.11 0.11 0.00 S
Khator Fibre & Fabrics 201503 4.21 15.28 14.40 0.16 1.03 0.60 0.55 -0.12 -0.12 -0.12 0.00 S
KIC Metaliks 201406 7.10 100.79 98.54 4.06 6.31 2.57 2.16 1.58 0.32 1.26 1.26 1.78 0.00 S
KIC Metaliks 201409 7.10 85.32 82.82 2.96 5.45 2.25 2.37 0.84 0.17 0.67 0.67 0.94 0.00 S
KIC Metaliks 201412 7.10 75.24 74.89 5.19 5.54 3.14 2.22 0.19 0.04 0.15 0.15 0.21 0.00 S
KIC Metaliks 201503 7.10 164.62 166.86 4.73 2.49 2.67 2.20 -2.38 -2.07 -0.31 -0.31 -0.43 0.00 S
Kiduja India 201406 1.72 0.16 -0.16 2.09 -2.24 -2.24 -2.24 -13.09 0.00 S
Kiduja India 201409 1.72 0.74 -0.02 0.77 1.84 -1.07 -1.07 -1.07 -6.24 0.00 S
Kiduja India 201412 1.72 -0.62 0.06 -0.69 1.90 -2.59 -2.59 -2.59 -15.11 0.00 S
Kiduja India 201503 1.72 0.02 0.09 -0.07 2.07 -2.14 -2.14 -2.14 -12.48 0.00 S
Kilitch Drugs (India) 201406 13.23 5.56 0.15 5.57 0.66 0.80 0.53 0.27 -0.23 0.50 0.50 0.38 0.00 S
Kilitch Drugs (India) 201409 13.23 6.05 0.17 5.29 0.61 1.53 0.55 0.98 -0.36 1.33 1.33 1.01 0.00 S
Kilitch Drugs (India) 201412 13.23 3.61 0.19 4.84 0.71 -0.34 0.58 -0.91 -0.16 -0.75 -0.75 -0.57 0.00 S
Kilitch Drugs (India) 201503 13.23 3.22 0.09 5.01 0.71 -0.99 0.19 -1.18 0.09 -1.27 -1.27 -0.96 0.00 S
Kings Infra Ventures 201406 3.09 0.42 0.38 0.00 0.04 0.03 0.01 0.01 0.00 0.01 0.01 0.03 0.00 S
Kings Infra Ventures 201409 3.09 0.04 0.18 -0.14 0.03 0.01 -0.19 -0.19 -0.19 -0.60 0.00 S
Kings Infra Ventures 201412 3.09 1.08 1.27 -0.19 0.06 0.01 -0.26 0.00 -0.26 -0.26 -0.83 0.00 S
Kings Infra Ventures 201503 3.09 2.55 2.06 0.08 0.56 0.03 -0.01 0.55 0.01 0.55 0.55 1.76 0.00 S
KK Fincorp 201406 1.40 0.17 0.02 0.11 0.26 0.26 0.05 0.21 0.21 1.51 0.00 S
KK Fincorp 201409 1.40 0.20 0.02 0.18 0.01 0.17 0.05 0.12 0.12 0.85 0.00 S
KK Fincorp 201412 5.60 0.22 0.22 0.00 0.03 -0.03 0.02 -0.05 -0.05 -0.10 0.00 S
KK Fincorp 201503 5.60 0.19 0.04 0.08 0.23 0.08 0.15 0.04 0.11 0.11 0.20 0.00 S
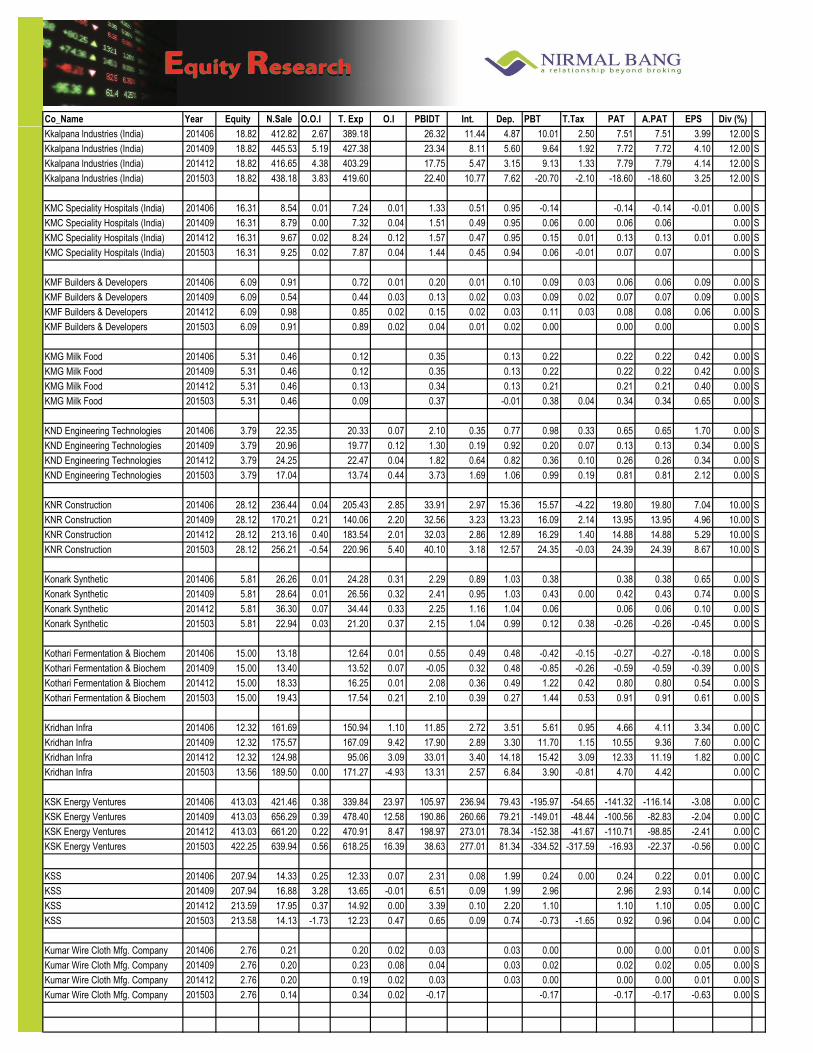
Co_Name Year Equity N.Sale O.O.I T. Exp O.I PBIDT Int. Dep. PBT T.Tax PAT A.PAT EPS Div (%)
Exp
ecte
d R
esu
lts
on
14
Au
gu
st 2
015
Kkalpana lndustries (India) 201406 18.82 412.82 2.67 389.18 26.32 11.44 4.87 10.01 2.50 7.51 7.51 3.99 12.00 S
Kkalpana lndustries (India) 201409 18.82 445.53 5.19 427.38 23.34 8.11 5.60 9.64 1.92 7.72 7.72 4.10 12.00 S
Kkalpana lndustries (India) 201412 18.82 416.65 4.38 403.29 17.75 5.47 3.15 9.13 1.33 7.79 7.79 4.14 12.00 S
Kkalpana lndustries (India) 201503 18.82 438.18 3.83 419.60 22.40 10.77 7.62 -20.70 -2.10 -18.60 -18.60 3.25 12.00 S
KMC Speciality Hospitals (India) 201406 16.31 8.54 0.01 7.24 0.01 1.33 0.51 0.95 -0.14 -0.14 -0.14 -0.01 0.00 S
KMC Speciality Hospitals (India) 201409 16.31 8.79 0.00 7.32 0.04 1.51 0.49 0.95 0.06 0.00 0.06 0.06 0.00 S
KMC Speciality Hospitals (India) 201412 16.31 9.67 0.02 8.24 0.12 1.57 0.47 0.95 0.15 0.01 0.13 0.13 0.01 0.00 S
KMC Speciality Hospitals (India) 201503 16.31 9.25 0.02 7.87 0.04 1.44 0.45 0.94 0.06 -0.01 0.07 0.07 0.00 S
KMF Builders & Developers 201406 6.09 0.91 0.72 0.01 0.20 0.01 0.10 0.09 0.03 0.06 0.06 0.09 0.00 S
KMF Builders & Developers 201409 6.09 0.54 0.44 0.03 0.13 0.02 0.03 0.09 0.02 0.07 0.07 0.09 0.00 S
KMF Builders & Developers 201412 6.09 0.98 0.85 0.02 0.15 0.02 0.03 0.11 0.03 0.08 0.08 0.06 0.00 S
KMF Builders & Developers 201503 6.09 0.91 0.89 0.02 0.04 0.01 0.02 0.00 0.00 0.00 0.00 S
KMG Milk Food 201406 5.31 0.46 0.12 0.35 0.13 0.22 0.22 0.22 0.42 0.00 S
KMG Milk Food 201409 5.31 0.46 0.12 0.35 0.13 0.22 0.22 0.22 0.42 0.00 S
KMG Milk Food 201412 5.31 0.46 0.13 0.34 0.13 0.21 0.21 0.21 0.40 0.00 S
KMG Milk Food 201503 5.31 0.46 0.09 0.37 -0.01 0.38 0.04 0.34 0.34 0.65 0.00 S
KND Engineering Technologies 201406 3.79 22.35 20.33 0.07 2.10 0.35 0.77 0.98 0.33 0.65 0.65 1.70 0.00 S
KND Engineering Technologies 201409 3.79 20.96 19.77 0.12 1.30 0.19 0.92 0.20 0.07 0.13 0.13 0.34 0.00 S
KND Engineering Technologies 201412 3.79 24.25 22.47 0.04 1.82 0.64 0.82 0.36 0.10 0.26 0.26 0.34 0.00 S
KND Engineering Technologies 201503 3.79 17.04 13.74 0.44 3.73 1.69 1.06 0.99 0.19 0.81 0.81 2.12 0.00 S
KNR Construction 201406 28.12 236.44 0.04 205.43 2.85 33.91 2.97 15.36 15.57 -4.22 19.80 19.80 7.04 10.00 S
KNR Construction 201409 28.12 170.21 0.21 140.06 2.20 32.56 3.23 13.23 16.09 2.14 13.95 13.95 4.96 10.00 S
KNR Construction 201412 28.12 213.16 0.40 183.54 2.01 32.03 2.86 12.89 16.29 1.40 14.88 14.88 5.29 10.00 S
KNR Construction 201503 28.12 256.21 -0.54 220.96 5.40 40.10 3.18 12.57 24.35 -0.03 24.39 24.39 8.67 10.00 S
Konark Synthetic 201406 5.81 26.26 0.01 24.28 0.31 2.29 0.89 1.03 0.38 0.38 0.38 0.65 0.00 S
Konark Synthetic 201409 5.81 28.64 0.01 26.56 0.32 2.41 0.95 1.03 0.43 0.00 0.42 0.43 0.74 0.00 S
Konark Synthetic 201412 5.81 36.30 0.07 34.44 0.33 2.25 1.16 1.04 0.06 0.06 0.06 0.10 0.00 S
Konark Synthetic 201503 5.81 22.94 0.03 21.20 0.37 2.15 1.04 0.99 0.12 0.38 -0.26 -0.26 -0.45 0.00 S
Kothari Fermentation & Biochem 201406 15.00 13.18 12.64 0.01 0.55 0.49 0.48 -0.42 -0.15 -0.27 -0.27 -0.18 0.00 S
Kothari Fermentation & Biochem 201409 15.00 13.40 13.52 0.07 -0.05 0.32 0.48 -0.85 -0.26 -0.59 -0.59 -0.39 0.00 S
Kothari Fermentation & Biochem 201412 15.00 18.33 16.25 0.01 2.08 0.36 0.49 1.22 0.42 0.80 0.80 0.54 0.00 S
Kothari Fermentation & Biochem 201503 15.00 19.43 17.54 0.21 2.10 0.39 0.27 1.44 0.53 0.91 0.91 0.61 0.00 S
Kridhan Infra 201406 12.32 161.69 150.94 1.10 11.85 2.72 3.51 5.61 0.95 4.66 4.11 3.34 0.00 C
Kridhan Infra 201409 12.32 175.57 167.09 9.42 17.90 2.89 3.30 11.70 1.15 10.55 9.36 7.60 0.00 C
Kridhan Infra 201412 12.32 124.98 95.06 3.09 33.01 3.40 14.18 15.42 3.09 12.33 11.19 1.82 0.00 C
Kridhan Infra 201503 13.56 189.50 0.00 171.27 -4.93 13.31 2.57 6.84 3.90 -0.81 4.70 4.42 0.00 C
KSK Energy Ventures 201406 413.03 421.46 0.38 339.84 23.97 105.97 236.94 79.43 -195.97 -54.65 -141.32 -116.14 -3.08 0.00 C
KSK Energy Ventures 201409 413.03 656.29 0.39 478.40 12.58 190.86 260.66 79.21 -149.01 -48.44 -100.56 -82.83 -2.04 0.00 C
KSK Energy Ventures 201412 413.03 661.20 0.22 470.91 8.47 198.97 273.01 78.34 -152.38 -41.67 -110.71 -98.85 -2.41 0.00 C
KSK Energy Ventures 201503 422.25 639.94 0.56 618.25 16.39 38.63 277.01 81.34 -334.52 -317.59 -16.93 -22.37 -0.56 0.00 C
KSS 201406 207.94 14.33 0.25 12.33 0.07 2.31 0.08 1.99 0.24 0.00 0.24 0.22 0.01 0.00 C
KSS 201409 207.94 16.88 3.28 13.65 -0.01 6.51 0.09 1.99 2.96 2.96 2.93 0.14 0.00 C
KSS 201412 213.59 17.95 0.37 14.92 0.00 3.39 0.10 2.20 1.10 1.10 1.10 0.05 0.00 C
KSS 201503 213.58 14.13 -1.73 12.23 0.47 0.65 0.09 0.74 -0.73 -1.65 0.92 0.96 0.04 0.00 C
Kumar Wire Cloth Mfg. Company 201406 2.76 0.21 0.20 0.02 0.03 0.03 0.00 0.00 0.00 0.01 0.00 S
Kumar Wire Cloth Mfg. Company 201409 2.76 0.20 0.23 0.08 0.04 0.03 0.02 0.02 0.02 0.05 0.00 S
Kumar Wire Cloth Mfg. Company 201412 2.76 0.20 0.19 0.02 0.03 0.03 0.00 0.00 0.00 0.01 0.00 S
Kumar Wire Cloth Mfg. Company 201503 2.76 0.14 0.34 0.02 -0.17 -0.17 -0.17 -0.17 -0.63 0.00 S

Co_Name Year Equity N.Sale O.O.I T. Exp O.I PBIDT Int. Dep. PBT T.Tax PAT A.PAT EPS Div (%)
Exp
ecte
d R
esu
lts
on
14
Au
gu
st 2
015
Kusam Electrical Industries 201406 0.24 1.05 0.02 0.95 0.00 0.13 0.01 0.03 0.10 0.03 0.07 0.07 2.92 0.00 S
Kusam Electrical Industries 201409 0.24 1.15 0.03 1.04 0.00 0.15 0.00 0.03 0.12 0.04 0.08 0.08 3.36 0.00 S
Kusam Electrical Industries 201412 0.24 1.06 0.01 0.99 0.01 0.08 0.00 0.00 0.08 0.03 0.06 0.06 2.37 0.00 S
Kusam Electrical Industries 201503 0.24 0.87 0.00 0.96 0.01 -0.08 0.00 0.03 -0.11 -0.02 -0.08 -0.08 -3.50 0.00 S
Kwality 201406 20.32 1326.22 1.03 1250.39 0.22 77.08 30.77 6.25 40.06 5.96 34.10 34.10 1.68 10.00 S
Kwality 201409 20.32 1296.87 0.05 1218.67 0.75 79.00 30.50 6.08 42.42 5.85 36.57 36.57 1.80 10.00 S
Kwality 201412 20.32 1286.11 0.11 1204.36 3.47 85.33 34.92 6.20 44.22 8.09 36.12 36.12 1.78 10.00 S
Kwality 201503 20.32 1358.62 0.15 1277.58 6.97 88.15 37.95 6.43 43.77 9.63 34.14 34.14 1.65 10.00 S
Kyra Landscapes 201406 27.48 0.22 0.04 0.09 0.27 0.27 0.08 0.20 0.20 0.05 0.00 S
Kyra Landscapes 201409 27.48 0.22 0.13 0.04 0.32 0.32 0.10 0.22 0.22 0.06 0.00 S
Kyra Landscapes 201412 27.48 0.07 0.05 0.12 0.14 0.14 0.04 0.10 0.10 0.02 0.00 S
Kyra Landscapes 201503 27.48 0.79 1.42 0.62 0.62 0.62 0.62 0.11 0.00 S
KZ Leasing & Finance 201406 3.04 0.12 0.08 0.05 0.10 0.01 0.00 0.08 0.08 0.08 0.28 0.00 S
KZ Leasing & Finance 201409 3.04 0.08 0.11 0.07 0.11 0.02 0.00 0.09 0.09 0.09 0.30 0.00 S
KZ Leasing & Finance 201412 3.04 0.10 0.08 0.01 0.04 0.01 0.00 0.02 0.02 0.02 0.08 0.00 S
KZ Leasing & Finance 201503 3.04 0.07 0.18 0.28 0.17 0.10 0.00 0.07 0.02 0.04 0.04 0.14 0.00 S
Laffans Petrochemicals 201406 8.00 0.27 0.62 0.19 -0.15 0.02 -0.18 -0.05 -0.12 -0.12 -0.15 0.00 S
Laffans Petrochemicals 201409 8.00 0.01 0.35 2.12 1.78 0.03 1.75 0.35 1.39 1.39 1.74 0.00 S
Laffans Petrochemicals 201412 8.00 0.23 0.00 0.58 0.35 0.01 0.04 -0.03 0.01 -0.04 -0.04 -0.05 0.00 S
Laffans Petrochemicals 201503 8.00 0.14 0.00 1.81 0.12 -1.55 -0.05 0.03 -1.53 -0.27 -1.27 -1.27 -1.58 0.00 S
Lakshmi Precision Screws 201406 10.94 90.30 0.86 78.26 1.27 14.16 8.98 4.02 1.16 0.76 0.41 0.41 0.37 0.00 S
Lakshmi Precision Screws 201409 10.94 87.58 0.65 75.02 -0.33 12.88 9.80 1.31 1.77 -0.41 2.18 2.18 1.99 0.00 S
Lakshmi Precision Screws 201412 10.94 91.73 0.43 78.68 0.51 13.99 9.12 3.52 1.34 -0.35 1.69 1.69 1.55 0.00 S
Lakshmi Precision Screws 201503 10.94 101.98 0.41 95.03 0.59 7.95 9.43 2.42 -3.90 -3.90 -3.90 -3.56 0.00 S
Lalit Polymers & Electronics 201406 6.00 0.00 0.04 -0.04 -0.04 -0.04 -0.04 -0.06 0.00 S
Lalit Polymers & Electronics 201409 6.00 0.08 -0.08 0.01 -0.10 -0.10 -0.10 -0.16 0.00 S
Lalit Polymers & Electronics 201412 6.00 0.03 -0.03 -0.03 -0.03 -0.03 -0.05 0.00 S
Lalit Polymers & Electronics 201503 6.00 0.12 0.08 0.04 0.50 -0.46 -0.46 -0.46 -0.77 0.00 S
Lancor Holdings 201406 4.05 40.20 25.41 0.26 15.06 6.11 0.63 8.32 3.15 4.97 4.97 2.45 100.00 C
Lancor Holdings 201409 4.05 31.09 17.49 0.07 13.67 6.56 0.98 6.12 2.39 3.73 3.73 1.84 100.00 C
Lancor Holdings 201412 4.05 44.86 30.91 0.08 14.03 6.62 0.81 6.60 2.85 3.76 3.75 1.85 100.00 C
Lancor Holdings 201503 4.05 34.16 23.60 0.54 11.10 4.59 0.84 5.67 1.28 4.39 4.39 2.17 100.00 C
Lawreshwar Polymers 201406 13.68 22.83 21.23 0.35 1.95 0.66 0.37 0.93 0.26 0.67 0.67 0.49 0.00 S
Lawreshwar Polymers 201409 13.68 18.30 16.85 0.17 1.61 0.64 0.36 0.61 0.24 0.37 0.37 0.27 0.00 S
Lawreshwar Polymers 201412 13.68 20.75 18.93 0.10 1.93 0.66 0.37 0.89 0.30 0.60 0.60 0.44 0.00 S
Lawreshwar Polymers 201503 13.68 21.78 20.02 0.11 1.87 0.68 0.38 0.80 0.29 0.51 0.51 0.37 0.00 S
Lead Financial Services 201406 3.30 0.14 0.00 0.00 0.14 0.01 0.03 0.10 0.03 0.07 0.07 0.22 0.00 S
Lead Financial Services 201409 3.30 0.14 0.04 0.00 0.10 0.01 0.03 0.06 0.02 0.04 0.04 0.13 0.00 S
Lead Financial Services 201412 3.30 0.19 0.07 0.00 0.12 0.01 0.03 0.08 0.02 0.05 0.05 0.16 0.00 S
Lead Financial Services 201503 3.30 0.23 0.08 0.00 0.16 0.01 0.10 0.05 0.02 0.03 0.03 0.09 0.00 S
Lloyd Rockfibres 201406 11.09 0.00 0.00 0.14 -0.14 0.02 -0.16 -0.16 -0.16 -0.14 0.00 S
Lloyd Rockfibres 201409 11.09 0.04 -0.04 0.02 -0.06 -0.06 -0.06 -0.05 0.00 S
Lloyd Rockfibres 201412 11.09 0.06 0.13 0.07 0.01 0.02 -0.01 -0.01 -0.01 -0.01 0.00 S
Lloyd Rockfibres 201503 11.09 0.01 0.14 -0.13 0.02 -0.15 -0.15 -0.15 -0.13 0.00 S
Lohia Securities 201406 4.98 11.46 0.00 8.60 0.31 3.17 0.25 0.11 2.81 2.81 2.81 5.64 2.00 S
Lohia Securities 201409 4.98 8.29 0.00 9.51 0.32 -0.91 0.25 0.11 -1.27 -1.27 -1.27 -2.55 2.00 S
Lohia Securities 201412 4.98 9.90 0.00 9.16 0.30 1.04 0.23 0.12 0.69 0.69 0.69 1.38 2.00 S
Lohia Securities 201503 4.98 9.01 0.00 8.49 0.29 0.82 0.18 0.13 0.51 0.84 -0.33 -0.33 -0.67 2.00 S

Co_Name Year Equity N.Sale O.O.I T. Exp O.I PBIDT Int. Dep. PBT T.Tax PAT A.PAT EPS Div (%)
Exp
ecte
d R
esu
lts
on
14
Au
gu
st 2
015
Lok Housing & Constructions 201406 46.75 1.72 1.60 1.55 1.67 1.51 0.03 0.13 0.03 0.11 0.11 0.02 0.00 S
Lok Housing & Constructions 201409 46.75 4.67 4.77 1.71 1.61 2.03 0.03 -0.45 -0.45 -0.45 -0.09 0.00 S
Lok Housing & Constructions 201412 46.75 0.90 2.84 1.89 -0.06 3.01 0.03 -3.09 -3.09 -3.09 -0.66 0.00 S
Lokesh Machines 201406 11.78 31.97 24.25 0.10 7.82 4.58 2.17 1.07 0.35 0.72 0.72 0.61 5.00 S
Lokesh Machines 201409 11.78 30.84 24.00 0.97 7.82 4.48 2.19 1.15 0.38 0.77 0.77 0.65 5.00 S
Lokesh Machines 201412 11.78 24.91 17.71 0.12 7.32 4.84 2.18 0.29 0.10 0.20 0.20 0.17 5.00 S
Lokesh Machines 201503 11.78 30.42 24.07 0.09 6.44 4.28 2.13 0.03 0.96 -0.93 -0.93 -0.78 5.00 S
Lumax Automotive Systems 201406 7.40 18.96 17.62 0.02 1.36 2.47 0.86 -2.12 -2.12 -2.12 -2.87 0.00 S
Lumax Automotive Systems 201409 7.40 18.02 16.85 0.02 1.18 2.42 0.80 -2.15 -2.05 -0.10 -0.10 -0.13 0.00 S
Lumax Automotive Systems 201412 7.40 15.92 15.50 0.02 0.44 2.20 0.73 -2.69 -0.27 -2.42 -2.42 -3.26 0.00 S
Lumax Automotive Systems 201503 7.40 15.60 19.41 0.02 -3.79 3.44 1.22 -6.66 3.20 -9.86 -9.86 -13.31 0.00 S
Maa Jagdambe Tradelinks 201406 15.69 17.10 16.90 0.20 0.20 0.06 0.14 0.14 0.09 0.00 S
Maa Jagdambe Tradelinks 201409 15.69 20.94 20.68 0.27 0.27 0.08 0.19 0.19 0.12 0.00 S
Maa Jagdambe Tradelinks 201412 15.69 48.36 47.81 0.55 0.55 0.17 0.38 0.38 0.05 0.00 S
Maa Jagdambe Tradelinks 201503 15.69 36.16 36.10 0.08 0.15 0.02 0.14 0.08 0.05 0.05 0.01 0.00 S
Maan Aluminium 201406 3.38 21.00 0.14 20.38 0.34 1.10 0.59 0.48 0.03 0.03 0.03 0.10 0.00 S
Maan Aluminium 201409 3.38 26.71 0.11 25.63 0.05 1.24 0.62 0.49 0.13 0.05 0.08 0.08 0.24 0.00 S
Maan Aluminium 201412 3.38 24.38 0.20 23.28 0.09 1.39 0.71 0.50 0.18 0.11 0.07 0.07 0.21 0.00 S
Maan Aluminium 201503 3.38 37.25 0.20 37.11 0.48 0.82 0.80 -0.04 0.06 -0.01 0.07 0.07 0.21 0.00 S
Macro International 201406 3.97 0.05 0.08 0.02 0.00 0.02 0.01 0.01 0.01 0.30 0.00 S
Macro International 201409 3.97 0.05 0.10 0.05 0.00 0.05 0.02 0.03 0.03 0.09 0.00 S
Macro International 201412 3.97 0.00 0.06 0.08 0.02 0.00 0.00 0.02 0.01 0.01 0.01 0.03 0.00 S
Macro International 201503 3.99 0.11 0.07 -0.03 0.00 -0.04 -0.16 0.13 0.13 0.31 0.00 S
Madhucon Projects 201406 7.38 146.12 4.39 117.95 17.78 50.33 29.75 11.18 9.40 2.91 6.49 6.49 0.88 10.00 S
Madhucon Projects 201409 7.38 247.14 7.78 212.69 2.46 44.68 25.16 8.63 10.90 1.34 9.56 9.56 1.29 10.00 S
Madhucon Projects 201412 7.38 425.03 6.00 375.11 2.06 57.98 27.87 8.48 21.63 4.53 17.09 17.09 2.32 10.00 S
Madhucon Projects 201503 7.38 293.97 6.98 231.15 5.27 75.06 45.08 9.49 20.50 4.30 16.20 16.20 2.20 10.00 S
Madhur Capital & Finance 201406 9.59 0.02 -0.02 -0.02 -0.02 -0.02 -0.01 0.00 S
Madhur Capital & Finance 201409 9.59 0.00 0.00 0.00 0.00 0.00 0.00 S
Madhur Capital & Finance 201412 9.59 0.00 0.00 0.00 0.00 0.00 0.00 S
Madhur Capital & Finance 201503 9.59 0.01 0.00 -0.01 0.00 -0.01 -0.01 -0.01 0.00 S
Madhur Industries 201406 4.09 2.52 2.51 0.02 0.03 0.03 0.03 0.03 0.06 0.00 S
Madhur Industries 201409 4.09 2.54 2.46 0.02 0.10 0.10 0.10 0.10 0.24 0.00 S
Madhur Industries 201412 4.09 2.76 2.75 0.01 0.02 0.02 0.02 0.02 0.00 S
Madhur Industries 201503 4.09 2.92 2.82 0.03 0.13 0.01 0.18 -0.06 0.00 -0.07 -0.07 -0.02 0.00 S
Magna Industries & Exports 201406 11.36 7.36 7.22 0.14 0.00 0.01 0.13 0.04 0.09 0.09 0.08 0.00 S
Magna Industries & Exports 201409 11.36 5.17 5.04 0.01 0.14 0.00 0.01 0.14 0.04 0.09 0.09 0.08 0.00 S
Magna Industries & Exports 201412 11.36 7.55 7.39 0.03 0.19 0.01 0.01 0.18 0.05 0.13 0.13 0.11 0.00 S
Magna Industries & Exports 201503 11.36 9.14 11.52 2.83 0.45 0.01 0.44 0.16 0.28 0.28 0.97 0.00 S
Mahalaxmi Seamless 201406 5.29 4.74 4.22 0.01 0.52 0.13 0.16 0.23 0.23 0.23 0.43 0.00 S
Mahalaxmi Seamless 201409 5.29 3.43 3.05 0.01 0.39 0.17 0.17 0.06 0.06 0.06 0.11 0.00 S
Mahalaxmi Seamless 201412 5.29 5.04 4.78 0.75 1.01 0.34 0.16 0.51 0.51 0.51 0.97 0.00 S
Mahalaxmi Seamless 201503 5.29 5.42 6.04 0.17 -0.45 0.27 0.16 -0.87 -0.87 -0.87 -1.65 0.00 S
Mahan Industries 201406 36.00 0.12 0.27 -0.15 0.17 0.00 -0.32 -0.32 -0.32 -0.01 0.00 S
Mahan Industries 201409 36.00 0.08 0.09 -0.02 0.13 0.00 -0.15 -0.15 -0.15 -0.06 0.00 S
Mahan Industries 201412 36.00 0.67 1.08 -0.41 0.14 0.00 -0.55 -0.55 -0.55 -0.15 0.00 S
Mahan Industries 201503 36.00 0.46 0.07 -0.01 0.39 0.11 0.27 0.27 0.27 0.01 0.00 S

Co_Name Year Equity N.Sale O.O.I T. Exp O.I PBIDT Int. Dep. PBT T.Tax PAT A.PAT EPS Div (%)
Exp
ecte
d R
esu
lts
on
14
Au
gu
st 2
015
Mahanagar Telephone Nigam 201406 630.00 854.33 1.69 990.11 54.31 -79.78 362.97 290.48 -733.23 -733.23 -733.23 -11.64 0.00 S
Mahanagar Telephone Nigam 201409 630.00 845.26 5.46 1037.07 50.59 -135.76 409.36 289.10 -834.22 -834.22 -834.22 -13.24 0.00 S
Mahanagar Telephone Nigam 201412 630.00 813.92 3.00 958.35 64.52 -76.91 362.81 291.11 -730.83 -730.83 -730.83 -11.60 0.00 S
Mahanagar Telephone Nigam 201503 630.00 873.01 3.41 1130.71 251.56 -2.73 304.48 287.90 -595.11 -595.11 -595.11 -9.45 0.00 S
Maharashtra Corporation 201406 13.53 0.84 0.02 0.80 0.06 0.06 0.06 0.06 0.00 S
Maharashtra Corporation 201409 13.53 0.91 0.03 0.90 0.04 0.00 0.04 0.04 0.04 0.00 S
Maharashtra Corporation 201412 13.53 0.55 0.54 0.01 0.01 0.01 0.01 0.00 S
Maharashtra Corporation 201503 13.53 0.44 0.56 0.07 -0.06 0.00 -0.06 0.01 -0.07 -0.07 -0.54 0.00 S
Mahaveer Infoway 201406 5.51 21.67 1.94 23.33 0.28 0.15 0.02 0.11 0.11 0.11 0.19 0.00 C
Mahaveer Infoway 201409 5.51 17.04 2.48 19.23 0.29 0.16 0.02 0.12 0.12 0.12 0.02 0.00 C
Mahaveer Infoway 201412 5.51 14.16 2.45 16.29 0.32 0.17 0.02 0.14 0.14 0.14 0.03 0.00 C
Mahaveer Infoway 201503 5.51 26.11 0.36 26.33 0.15 0.04 0.02 0.09 0.09 0.09 0.02 0.00 C
Mahavir Industries 201406 10.00 0.04 0.04 0.01 0.01 0.00 0.01 0.01 0.00 S
Mahavir Industries 201409 10.00 0.04 0.03 -0.01 -0.01 -0.01 -0.01 -0.01 0.00 S
Mahavir Industries 201412 10.00 0.03 0.01 -0.03 -0.03 -0.03 -0.03 -0.03 0.00 S
Mahavir Industries 201503 10.00 0.09 0.10 0.04 0.04 0.04 0.00 0.03 0.03 0.03 0.00 S
Maithan Alloys 201406 14.56 219.18 5.50 204.75 0.79 20.72 1.22 0.84 18.66 4.76 13.90 13.90 9.55 0.00 S
Maithan Alloys 201409 14.56 242.92 2.55 223.54 0.99 22.91 0.82 0.85 21.24 6.05 15.19 15.19 10.43 0.00 S
Maithan Alloys 201412 14.56 207.59 -1.63 188.27 0.79 18.48 0.88 0.85 16.75 4.35 12.40 12.40 8.52 0.00 S
Maithan Alloys 201503 14.56 205.93 2.73 200.21 0.49 8.94 0.50 0.85 7.60 -2.44 10.04 10.04 6.90 0.00 S
Majestic Auto 201406 10.40 27.27 5.16 33.50 0.03 -1.04 2.19 7.17 -10.40 -2.79 12.48 12.48 12.00 0.00 C
Majestic Auto 201409 10.40 27.83 6.74 36.94 10.99 8.62 2.54 7.27 -1.19 -3.61 2.42 2.42 2.33 0.00 C
Majestic Auto 201412 10.40 15.78 1.22 22.72 0.04 -5.68 2.75 7.56 -15.99 -5.60 -10.39 -10.39 -9.99 0.00 C
Majestic Auto 201503 10.40 26.13 3.90 40.16 3.16 -6.97 2.94 4.39 8.64 -5.34 13.98 13.98 13.44 0.00 C
Malwa Cotton Spinning Mills 201406 7.90 39.26 53.86 0.27 -14.33 0.12 0.74 -15.19 -15.19 -15.19 -20.12 0.00 S
Malwa Cotton Spinning Mills 201409 7.90 33.56 46.32 0.24 -12.52 0.07 0.55 -13.14 -13.14 -13.14 -17.53 0.00 S
Malwa Cotton Spinning Mills 201412 7.90 24.40 29.83 0.03 -5.40 0.13 0.65 -6.18 -6.18 -6.18 -8.74 0.00 S
Malwa Cotton Spinning Mills 201503 7.90 13.48 16.04 0.83 -1.73 0.64 -2.37 -2.37 -2.37 -3.98 0.00 S
Manappuram Finance 201406 168.24 452.96 3.36 163.58 2.13 294.87 213.42 14.67 66.77 22.79 43.99 43.99 0.52 67.50 S
Manappuram Finance 201409 168.24 500.12 2.72 160.65 1.74 343.93 213.87 13.92 116.15 39.72 76.43 76.43 0.91 67.50 S
Manappuram Finance 201412 168.24 510.80 4.93 154.32 0.71 362.12 226.28 13.14 122.71 42.07 80.64 80.64 0.96 67.50 S
Manappuram Finance 201503 168.24 494.09 6.75 163.41 0.63 338.06 219.10 12.16 106.80 37.12 69.68 69.68 0.83 67.50 S
Mangal Credit and Fincorp 201406 1.41 3.42 0.55 0.53 3.41 2.67 0.13 0.61 0.12 0.49 0.49 3.48 20.00 S
Mangal Credit and Fincorp 201409 1.41 2.48 0.97 0.87 2.38 2.28 0.13 -0.03 -0.06 0.03 0.03 0.24 20.00 S
Mangal Credit and Fincorp 201412 1.41 2.51 0.66 0.34 2.19 2.09 0.28 -0.18 -0.03 -0.14 -0.14 -1.01 20.00 S
Mangal Credit and Fincorp 201503 1.41 3.26 0.43 0.40 3.24 2.06 0.19 0.98 0.44 0.55 0.55 3.88 20.00 S
Mangalam Organics 201406 9.05 51.97 47.41 0.16 4.71 1.42 1.20 2.10 0.00 2.10 2.10 2.32 0.00 S
Mangalam Organics 201409 9.05 76.93 73.63 1.65 4.95 1.54 1.22 2.20 0.75 1.45 1.45 1.60 0.00 S
Mangalam Organics 201412 9.05 55.59 51.09 0.22 4.73 1.25 1.24 2.23 0.70 1.53 1.53 1.69 0.00 S
Mangalam Organics 201503 9.05 54.61 51.71 1.53 4.43 1.60 2.52 0.31 0.31 0.31 0.35 0.00 S
Manipal Finance Corporation 201406 8.38 0.07 0.04 -0.04 0.03 0.13 0.14 0.13 0.17 0.00 S
Manipal Finance Corporation 201409 8.38 0.03 0.07 0.04 0.04 0.04 -0.01 0.03 -0.01 0.03 0.00 S
Manipal Finance Corporation 201412 8.38 0.04 0.04 0.00 0.03 0.02 0.02 0.02 0.03 0.00 S
Manipal Finance Corporation 201503 8.38 0.06 0.04 -0.01 0.00 0.08 -0.05 -0.05 -0.05 -0.06 0.00 S
Mansoon Trading Company 201406 2.46 0.05 0.01 0.00 0.04 0.04 0.01 0.03 0.03 0.11 0.00 S
Mansoon Trading Company 201409 2.46 0.05 0.00 0.02 0.07 0.07 0.02 0.06 0.06 0.23 0.00 S
Mansoon Trading Company 201412 2.46 0.05 0.01 0.05 0.05 0.02 0.03 0.03 0.14 0.00 S
Mansoon Trading Company 201503 2.46 0.05 0.01 0.05 0.05 0.02 0.03 0.03 0.13 0.00 S

Co_Name Year Equity N.Sale O.O.I T. Exp O.I PBIDT Int. Dep. PBT T.Tax PAT A.PAT EPS Div (%)
Exp
ecte
d R
esu
lts
on
14
Au
gu
st 2
015
Marathon Nextgen Realty 201406 18.96 12.00 4.69 11.66 18.97 0.01 0.08 18.89 4.01 14.88 14.88 7.85 60.00 S
Marathon Nextgen Realty 201409 18.96 5.33 2.54 12.06 14.85 0.00 0.08 14.77 3.08 11.68 11.68 6.16 60.00 S
Marathon Nextgen Realty 201412 18.96 1.26 12.08 10.81 0.08 10.74 2.28 8.46 8.46 4.46 60.00 S
Marathon Nextgen Realty 201503 18.96 5.00 8.82 12.02 8.19 0.08 8.12 4.73 3.39 3.39 1.79 60.00 S
Maruti Infrastructure 201406 12.50 4.57 4.36 0.00 0.21 0.01 0.03 0.18 0.05 0.12 0.12 0.00 S
Maruti Infrastructure 201409 12.50 3.86 3.38 0.00 0.48 0.02 0.03 0.44 0.13 0.30 0.30 0.24 0.00 S
Maruti Infrastructure 201412 12.50 5.38 4.95 0.00 0.43 0.01 0.03 0.39 0.12 0.27 0.27 0.22 0.00 S
Maruti Infrastructure 201503 12.50 8.09 0.07 7.48 0.06 0.74 0.06 0.09 0.59 0.21 0.37 0.37 0.30 0.00 S
Mathew Easow Research Securities 201406 6.65 3.44 3.45 0.00 0.00 0.01 -0.01 -0.01 -0.01 -0.02 0.00 S
Mathew Easow Research Securities 201409 6.65 5.31 3.28 2.03 0.01 0.01 2.01 0.21 1.80 1.80 2.71 0.00 S
Mathew Easow Research Securities 201412 6.65 1.05 1.19 -0.14 0.00 0.01 -0.15 -0.15 -0.15 -0.23 0.00 S
Mathew Easow Research Securities 201503 6.65 11.59 9.92 1.67 0.01 0.05 1.61 0.51 1.10 1.10 1.65 0.00 C
Maximaa Systems 201406 10.05 3.38 2.85 0.54 0.38 0.14 0.02 0.02 0.02 0.02 0.00 S
Maximaa Systems 201409 10.05 4.82 4.22 0.01 0.61 0.45 0.14 0.03 0.03 0.03 0.00 S
Maximaa Systems 201412 10.05 8.39 7.67 0.00 0.72 0.54 0.14 0.04 0.04 0.04 0.01 0.00 S
Maximaa Systems 201503 10.12 8.72 8.03 0.26 0.95 0.77 0.25 -0.06 0.00 -0.06 -0.06 -0.01 0.00 S
Mayur Leather Products 201406 4.84 7.01 0.62 6.90 0.23 0.96 0.15 0.09 0.72 0.15 0.57 0.57 1.17 10.00 S
Mayur Leather Products 201409 4.84 5.64 0.68 6.13 0.24 0.42 0.11 0.09 0.22 0.07 0.15 0.15 0.30 10.00 S
Mayur Leather Products 201412 4.84 6.07 0.70 6.75 0.32 0.33 0.14 0.10 0.10 0.04 0.07 0.07 0.14 10.00 S
Mayur Leather Products 201503 4.84 6.83 0.54 7.57 0.30 0.10 0.14 0.32 -0.35 -0.06 -0.29 -0.29 -0.60 10.00 S
Mazda Properties 201406 1.00 0.02 -0.02 -0.02 -0.02 -0.02 -0.02 0.00 S
Mazda Properties 201409 1.00 0.03 -0.03 -0.03 -0.03 -0.03 -0.03 0.00 S
Mazda Properties 201412 1.00 0.02 -0.02 -0.02 -0.02 -0.02 -0.02 0.00 S
Mazda Properties 201503 1.00 0.02 0.02 0.00 0.00 0.00 0.00 0.00 S
MBI Intercorp 201406 3.13 0.02 -0.02 -0.01 -0.01 -0.01 -0.01 -0.06 0.00 S
MBI Intercorp 201412 3.13 0.01 0.01 0.00 0.01 -0.01 -0.01 -0.01 0.00 S
MBI Intercorp 201503 3.13 0.02 0.04 -0.02 -0.02 -0.02 -0.02 -0.01 0.00 S
MBL Infrastructures 201406 17.51 512.75 456.42 0.42 56.75 20.10 4.89 31.76 7.98 23.78 23.78 13.58 30.00 C
MBL Infrastructures 201409 17.51 351.67 295.33 0.36 56.70 24.95 5.07 26.68 4.71 21.97 21.97 12.55 30.00 C
MBL Infrastructures 201412 20.73 542.08 478.18 0.55 64.45 28.33 6.44 29.68 7.86 21.82 21.82 12.46 30.00 C
MBL Infrastructures 201503 20.73 555.29 494.95 1.81 62.15 27.75 3.76 30.64 16.62 14.02 14.02 6.76 30.00 C
Mcdowell Holdings 201406 13.99 2.96 0.20 2.77 3.31 -0.55 -0.55 -0.55 -0.39 0.00 S
Mcdowell Holdings 201409 13.99 4.64 0.43 4.20 3.47 18.17 18.17 18.17 12.98 0.00 S
Mcdowell Holdings 201412 13.99 3.42 0.17 3.24 3.59 -0.35 -0.35 -0.35 -0.25 0.00 S
Mcdowell Holdings 201503 13.99 3.08 11.25 -8.18 3.64 -11.82 -11.82 -11.82 -8.44 0.00 S
Medicamen Biotech 201406 8.91 19.02 18.16 0.45 1.31 0.63 0.52 0.16 -0.14 0.30 0.30 0.34 0.00 S
Medicamen Biotech 201409 8.91 27.31 25.62 0.16 1.85 0.71 0.53 0.61 0.11 0.50 0.50 0.56 0.00 S
Medicamen Biotech 201412 8.91 12.89 12.48 0.35 0.76 0.65 0.53 -0.42 -0.05 -0.37 -0.37 -0.41 0.00 S
Medicamen Biotech 201503 9.51 18.57 17.61 0.14 1.11 0.82 0.52 -0.23 -0.24 0.01 0.01 0.01 0.00 S
Megh Mayur Infra 201406 6.30 0.03 -0.03 -0.03 -0.03 -0.03 -0.05 0.00 S
Megh Mayur Infra 201409 6.30 0.02 -0.02 -0.02 -0.02 -0.02 -0.03 0.00 S
Megh Mayur Infra 201412 6.30 0.02 -0.02 -0.02 -0.02 -0.02 -0.04 0.00 S
Megh Mayur Infra 201503 6.30 0.03 -0.03 -0.03 -0.03 -0.03 -0.05 0.00 S
Meglon Infra-Real (India) 201406 5.00 0.02 0.03 0.00 -0.01 0.00 -0.01 0.00 -0.01 -0.01 0.00 S
Meglon Infra-Real (India) 201409 5.00 0.03 0.05 -0.02 -0.02 -0.02 -0.02 0.00 S
Meglon Infra-Real (India) 201412 5.00 0.04 0.03 0.00 0.00 0.00 0.00 0.00 S
Meglon Infra-Real (India) 201503 5.00 0.01 0.04 -0.03 -0.03 -0.03 -0.03 -0.05 0.00 S

Co_Name Year Equity N.Sale O.O.I T. Exp O.I PBIDT Int. Dep. PBT T.Tax PAT A.PAT EPS Div (%)
Exp
ecte
d R
esu
lts
on
14
Au
gu
st 2
015
Melstar Information Technologies 201406 14.28 4.81 0.03 4.66 0.01 0.19 0.31 0.20 -0.32 -0.32 -0.32 -0.23 0.00 S
Melstar Information Technologies 201409 14.28 5.32 0.00 5.15 0.81 0.98 0.30 0.18 -1.28 -1.28 -1.28 -0.90 0.00 S
Melstar Information Technologies 201412 14.28 5.56 0.01 4.73 0.00 0.83 0.41 0.17 0.25 0.25 0.25 0.17 0.00 S
Melstar Information Technologies 201503 14.28 6.68 0.17 6.61 -0.02 0.22 0.36 0.16 -0.30 -0.30 -0.30 -0.21 0.00 S
Mercury Metals 201406 6.95 0.19 0.20 -0.02 -0.02 -0.02 -0.02 -0.02 0.00 S
Mercury Metals 201409 6.95 0.11 0.12 0.01 -0.01 -0.01 -0.01 -0.01 -0.01 0.00 S
Mercury Metals 201412 6.95 0.18 0.19 0.06 0.05 0.05 0.05 0.05 0.07 0.00 S
Mercury Metals 201503 6.95 0.24 0.24 -0.01 -0.01 0.01 0.01 -0.01 -0.01 0.00 S
Metal Coatings (India) 201406 7.33 31.02 0.71 30.64 0.08 1.16 0.53 0.18 0.44 0.14 0.30 0.30 0.41 10.00 S
Metal Coatings (India) 201409 7.33 29.15 0.28 28.61 0.07 0.88 0.46 0.22 0.21 0.07 0.14 0.14 0.19 10.00 S
Metal Coatings (India) 201412 7.33 27.27 0.32 26.46 0.06 1.19 0.53 0.20 0.46 0.15 0.31 0.31 0.43 10.00 S
Metal Coatings (India) 201503 7.33 24.74 0.78 24.07 0.14 1.60 0.47 0.17 0.96 0.30 0.66 0.66 0.90 10.00 S
Metalyst Forgings 201406 36.75 611.41 38.11 476.92 172.60 50.19 37.71 84.70 26.97 57.73 57.73 15.71 10.00 S
Metalyst Forgings 201409 36.75 612.12 30.40 481.73 160.79 58.34 38.63 63.82 19.48 44.34 44.34 12.07 10.00 S
Metalyst Forgings 201412 36.75 635.62 34.14 502.01 167.75 63.91 47.02 56.82 19.30 37.52 37.52 10.21 10.00 S
Metalyst Forgings 201503 36.75 556.98 21.16 453.79 124.35 87.24 47.50 -10.39 -3.56 -6.83 -6.83 -1.86 10.00 S
Metropoli Overseas 201406 11.93 3.87 4.24 -0.37 0.02 0.15 -0.54 -0.54 -0.54 -0.45 0.00 S
Metropoli Overseas 201409 11.93 3.00 3.48 -0.48 0.02 0.15 -0.65 -0.65 -0.65 -0.55 0.00 S
Metropoli Overseas 201412 11.93 3.20 3.40 -0.20 0.02 0.15 -0.37 -0.29 -0.37 -0.31 0.00 S
Metropoli Overseas 201503 11.93 2.27 0.00 2.32 -0.05 0.03 -0.18 0.10 0.10 0.10 0.08 0.00 S
MIC Electronics 201406 20.50 36.99 0.79 39.34 0.09 -1.47 3.09 1.97 -3.38 -0.18 -3.20 -3.20 -0.31 0.00 C
MIC Electronics 201409 20.50 36.64 0.39 36.88 0.67 0.82 3.79 1.98 -4.95 -4.95 -4.95 -0.48 0.00 C
MIC Electronics 201412 20.50 40.21 0.53 39.71 0.58 1.61 3.45 1.94 -3.78 0.02 -3.80 -3.80 -0.37 0.00 C
MIC Electronics 201503 23.78 44.42 0.91 35.67 1.38 11.04 -3.16 1.99 12.21 -1.60 13.81 13.81 1.16 0.00 C
Midland Polymers 201406 13.59 0.08 0.17 0.09 0.00 0.09 0.09 0.09 0.01 0.00 S
Midland Polymers 201409 13.59 0.07 0.14 0.07 0.00 0.06 0.06 0.06 0.01 0.00 S
Midland Polymers 201412 13.59 0.07 0.18 0.11 0.00 0.10 0.10 0.10 0.01 0.00 S
Midland Polymers 201503 13.59 -0.09 0.05 -0.14 0.01 -0.15 -0.06 -0.09 -0.09 -0.01 0.00 S
Midwest Gold 201406 3.27 0.02 0.08 -0.06 0.02 -0.07 -0.07 -0.07 -0.22 0.00 S
Midwest Gold 201409 3.27 0.08 0.15 -0.07 0.02 -0.09 -0.09 -0.09 -0.27 0.00 S
Midwest Gold 201412 3.27 0.02 0.11 -0.09 0.00 0.02 -0.11 -0.11 -0.11 -0.33 0.00 S
Midwest Gold 201503 3.27 0.14 0.04 -0.10 0.00 0.18 -0.28 -0.64 0.36 0.36 1.09 0.00 S
Milk Partners India 201406 7.75 12.35 12.25 0.10 0.10 0.01 0.00 0.00 0.00 0.01 0.00 S
Milk Partners India 201409 7.75 38.84 38.72 0.11 0.10 0.02 0.01 0.01 0.01 0.01 0.00 S
Milk Partners India 201412 7.75 64.83 64.69 0.14 0.10 0.04 0.01 0.03 0.03 0.03 0.00 S
Milkfood 201406 4.89 101.19 1.08 99.72 2.55 2.49 1.46 -1.40 -1.40 -1.40 -2.86 0.00 S
Milkfood 201409 4.89 58.54 0.03 56.67 0.03 1.93 2.34 1.75 -2.16 -2.16 -2.16 -4.41 0.00 S
Milkfood 201412 4.89 113.78 0.81 106.28 0.03 8.34 2.93 1.53 3.88 3.88 3.88 7.93 0.00 S
Milkfood 201503 4.89 95.90 0.11 92.38 1.00 4.63 1.58 1.64 1.41 0.71 0.70 0.70 1.43 0.00 S
Minal Industries 201406 38.38 17.24 18.81 -0.31 -1.88 0.00 0.01 -1.89 -1.89 -1.91 -0.10 0.00 C
Minal Industries 201409 38.38 0.15 0.92 0.78 0.00 0.01 0.77 0.75 0.77 0.04 0.00 S
Minal Industries 201412 38.38 -16.55 -17.77 -0.69 0.53 0.01 0.01 0.51 0.51 0.50 0.03 0.00 C
Minal Industries 201503 38.38 3.34 5.22 -0.48 -2.36 -0.01 0.11 -2.47 -0.04 -2.45 -2.45 -0.13 0.00 C
Mini Diamonds (India) 201406 3.45 28.12 28.34 0.40 0.18 0.10 0.02 0.06 0.06 0.06 0.02 0.00 S
Mini Diamonds (India) 201409 3.45 35.12 35.93 1.00 0.19 0.13 0.03 0.04 0.04 0.04 0.01 0.00 S
Mini Diamonds (India) 201412 3.45 25.83 25.74 0.13 0.22 0.13 0.04 0.06 0.06 0.06 0.02 0.00 S
Mini Diamonds (India) 201503 3.45 31.12 1.03 31.53 0.62 0.35 0.02 0.25 0.20 0.05 0.05 0.02 0.00 S
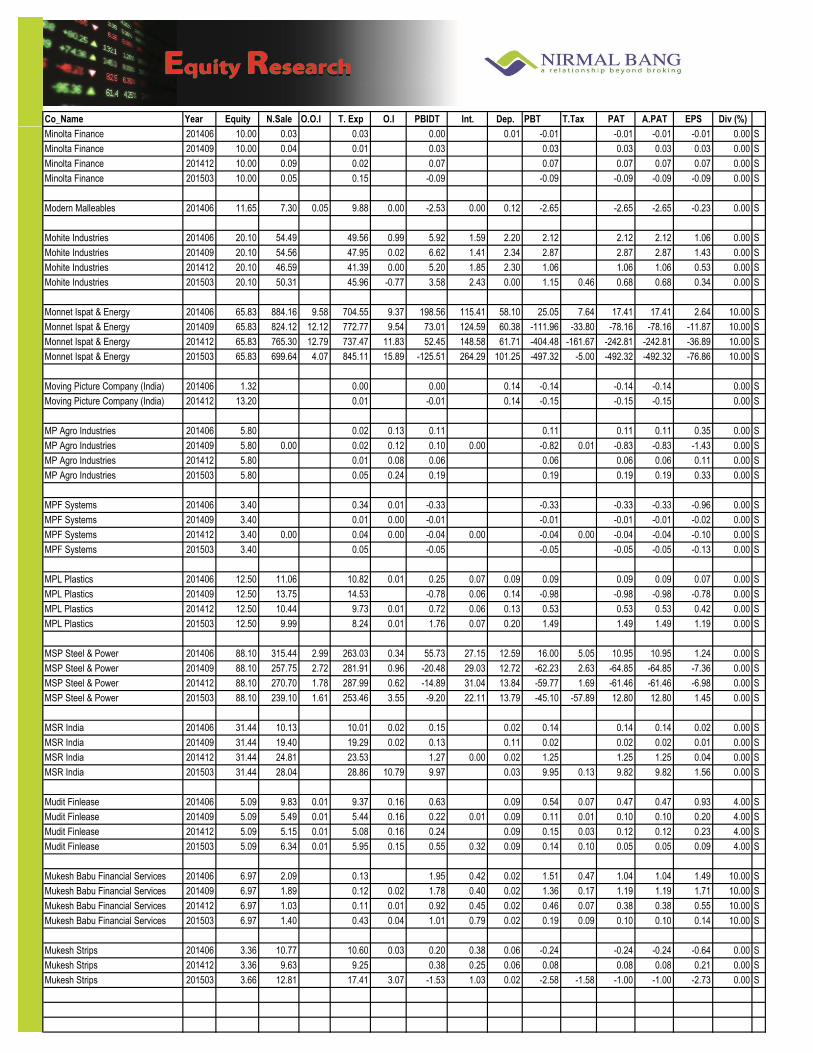
Co_Name Year Equity N.Sale O.O.I T. Exp O.I PBIDT Int. Dep. PBT T.Tax PAT A.PAT EPS Div (%)
Exp
ecte
d R
esu
lts
on
14
Au
gu
st 2
015
Minolta Finance 201406 10.00 0.03 0.03 0.00 0.01 -0.01 -0.01 -0.01 -0.01 0.00 S
Minolta Finance 201409 10.00 0.04 0.01 0.03 0.03 0.03 0.03 0.03 0.00 S
Minolta Finance 201412 10.00 0.09 0.02 0.07 0.07 0.07 0.07 0.07 0.00 S
Minolta Finance 201503 10.00 0.05 0.15 -0.09 -0.09 -0.09 -0.09 -0.09 0.00 S
Modern Malleables 201406 11.65 7.30 0.05 9.88 0.00 -2.53 0.00 0.12 -2.65 -2.65 -2.65 -0.23 0.00 S
Mohite Industries 201406 20.10 54.49 49.56 0.99 5.92 1.59 2.20 2.12 2.12 2.12 1.06 0.00 S
Mohite Industries 201409 20.10 54.56 47.95 0.02 6.62 1.41 2.34 2.87 2.87 2.87 1.43 0.00 S
Mohite Industries 201412 20.10 46.59 41.39 0.00 5.20 1.85 2.30 1.06 1.06 1.06 0.53 0.00 S
Mohite Industries 201503 20.10 50.31 45.96 -0.77 3.58 2.43 0.00 1.15 0.46 0.68 0.68 0.34 0.00 S
Monnet Ispat & Energy 201406 65.83 884.16 9.58 704.55 9.37 198.56 115.41 58.10 25.05 7.64 17.41 17.41 2.64 10.00 S
Monnet Ispat & Energy 201409 65.83 824.12 12.12 772.77 9.54 73.01 124.59 60.38 -111.96 -33.80 -78.16 -78.16 -11.87 10.00 S
Monnet Ispat & Energy 201412 65.83 765.30 12.79 737.47 11.83 52.45 148.58 61.71 -404.48 -161.67 -242.81 -242.81 -36.89 10.00 S
Monnet Ispat & Energy 201503 65.83 699.64 4.07 845.11 15.89 -125.51 264.29 101.25 -497.32 -5.00 -492.32 -492.32 -76.86 10.00 S
Moving Picture Company (India) 201406 1.32 0.00 0.00 0.14 -0.14 -0.14 -0.14 0.00 S
Moving Picture Company (India) 201412 13.20 0.01 -0.01 0.14 -0.15 -0.15 -0.15 0.00 S
MP Agro Industries 201406 5.80 0.02 0.13 0.11 0.11 0.11 0.11 0.35 0.00 S
MP Agro Industries 201409 5.80 0.00 0.02 0.12 0.10 0.00 -0.82 0.01 -0.83 -0.83 -1.43 0.00 S
MP Agro Industries 201412 5.80 0.01 0.08 0.06 0.06 0.06 0.06 0.11 0.00 S
MP Agro Industries 201503 5.80 0.05 0.24 0.19 0.19 0.19 0.19 0.33 0.00 S
MPF Systems 201406 3.40 0.34 0.01 -0.33 -0.33 -0.33 -0.33 -0.96 0.00 S
MPF Systems 201409 3.40 0.01 0.00 -0.01 -0.01 -0.01 -0.01 -0.02 0.00 S
MPF Systems 201412 3.40 0.00 0.04 0.00 -0.04 0.00 -0.04 0.00 -0.04 -0.04 -0.10 0.00 S
MPF Systems 201503 3.40 0.05 -0.05 -0.05 -0.05 -0.05 -0.13 0.00 S
MPL Plastics 201406 12.50 11.06 10.82 0.01 0.25 0.07 0.09 0.09 0.09 0.09 0.07 0.00 S
MPL Plastics 201409 12.50 13.75 14.53 -0.78 0.06 0.14 -0.98 -0.98 -0.98 -0.78 0.00 S
MPL Plastics 201412 12.50 10.44 9.73 0.01 0.72 0.06 0.13 0.53 0.53 0.53 0.42 0.00 S
MPL Plastics 201503 12.50 9.99 8.24 0.01 1.76 0.07 0.20 1.49 1.49 1.49 1.19 0.00 S
MSP Steel & Power 201406 88.10 315.44 2.99 263.03 0.34 55.73 27.15 12.59 16.00 5.05 10.95 10.95 1.24 0.00 S
MSP Steel & Power 201409 88.10 257.75 2.72 281.91 0.96 -20.48 29.03 12.72 -62.23 2.63 -64.85 -64.85 -7.36 0.00 S
MSP Steel & Power 201412 88.10 270.70 1.78 287.99 0.62 -14.89 31.04 13.84 -59.77 1.69 -61.46 -61.46 -6.98 0.00 S
MSP Steel & Power 201503 88.10 239.10 1.61 253.46 3.55 -9.20 22.11 13.79 -45.10 -57.89 12.80 12.80 1.45 0.00 S
MSR India 201406 31.44 10.13 10.01 0.02 0.15 0.02 0.14 0.14 0.14 0.02 0.00 S
MSR India 201409 31.44 19.40 19.29 0.02 0.13 0.11 0.02 0.02 0.02 0.01 0.00 S
MSR India 201412 31.44 24.81 23.53 1.27 0.00 0.02 1.25 1.25 1.25 0.04 0.00 S
MSR India 201503 31.44 28.04 28.86 10.79 9.97 0.03 9.95 0.13 9.82 9.82 1.56 0.00 S
Mudit Finlease 201406 5.09 9.83 0.01 9.37 0.16 0.63 0.09 0.54 0.07 0.47 0.47 0.93 4.00 S
Mudit Finlease 201409 5.09 5.49 0.01 5.44 0.16 0.22 0.01 0.09 0.11 0.01 0.10 0.10 0.20 4.00 S
Mudit Finlease 201412 5.09 5.15 0.01 5.08 0.16 0.24 0.09 0.15 0.03 0.12 0.12 0.23 4.00 S
Mudit Finlease 201503 5.09 6.34 0.01 5.95 0.15 0.55 0.32 0.09 0.14 0.10 0.05 0.05 0.09 4.00 S
Mukesh Babu Financial Services 201406 6.97 2.09 0.13 1.95 0.42 0.02 1.51 0.47 1.04 1.04 1.49 10.00 S
Mukesh Babu Financial Services 201409 6.97 1.89 0.12 0.02 1.78 0.40 0.02 1.36 0.17 1.19 1.19 1.71 10.00 S
Mukesh Babu Financial Services 201412 6.97 1.03 0.11 0.01 0.92 0.45 0.02 0.46 0.07 0.38 0.38 0.55 10.00 S
Mukesh Babu Financial Services 201503 6.97 1.40 0.43 0.04 1.01 0.79 0.02 0.19 0.09 0.10 0.10 0.14 10.00 S
Mukesh Strips 201406 3.36 10.77 10.60 0.03 0.20 0.38 0.06 -0.24 -0.24 -0.24 -0.64 0.00 S
Mukesh Strips 201412 3.36 9.63 9.25 0.38 0.25 0.06 0.08 0.08 0.08 0.21 0.00 S
Mukesh Strips 201503 3.66 12.81 17.41 3.07 -1.53 1.03 0.02 -2.58 -1.58 -1.00 -1.00 -2.73 0.00 S

Co_Name Year Equity N.Sale O.O.I T. Exp O.I PBIDT Int. Dep. PBT T.Tax PAT A.PAT EPS Div (%)
Exp
ecte
d R
esu
lts
on
14
Au
gu
st 2
015
Multiplus Holdings 201406 1.88 0.71 0.05 0.67 0.01 0.66 0.66 0.66 3.49 2.00 S
Multiplus Holdings 201409 1.88 0.01 0.03 -0.03 0.01 -0.03 -0.03 -0.03 -0.18 2.00 S
Multiplus Holdings 201412 1.88 0.01 0.04 -0.03 0.01 -0.04 -0.04 -0.04 -0.21 2.00 S
Multiplus Holdings 201503 1.88 0.01 0.40 -0.39 0.01 -0.40 0.03 -0.43 -0.43 -2.31 2.00 S
Munoth Capital Markets 201406 8.99 0.15 0.04 0.00 0.11 0.05 0.01 0.06 0.06 0.06 0.07 0.00 C
Munoth Capital Markets 201409 4.50 0.20 0.60 0.09 -0.31 0.03 0.01 -0.35 -0.35 -0.35 -0.39 0.00 C
Munoth Capital Markets 201412 4.50 0.13 0.17 0.05 0.00 0.02 0.01 -0.02 -0.02 -0.02 -0.03 0.00 C
Munoth Capital Markets 201503 4.50 0.01 0.11 0.25 0.15 0.04 0.02 0.09 0.07 0.03 0.03 0.03 0.00 C
MW Unitexx 201406 10.07 290.13 266.72 0.59 23.99 7.96 7.53 4.88 5.58 -0.70 -0.36 -0.36 0.00 C
MW Unitexx 201409 10.07 225.65 208.38 1.94 19.21 11.18 7.27 0.75 5.55 -4.80 -4.24 -4.21 0.00 C
MW Unitexx 201412 10.07 228.32 210.93 1.20 18.59 4.57 7.32 6.56 1.13 5.43 5.63 5.59 0.00 C
My Money Securities 201412 10.00 0.26 0.23 0.02 0.05 0.01 0.01 0.03 0.01 0.02 0.02 0.02 0.00 S
My Money Securities 201503 10.00 0.12 0.15 0.05 0.02 0.02 0.02 -0.02 -0.02 -0.02 -0.02 0.00 S
Nagarjuna Agri Tech 201406 9.37 0.02 0.01 -0.01 0.03 -0.04 -0.04 -0.04 0.00 S
Nagarjuna Agri Tech 201409 9.37 0.01 0.02 -0.01 0.03 -0.04 -0.04 -0.04 -0.04 0.00 S
Nagarjuna Agri Tech 201412 9.37 0.01 0.01 0.00 0.01 0.00 0.03 -0.03 0.00 -0.03 -0.03 -0.03 0.00 S
Nakoda 201406 150.00 414.36 7.96 437.40 5.50 -9.59 47.75 9.10 -66.43 -66.43 -66.43 -2.21 6.00 S
Nakoda 201409 150.00 241.70 242.49 0.02 -0.77 38.36 8.97 -48.09 -48.09 -48.09 -1.60 6.00 S
Nakoda 201412 150.00 18.13 19.54 0.21 -1.20 39.24 8.97 -49.41 -49.41 -49.41 -1.60 6.00 S
Nakoda 201503 150.00 98.06 197.37 3.99 -95.33 111.16 10.81 -217.29 -217.29 -217.29 -13.80 6.00 S
NAM Securities 201406 3.05 0.17 0.10 0.07 0.02 0.04 0.04 0.04 0.60 0.00 S
NAM Securities 201409 3.05 0.12 0.07 0.05 0.00 0.03 0.02 0.02 0.02 0.21 0.00 S
NAM Securities 201412 3.05 0.15 0.08 0.08 0.00 0.04 0.04 0.04 0.04 0.56 0.00 S
NAM Securities 201503 3.05 0.19 0.21 -0.02 0.00 -0.01 -0.02 0.02 -0.04 -0.04 0.00 S
National Fittings 201406 8.32 9.49 7.66 0.20 2.03 0.19 0.29 1.54 0.56 0.99 0.99 1.19 10.00 S
National Fittings 201409 8.32 13.37 10.44 0.26 3.19 0.28 0.29 2.63 0.85 1.77 1.77 2.13 10.00 S
National Fittings 201412 8.32 12.78 9.66 0.27 3.40 0.28 0.29 2.83 0.92 1.91 1.91 2.29 10.00 S
National Fittings 201503 8.32 13.80 12.01 0.22 2.01 0.32 0.39 1.30 0.48 0.83 0.83 1.00 10.00 S
National Plastic Industries 201406 9.13 18.99 0.22 17.17 2.03 1.07 0.57 0.39 0.39 0.39 0.43 0.00 S
National Plastic Industries 201409 9.13 19.29 1.35 18.91 1.73 1.01 0.33 0.39 0.39 0.39 0.42 0.00 S
National Plastic Industries 201412 9.13 19.78 0.82 18.69 1.91 1.10 0.45 0.36 0.36 0.36 0.39 0.00 S
National Plastic Industries 201503 9.13 25.58 0.29 23.80 2.07 0.88 0.44 0.75 0.61 0.14 0.14 0.16 0.00 S
National Standard (India) 201406 20.00 9.07 5.41 3.65 7.31 3.55 0.09 3.67 1.42 2.26 2.26 1.13 0.00 S
National Standard (India) 201409 20.00 5.67 0.01 4.79 3.01 3.90 3.39 0.09 0.43 0.14 0.28 0.28 0.14 0.00 S
National Standard (India) 201412 20.00 58.72 0.20 30.82 6.26 34.36 6.63 0.17 27.56 9.50 18.06 18.06 9.03 0.00 S
National Standard (India) 201503 20.00 79.88 0.02 46.31 4.22 37.80 3.37 0.08 34.35 12.28 22.07 22.07 11.03 0.00 S
NB Footwear 201406 13.50 0.05 -0.05 -0.05 -0.05 -0.05 -0.04 0.00 S
NB Footwear 201409 13.50 0.04 -0.04 -0.04 -0.04 -0.04 -0.03 0.00 S
NB Footwear 201412 13.50 0.04 -0.04 -0.04 -0.04 -0.04 -0.03 0.00 S
NB Footwear 201503 13.50 0.04 -0.04 -0.04 -0.04 -0.04 -0.03 0.00 S
ND Metal Industries 201406 2.48 0.07 0.10 0.00 -0.03 0.08 -0.11 -0.11 -0.11 -0.43 0.00 S
ND Metal Industries 201409 2.48 0.09 0.13 0.02 -0.03 0.07 -0.10 -0.10 -0.10 -0.40 0.00 S
ND Metal Industries 201412 2.48 0.18 0.01 -0.18 0.08 -0.26 -0.26 -0.26 -1.02 0.00 S
ND Metal Industries 201503 2.48 0.00 0.05 0.65 0.60 0.07 0.53 0.53 0.53 2.13 0.00 S
Nectar Lifesciences 201406 22.43 381.58 0.14 315.98 2.30 68.04 28.40 19.23 20.41 4.16 16.25 16.25 0.72 10.00 S
Nectar Lifesciences 201409 22.43 393.74 0.15 321.57 2.66 74.98 35.49 18.88 20.62 4.20 16.42 16.42 0.73 10.00 S
Nectar Lifesciences 201412 22.43 444.12 0.32 371.47 2.22 75.19 34.83 19.07 21.29 4.41 16.89 16.89 0.75 10.00 S
Nectar Lifesciences 201503 22.43 423.46 0.14 367.72 12.82 68.70 26.88 19.38 22.44 5.73 16.71 16.71 0.75 10.00 S

Co_Name Year Equity N.Sale O.O.I T. Exp O.I PBIDT Int. Dep. PBT T.Tax PAT A.PAT EPS Div (%)
Exp
ecte
d R
esu
lts
on
14
Au
gu
st 2
015
Neelkanth Technologies 201406 3.62 0.00 0.00 0.00 -0.01 -0.01 -0.01 -0.02 0.00 S
Neelkanth Technologies 201409 3.62 0.00 0.00 0.00 -0.01 -0.01 -0.01 -0.01 0.00 S
Neelkanth Technologies 201412 3.62 0.02 -0.02 0.00 -0.03 -0.03 -0.03 -0.07 0.00 S
Neelkanth Technologies 201503 3.62 0.03 -0.03 0.00 -0.03 -0.03 -0.03 -0.08 0.00 S
Neha International 201406 28.38 79.57 0.15 78.90 0.83 1.01 0.68 -0.87 0.08 -0.94 -0.80 -0.28 0.00 C
Neha International 201409 28.38 28.54 0.18 27.34 1.38 1.12 0.68 -0.43 -0.43 -0.29 -0.10 0.00 C
Neha International 201412 28.38 32.09 0.35 31.22 1.22 0.95 0.33 -0.06 0.14 -0.20 -0.22 -0.08 0.00 C
Neha International 201503 28.38 90.02 0.88 89.39 1.51 1.33 0.36 -0.19 0.48 -0.66 -0.56 -0.20 0.00 C
Neo Corp International 201406 38.02 261.35 0.69 235.49 26.55 8.94 2.59 15.02 4.45 10.57 10.57 2.78 0.00 C
Neo Corp International 201409 38.02 188.64 2.67 169.78 21.53 6.52 2.01 13.00 4.20 8.80 8.80 2.31 0.00 S
Neo Corp International 201412 38.02 194.29 0.34 174.15 20.49 9.74 2.51 8.24 0.13 8.11 8.11 2.13 0.00 S
Neo Corp International 201503 38.02 543.99 5.29 482.93 66.35 34.10 5.57 26.68 4.58 22.10 22.10 5.81 0.00 S
Net 4 India 201406 20.06 13.34 37.22 0.34 -23.54 1.38 5.06 -29.97 -8.62 -21.36 -20.16 -10.05 0.00 C
Net 4 India 201409 20.06 12.90 33.44 -0.23 -20.78 5.70 5.17 -31.64 -2.52 -29.12 -25.93 -45.32 0.00 C
Net 4 India 201412 20.06 13.16 6.47 2.86 9.55 0.68 5.18 3.70 8.13 -4.43 -4.43 -0.21 0.00 C
Net 4 India 201503 20.06 12.57 37.87 -0.66 -25.96 -2.35 11.84 -35.45 -6.16 -29.29 -29.29 -63.71 0.00 C
Networth Stock Broking 201406 11.23 5.45 4.72 0.19 0.91 0.54 0.27 0.15 0.01 0.14 0.14 0.12 0.00 S
Networth Stock Broking 201409 11.23 12.16 9.97 0.98 3.17 1.28 0.55 1.33 0.06 1.27 1.27 1.13 0.00 S
Networth Stock Broking 201412 30.31 10.92 9.10 0.85 2.67 1.52 0.45 0.70 -0.01 0.71 0.71 0.23 0.00 S
Networth Stock Broking 201503 30.31 13.33 11.94 2.75 4.15 1.57 1.77 0.81 1.53 -0.73 -0.73 -0.24 0.00 S
Neuland Laboratories 201406 7.73 102.68 0.73 89.07 14.34 5.68 3.90 4.76 1.74 3.02 3.02 3.95 15.00 S
Neuland Laboratories 201409 7.73 119.68 1.64 105.92 2.32 17.71 6.30 3.90 7.51 2.36 5.15 5.15 6.72 15.00 S
Neuland Laboratories 201412 8.95 101.95 5.80 94.34 0.88 14.30 6.77 3.90 3.63 1.71 1.92 1.92 2.21 15.00 S
Neuland Laboratories 201503 8.95 123.59 9.38 113.46 1.29 20.81 8.60 3.62 8.58 2.89 5.69 5.69 6.40 15.00 S
New Markets Advisory 201406 1.24 0.02 0.05 0.03 0.03 0.01 0.02 0.02 0.18 0.00 S
New Markets Advisory 201409 1.24 0.01 0.01 0.00 0.00 0.00 0.00 -0.02 0.00 S
New Markets Advisory 201412 1.24 0.02 -0.02 -0.04 -0.04 -0.01 -0.03 -0.03 0.00 S
New Markets Advisory 201503 1.24 0.01 0.01 -0.01 -0.01 -0.01 -0.01 -0.06 0.00 S
Nexus Commodities And Technologies201409 5.47 0.11 0.05 0.06 0.00 0.06 0.02 0.04 0.04 0.07 0.00 S
Nexus Commodities And Technologies201412 5.47 0.13 0.05 0.08 0.00 0.08 0.02 0.05 0.05 0.09 0.00 S
Nexus Commodities And Technologies201503 5.47 0.13 0.10 0.03 -0.01 0.04 0.01 0.03 0.03 0.05 0.00 S
Neycer India 201406 10.15 6.18 5.51 0.01 0.67 0.50 0.39 -0.23 -0.23 -0.23 -0.23 0.00 S
Neycer India 201412 10.15 5.60 5.06 0.01 0.55 0.65 0.19 -0.29 -0.29 -0.29 -0.28 0.00 S
Neycer India 201503 10.15 5.52 5.21 0.10 0.41 0.51 0.27 -0.37 -0.37 -0.37 -0.36 0.00 S
NHC Foods 201406 7.70 34.84 1.06 35.20 0.61 1.31 0.40 0.30 0.61 0.10 0.51 0.51 0.66 0.00 S
NHC Foods 201409 7.70 34.85 1.04 35.22 0.42 1.10 0.48 0.29 0.32 0.10 0.22 0.22 0.28 0.00 S
NHC Foods 201412 7.70 37.29 1.27 37.43 0.16 1.30 0.52 0.30 0.48 0.15 0.33 0.33 0.43 0.00 S
NHC Foods 201503 11.29 36.34 0.59 35.83 -0.29 0.81 0.49 0.30 0.02 -0.11 0.13 0.13 0.16 0.00 S
Nicco Uco Alliance Credit 201406 40.10 0.28 0.15 -0.13 18.03 0.10 -18.26 -18.26 -18.26 -4.55 0.00 S
Nicco Uco Alliance Credit 201409 40.10 1.34 0.25 0.27 1.36 19.45 0.11 -18.20 -18.20 -18.20 -4.53 0.00 S
Nicco Uco Alliance Credit 201412 40.10 0.24 0.23 -0.01 20.22 0.10 -20.33 -20.33 -20.33 -5.06 0.00 S
Nicco Uco Alliance Credit 201503 16.60 0.03 0.33 6.96 6.66 20.11 0.10 -13.55 -13.55 -13.55 -1.63 0.00 S
Nihar Info Global 201406 6.19 0.21 0.09 0.00 0.12 0.00 0.00 0.12 0.12 0.12 0.20 0.00 S
Nihar Info Global 201409 5.00 0.04 0.04 0.01 0.01 0.00 0.01 0.01 0.01 0.01 0.00 S
Nihar Info Global 201412 5.00 0.19 0.03 0.16 0.00 0.16 0.16 0.16 0.33 0.00 S
Nihar Info Global 201503 5.00 1.19 1.12 0.07 0.00 0.06 0.06 0.06 0.13 0.00 S
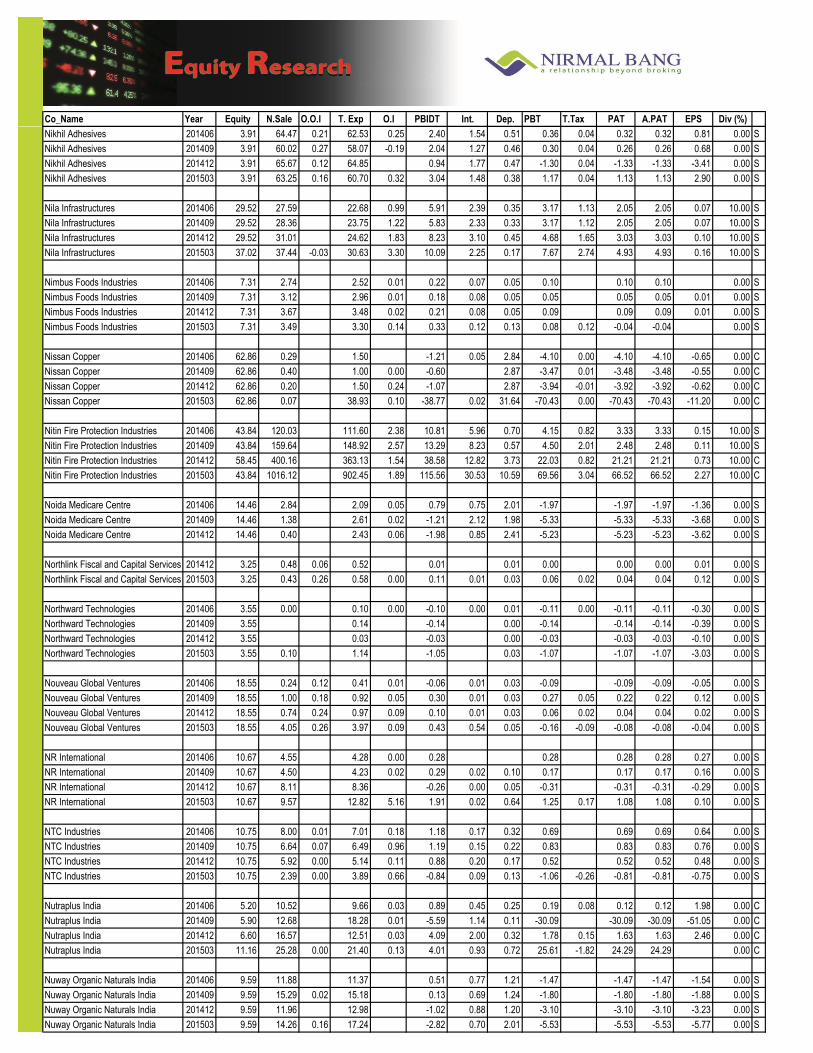
Co_Name Year Equity N.Sale O.O.I T. Exp O.I PBIDT Int. Dep. PBT T.Tax PAT A.PAT EPS Div (%)
Exp
ecte
d R
esu
lts
on
14
Au
gu
st 2
015
Nikhil Adhesives 201406 3.91 64.47 0.21 62.53 0.25 2.40 1.54 0.51 0.36 0.04 0.32 0.32 0.81 0.00 S
Nikhil Adhesives 201409 3.91 60.02 0.27 58.07 -0.19 2.04 1.27 0.46 0.30 0.04 0.26 0.26 0.68 0.00 S
Nikhil Adhesives 201412 3.91 65.67 0.12 64.85 0.94 1.77 0.47 -1.30 0.04 -1.33 -1.33 -3.41 0.00 S
Nikhil Adhesives 201503 3.91 63.25 0.16 60.70 0.32 3.04 1.48 0.38 1.17 0.04 1.13 1.13 2.90 0.00 S
Nila Infrastructures 201406 29.52 27.59 22.68 0.99 5.91 2.39 0.35 3.17 1.13 2.05 2.05 0.07 10.00 S
Nila Infrastructures 201409 29.52 28.36 23.75 1.22 5.83 2.33 0.33 3.17 1.12 2.05 2.05 0.07 10.00 S
Nila Infrastructures 201412 29.52 31.01 24.62 1.83 8.23 3.10 0.45 4.68 1.65 3.03 3.03 0.10 10.00 S
Nila Infrastructures 201503 37.02 37.44 -0.03 30.63 3.30 10.09 2.25 0.17 7.67 2.74 4.93 4.93 0.16 10.00 S
Nimbus Foods Industries 201406 7.31 2.74 2.52 0.01 0.22 0.07 0.05 0.10 0.10 0.10 0.00 S
Nimbus Foods Industries 201409 7.31 3.12 2.96 0.01 0.18 0.08 0.05 0.05 0.05 0.05 0.01 0.00 S
Nimbus Foods Industries 201412 7.31 3.67 3.48 0.02 0.21 0.08 0.05 0.09 0.09 0.09 0.01 0.00 S
Nimbus Foods Industries 201503 7.31 3.49 3.30 0.14 0.33 0.12 0.13 0.08 0.12 -0.04 -0.04 0.00 S
Nissan Copper 201406 62.86 0.29 1.50 -1.21 0.05 2.84 -4.10 0.00 -4.10 -4.10 -0.65 0.00 C
Nissan Copper 201409 62.86 0.40 1.00 0.00 -0.60 2.87 -3.47 0.01 -3.48 -3.48 -0.55 0.00 C
Nissan Copper 201412 62.86 0.20 1.50 0.24 -1.07 2.87 -3.94 -0.01 -3.92 -3.92 -0.62 0.00 C
Nissan Copper 201503 62.86 0.07 38.93 0.10 -38.77 0.02 31.64 -70.43 0.00 -70.43 -70.43 -11.20 0.00 C
Nitin Fire Protection Industries 201406 43.84 120.03 111.60 2.38 10.81 5.96 0.70 4.15 0.82 3.33 3.33 0.15 10.00 S
Nitin Fire Protection Industries 201409 43.84 159.64 148.92 2.57 13.29 8.23 0.57 4.50 2.01 2.48 2.48 0.11 10.00 S
Nitin Fire Protection Industries 201412 58.45 400.16 363.13 1.54 38.58 12.82 3.73 22.03 0.82 21.21 21.21 0.73 10.00 C
Nitin Fire Protection Industries 201503 43.84 1016.12 902.45 1.89 115.56 30.53 10.59 69.56 3.04 66.52 66.52 2.27 10.00 C
Noida Medicare Centre 201406 14.46 2.84 2.09 0.05 0.79 0.75 2.01 -1.97 -1.97 -1.97 -1.36 0.00 S
Noida Medicare Centre 201409 14.46 1.38 2.61 0.02 -1.21 2.12 1.98 -5.33 -5.33 -5.33 -3.68 0.00 S
Noida Medicare Centre 201412 14.46 0.40 2.43 0.06 -1.98 0.85 2.41 -5.23 -5.23 -5.23 -3.62 0.00 S
Northlink Fiscal and Capital Services 201412 3.25 0.48 0.06 0.52 0.01 0.01 0.00 0.00 0.00 0.01 0.00 S
Northlink Fiscal and Capital Services 201503 3.25 0.43 0.26 0.58 0.00 0.11 0.01 0.03 0.06 0.02 0.04 0.04 0.12 0.00 S
Northward Technologies 201406 3.55 0.00 0.10 0.00 -0.10 0.00 0.01 -0.11 0.00 -0.11 -0.11 -0.30 0.00 S
Northward Technologies 201409 3.55 0.14 -0.14 0.00 -0.14 -0.14 -0.14 -0.39 0.00 S
Northward Technologies 201412 3.55 0.03 -0.03 0.00 -0.03 -0.03 -0.03 -0.10 0.00 S
Northward Technologies 201503 3.55 0.10 1.14 -1.05 0.03 -1.07 -1.07 -1.07 -3.03 0.00 S
Nouveau Global Ventures 201406 18.55 0.24 0.12 0.41 0.01 -0.06 0.01 0.03 -0.09 -0.09 -0.09 -0.05 0.00 S
Nouveau Global Ventures 201409 18.55 1.00 0.18 0.92 0.05 0.30 0.01 0.03 0.27 0.05 0.22 0.22 0.12 0.00 S
Nouveau Global Ventures 201412 18.55 0.74 0.24 0.97 0.09 0.10 0.01 0.03 0.06 0.02 0.04 0.04 0.02 0.00 S
Nouveau Global Ventures 201503 18.55 4.05 0.26 3.97 0.09 0.43 0.54 0.05 -0.16 -0.09 -0.08 -0.08 -0.04 0.00 S
NR International 201406 10.67 4.55 4.28 0.00 0.28 0.28 0.28 0.28 0.27 0.00 S
NR International 201409 10.67 4.50 4.23 0.02 0.29 0.02 0.10 0.17 0.17 0.17 0.16 0.00 S
NR International 201412 10.67 8.11 8.36 -0.26 0.00 0.05 -0.31 -0.31 -0.31 -0.29 0.00 S
NR International 201503 10.67 9.57 12.82 5.16 1.91 0.02 0.64 1.25 0.17 1.08 1.08 0.10 0.00 S
NTC Industries 201406 10.75 8.00 0.01 7.01 0.18 1.18 0.17 0.32 0.69 0.69 0.69 0.64 0.00 S
NTC Industries 201409 10.75 6.64 0.07 6.49 0.96 1.19 0.15 0.22 0.83 0.83 0.83 0.76 0.00 S
NTC Industries 201412 10.75 5.92 0.00 5.14 0.11 0.88 0.20 0.17 0.52 0.52 0.52 0.48 0.00 S
NTC Industries 201503 10.75 2.39 0.00 3.89 0.66 -0.84 0.09 0.13 -1.06 -0.26 -0.81 -0.81 -0.75 0.00 S
Nutraplus India 201406 5.20 10.52 9.66 0.03 0.89 0.45 0.25 0.19 0.08 0.12 0.12 1.98 0.00 C
Nutraplus India 201409 5.90 12.68 18.28 0.01 -5.59 1.14 0.11 -30.09 -30.09 -30.09 -51.05 0.00 C
Nutraplus India 201412 6.60 16.57 12.51 0.03 4.09 2.00 0.32 1.78 0.15 1.63 1.63 2.46 0.00 C
Nutraplus India 201503 11.16 25.28 0.00 21.40 0.13 4.01 0.93 0.72 25.61 -1.82 24.29 24.29 0.00 C
Nuway Organic Naturals India 201406 9.59 11.88 11.37 0.51 0.77 1.21 -1.47 -1.47 -1.47 -1.54 0.00 S
Nuway Organic Naturals India 201409 9.59 15.29 0.02 15.18 0.13 0.69 1.24 -1.80 -1.80 -1.80 -1.88 0.00 S
Nuway Organic Naturals India 201412 9.59 11.96 12.98 -1.02 0.88 1.20 -3.10 -3.10 -3.10 -3.23 0.00 S
Nuway Organic Naturals India 201503 9.59 14.26 0.16 17.24 -2.82 0.70 2.01 -5.53 -5.53 -5.53 -5.77 0.00 S

Co_Name Year Equity N.Sale O.O.I T. Exp O.I PBIDT Int. Dep. PBT T.Tax PAT A.PAT EPS Div (%)
Exp
ecte
d R
esu
lts
on
14
Au
gu
st 2
015
Odyssey Corporation 201406 19.70 0.05 0.12 0.60 0.53 0.00 0.02 0.51 0.51 0.51 0.13 0.00 S
Odyssey Corporation 201409 19.70 2.75 3.13 0.98 0.59 0.02 0.58 0.58 0.58 0.15 0.00 S
Odyssey Corporation 201412 19.70 2.89 3.25 1.16 0.79 0.02 0.78 0.78 0.78 0.20 0.00 S
Odyssey Corporation 201503 19.70 21.95 26.48 3.70 -0.84 0.09 -0.92 -0.02 -0.90 -0.90 -0.23 0.00 S
OK Play India 201406 17.08 18.46 15.61 2.85 1.71 1.64 -0.55 -0.55 -0.55 -3.19 0.00 S
OK Play India 201409 17.98 7.45 0.15 5.29 2.31 2.14 1.70 -2.46 -2.46 -2.46 -1.36 0.00 S
OK Play India 201412 17.98 21.04 0.14 16.65 4.52 2.48 0.64 0.56 0.56 0.56 0.31 0.00 S
OK Play India 201503 17.98 9.70 -0.04 31.04 22.25 0.88 2.41 -1.27 0.13 -0.67 0.81 0.81 0.45 0.00 S
Olympia Capitals 201406 7.20 0.00 0.00 0.00 0.00 0.00 0.00 S
Olympia Capitals 201409 7.20 0.01 -0.01 -0.01 -0.01 -0.01 -0.01 0.00 S
Olympia Capitals 201412 7.20 0.01 -0.01 -0.01 -0.01 -0.01 -0.01 0.00 S
Olympia Capitals 201503 7.20 0.01 -0.01 -0.01 -0.01 -0.01 -0.01 0.00 S
Olympia Industries 201406 3.06 12.79 0.06 12.14 0.05 0.76 0.06 0.05 0.64 0.64 0.64 2.13 0.00 S
Olympia Industries 201409 3.06 22.40 0.06 20.72 0.05 1.80 0.08 0.06 1.66 1.66 1.66 5.50 0.00 S
Olympia Industries 201412 3.06 49.96 0.06 46.75 0.06 3.33 0.13 0.06 3.14 3.14 3.14 10.38 0.00 S
Olympia Industries 201503 3.06 36.84 0.07 37.55 0.34 -0.29 0.19 0.02 -0.50 0.38 -0.87 -0.87 -2.89 0.00 S
Omega Ag-Seeds (Punjab) 201406 7.90 0.13 0.17 0.05 0.01 0.00 0.01 0.00 0.01 0.01 0.01 0.00 S
Omega Ag-Seeds (Punjab) 201409 7.90 0.24 0.24 0.05 0.05 0.00 0.05 0.01 0.04 0.04 0.05 0.00 S
Omega Ag-Seeds (Punjab) 201412 7.90 1.27 1.28 0.05 0.04 0.00 0.04 0.01 0.03 0.03 0.04 0.00 S
Omega Ag-Seeds (Punjab) 201503 7.90 2.61 2.69 0.06 -0.02 0.01 -0.03 0.01 -0.03 -0.03 -0.04 0.00 S
Omnitex Industries (India) 201406 4.23 0.02 0.06 0.04 0.04 0.01 0.00 0.00 0.00 0.01 0.00 S
Omnitex Industries (India) 201409 4.23 0.04 0.07 0.03 0.04 -0.01 0.00 0.00 0.00 -0.01 0.00 S
Omnitex Industries (India) 201412 4.23 0.03 0.08 0.05 0.04 -0.01 -0.01 -0.01 -0.02 0.00 S
Omnitex Industries (India) 201503 4.23 0.22 0.24 0.08 0.06 0.04 0.02 -0.03 0.05 0.05 0.12 0.00 S
Onelife Capital Advisors 201406 13.36 0.15 0.62 0.47 0.01 0.46 0.09 0.38 0.38 0.28 0.00 S
Onelife Capital Advisors 201409 13.36 0.28 0.98 0.70 0.01 0.69 0.13 0.56 0.56 0.42 0.00 S
Onelife Capital Advisors 201412 13.36 0.21 1.06 0.85 0.01 0.84 0.19 0.66 0.66 0.49 0.00 S
Onelife Capital Advisors 201503 13.36 0.05 2.31 0.96 -1.30 0.10 0.01 -1.86 -0.37 -1.49 -1.49 -1.12 0.00 S
Opto Circuits (India) 201406 242.32 313.34 0.15 247.45 3.20 69.24 36.02 23.09 10.13 1.77 8.35 9.39 0.39 0.00 C
Opto Circuits (India) 201409 242.32 306.10 0.05 234.98 5.25 76.42 38.38 22.84 15.20 0.03 15.17 14.15 0.58 0.00 C
Opto Circuits (India) 201412 242.32 280.84 0.08 234.06 6.78 53.63 29.94 23.21 -180.92 -1.70 -179.22 -178.84 -7.38 0.00 C
Opto Circuits (India) 201503 242.32 286.52 0.05 221.52 9.57 74.62 39.55 25.42 9.66 1.61 8.05 8.33 0.34 0.00 C
Orbit Corporation 201406 113.96 32.98 12.05 2.69 23.62 47.16 0.80 -48.34 -15.45 -32.89 -32.91 -2.89 0.00 C
Orbit Corporation 201409 113.96 40.92 15.61 1.00 26.31 44.14 0.80 -18.62 -5.52 -13.10 -12.84 -1.13 0.00 C
Orbit Corporation 201412 113.96 34.05 11.52 1.38 23.91 38.21 0.80 -15.11 -4.80 -10.30 -10.07 -0.88 0.00 C
Orbit Corporation 201503 113.96 27.12 1.62 0.96 26.45 48.38 0.79 -22.73 23.33 -46.07 -45.74 -4.01 0.00 C
Oricon Enterprises 201406 20.51 243.04 0.35 220.52 7.02 29.88 3.62 8.95 17.31 6.34 10.97 6.06 0.56 22.00 C
Oricon Enterprises 201409 20.51 301.02 0.37 276.10 7.92 33.21 3.48 7.77 21.95 7.31 14.64 7.26 0.68 22.00 C
Oricon Enterprises 201412 31.41 268.72 0.37 243.59 9.53 35.03 3.58 9.15 22.31 7.43 14.88 7.47 0.69 22.00 C
Oricon Enterprises 201503 31.41 232.77 1.01 215.99 8.85 26.64 5.21 11.68 66.93 22.56 44.38 22.47 1.41 22.00 C
Orient Green Power Company 201406 568.08 130.73 16.62 62.85 2.74 87.24 73.02 42.38 -28.16 -0.25 -27.91 -26.12 -0.46 0.00 C
Orient Green Power Company 201409 568.08 151.43 20.19 46.06 1.54 127.09 74.22 42.74 10.13 -0.97 11.10 1.97 0.03 0.00 C
Orient Green Power Company 201412 568.08 73.74 9.48 64.50 2.32 21.03 71.28 42.16 -113.39 -0.85 -112.54 -97.82 -1.72 0.00 C
Orient Green Power Company 201503 568.08 79.04 11.34 83.56 1.19 8.00 67.37 52.05 -111.42 2.96 -114.38 -110.99 -1.95 0.00 C
Oriental Veneer Products 201406 5.39 17.68 17.40 0.37 0.65 0.12 0.20 0.34 0.12 0.22 0.22 0.40 0.00 S
Oriental Veneer Products 201409 5.39 22.22 21.87 0.39 0.74 0.09 0.22 0.44 0.12 0.32 0.32 0.58 0.00 S
Oriental Veneer Products 201412 5.39 18.40 17.17 0.45 1.69 0.13 0.26 1.29 0.34 0.95 0.95 1.77 0.00 S
Oriental Veneer Products 201503 5.39 19.07 2.09 17.43 3.73 0.75 0.35 2.64 0.96 1.68 1.68 3.11 0.00 S
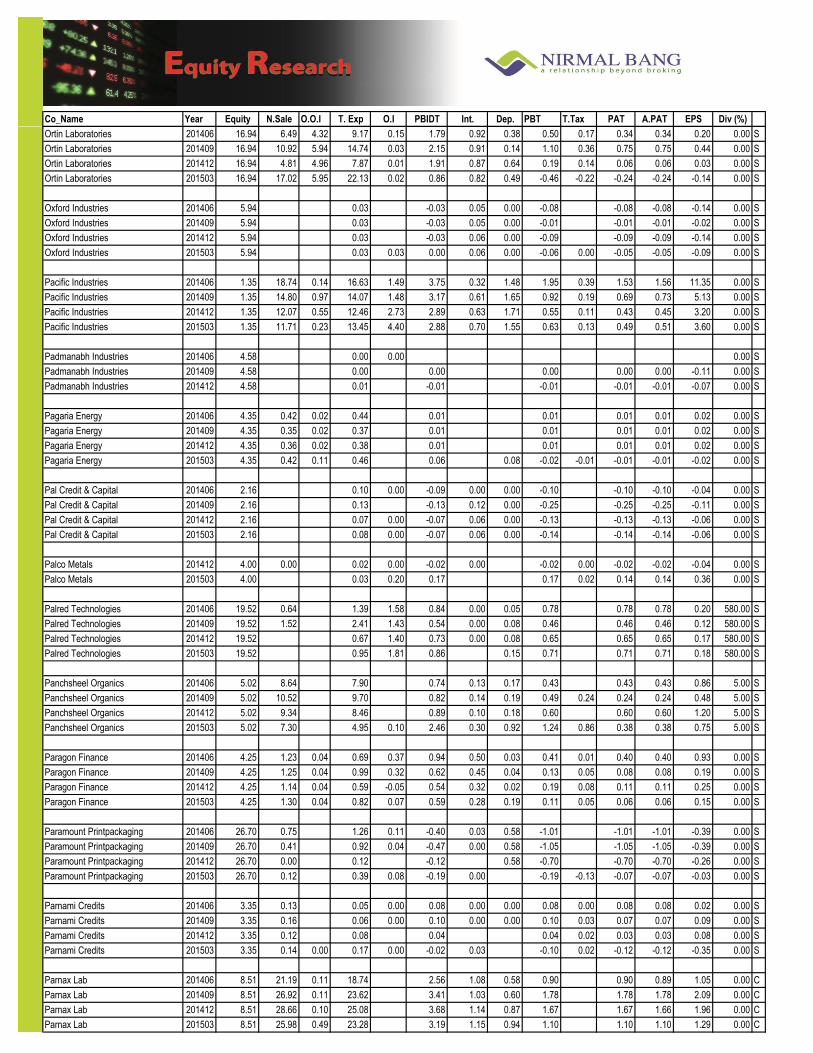
Co_Name Year Equity N.Sale O.O.I T. Exp O.I PBIDT Int. Dep. PBT T.Tax PAT A.PAT EPS Div (%)
Exp
ecte
d R
esu
lts
on
14
Au
gu
st 2
015
Ortin Laboratories 201406 16.94 6.49 4.32 9.17 0.15 1.79 0.92 0.38 0.50 0.17 0.34 0.34 0.20 0.00 S
Ortin Laboratories 201409 16.94 10.92 5.94 14.74 0.03 2.15 0.91 0.14 1.10 0.36 0.75 0.75 0.44 0.00 S
Ortin Laboratories 201412 16.94 4.81 4.96 7.87 0.01 1.91 0.87 0.64 0.19 0.14 0.06 0.06 0.03 0.00 S
Ortin Laboratories 201503 16.94 17.02 5.95 22.13 0.02 0.86 0.82 0.49 -0.46 -0.22 -0.24 -0.24 -0.14 0.00 S
Oxford Industries 201406 5.94 0.03 -0.03 0.05 0.00 -0.08 -0.08 -0.08 -0.14 0.00 S
Oxford Industries 201409 5.94 0.03 -0.03 0.05 0.00 -0.01 -0.01 -0.01 -0.02 0.00 S
Oxford Industries 201412 5.94 0.03 -0.03 0.06 0.00 -0.09 -0.09 -0.09 -0.14 0.00 S
Oxford Industries 201503 5.94 0.03 0.03 0.00 0.06 0.00 -0.06 0.00 -0.05 -0.05 -0.09 0.00 S
Pacific Industries 201406 1.35 18.74 0.14 16.63 1.49 3.75 0.32 1.48 1.95 0.39 1.53 1.56 11.35 0.00 S
Pacific Industries 201409 1.35 14.80 0.97 14.07 1.48 3.17 0.61 1.65 0.92 0.19 0.69 0.73 5.13 0.00 S
Pacific Industries 201412 1.35 12.07 0.55 12.46 2.73 2.89 0.63 1.71 0.55 0.11 0.43 0.45 3.20 0.00 S
Pacific Industries 201503 1.35 11.71 0.23 13.45 4.40 2.88 0.70 1.55 0.63 0.13 0.49 0.51 3.60 0.00 S
Padmanabh Industries 201406 4.58 0.00 0.00 0.00 S
Padmanabh Industries 201409 4.58 0.00 0.00 0.00 0.00 0.00 -0.11 0.00 S
Padmanabh Industries 201412 4.58 0.01 -0.01 -0.01 -0.01 -0.01 -0.07 0.00 S
Pagaria Energy 201406 4.35 0.42 0.02 0.44 0.01 0.01 0.01 0.01 0.02 0.00 S
Pagaria Energy 201409 4.35 0.35 0.02 0.37 0.01 0.01 0.01 0.01 0.02 0.00 S
Pagaria Energy 201412 4.35 0.36 0.02 0.38 0.01 0.01 0.01 0.01 0.02 0.00 S
Pagaria Energy 201503 4.35 0.42 0.11 0.46 0.06 0.08 -0.02 -0.01 -0.01 -0.01 -0.02 0.00 S
Pal Credit & Capital 201406 2.16 0.10 0.00 -0.09 0.00 0.00 -0.10 -0.10 -0.10 -0.04 0.00 S
Pal Credit & Capital 201409 2.16 0.13 -0.13 0.12 0.00 -0.25 -0.25 -0.25 -0.11 0.00 S
Pal Credit & Capital 201412 2.16 0.07 0.00 -0.07 0.06 0.00 -0.13 -0.13 -0.13 -0.06 0.00 S
Pal Credit & Capital 201503 2.16 0.08 0.00 -0.07 0.06 0.00 -0.14 -0.14 -0.14 -0.06 0.00 S
Palco Metals 201412 4.00 0.00 0.02 0.00 -0.02 0.00 -0.02 0.00 -0.02 -0.02 -0.04 0.00 S
Palco Metals 201503 4.00 0.03 0.20 0.17 0.17 0.02 0.14 0.14 0.36 0.00 S
Palred Technologies 201406 19.52 0.64 1.39 1.58 0.84 0.00 0.05 0.78 0.78 0.78 0.20 580.00 S
Palred Technologies 201409 19.52 1.52 2.41 1.43 0.54 0.00 0.08 0.46 0.46 0.46 0.12 580.00 S
Palred Technologies 201412 19.52 0.67 1.40 0.73 0.00 0.08 0.65 0.65 0.65 0.17 580.00 S
Palred Technologies 201503 19.52 0.95 1.81 0.86 0.15 0.71 0.71 0.71 0.18 580.00 S
Panchsheel Organics 201406 5.02 8.64 7.90 0.74 0.13 0.17 0.43 0.43 0.43 0.86 5.00 S
Panchsheel Organics 201409 5.02 10.52 9.70 0.82 0.14 0.19 0.49 0.24 0.24 0.24 0.48 5.00 S
Panchsheel Organics 201412 5.02 9.34 8.46 0.89 0.10 0.18 0.60 0.60 0.60 1.20 5.00 S
Panchsheel Organics 201503 5.02 7.30 4.95 0.10 2.46 0.30 0.92 1.24 0.86 0.38 0.38 0.75 5.00 S
Paragon Finance 201406 4.25 1.23 0.04 0.69 0.37 0.94 0.50 0.03 0.41 0.01 0.40 0.40 0.93 0.00 S
Paragon Finance 201409 4.25 1.25 0.04 0.99 0.32 0.62 0.45 0.04 0.13 0.05 0.08 0.08 0.19 0.00 S
Paragon Finance 201412 4.25 1.14 0.04 0.59 -0.05 0.54 0.32 0.02 0.19 0.08 0.11 0.11 0.25 0.00 S
Paragon Finance 201503 4.25 1.30 0.04 0.82 0.07 0.59 0.28 0.19 0.11 0.05 0.06 0.06 0.15 0.00 S
Paramount Printpackaging 201406 26.70 0.75 1.26 0.11 -0.40 0.03 0.58 -1.01 -1.01 -1.01 -0.39 0.00 S
Paramount Printpackaging 201409 26.70 0.41 0.92 0.04 -0.47 0.00 0.58 -1.05 -1.05 -1.05 -0.39 0.00 S
Paramount Printpackaging 201412 26.70 0.00 0.12 -0.12 0.58 -0.70 -0.70 -0.70 -0.26 0.00 S
Paramount Printpackaging 201503 26.70 0.12 0.39 0.08 -0.19 0.00 -0.19 -0.13 -0.07 -0.07 -0.03 0.00 S
Parnami Credits 201406 3.35 0.13 0.05 0.00 0.08 0.00 0.00 0.08 0.00 0.08 0.08 0.02 0.00 S
Parnami Credits 201409 3.35 0.16 0.06 0.00 0.10 0.00 0.00 0.10 0.03 0.07 0.07 0.09 0.00 S
Parnami Credits 201412 3.35 0.12 0.08 0.04 0.04 0.02 0.03 0.03 0.08 0.00 S
Parnami Credits 201503 3.35 0.14 0.00 0.17 0.00 -0.02 0.03 -0.10 0.02 -0.12 -0.12 -0.35 0.00 S
Parnax Lab 201406 8.51 21.19 0.11 18.74 2.56 1.08 0.58 0.90 0.90 0.89 1.05 0.00 C
Parnax Lab 201409 8.51 26.92 0.11 23.62 3.41 1.03 0.60 1.78 1.78 1.78 2.09 0.00 C
Parnax Lab 201412 8.51 28.66 0.10 25.08 3.68 1.14 0.87 1.67 1.67 1.66 1.96 0.00 C
Parnax Lab 201503 8.51 25.98 0.49 23.28 3.19 1.15 0.94 1.10 1.10 1.10 1.29 0.00 C

Co_Name Year Equity N.Sale O.O.I T. Exp O.I PBIDT Int. Dep. PBT T.Tax PAT A.PAT EPS Div (%)
Exp
ecte
d R
esu
lts
on
14
Au
gu
st 2
015
Parth Aluminium 201406 4.75 0.13 0.16 0.02 -0.01 0.00 -0.01 -0.01 -0.01 -0.02 0.00 S
Parth Aluminium 201409 4.75 0.39 0.42 0.02 -0.01 0.00 -0.02 -0.02 -0.02 -0.04 0.00 S
Parth Aluminium 201412 4.75 0.03 0.03 0.00 0.00 0.00 0.00 0.00 0.00 S
Parth Aluminium 201503 4.75 0.03 0.03 0.04 0.05 0.01 0.04 0.00 0.03 0.03 0.07 0.00 S
Pasupati Spinning & Weaving Mills 201406 9.34 49.86 1.07 47.50 3.43 1.65 1.01 0.77 0.29 0.48 0.48 0.51 0.00 S
Pasupati Spinning & Weaving Mills 201409 9.34 52.03 0.48 49.82 2.69 1.65 1.00 0.04 0.02 0.02 0.02 0.03 0.00 S
Pasupati Spinning & Weaving Mills 201412 9.34 51.38 0.28 48.90 2.76 1.65 1.02 0.09 0.03 0.06 0.06 0.06 0.00 S
Pasupati Spinning & Weaving Mills 201503 9.34 50.82 0.66 49.55 1.93 1.66 1.00 -0.73 -0.28 -0.45 -0.45 -0.40 0.00 S
Patels Airtemp (India) 201406 5.07 15.65 0.48 13.75 0.09 2.47 0.35 0.60 1.52 0.49 1.03 1.03 2.03 20.00 S
Patels Airtemp (India) 201409 5.07 21.84 0.73 19.49 0.11 3.18 0.27 0.61 2.30 0.74 1.56 1.56 3.07 20.00 S
Patels Airtemp (India) 201412 5.07 33.07 2.77 31.40 0.06 4.49 0.92 0.68 2.89 0.94 1.95 1.95 3.85 20.00 S
Patels Airtemp (India) 201503 5.07 37.27 0.94 33.74 0.17 4.64 1.14 0.60 2.90 1.24 1.66 1.66 3.28 20.00 S
Pawansut Holdings 201406 11.31 0.36 0.25 0.11 0.01 0.10 0.10 0.10 0.09 0.00 S
Pawansut Holdings 201409 11.31 0.37 0.29 0.08 0.01 0.07 0.07 0.07 0.06 0.00 S
Pawansut Holdings 201412 11.31 0.31 0.28 0.03 0.01 0.02 0.02 0.02 0.02 0.00 S
Pawansut Holdings 201503 11.31 0.63 0.03 0.72 -0.06 0.05 -0.11 0.05 -0.16 -0.16 -0.14 0.00 S
PBA Infrastructure 201406 13.50 70.34 0.35 63.20 7.49 6.17 2.15 -0.84 -0.84 -0.84 -0.06 0.00 S
PBA Infrastructure 201409 13.50 30.03 1.19 24.85 6.37 7.08 2.15 -2.85 -2.85 -2.85 -0.21 0.00 S
PBA Infrastructure 201412 13.50 21.04 1.93 15.43 7.54 7.80 1.99 -2.26 -2.26 -2.26 -0.17 0.00 S
PBA Infrastructure 201503 13.50 49.16 0.35 47.17 2.35 16.78 -1.46 -12.97 -0.04 -12.92 -12.92 -0.96 0.00 S
PDS Multinational Fashions 201412 26.05 917.82 3.22 914.80 8.21 14.44 3.69 3.87 6.84 2.22 4.62 3.83 1.47 0.00 C
PDS Multinational Fashions 201503 26.05 1093.98 12.17 1068.92 -6.09 31.15 6.94 3.36 20.44 2.74 17.70 12.88 4.95 0.00 C
Pearl Agriculture 201406 21.68 0.20 0.06 0.14 0.14 0.04 0.10 0.10 0.04 0.00 S
Pearl Agriculture 201409 21.68 0.25 0.05 0.20 0.20 0.06 0.14 0.14 0.01 0.00 S
Pearl Agriculture 201412 21.68 0.24 0.08 0.16 0.16 0.05 0.11 0.11 0.01 0.00 S
Pearl Agriculture 201503 21.68 0.27 0.09 0.18 0.08 0.00 0.10 0.03 0.07 0.07 -0.01 0.00 S
Pearl Electronics 201406 19.77 0.28 0.06 0.22 0.22 0.07 0.15 0.15 0.08 0.00 S
Pearl Electronics 201409 19.77 0.41 0.27 0.47 0.21 0.21 0.07 0.15 0.15 0.01 0.00 S
Pearl Electronics 201412 19.77 0.16 0.13 0.02 0.02 0.01 0.02 0.02 0.01 0.00 S
Pearl Electronics 201503 19.77 0.58 0.16 0.41 0.41 0.13 0.28 0.28 0.01 0.00 S
Perfect-Octave Media Projects 201406 34.01 3.05 3.06 0.00 0.66 -0.67 -0.67 -0.67 0.00 S
Perfect-Octave Media Projects 201409 34.01 0.35 0.04 0.78 -0.39 0.71 -1.09 -1.09 -1.09 -0.03 0.00 S
Perfect-Octave Media Projects 201412 34.01 0.02 0.79 -0.77 0.81 -1.58 -1.58 -1.58 -0.05 0.00 S
Perfect-Octave Media Projects 201503 34.70 0.02 0.63 -0.61 2.66 -3.27 -3.27 -3.27 -0.09 0.00 S
Phaarmasia 201406 6.83 2.94 2.76 0.18 0.00 0.08 0.10 0.03 0.07 0.07 0.09 0.00 S
Phaarmasia 201409 6.83 2.82 2.63 0.19 0.01 0.10 0.09 0.03 0.06 0.06 0.09 0.00 S
Phaarmasia 201412 6.83 3.02 2.80 0.22 0.00 0.19 0.03 0.03 0.03 0.04 0.00 S
Phaarmasia 201503 6.83 3.53 0.07 3.22 0.38 0.02 0.30 0.19 0.16 0.03 0.03 0.05 0.00 S
Pharmaids Pharmaceuticals 201406 3.36 0.45 0.49 0.08 0.04 0.02 0.02 0.02 0.02 0.05 0.00 S
Pharmaids Pharmaceuticals 201409 3.36 0.45 0.46 0.05 0.04 0.02 0.02 0.02 0.02 0.07 0.00 S
Pharmaids Pharmaceuticals 201412 3.36 0.51 0.47 0.04 0.02 0.02 0.02 0.02 0.05 0.00 S
Pharmaids Pharmaceuticals 201503 3.36 0.32 0.40 -0.08 0.00 0.09 -0.16 -0.16 -0.16 -0.48 0.00 S
Photoquip (India) 201406 4.80 25.74 0.17 25.64 0.04 0.30 0.47 0.48 -0.65 -0.17 -0.49 -0.49 -1.02 0.00 S
Photoquip (India) 201409 4.80 24.14 0.05 23.34 0.02 0.87 0.45 0.51 -0.09 -0.12 0.03 0.03 0.06 0.00 S
Photoquip (India) 201412 4.80 23.91 0.09 23.75 0.00 0.26 0.43 0.51 0.89 -0.30 1.19 1.19 2.48 0.00 S
Photoquip (India) 201503 4.80 26.96 0.09 30.91 0.32 -3.54 0.65 0.37 -4.57 -0.88 -3.69 -3.69 -7.69 0.00 S
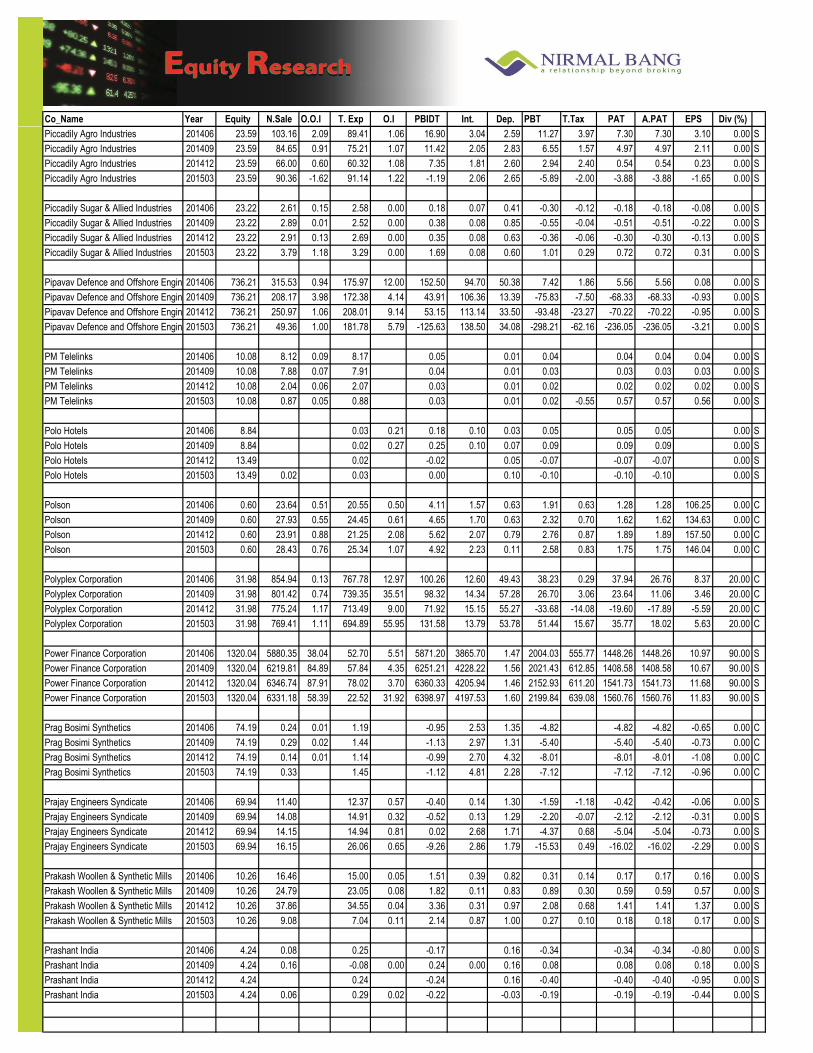
Co_Name Year Equity N.Sale O.O.I T. Exp O.I PBIDT Int. Dep. PBT T.Tax PAT A.PAT EPS Div (%)
Exp
ecte
d R
esu
lts
on
14
Au
gu
st 2
015
Piccadily Agro Industries 201406 23.59 103.16 2.09 89.41 1.06 16.90 3.04 2.59 11.27 3.97 7.30 7.30 3.10 0.00 S
Piccadily Agro Industries 201409 23.59 84.65 0.91 75.21 1.07 11.42 2.05 2.83 6.55 1.57 4.97 4.97 2.11 0.00 S
Piccadily Agro Industries 201412 23.59 66.00 0.60 60.32 1.08 7.35 1.81 2.60 2.94 2.40 0.54 0.54 0.23 0.00 S
Piccadily Agro Industries 201503 23.59 90.36 -1.62 91.14 1.22 -1.19 2.06 2.65 -5.89 -2.00 -3.88 -3.88 -1.65 0.00 S
Piccadily Sugar & Allied Industries 201406 23.22 2.61 0.15 2.58 0.00 0.18 0.07 0.41 -0.30 -0.12 -0.18 -0.18 -0.08 0.00 S
Piccadily Sugar & Allied Industries 201409 23.22 2.89 0.01 2.52 0.00 0.38 0.08 0.85 -0.55 -0.04 -0.51 -0.51 -0.22 0.00 S
Piccadily Sugar & Allied Industries 201412 23.22 2.91 0.13 2.69 0.00 0.35 0.08 0.63 -0.36 -0.06 -0.30 -0.30 -0.13 0.00 S
Piccadily Sugar & Allied Industries 201503 23.22 3.79 1.18 3.29 0.00 1.69 0.08 0.60 1.01 0.29 0.72 0.72 0.31 0.00 S
Pipavav Defence and Offshore Engineering Company201406 736.21 315.53 0.94 175.97 12.00 152.50 94.70 50.38 7.42 1.86 5.56 5.56 0.08 0.00 S
Pipavav Defence and Offshore Engineering Company201409 736.21 208.17 3.98 172.38 4.14 43.91 106.36 13.39 -75.83 -7.50 -68.33 -68.33 -0.93 0.00 S
Pipavav Defence and Offshore Engineering Company201412 736.21 250.97 1.06 208.01 9.14 53.15 113.14 33.50 -93.48 -23.27 -70.22 -70.22 -0.95 0.00 S
Pipavav Defence and Offshore Engineering Company201503 736.21 49.36 1.00 181.78 5.79 -125.63 138.50 34.08 -298.21 -62.16 -236.05 -236.05 -3.21 0.00 S
PM Telelinks 201406 10.08 8.12 0.09 8.17 0.05 0.01 0.04 0.04 0.04 0.04 0.00 S
PM Telelinks 201409 10.08 7.88 0.07 7.91 0.04 0.01 0.03 0.03 0.03 0.03 0.00 S
PM Telelinks 201412 10.08 2.04 0.06 2.07 0.03 0.01 0.02 0.02 0.02 0.02 0.00 S
PM Telelinks 201503 10.08 0.87 0.05 0.88 0.03 0.01 0.02 -0.55 0.57 0.57 0.56 0.00 S
Polo Hotels 201406 8.84 0.03 0.21 0.18 0.10 0.03 0.05 0.05 0.05 0.00 S
Polo Hotels 201409 8.84 0.02 0.27 0.25 0.10 0.07 0.09 0.09 0.09 0.00 S
Polo Hotels 201412 13.49 0.02 -0.02 0.05 -0.07 -0.07 -0.07 0.00 S
Polo Hotels 201503 13.49 0.02 0.03 0.00 0.10 -0.10 -0.10 -0.10 0.00 S
Polson 201406 0.60 23.64 0.51 20.55 0.50 4.11 1.57 0.63 1.91 0.63 1.28 1.28 106.25 0.00 C
Polson 201409 0.60 27.93 0.55 24.45 0.61 4.65 1.70 0.63 2.32 0.70 1.62 1.62 134.63 0.00 C
Polson 201412 0.60 23.91 0.88 21.25 2.08 5.62 2.07 0.79 2.76 0.87 1.89 1.89 157.50 0.00 C
Polson 201503 0.60 28.43 0.76 25.34 1.07 4.92 2.23 0.11 2.58 0.83 1.75 1.75 146.04 0.00 C
Polyplex Corporation 201406 31.98 854.94 0.13 767.78 12.97 100.26 12.60 49.43 38.23 0.29 37.94 26.76 8.37 20.00 C
Polyplex Corporation 201409 31.98 801.42 0.74 739.35 35.51 98.32 14.34 57.28 26.70 3.06 23.64 11.06 3.46 20.00 C
Polyplex Corporation 201412 31.98 775.24 1.17 713.49 9.00 71.92 15.15 55.27 -33.68 -14.08 -19.60 -17.89 -5.59 20.00 C
Polyplex Corporation 201503 31.98 769.41 1.11 694.89 55.95 131.58 13.79 53.78 51.44 15.67 35.77 18.02 5.63 20.00 C
Power Finance Corporation 201406 1320.04 5880.35 38.04 52.70 5.51 5871.20 3865.70 1.47 2004.03 555.77 1448.26 1448.26 10.97 90.00 S
Power Finance Corporation 201409 1320.04 6219.81 84.89 57.84 4.35 6251.21 4228.22 1.56 2021.43 612.85 1408.58 1408.58 10.67 90.00 S
Power Finance Corporation 201412 1320.04 6346.74 87.91 78.02 3.70 6360.33 4205.94 1.46 2152.93 611.20 1541.73 1541.73 11.68 90.00 S
Power Finance Corporation 201503 1320.04 6331.18 58.39 22.52 31.92 6398.97 4197.53 1.60 2199.84 639.08 1560.76 1560.76 11.83 90.00 S
Prag Bosimi Synthetics 201406 74.19 0.24 0.01 1.19 -0.95 2.53 1.35 -4.82 -4.82 -4.82 -0.65 0.00 C
Prag Bosimi Synthetics 201409 74.19 0.29 0.02 1.44 -1.13 2.97 1.31 -5.40 -5.40 -5.40 -0.73 0.00 C
Prag Bosimi Synthetics 201412 74.19 0.14 0.01 1.14 -0.99 2.70 4.32 -8.01 -8.01 -8.01 -1.08 0.00 C
Prag Bosimi Synthetics 201503 74.19 0.33 1.45 -1.12 4.81 2.28 -7.12 -7.12 -7.12 -0.96 0.00 C
Prajay Engineers Syndicate 201406 69.94 11.40 12.37 0.57 -0.40 0.14 1.30 -1.59 -1.18 -0.42 -0.42 -0.06 0.00 S
Prajay Engineers Syndicate 201409 69.94 14.08 14.91 0.32 -0.52 0.13 1.29 -2.20 -0.07 -2.12 -2.12 -0.31 0.00 S
Prajay Engineers Syndicate 201412 69.94 14.15 14.94 0.81 0.02 2.68 1.71 -4.37 0.68 -5.04 -5.04 -0.73 0.00 S
Prajay Engineers Syndicate 201503 69.94 16.15 26.06 0.65 -9.26 2.86 1.79 -15.53 0.49 -16.02 -16.02 -2.29 0.00 S
Prakash Woollen & Synthetic Mills 201406 10.26 16.46 15.00 0.05 1.51 0.39 0.82 0.31 0.14 0.17 0.17 0.16 0.00 S
Prakash Woollen & Synthetic Mills 201409 10.26 24.79 23.05 0.08 1.82 0.11 0.83 0.89 0.30 0.59 0.59 0.57 0.00 S
Prakash Woollen & Synthetic Mills 201412 10.26 37.86 34.55 0.04 3.36 0.31 0.97 2.08 0.68 1.41 1.41 1.37 0.00 S
Prakash Woollen & Synthetic Mills 201503 10.26 9.08 7.04 0.11 2.14 0.87 1.00 0.27 0.10 0.18 0.18 0.17 0.00 S
Prashant India 201406 4.24 0.08 0.25 -0.17 0.16 -0.34 -0.34 -0.34 -0.80 0.00 S
Prashant India 201409 4.24 0.16 -0.08 0.00 0.24 0.00 0.16 0.08 0.08 0.08 0.18 0.00 S
Prashant India 201412 4.24 0.24 -0.24 0.16 -0.40 -0.40 -0.40 -0.95 0.00 S
Prashant India 201503 4.24 0.06 0.29 0.02 -0.22 -0.03 -0.19 -0.19 -0.19 -0.44 0.00 S

Co_Name Year Equity N.Sale O.O.I T. Exp O.I PBIDT Int. Dep. PBT T.Tax PAT A.PAT EPS Div (%)
Exp
ecte
d R
esu
lts
on
14
Au
gu
st 2
015
Pratiksha Chemicals 201406 5.57 2.65 2.48 0.00 0.18 0.07 0.08 0.03 0.03 0.03 0.05 0.00 S
Pratiksha Chemicals 201409 5.57 2.56 2.39 0.17 0.06 0.08 0.02 0.02 0.02 0.04 0.00 S
Pratiksha Chemicals 201412 5.57 3.19 0.01 3.05 0.00 0.15 0.05 0.08 0.02 0.02 0.02 0.04 0.00 S
Pratiksha Chemicals 201503 5.57 1.76 0.01 2.03 0.00 -0.26 0.04 0.09 -0.39 -0.39 -0.39 -0.03 0.00 S
Precious Trading & Investments 201406 0.24 0.00 0.00 0.00 0.00 0.00 -0.16 0.00 S
Precious Trading & Investments 201409 0.24 0.01 -0.01 -0.01 -0.01 -0.01 -0.24 0.00 S
Precious Trading & Investments 201412 0.24 0.01 -0.01 -0.01 -0.01 -0.01 -0.21 0.00 S
Precious Trading & Investments 201503 0.24 0.01 -0.01 -0.01 -0.01 -0.01 -1.38 0.00 S
Precision Electronics 201406 13.85 6.49 0.00 6.61 0.03 -0.09 0.20 0.46 -0.75 0.65 -1.40 -1.40 -1.01 0.00 S
Precision Electronics 201409 13.85 7.46 6.50 0.06 1.02 0.24 0.37 0.41 0.01 0.40 0.40 0.29 0.00 S
Precision Electronics 201412 13.85 5.46 5.83 0.09 -0.28 0.19 0.34 -0.81 -0.25 -0.56 -0.56 -0.40 0.00 S
Precision Electronics 201503 13.85 8.10 6.19 0.03 1.94 0.19 0.38 1.36 -0.45 1.81 1.81 1.31 0.00 S
Prime Capital Market 201406 10.00 0.15 0.03 0.00 0.12 0.00 0.12 0.00 0.12 0.12 0.12 0.00 S
Prime Capital Market 201409 10.00 0.14 0.03 0.00 0.11 0.00 0.11 0.00 0.11 0.11 0.11 0.00 S
Prime Capital Market 201412 10.00 0.13 0.03 0.11 0.11 0.11 0.11 0.11 0.00 S
Prime Capital Market 201503 10.00 0.26 0.05 0.22 0.22 0.10 0.11 0.11 0.11 0.00 S
Prime Property Development Corporation201406 10.00 22.59 11.12 0.70 12.17 0.04 12.13 5.40 6.73 6.73 3.36 0.00 S
Prime Property Development Corporation201409 8.49 2.58 2.02 0.87 1.43 0.04 1.39 0.04 1.35 1.35 0.78 0.00 S
Prime Property Development Corporation201412 8.49 0.77 0.89 0.12 0.04 0.08 0.08 0.08 0.05 0.00 S
Prime Property Development Corporation201503 8.49 6.43 0.87 -5.56 0.04 -5.60 -1.54 -4.06 -4.06 -2.39 0.00 S
Prism Medico and Pharmacy 201406 1.99 0.01 -0.01 0.00 -0.01 -0.01 -0.01 -0.03 0.00 S
Prism Medico and Pharmacy 201409 1.99 0.01 -0.01 0.00 -0.01 -0.01 -0.01 -0.04 0.00 S
Prism Medico and Pharmacy 201412 1.99 0.04 0.03 0.02 0.00 0.01 0.01 0.01 0.07 0.00 S
Prism Medico and Pharmacy 201503 1.99 0.02 0.02 0.00 0.01 -0.01 -0.01 -0.01 -0.04 0.00 S
Professional Diamonds 201406 2.00 0.04 0.01 -0.03 0.00 -0.04 -0.04 -0.04 -0.18 0.00 S
Professional Diamonds 201409 2.00 0.07 0.00 -0.07 0.00 -0.07 -0.07 -0.07 -0.35 0.00 S
Professional Diamonds 201412 2.00 0.03 0.00 -0.03 0.00 -0.04 -0.04 -0.04 -0.17 0.00 S
Professional Diamonds 201503 2.00 0.01 0.01 -0.01 0.00 0.03 -0.03 -0.03 -0.17 0.00 S
Proto Developers & Technologies 201406 39.53 45.43 45.27 0.16 0.13 0.03 0.01 0.02 0.02 0.00 S
Proto Developers & Technologies 201409 39.53 52.16 52.00 0.16 0.12 0.04 0.02 0.02 0.02 0.00 S
Proto Developers & Technologies 201412 39.53 58.15 58.00 0.16 0.12 0.04 0.02 0.02 0.02 0.00 S
Proto Developers & Technologies 201503 39.53 62.57 62.41 0.01 0.16 0.12 0.05 0.03 0.02 0.02 0.00 S
Punj Lloyd 201406 66.42 1107.47 6.36 1365.99 8.74 -243.42 215.39 79.79 -538.60 -174.68 -363.92 -363.92 -10.96 0.00 S
Punj Lloyd 201409 66.42 1261.78 11.47 1379.80 17.32 -89.23 212.68 88.64 -390.55 -127.04 -263.51 -263.51 -7.93 0.00 S
Punj Lloyd 201412 66.42 1263.52 131.50 1319.50 23.70 99.22 242.91 74.04 -217.73 -69.97 -147.76 -147.76 -4.45 0.00 S
Punj Lloyd 201503 66.42 1248.74 41.17 1065.34 569.63 794.20 188.56 71.27 534.37 265.84 268.53 268.53 8.09 0.00 S
Puravankara Projects 201406 118.58 458.11 3.51 324.52 11.95 149.05 62.02 3.58 83.45 24.91 58.54 58.25 2.46 38.40 C
Puravankara Projects 201409 118.58 425.34 3.86 336.21 0.13 93.12 49.42 3.51 40.19 14.54 25.65 21.40 0.90 38.40 C
Puravankara Projects 201412 118.58 374.54 3.51 308.20 0.50 70.35 56.37 3.91 10.07 -25.43 33.03 32.63 1.38 38.40 C
Puravankara Projects 201503 118.58 405.97 3.12 321.21 0.32 88.20 55.16 3.60 29.44 10.19 20.35 20.45 0.86 38.40 C
Purshottam Investofin 201406 6.28 0.32 0.03 0.00 0.29 0.06 0.23 0.05 0.18 0.18 0.28 0.00 S
Purshottam Investofin 201409 6.28 0.29 0.03 0.26 0.38 -0.12 -0.12 -0.12 0.28 0.00 S
Purshottam Investofin 201412 6.28 0.19 0.06 0.13 0.19 -0.06 -0.06 -0.06 -0.01 0.00 S
Purshottam Investofin 201503 6.28 0.72 0.08 0.31 0.49 0.49 -0.01 0.02 -0.03 -0.03 -0.04 0.00 S
Quasar India 201406 5.35 0.06 0.10 -0.05 0.00 -0.05 -0.05 -0.05 0.00 S
Quasar India 201409 5.35 2.01 0.07 1.99 0.08 0.00 0.08 0.08 0.08 0.00 S
Quasar India 201412 5.35 8.21 0.07 8.15 0.13 0.00 0.13 0.13 0.13 0.24 0.00 S
Quasar India 201503 5.35 0.07 0.12 -0.04 0.00 -0.05 0.02 -0.07 -0.07 -0.01 0.00 S

Co_Name Year Equity N.Sale O.O.I T. Exp O.I PBIDT Int. Dep. PBT T.Tax PAT A.PAT EPS Div (%)
Exp
ecte
d R
esu
lts
on
14
Au
gu
st 2
015
Radaan Mediaworks India 201406 10.83 8.60 0.01 7.98 0.64 0.22 0.17 0.24 0.24 0.24 0.04 0.00 S
Radaan Mediaworks India 201409 10.83 7.93 0.03 7.34 0.63 0.25 0.17 0.20 0.20 0.20 0.04 0.00 S
Radaan Mediaworks India 201412 10.83 8.60 0.02 7.95 0.67 0.31 0.15 0.21 0.21 0.21 0.04 0.00 S
Radaan Mediaworks India 201503 10.83 10.41 0.03 9.48 0.96 0.30 0.15 0.50 0.02 0.48 0.48 0.09 0.00 S
Radha Madhav Corporation 201406 55.04 3.97 6.81 0.13 -2.71 0.01 1.32 -4.72 -4.72 -4.72 -1.14 0.00 S
Radha Madhav Corporation 201409 62.84 8.84 9.34 0.22 -0.27 1.28 0.43 0.00 0.42 0.42 0.07 0.00 S
Radha Madhav Corporation 201412 62.84 41.12 38.50 0.16 2.78 1.27 103.34 0.00 103.34 103.34 16.44 0.00 S
Radha Madhav Corporation 201503 62.84 57.98 51.73 0.26 6.51 -2.03 13.06 -6.25 19.31 19.31 3.07 0.00 S
Radhe Developers (India) 201406 25.18 0.31 0.00 -0.30 0.05 0.09 -0.44 -0.44 -0.44 -0.18 0.00 S
Radhe Developers (India) 201409 25.18 0.15 0.67 0.00 -0.52 0.05 0.08 -0.65 -0.65 -0.65 -0.26 0.00 S
Radhe Developers (India) 201412 25.18 0.15 1.37 0.01 -1.21 0.05 0.08 -1.34 0.00 -1.34 -1.34 -0.53 0.00 S
Radhe Developers (India) 201503 25.18 -1.29 0.01 1.30 0.04 0.03 1.23 -0.04 1.27 1.27 0.05 0.00 S
Raghunath International 201406 5.00 0.12 0.10 -0.02 0.02 0.01 -0.05 -0.02 -0.04 -0.04 0.07 0.00 S
Raghunath International 201409 5.00 2.29 1.99 0.10 0.39 0.01 0.38 0.10 0.28 0.28 0.01 0.00 S
Raghunath International 201412 5.00 0.13 0.09 -0.04 0.01 -0.05 -0.03 -0.03 -0.03 0.43 0.00 S
Raghunath International 201503 5.00 -0.07 0.31 0.37 0.04 0.33 0.02 0.32 0.32 0.00 S
Rai Saheb Rekhchand Mohota Spinning & Weaving Mills201406 12.51 47.76 44.16 3.60 2.37 1.05 0.18 0.18 0.18 0.14 1.05 S
Rai Saheb Rekhchand Mohota Spinning & Weaving Mills201409 12.51 66.82 63.02 0.29 4.09 2.69 1.06 0.34 0.34 0.34 0.27 1.05 S
Rai Saheb Rekhchand Mohota Spinning & Weaving Mills201412 12.51 69.48 63.90 0.37 5.95 4.13 1.03 0.79 0.79 0.79 0.63 1.05 S
Rai Saheb Rekhchand Mohota Spinning & Weaving Mills201503 14.59 134.56 131.38 -0.02 3.16 1.33 0.11 1.72 0.88 0.84 0.84 0.38 1.05 S
Rain Industries 201406 67.27 3089.75 65.03 2775.65 28.60 407.73 148.19 85.53 174.01 48.89 125.12 123.51 3.67 50.00 C
Rain Industries 201409 67.27 2969.71 62.40 2670.44 27.28 388.95 148.92 84.83 155.20 46.38 108.82 114.66 3.41 50.00 C
Rain Industries 201412 67.27 2589.90 21.38 2474.62 18.76 155.42 148.22 87.75 -338.29 -122.47 -215.82 -199.71 -5.94 50.00 C
Rain Industries 201503 67.27 2528.92 10.05 2225.48 53.08 366.57 143.14 79.29 144.14 57.94 86.20 84.33 2.51 50.00 C
Rainbow Foundations 201406 5.51 2.32 0.01 1.82 0.70 1.20 1.14 0.02 0.05 0.05 0.05 0.09 0.00 S
Rainbow Foundations 201409 5.51 1.64 0.01 0.90 0.85 1.60 1.45 0.01 0.14 0.01 0.13 0.13 0.24 0.00 S
Rainbow Foundations 201412 5.51 1.24 0.01 0.96 0.69 0.97 0.85 0.00 0.12 0.12 0.12 0.22 0.00 S
Rainbow Foundations 201503 5.51 26.09 0.01 23.04 0.29 3.36 2.61 0.02 0.73 0.36 0.36 0.36 0.69 0.00 S
Raj Oil Mills 201406 71.01 13.99 17.82 -3.83 0.17 1.09 -5.09 -5.09 -5.09 -0.72 0.00 S
Raj Oil Mills 201409 79.01 14.42 13.53 0.89 0.07 1.09 -0.27 -0.27 -0.27 -0.03 0.00 S
Raj Oil Mills 201412 71.01 17.55 16.49 1.06 0.13 1.09 -0.16 -0.16 -0.16 0.00 S
Raj Oil Mills 201503 74.91 16.67 16.03 0.03 0.66 0.37 2.36 -2.07 0.92 -2.98 -2.98 -0.04 0.00 S
Raj Rayon Industries 201406 26.65 10.67 0.01 14.06 6.12 2.74 15.84 9.30 -22.40 -7.09 -15.32 -15.32 -0.57 0.00 S
Raj Rayon Industries 201409 26.65 9.33 0.01 7.20 0.31 2.45 16.22 9.31 -23.08 -7.12 -15.95 -15.95 -0.60 0.00 S
Raj Rayon Industries 201412 26.65 69.44 0.11 70.20 0.73 0.08 18.79 11.48 -30.19 -9.37 -20.82 -20.82 -0.78 0.00 S
Raj Rayon Industries 201503 26.65 93.76 0.25 94.58 0.96 0.39 20.25 12.32 -32.18 -9.40 -22.78 -22.78 -0.85 0.00 S
Raja Bahadur International 201406 2.50 23.06 19.45 0.02 3.62 0.12 0.03 3.47 0.62 2.85 2.85 114.18 0.00 S
Raja Bahadur International 201409 2.50 5.46 4.91 0.00 0.55 0.14 0.03 0.39 0.06 0.33 0.33 13.21 0.00 S
Raja Bahadur International 201412 2.50 3.74 4.00 0.00 -0.26 0.17 0.03 -0.46 -0.12 -0.33 -0.33 -13.36 0.00 S
Raja Bahadur International 201503 2.50 6.21 6.68 0.03 -0.44 0.20 0.11 -0.74 -0.21 -0.53 -0.53 -21.21 0.00 S
Rajesh Solvex 201406 5.50 0.03 1.96 1.52 0.01 0.48 0.19 0.04 0.25 0.25 0.25 0.44 0.00 S
Rajesh Solvex 201409 5.50 1.66 1.33 0.33 0.20 0.04 0.09 0.09 0.09 0.17 0.00 S
Rajesh Solvex 201412 5.50 1.96 1.42 0.00 0.54 0.20 0.04 0.30 0.30 0.30 0.50 0.00 S
Rajesh Solvex 201503 5.50 1.96 1.46 0.02 0.52 0.18 0.03 0.31 0.18 0.13 0.13 0.23 0.00 S
Rajlaxmi Industries 201406 31.00 3.04 3.08 0.26 0.22 0.22 0.04 0.18 0.18 0.06 0.00 S
Rajlaxmi Industries 201409 31.00 2.03 2.08 0.25 0.20 0.20 0.04 0.16 0.16 0.05 0.00 S
Rajlaxmi Industries 201412 31.00 5.02 5.13 0.22 0.12 0.12 0.06 0.06 0.06 0.02 0.00 S
Rajlaxmi Industries 201503 31.00 8.37 9.02 0.70 0.05 0.05 0.05 0.05 0.00 S

Co_Name Year Equity N.Sale O.O.I T. Exp O.I PBIDT Int. Dep. PBT T.Tax PAT A.PAT EPS Div (%)
Exp
ecte
d R
esu
lts
on
14
Au
gu
st 2
015
Rajoo Engineers 201406 5.80 20.21 0.07 18.95 0.13 1.45 0.00 0.53 0.92 0.30 0.62 0.62 0.11 20.00 S
Rajoo Engineers 201409 5.80 25.36 0.21 22.44 0.01 3.14 0.05 0.57 2.51 0.82 1.70 1.70 0.29 20.00 S
Rajoo Engineers 201412 5.80 26.84 0.16 23.81 0.00 3.19 0.10 0.57 2.52 0.82 1.70 1.70 0.29 20.00 S
Rajoo Engineers 201503 5.80 42.96 1.13 41.19 0.12 3.01 0.06 1.17 1.78 0.57 1.22 1.22 0.21 20.00 S
Rajvir Industries 201406 3.04 27.27 0.43 22.77 0.30 5.22 5.68 2.64 -3.10 -1.03 -2.07 -2.07 -6.82 0.00 S
Rajvir Industries 201409 3.04 25.66 0.50 22.50 0.18 3.84 4.61 2.45 -3.22 -1.16 -2.06 -2.06 -6.80 0.00 S
Rajvir Industries 201412 3.04 21.72 0.49 18.61 0.33 3.93 5.29 2.55 -3.91 -0.98 -2.94 -2.94 -9.67 0.00 S
Rajvir Industries 201503 3.04 25.31 0.30 24.08 0.39 1.92 5.60 2.55 -6.23 -1.65 -4.58 -4.58 -15.08 0.00 S
Ram Info 201406 6.28 2.42 2.07 0.01 0.36 0.01 0.09 0.25 0.25 0.25 0.40 0.00 S
Ram Info 201409 6.28 3.13 2.55 0.04 0.61 0.01 0.20 0.41 0.41 0.41 0.65 0.00 S
Ram Info 201412 6.28 2.99 2.39 0.01 0.61 0.01 0.16 0.44 0.44 0.44 0.70 0.00 S
Ram Info 201503 6.28 4.33 4.36 0.03 -0.01 0.01 0.05 0.07 0.07 0.07 0.11 0.00 S
Ramsons Projects 201406 3.01 0.03 0.03 -0.01 -0.01 -0.01 -0.01 -0.02 0.00 S
Ramsons Projects 201409 3.01 0.01 -0.03 0.04 0.04 0.04 0.04 0.14 0.00 S
Ramsons Projects 201412 3.01 0.01 0.02 0.00 0.00 0.00 0.00 -0.01 0.00 S
Ramsons Projects 201503 3.01 0.01 0.03 -0.03 -0.03 -0.03 -0.03 -0.09 0.00 S
Ranjit Securities 201406 2.69 0.05 0.02 0.01 0.04 0.00 0.04 0.01 0.03 0.03 0.00 S
Ranjit Securities 201409 2.69 0.14 0.03 0.11 0.00 0.10 0.03 0.07 0.07 0.00 S
Ranjit Securities 201412 2.69 0.08 0.09 0.02 0.01 0.01 0.01 0.00 0.00 0.00 0.01 0.00 S
Ranjit Securities 201503 2.69 0.00 0.57 0.12 -0.45 -0.01 -0.44 -0.05 -0.39 -0.39 0.00 S
Rap Media 201406 5.88 0.46 0.27 0.00 0.19 0.09 0.10 0.10 0.10 0.18 0.00 S
Rap Media 201409 5.88 0.46 0.25 0.00 0.21 0.09 0.12 0.12 0.12 0.21 0.00 S
Rap Media 201412 5.88 0.46 0.26 0.00 0.20 0.09 0.11 0.11 0.11 0.19 0.00 S
Rap Media 201503 5.88 0.46 0.92 0.01 -0.46 0.14 -0.60 -0.03 -0.57 -0.57 -0.97 0.00 S
Rashel Agrotech 201406 9.59 0.52 0.52 0.00 0.00 0.00 0.00 0.00 0.00 0.00 0.00 S
Rashel Agrotech 201412 9.59 0.39 0.39 0.00 0.00 0.00 0.00 0.00 S
Rashel Agrotech 201503 9.59 0.06 0.07 0.01 0.00 0.00 0.00 0.00 0.00 0.00 S
Rathi Steel & Power 201406 31.31 101.78 102.73 0.12 -0.84 12.52 2.66 -16.01 -16.01 -16.01 -5.11 0.00 S
Rathi Steel & Power 201409 31.31 168.84 168.01 0.01 0.84 13.98 2.66 -15.80 -15.80 -15.80 -5.04 0.00 S
Rathi Steel & Power 201412 31.31 199.42 196.33 0.29 3.38 15.64 2.66 -14.93 -15.20 0.28 0.28 0.09 0.00 S
Ravindra Energy 201406 113.55 202.64 198.81 4.63 8.45 5.50 1.01 1.95 0.06 1.89 1.89 0.17 0.00 C
Ravindra Energy 201409 113.55 27.32 23.55 6.50 10.26 7.32 0.57 2.37 0.53 1.84 1.84 0.16 0.00 C
Ravindra Energy 201412 114.28 165.60 162.84 0.18 2.95 1.77 0.59 0.59 -0.10 0.69 0.69 0.06 0.00 C
Ravindra Energy 201503 114.28 159.61 0.00 155.11 3.00 7.49 3.78 0.64 3.08 -0.29 3.37 3.37 0.00 C
RDB Rasayans 201406 17.72 18.88 17.43 0.17 1.63 0.30 0.13 1.19 0.21 0.98 0.98 0.55 5.00 S
RDB Rasayans 201409 17.72 18.68 17.43 0.66 1.90 0.33 0.32 1.26 0.29 0.96 0.96 0.54 5.00 S
RDB Rasayans 201412 17.72 15.98 15.27 6.93 7.64 0.33 0.23 7.07 2.38 4.70 4.70 2.65 5.00 S
RDB Rasayans 201503 17.72 13.99 0.34 15.18 1.28 0.42 0.43 0.21 -0.22 -0.07 -0.15 -0.15 -0.08 5.00 S
Regal Entertainment & Consultants 201406 3.07 0.04 0.07 -0.03 0.00 -0.03 -0.03 -0.03 -0.11 0.00 S
Regal Entertainment & Consultants 201409 3.07 0.09 0.00 0.10 -0.01 0.00 -0.01 -0.01 -0.01 -0.04 0.00 S
Regal Entertainment & Consultants 201412 3.07 0.07 0.07 -0.01 0.00 -0.01 -0.01 -0.01 -0.04 0.00 S
Regal Entertainment & Consultants 201503 3.07 0.02 0.15 -0.13 0.01 -0.14 0.00 -0.14 -0.14 -0.45 0.00 S
Rekvina Laboratories 201406 3.01 0.03 0.00 0.03 0.03 0.03 0.03 0.00 S
Rekvina Laboratories 201409 3.01 0.00 0.00 0.00 0.00 0.00 0.00 S
Rekvina Laboratories 201412 3.01 0.00 0.00 0.00 0.00 0.00 0.00 S
Rekvina Laboratories 201503 3.01 0.02 -0.02 -0.02 0.00 -0.02 -0.02 0.00 S

Co_Name Year Equity N.Sale O.O.I T. Exp O.I PBIDT Int. Dep. PBT T.Tax PAT A.PAT EPS Div (%)
Exp
ecte
d R
esu
lts
on
14
Au
gu
st 2
015
Reliance Capital 201406 244.00 2115.00 23.00 1287.00 6.00 857.00 684.00 14.00 159.00 28.00 131.00 164.00 6.66 85.00 C
Reliance Capital 201409 244.00 2051.00 27.00 1147.00 6.00 937.00 660.00 14.00 263.00 50.00 213.00 217.00 8.88 85.00 C
Reliance Capital 201412 244.00 2057.00 44.00 1140.00 4.00 965.00 667.00 17.00 281.00 51.00 230.00 213.00 8.65 85.00 C
Reliance Capital 201503 253.00 1314.00 31.00 258.00 18.00 1105.00 562.00 11.00 532.00 51.00 481.00 481.00 19.54 85.00 S
Reliance Communications 201406 1021.00 5290.00 64.00 3660.00 169.00 1863.00 767.00 931.00 165.00 1.00 164.00 132.00 0.64 0.00 C
Reliance Communications 201409 1191.00 5091.00 196.00 3576.00 116.00 1827.00 670.00 943.00 214.00 2.00 212.00 153.00 0.64 0.00 C
Reliance Communications 201412 1191.00 5359.00 76.00 3618.00 34.00 1851.00 652.00 948.00 251.00 17.00 234.00 201.00 0.88 0.00 C
Reliance Communications 201503 1244.00 5683.00 11.00 3727.00 9.00 1976.00 666.00 995.00 315.00 306.00 9.00 228.00 0.89 0.00 C
Remi Edelstahl Tubulars 201406 9.58 34.03 0.20 31.47 0.08 2.85 2.62 1.13 -0.90 -0.30 -0.61 -0.61 -0.64 0.00 S
Remi Edelstahl Tubulars 201409 9.58 51.22 0.17 47.23 0.11 4.26 2.34 1.16 0.75 0.24 0.51 0.51 0.53 0.00 S
Remi Edelstahl Tubulars 201412 9.58 45.90 0.01 44.18 0.11 1.84 2.42 1.18 -1.75 -0.58 -1.18 -1.18 -1.23 0.00 S
Remi Edelstahl Tubulars 201503 9.58 41.07 0.32 40.29 0.52 1.61 0.68 1.44 -0.51 -0.09 -0.42 -0.42 -0.44 0.00 S
Remi Elektrotechnik 201406 4.87 27.03 0.08 23.45 0.03 3.69 1.02 0.39 2.28 0.74 1.54 1.54 3.16 0.00 S
Remi Elektrotechnik 201409 4.87 26.85 0.10 22.50 0.08 4.53 1.13 0.40 3.00 1.06 1.94 1.94 3.98 0.00 S
Remi Elektrotechnik 201412 4.87 23.78 0.20 20.02 0.03 4.00 1.05 0.41 2.54 0.95 1.59 1.59 3.27 0.00 S
Remi Elektrotechnik 201503 4.87 36.88 0.12 31.76 0.14 5.38 0.49 0.64 4.25 1.28 2.97 2.97 6.10 0.00 S
Remi Process Plant & Machinery 201406 1.76 3.72 0.25 3.79 0.37 0.55 0.14 0.42 0.12 0.30 0.30 1.68 6.00 S
Remi Process Plant & Machinery 201409 1.76 5.65 0.34 5.86 0.29 0.41 0.16 0.26 0.08 0.17 0.17 0.98 6.00 S
Remi Process Plant & Machinery 201412 1.76 2.79 0.34 2.90 0.17 0.41 -0.11 0.15 0.37 0.05 0.32 0.32 1.82 6.00 S
Remi Process Plant & Machinery 201503 1.76 7.75 0.24 7.54 0.42 0.88 0.00 0.16 0.72 0.27 0.45 0.45 2.55 6.00 S
Remi Sales & Engg. 201406 0.57 44.64 43.06 0.19 1.77 0.14 0.10 1.53 0.50 1.03 1.03 18.13 0.00 S
Remi Sales & Engg. 201409 0.57 30.85 30.03 0.13 0.95 0.07 0.10 0.78 0.26 0.53 0.53 9.24 0.00 S
Remi Sales & Engg. 201412 0.57 24.81 24.68 0.02 0.14 0.26 0.10 -0.22 -0.07 -0.15 -0.15 -2.59 0.00 S
Remi Sales & Engg. 201503 0.57 31.97 31.31 0.04 0.70 -0.10 0.00 -0.79 -0.16 -0.63 -0.63 -11.04 0.00 S
Remi Securities 201406 1.75 0.14 0.02 0.12 0.25 -0.13 -0.04 -0.09 -0.09 -0.52 0.00 S
Remi Securities 201409 1.75 0.13 0.02 0.01 0.13 0.22 1.83 -0.03 1.87 1.87 10.66 0.00 S
Remi Securities 201412 1.75 0.13 0.04 0.01 0.10 0.17 -0.07 -0.02 -0.04 -0.04 -0.25 0.00 S
Remi Securities 201503 2.00 0.11 0.06 0.08 0.12 0.08 -1.37 -0.50 -0.87 -0.87 -4.34 0.00 S
Responsive Industries 201406 26.25 501.20 11.15 442.07 10.31 80.59 6.86 40.76 32.97 9.05 23.93 19.10 0.91 10.00 C
Responsive Industries 201409 26.25 461.61 22.91 411.91 10.07 82.67 6.39 41.24 35.04 12.23 22.81 18.18 0.87 10.00 C
Responsive Industries 201412 26.25 511.10 19.82 473.04 9.15 67.02 6.33 42.36 18.34 5.92 12.41 9.46 0.47 10.00 C
Responsive Industries 201503 26.25 559.65 19.03 532.71 3.19 49.16 6.86 41.98 0.32 -2.31 2.63 2.55 0.10 10.00 C
Richa Industries 201406 22.32 49.72 39.14 0.13 10.71 5.96 2.59 2.16 0.43 1.71 1.73 0.76 0.00 S
Richa Industries 201409 22.32 52.04 40.62 0.97 12.39 7.38 2.55 2.46 0.49 1.97 1.97 0.88 0.00 S
Richa Industries 201412 22.32 79.89 68.64 0.17 11.41 7.04 2.57 1.80 0.36 1.44 1.44 0.64 0.00 S
Richa Industries 201503 22.32 120.67 108.34 -0.70 11.63 6.96 1.06 3.60 0.05 2.11 3.55 0.95 0.00 S
RISA International 201406 31.90 45.32 44.44 0.00 0.87 0.03 0.00 0.85 0.28 0.57 0.57 0.18 5.00 S
RISA International 201409 31.90 42.66 40.95 0.00 1.71 0.04 0.00 1.65 0.55 1.10 1.10 0.35 5.00 S
RISA International 201412 31.90 30.32 29.65 0.00 0.67 0.03 0.00 0.64 0.21 0.43 0.43 0.13 5.00 S
RISA International 201503 31.90 58.93 57.99 0.08 1.02 0.03 0.01 0.99 0.36 0.62 0.62 0.04 5.00 S
Rishab Special Yarns 201406 3.56 0.02 0.01 -0.01 -0.01 -0.01 -0.01 -0.04 0.00 S
Rishab Special Yarns 201409 3.56 0.01 0.01 0.00 0.00 0.00 0.00 -0.01 0.00 S
Rishab Special Yarns 201412 3.56 0.03 0.01 -0.02 -0.02 -0.02 -0.02 -0.07 0.00 S
Rishab Special Yarns 201503 3.56 0.02 0.01 -0.02 -0.02 -0.02 -0.02 -0.05 0.00 S
Rishabhdev Technocable 201406 26.69 7.95 8.43 -0.48 1.29 0.53 -2.31 -0.42 -1.88 -1.88 -0.70 0.00 S
Rishabhdev Technocable 201409 26.69 6.97 18.20 -11.23 1.28 0.53 -13.04 0.42 -13.47 -13.47 -5.57 0.00 S
Rishabhdev Technocable 201412 26.69 14.58 27.99 -13.40 0.58 0.53 -14.51 -14.51 -14.51 -5.44 0.00 S
Rishabhdev Technocable 201503 26.69 44.76 0.03 54.54 -9.74 1.97 1.83 -13.54 -13.54 -13.54 -0.51 0.00 S

Co_Name Year Equity N.Sale O.O.I T. Exp O.I PBIDT Int. Dep. PBT T.Tax PAT A.PAT EPS Div (%)
Exp
ecte
d R
esu
lts
on
14
Au
gu
st 2
015
Ritesh International 201406 8.55 7.27 0.18 8.37 0.02 -0.90 0.15 0.19 -1.22 -1.22 -1.22 -1.43 0.00 S
Ritesh International 201409 8.55 7.62 0.22 8.03 0.03 -0.15 0.12 0.19 -0.50 -0.50 -0.50 -0.58 0.00 S
Ritesh International 201412 8.55 7.14 0.77 7.99 0.13 0.05 0.15 0.19 -0.28 -0.28 -0.28 -0.33 0.00 S
Ritesh International 201503 8.55 5.18 0.44 6.07 0.23 -0.24 0.12 -0.22 -0.13 -3.61 -0.13 -4.23 0.00 S
Ritesh Properties & Industries 201406 11.59 1.67 1.26 0.04 0.45 0.01 0.07 0.37 0.07 0.30 0.30 0.26 0.00 S
Ritesh Properties & Industries 201409 11.59 1.98 1.60 0.10 0.47 0.01 0.04 0.45 0.09 0.36 0.36 0.31 0.00 S
Ritesh Properties & Industries 201412 11.59 2.16 2.09 0.12 0.18 0.02 0.05 0.12 0.02 0.10 0.10 0.08 0.00 S
Ritesh Properties & Industries 201503 11.59 1.98 0.02 2.45 0.81 0.37 0.01 0.11 0.32 -0.17 1.25 0.49 1.08 0.00 S
Rolta India 201406 161.33 881.28 585.21 7.33 303.40 89.85 144.65 68.90 7.10 61.80 61.80 3.80 22.50 C
Rolta India 201409 161.33 885.29 560.16 6.21 331.34 103.16 148.90 79.28 8.48 70.80 70.80 4.40 22.50 C
Rolta India 201412 161.33 966.75 621.93 7.48 352.30 106.31 156.31 89.68 13.12 76.56 76.56 4.70 22.50 C
Rolta India 201503 161.33 946.14 635.54 9.70 320.30 102.02 172.14 46.14 10.13 36.01 36.01 2.20 22.50 C
Roopa Industries 201406 7.87 8.58 0.00 8.16 0.02 0.44 0.28 0.14 0.02 0.00 0.01 0.01 0.02 0.00 S
Roopa Industries 201409 7.87 7.12 0.02 6.65 0.01 0.49 0.32 0.15 0.02 0.01 0.01 0.01 0.01 0.00 S
Roopa Industries 201412 7.87 8.07 0.41 8.01 0.04 0.50 0.32 0.15 0.04 0.01 0.03 0.03 0.04 0.00 S
Roopa Industries 201503 7.87 6.71 0.07 6.03 0.01 0.76 0.43 0.09 0.10 0.00 0.11 0.11 0.14 0.00 S
Royale Manor Hotels & Industries 201406 16.93 4.44 3.30 0.16 1.30 0.47 0.34 0.48 0.10 0.38 0.38 0.21 0.00 S
Royale Manor Hotels & Industries 201409 16.93 4.48 3.72 0.18 0.94 0.47 0.32 0.15 0.03 0.12 0.12 0.06 0.00 S
Royale Manor Hotels & Industries 201412 16.93 5.51 4.46 0.22 1.26 0.46 0.36 0.44 0.09 0.35 0.35 0.19 0.00 S
Royale Manor Hotels & Industries 201503 16.93 9.52 6.46 0.34 3.41 0.71 1.94 0.76 -0.29 1.59 1.04 0.93 0.00 S
RPP Infra Projects 201406 22.60 47.10 39.29 1.96 9.77 3.87 2.04 3.85 0.87 2.99 2.99 1.32 5.00 C
RPP Infra Projects 201409 22.60 60.26 51.44 1.50 10.32 4.33 0.10 5.89 1.77 4.12 4.12 1.82 5.00 C
RPP Infra Projects 201412 22.60 75.17 65.16 0.62 10.63 3.98 1.45 5.20 0.61 4.59 4.59 2.03 5.00 C
RPP Infra Projects 201503 22.60 83.42 74.99 0.47 8.90 5.19 3.84 6.15 1.28 4.87 4.87 2.16 5.00 C
RR Securities 201406 3.02 0.05 0.03 0.02 0.01 0.01 0.01 0.01 0.00 S
RR Securities 201409 3.02 0.05 0.02 0.03 0.01 0.02 0.02 0.02 0.05 0.00 S
RR Securities 201412 3.02 0.01 0.05 -0.04 0.01 -0.05 -0.05 -0.05 -0.02 0.00 S
RR Securities 201503 3.02 0.10 0.08 0.03 0.02 0.01 0.00 0.00 0.00 0.00 S
RT Exports 201406 4.36 0.36 0.51 0.54 0.39 0.46 0.13 -0.22 0.09 -0.22 0.21 0.00 S
RT Exports 201409 4.36 1.26 1.10 0.47 0.63 0.55 0.13 -0.06 -0.06 -0.06 -0.15 0.00 S
RT Exports 201412 4.36 0.35 0.33 0.62 0.65 0.56 0.13 -0.04 -0.04 -0.04 -0.10 0.00 S
RT Exports 201503 4.36 6.21 5.27 0.04 0.97 0.54 0.01 0.46 -0.19 0.65 0.65 1.49 0.00 S
RTCL 201406 12.00 0.11 0.06 -0.05 0.17 0.04 -0.26 -0.08 -0.18 -0.19 -0.15 0.00 S
RTCL 201409 12.00 0.12 0.06 -0.06 0.18 0.04 -0.28 -0.09 -0.20 -0.20 -0.17 0.00 S
RTCL 201412 12.00 0.15 0.08 -0.07 0.18 0.07 -0.33 -0.09 -0.23 -0.24 -0.19 0.00 S
RTCL 201503 12.00 4.10 3.58 1.09 1.61 0.21 0.05 1.31 0.44 0.86 0.86 0.00 S
Ruby Traders & Exporters 201406 4.39 0.52 0.49 0.00 0.03 0.00 0.00 0.03 0.01 0.02 0.02 0.05 0.00 S
Ruby Traders & Exporters 201409 4.39 0.60 0.57 0.05 0.08 0.00 0.07 0.02 0.06 0.06 0.13 0.00 S
Ruby Traders & Exporters 201412 4.39 0.46 0.45 0.01 0.02 0.00 0.00 0.02 0.00 0.01 0.01 0.02 0.00 S
Ruby Traders & Exporters 201503 4.39 0.70 0.03 0.91 0.19 0.01 0.00 0.00 0.00 -0.02 0.02 0.02 0.04 0.00 S
Ruchi Infrastructure 201406 20.52 689.56 5.41 693.50 0.55 2.02 8.54 3.34 -9.86 -2.76 -7.10 -7.10 -0.39 6.00 S
Ruchi Infrastructure 201409 20.52 609.87 0.09 625.51 0.06 -15.49 10.09 3.01 11.96 3.19 8.77 8.77 0.38 6.00 S
Ruchi Infrastructure 201412 20.52 51.90 0.04 45.73 0.37 6.58 4.04 2.06 0.48 0.22 0.26 0.26 -0.04 6.00 S
Ruchi Infrastructure 201503 20.52 386.19 0.71 392.37 18.20 12.73 8.17 5.74 -1.18 -2.21 1.03 1.03 0.05 6.00 S
Ruchi Soya Industries 201406 66.81 5646.80 78.67 5561.45 10.48 174.50 113.33 55.40 5.77 5.59 0.18 0.18 8.00 S
Ruchi Soya Industries 201409 66.81 6985.22 81.78 6946.75 7.45 127.70 91.18 24.49 12.03 6.81 5.22 5.22 0.16 8.00 S
Ruchi Soya Industries 201412 66.81 5691.75 85.62 5676.80 16.08 116.64 101.47 42.01 38.09 1.54 36.54 36.54 1.09 8.00 S
Ruchi Soya Industries 201503 66.81 9629.12 110.13 9600.58 68.53 207.20 156.35 26.11 24.74 5.75 18.99 18.99 0.57 8.00 S

Co_Name Year Equity N.Sale O.O.I T. Exp O.I PBIDT Int. Dep. PBT T.Tax PAT A.PAT EPS Div (%)
Exp
ecte
d R
esu
lts
on
14
Au
gu
st 2
015
Saboo Brothers 201406 6.10 0.03 0.05 0.02 0.00 0.02 0.02 0.02 0.02 0.00 S
Saboo Brothers 201409 6.10 0.03 0.05 0.02 0.00 0.02 0.02 0.02 0.02 0.00 S
Saboo Brothers 201412 6.10 0.01 0.05 0.05 0.00 0.04 -0.01 0.04 -0.02 0.00 S
Saboo Brothers 201503 6.10 0.04 0.07 0.11 0.08 -0.01 0.09 -0.12 0.09 -0.20 0.00 S
Saboo Sodium Chloro 201406 19.18 3.58 0.16 2.62 0.08 1.20 0.32 0.81 0.07 0.07 0.07 0.04 0.00 S
Saboo Sodium Chloro 201409 19.18 3.94 2.72 0.06 1.27 0.40 0.82 0.04 0.04 0.04 0.02 0.00 S
Saboo Sodium Chloro 201412 19.18 3.89 0.25 2.83 0.07 1.38 0.38 0.96 0.05 0.05 0.05 0.02 0.00 S
Saboo Sodium Chloro 201503 19.18 6.80 0.54 5.21 0.18 2.31 1.61 0.60 0.10 0.10 0.10 0.11 0.00 S
Sagar Soya Products 201406 5.85 0.00 0.06 -0.06 -0.06 -0.06 -0.06 -0.09 0.00 S
Sagar Soya Products 201409 5.85 0.05 0.02 0.03 0.03 0.03 0.03 0.00 S
Sagar Soya Products 201412 5.85 0.51 0.03 0.48 0.05 0.43 0.43 0.43 0.00 S
Sagar Soya Products 201503 5.85 0.30 0.65 -0.35 0.03 -0.38 -0.38 -0.38 -0.64 0.00 S
Sagar Systech 201406 0.32 0.01 -0.01 -0.01 -0.01 -0.01 -0.18 0.00 S
Sagar Systech 201409 0.32 0.00 0.01 0.00 0.00 0.00 0.00 0.09 0.00 S
Sagar Systech 201412 0.32 0.01 0.06 0.06 0.06 0.06 0.06 1.73 0.00 S
Sagar Systech 201503 0.32 0.01 -0.01 -0.01 0.00 0.00 0.00 -0.12 0.00 S
Sagar Tourist Resorts 201406 3.13 0.62 0.01 0.42 0.22 0.00 0.03 0.19 0.19 0.19 0.60 0.00 S
Sagar Tourist Resorts 201409 3.13 0.11 0.00 0.25 -0.14 0.03 -0.17 -0.17 -0.17 -0.53 0.00 S
Sagar Tourist Resorts 201412 3.13 0.19 0.01 0.24 -0.04 0.03 -0.07 -0.07 -0.07 -0.23 0.00 S
Sagar Tourist Resorts 201503 3.13 0.14 0.00 0.53 -0.39 0.03 -0.41 -0.41 -0.41 -1.32 0.00 S
Sahara Housingfina Corporation 201406 7.00 4.76 0.01 1.25 0.13 3.65 2.72 0.02 0.90 0.29 0.61 0.61 0.87 0.00 S
Sahara Housingfina Corporation 201409 7.00 4.59 0.02 1.23 0.19 3.57 2.66 0.02 0.89 0.29 0.60 0.60 0.86 0.00 S
Sahara Housingfina Corporation 201412 7.00 4.41 0.01 1.27 0.26 3.41 2.41 0.02 0.98 0.33 0.65 0.65 0.94 0.00 S
Sahara Housingfina Corporation 201503 7.00 3.56 0.02 1.51 0.38 2.45 1.95 0.02 0.48 0.16 0.32 0.32 0.46 0.00 S
Sai Capital 201406 3.63 -0.05 0.02 -0.08 -0.08 -0.08 -0.08 -0.21 0.00 S
Sai Capital 201409 3.63 -0.02 0.00 0.02 -0.04 -0.04 -0.04 -0.04 -0.10 0.00 S
Sai Capital 201412 3.63 0.00 0.01 -0.01 -0.01 -0.01 -0.01 -0.03 0.00 S
Sai Capital 201503 3.63 0.00 0.04 0.02 -0.01 -0.01 -0.01 -0.01 -0.02 0.00 S
Sai Industries 201406 2.97 0.02 -0.02 -0.02 -0.02 -0.02 -0.08 0.00 S
Sai Industries 201409 2.97 0.00 0.00 0.00 0.00 0.00 -0.01 0.00 S
Sai Industries 201412 2.97 0.00 0.00 0.00 0.00 0.00 -0.01 0.00 S
Sai Industries 201503 2.97 0.00 0.01 0.01 0.01 0.01 0.01 0.02 0.00 S
Salguti Industries 201406 83.76 30.88 28.77 0.06 2.17 1.80 0.68 -0.31 -0.31 -0.31 -0.04 0.00 S
Salguti Industries 201409 7.54 33.88 31.23 0.04 2.69 1.76 0.68 0.25 0.10 0.15 0.15 0.20 0.00 S
Salguti Industries 201412 7.54 34.36 31.81 0.11 2.66 1.81 0.68 0.18 0.12 0.05 0.05 0.07 0.00 S
Salguti Industries 201503 7.54 25.61 0.02 23.02 0.09 2.68 1.53 1.24 -0.09 -0.49 0.40 0.40 0.53 0.00 S
Sam Industries 201406 11.09 1.54 1.42 0.20 0.32 0.00 0.16 0.16 0.06 0.10 0.10 0.09 0.00 S
Sam Industries 201409 11.09 1.82 1.73 0.44 0.53 0.19 0.34 0.19 0.15 0.15 0.13 0.00 S
Sam Industries 201412 11.09 1.37 1.71 0.09 -0.24 0.00 0.17 -0.41 -0.12 -0.29 -0.29 -0.26 0.00 S
Sam Industries 201503 11.09 1.70 1.66 0.52 0.55 0.00 0.17 -0.61 0.32 -0.93 -0.93 -0.84 0.00 S
Sam Leaseco 201406 10.20 0.02 0.28 0.26 0.00 0.26 0.08 0.18 0.18 0.02 0.00 S
Sam Leaseco 201409 10.20 0.14 0.26 0.12 0.12 0.07 0.05 0.05 0.00 S
Sam Leaseco 201412 10.20 0.39 0.25 -0.14 -0.14 0.07 -0.21 -0.21 -0.02 0.00 S
Sam Leaseco 201503 10.20 0.11 0.04 -0.07 -0.07 0.01 -0.08 -0.08 -0.01 0.00 S
Sambhaav Media 201406 14.61 5.05 3.44 0.20 1.80 0.72 0.66 0.38 0.12 0.25 0.25 0.02 0.00 S
Sambhaav Media 201409 14.61 5.51 4.13 0.44 1.81 0.65 0.66 0.54 0.28 0.26 0.26 0.02 0.00 S
Sambhaav Media 201412 14.61 5.53 4.30 0.81 2.05 0.64 0.67 0.72 0.26 0.46 0.46 0.03 0.00 C
Sambhaav Media 201503 14.61 7.23 4.45 0.45 3.23 0.85 0.41 1.97 -0.56 2.53 2.53 0.17 0.00 C

Co_Name Year Equity N.Sale O.O.I T. Exp O.I PBIDT Int. Dep. PBT T.Tax PAT A.PAT EPS Div (%)
Exp
ecte
d R
esu
lts
on
14
Au
gu
st 2
015
Samrat Pharmachem 201406 3.09 14.14 0.04 13.59 0.03 0.61 0.12 0.09 0.40 0.17 0.24 0.24 0.77 0.00 S
Samrat Pharmachem 201409 3.09 15.09 0.11 14.71 0.06 0.54 0.25 0.09 0.21 0.06 0.14 0.14 0.46 0.00 S
Samrat Pharmachem 201412 3.09 8.99 0.01 8.78 0.04 0.26 0.10 0.09 0.06 0.06 0.00 S
Samrat Pharmachem 201503 3.09 9.18 0.01 9.15 0.05 0.09 0.11 0.17 -0.19 -0.11 -0.09 -0.09 -0.29 0.00 S
Sanblue Corporation 201406 5.00 0.01 0.02 0.00 -0.01 -0.01 -0.01 -0.01 -0.01 0.00 S
Sanblue Corporation 201409 5.00 0.01 0.04 0.02 -0.01 0.18 0.03 0.15 0.15 0.30 0.00 S
Sanblue Corporation 201412 5.00 0.01 0.03 0.01 -0.01 -0.01 0.00 -0.01 -0.01 -0.01 0.00 S
Sanblue Corporation 201503 5.00 0.01 0.04 0.05 0.03 0.00 -0.16 -0.03 -0.13 -0.13 -0.26 0.00 S
Sanco Trans 201406 1.80 19.15 17.33 0.12 1.94 0.66 0.95 0.34 -0.03 0.37 0.37 2.03 27.00 S
Sanco Trans 201409 1.80 18.04 17.31 0.43 1.17 0.69 0.96 -0.49 -0.17 -0.32 -0.32 -1.77 27.00 S
Sanco Trans 201412 1.80 18.72 17.50 0.34 1.55 0.75 0.95 -0.14 -0.13 -0.02 -0.02 -0.08 27.00 S
Sanco Trans 201503 1.80 19.60 15.82 0.41 4.19 0.89 0.73 2.57 0.25 2.32 2.32 12.91 27.00 S
Sanjivani Paranteral 201406 5.90 37.81 0.05 35.07 2.80 1.63 0.24 0.93 0.93 0.93 1.57 0.00 S
Sanjivani Paranteral 201409 5.90 24.74 0.06 22.38 2.42 2.06 0.24 0.13 0.13 0.13 0.22 0.00 S
Sanjivani Paranteral 201412 5.90 32.33 0.17 30.19 2.31 1.90 0.28 0.13 0.13 0.13 0.22 0.00 S
Sanjivani Paranteral 201503 5.90 38.16 1.16 40.04 -0.73 2.34 0.66 -3.96 -0.36 -3.60 -3.60 -6.10 0.00 S
Sanmit Infra 201406 9.90 0.01 -0.01 0.00 -0.01 -0.01 -0.01 0.00 S
Sanmit Infra 201409 9.90 0.02 -0.02 0.00 -0.02 -0.02 -0.02 0.00 S
Sanmit Infra 201412 9.90 0.02 -0.02 0.00 -0.02 -0.02 -0.02 0.00 S
Sanmit Infra 201503 9.90 5.25 0.01 -5.24 0.00 -5.24 0.00 -5.24 -5.24 0.00 S
Sanmitra Commercial 201406 1.10 0.02 0.01 -0.02 -0.02 -0.02 -0.02 -0.16 0.00 S
Sanmitra Commercial 201409 1.10 0.01 0.00 -0.01 -0.01 -0.01 -0.01 -0.07 0.00 S
Sanmitra Commercial 201412 1.10 0.02 0.03 0.01 0.01 0.01 0.01 0.00 S
Sanmitra Commercial 201503 1.10 0.01 0.02 0.00 0.00 0.00 0.00 0.04 0.00 S
Sanwaria Agro Oils 201406 34.81 485.99 3.23 463.46 25.75 17.40 0.93 7.42 1.26 6.16 6.16 0.18 0.00 S
Sanwaria Agro Oils 201409 34.81 601.83 3.90 584.49 21.24 13.12 1.27 6.85 1.17 5.69 5.69 0.16 0.00 S
Sanwaria Agro Oils 201412 34.81 1071.45 2.34 1050.80 22.99 13.77 1.10 8.12 1.38 6.74 6.74 0.19 0.00 S
Sanwaria Agro Oils 201503 34.81 485.41 8.38 473.16 20.62 8.72 3.33 8.57 1.97 6.60 6.60 0.19 0.00 S
Sarda Papers 201406 3.12 0.02 0.01 0.00 0.02 0.00 0.01 0.01 0.01 0.04 0.00 S
Sarda Papers 201409 3.12 0.02 0.02 0.00 0.00 0.00 0.00 0.00 S
Sarda Papers 201412 3.12 0.02 0.04 0.01 0.00 0.00 -0.01 -0.01 -0.01 -0.02 0.00 S
Sarda Papers 201503 3.12 0.03 0.02 0.03 0.00 0.02 0.00 0.02 0.02 0.02 0.07 0.00 S
Sarthak Industries 201406 6.97 13.49 0.78 13.75 0.08 0.61 0.25 0.09 0.27 -0.07 0.34 0.34 0.48 0.00 S
Sarthak Industries 201409 6.97 40.13 0.05 39.88 0.08 0.37 0.15 0.09 0.13 0.06 0.07 0.07 0.10 0.00 S
Sarthak Industries 201412 6.97 11.41 0.06 11.27 0.09 0.29 0.08 0.09 0.13 -0.03 0.16 0.16 0.22 0.00 S
Sarthak Industries 201503 6.97 30.31 0.19 33.60 3.91 0.81 0.57 0.34 -0.11 0.19 -0.29 -0.29 -0.42 0.00 S
Sarvamangal Mercantile Company 201406 0.25 0.17 0.09 -0.08 0.10 -0.18 -0.18 -0.18 -7.18 0.00 S
Sarvamangal Mercantile Company 201409 0.25 0.14 1.74 1.60 0.13 0.00 1.47 0.20 1.28 1.28 51.20 0.00 S
Sarvamangal Mercantile Company 201412 0.25 0.18 0.21 0.03 0.09 0.00 -0.06 -0.04 -0.02 -0.02 -0.92 0.00 S
Sarvamangal Mercantile Company 201503 0.25 5.80 6.97 5.30 4.13 0.10 0.00 4.03 -0.15 4.18 4.18 16.78 0.00 S
Sathavahana Ispat 201406 50.90 226.69 202.69 1.85 25.85 11.32 6.48 8.04 0.29 7.76 7.76 1.52 0.00 S
Sathavahana Ispat 201409 50.90 274.33 245.97 0.99 29.35 11.26 6.35 8.87 0.44 8.43 8.43 1.66 0.00 S
Sathavahana Ispat 201412 50.90 270.83 249.43 1.16 22.55 11.48 5.90 5.18 0.54 4.64 4.64 0.91 0.00 S
Sathavahana Ispat 201503 50.90 207.76 0.00 191.07 6.45 23.15 11.38 5.78 5.99 0.99 5.01 5.01 0.98 0.00 S
Savera Industries 201406 11.93 14.49 0.05 11.78 2.77 0.84 0.90 1.03 0.34 0.69 0.69 0.58 12.00 S
Savera Industries 201409 11.93 16.22 0.07 12.77 3.52 0.79 0.89 1.83 0.54 1.30 1.30 1.09 12.00 S
Savera Industries 201412 11.93 15.73 0.04 12.60 3.17 0.77 0.94 1.47 0.47 0.99 0.99 0.83 12.00 S
Savera Industries 201503 11.93 15.94 0.55 13.81 2.67 0.75 2.28 -0.36 -0.27 -0.09 -0.09 -0.07 12.00 S

Co_Name Year Equity N.Sale O.O.I T. Exp O.I PBIDT Int. Dep. PBT T.Tax PAT A.PAT EPS Div (%)
Exp
ecte
d R
esu
lts
on
14
Au
gu
st 2
015
Scandent Imaging 201406 3.00 0.01 0.02 0.00 0.00 0.00 0.00 -0.01 0.00 S
Scandent Imaging 201409 3.00 0.02 0.12 -0.11 -0.11 -0.11 -0.11 -0.36 0.00 S
Scandent Imaging 201412 32.10 0.02 0.04 0.04 0.02 0.02 0.02 0.02 0.00 S
Scandent Imaging 201503 32.10 0.02 0.07 0.07 0.02 0.03 -24.74 -24.74 -24.74 -7.71 0.00 S
SDF Industries 201406 11.69 1.64 0.01 1.33 0.32 0.05 0.27 0.27 0.27 0.23 0.00 S
SDF Industries 201409 11.69 3.54 0.01 2.95 0.61 0.10 0.51 0.51 0.51 0.44 0.00 S
SDF Industries 201412 11.69 2.21 0.00 1.54 0.67 0.05 0.62 0.62 0.62 0.53 0.00 S
SDF Industries 201503 11.69 2.47 0.00 1.95 0.53 0.07 0.46 0.46 0.46 0.39 0.00 S
Sea Gold Infrastructure 201406 5.45 0.03 0.01 -0.02 -0.02 -0.02 -0.02 -0.04 0.00 S
Sea Gold Infrastructure 201409 5.45 0.00 0.00 0.00 0.00 0.00 0.00 S
Sea Gold Infrastructure 201412 5.45 0.00 S
Sea Gold Infrastructure 201503 5.45 4.19 3.86 0.34 0.08 0.00 0.25 0.05 0.20 0.20 0.37 0.00 S
Selan Exploration Technology 201406 16.40 25.29 11.80 2.96 16.45 0.01 0.52 15.92 5.48 10.44 10.44 6.37 50.00 S
Selan Exploration Technology 201409 16.40 23.31 11.83 2.93 14.41 0.01 0.57 13.83 4.26 9.57 9.57 5.84 50.00 S
Selan Exploration Technology 201412 16.40 21.65 17.13 3.01 7.53 0.70 6.83 2.50 4.33 4.33 2.64 50.00 S
Selan Exploration Technology 201503 16.40 9.04 3.38 2.86 8.52 0.12 0.72 7.68 3.72 3.96 3.96 2.41 50.00 S
Sen Pet (India) 201406 42.79 0.08 0.55 -0.47 0.87 -1.34 -1.34 -1.34 -0.31 0.00 S
Sen Pet (India) 201409 42.79 0.02 0.35 -0.34 0.85 -1.19 -1.19 -1.19 -0.28 0.00 S
Sen Pet (India) 201412 42.79 0.01 0.26 0.00 -0.25 0.86 -1.11 -1.11 -1.11 -0.25 0.00 S
Sen Pet (India) 201503 42.79 0.27 -0.27 0.01 -0.27 -0.27 -0.27 -0.06 0.00 S
Senbo Industries 201406 10.85 0.07 -0.07 0.05 -0.12 -0.12 -0.12 -0.11 0.00 S
Senbo Industries 201409 10.85 0.06 -0.06 0.05 -0.11 -0.11 -0.11 -0.10 0.00 S
Senbo Industries 201412 10.85 0.11 0.09 -0.02 0.05 -0.07 -0.07 -0.07 -0.07 0.00 S
Senbo Industries 201503 10.85 0.12 0.25 0.12 0.01 0.15 0.15 0.15 0.14 0.00 S
Shah Construction Company 201406 1.61 0.05 0.15 0.20 0.00 0.18 0.02 -0.20 -0.20 -0.20 -12.32 0.00 S
Shah Construction Company 201409 1.61 0.10 0.21 0.25 0.14 0.32 0.02 -0.20 0.00 -0.20 -0.20 -12.20 0.00 S
Shah Construction Company 201412 1.61 0.10 0.12 0.02 0.01 0.32 0.02 -0.33 -0.33 -0.33 -20.67 0.00 S
Shah Construction Company 201503 1.61 0.10 0.18 0.01 -0.07 0.31 0.07 -0.46 -0.46 -0.46 -28.44 0.00 S
Shahi Shipping 201406 14.50 3.90 2.33 0.00 1.57 0.63 0.67 0.28 0.05 0.22 0.22 0.15 0.00 S
Shahi Shipping 201409 14.50 3.83 2.43 0.00 1.41 0.65 0.68 0.08 0.02 0.06 0.06 0.04 0.00 S
Shahi Shipping 201412 14.50 5.62 4.04 0.01 1.59 0.59 0.70 0.30 0.12 0.17 0.17 0.12 0.00 S
Shahi Shipping 201503 14.50 5.09 7.96 0.90 -1.98 0.57 1.85 -4.39 -0.49 -3.90 -3.90 -2.69 0.00 S
Shakti Press 201406 3.52 2.03 1.37 0.00 0.66 0.08 0.33 0.26 0.00 0.26 0.26 0.72 0.00 S
Shakti Press 201409 3.52 1.76 2.75 0.00 -0.99 0.16 0.33 -1.47 0.00 -1.47 -1.47 -4.17 0.00 S
Shakti Press 201412 3.52 2.83 3.60 -0.77 0.09 0.32 -1.18 -1.18 -1.18 -3.35 0.00 S
Shakti Press 201503 3.52 3.68 3.36 0.33 0.12 0.32 -0.12 -0.12 -0.12 -0.34 0.00 S
Shamrock Industrial Company 201406 5.43 0.02 -0.02 -0.02 -0.02 -0.02 -0.03 0.00 S
Shamrock Industrial Company 201409 5.43 0.00 0.00 0.00 0.00 0.00 0.00 S
Shamrock Industrial Company 201412 5.43 0.01 -0.01 -0.01 -0.01 -0.01 -0.01 0.00 S
Shamrock Industrial Company 201503 5.43 0.02 -0.02 -0.02 -0.02 -0.02 -0.03 0.00 S
Sharad Fibres & Yarn Processors 201406 4.01 0.65 0.00 0.64 0.01 0.01 0.01 0.01 0.01 0.00 S
Sharad Fibres & Yarn Processors 201409 4.01 2.96 0.02 2.96 0.03 0.00 0.00 0.02 0.02 0.02 0.06 0.00 S
Sharad Fibres & Yarn Processors 201412 4.01 1.96 1.91 0.00 0.04 0.00 0.04 0.04 0.04 0.10 0.00 S
Sharad Fibres & Yarn Processors 201503 4.01 4.39 4.19 0.01 0.21 0.00 0.04 0.17 0.17 0.17 0.42 0.00 S
Sharda Ispat 201406 5.08 14.26 14.37 0.15 0.04 0.37 0.19 -0.52 -0.52 -0.52 -1.02 0.00 S
Sharda Ispat 201409 5.08 15.20 14.77 0.08 0.50 0.38 0.19 -0.07 -0.07 -0.07 -0.13 0.00 S
Sharda Ispat 201412 5.08 12.05 11.68 0.03 0.40 0.39 0.19 -0.17 -0.17 -0.17 -0.34 0.00 S
Sharda Ispat 201503 5.08 13.35 13.68 2.11 1.78 0.39 -0.37 1.76 0.00 1.76 1.76 3.47 0.00 S

Co_Name Year Equity N.Sale O.O.I T. Exp O.I PBIDT Int. Dep. PBT T.Tax PAT A.PAT EPS Div (%)
Exp
ecte
d R
esu
lts
on
14
Au
gu
st 2
015
Sharma East India Hospitals & Medical Research201406 3.28 4.32 3.93 0.20 0.59 0.20 0.14 0.24 0.08 0.17 0.17 0.51 0.00 S
Sharma East India Hospitals & Medical Research201409 3.28 3.85 3.68 0.19 0.37 0.21 0.14 0.02 0.00 0.03 0.03 0.07 0.00 S
Sharma East India Hospitals & Medical Research201412 3.28 4.16 3.79 0.04 0.41 0.20 0.21 0.01 0.00 0.00 0.00 0.01 0.00 S
Sharma East India Hospitals & Medical Research201503 3.28 4.03 3.73 0.12 0.42 0.14 -0.01 0.30 0.03 0.27 0.27 0.82 0.00 S
Sharp India 201406 25.94 79.63 0.07 73.55 0.02 6.17 0.41 2.37 3.38 3.38 3.38 1.30 0.00 S
Sharp India 201409 25.94 39.52 0.23 39.67 0.00 0.08 0.42 1.83 -2.18 -2.18 -2.18 -0.84 0.00 S
Sharp India 201412 25.94 26.24 0.22 25.82 0.04 0.69 0.41 1.72 -1.44 -1.44 -1.44 -0.56 0.00 S
Sharp India 201503 25.94 43.10 0.03 39.31 0.18 4.00 0.39 1.81 1.80 0.00 1.80 1.80 0.69 0.00 S
Sharp Investments 201406 24.21 0.06 0.04 0.02 0.02 0.02 0.02 0.01 0.00 S
Sharp Investments 201409 24.21 0.72 0.43 0.29 0.29 0.29 0.29 0.00 S
Sharp Investments 201412 24.21 0.08 0.04 0.04 0.04 0.04 0.04 0.02 0.00 S
Sharp Investments 201503 24.21 0.19 0.13 0.06 0.06 0.06 0.06 0.02 0.00 S
Shilchar Technologies 201406 3.81 26.52 24.01 0.97 3.48 0.41 0.27 2.79 0.90 1.89 1.89 4.96 15.00 S
Shilchar Technologies 201409 3.81 24.12 21.70 1.19 3.61 0.40 0.29 2.93 1.06 1.88 1.88 4.92 15.00 S
Shilchar Technologies 201412 3.81 19.91 19.10 0.65 1.46 0.16 0.29 1.02 0.36 0.66 0.66 1.73 15.00 S
Shilchar Technologies 201503 3.81 35.33 33.01 0.70 3.02 0.14 0.68 2.19 0.85 1.34 1.34 3.51 15.00 S
Shilpi Cable Technologies 201406 49.32 704.87 648.26 0.73 57.34 14.15 1.39 41.80 4.29 37.52 37.52 7.61 0.00 C
Shilpi Cable Technologies 201409 98.63 745.77 682.58 1.50 64.69 18.06 1.58 45.05 4.89 40.16 40.16 4.07 0.00 C
Shilpi Cable Technologies 201412 98.63 859.84 796.65 3.06 66.26 19.61 1.69 44.95 4.93 40.03 40.03 4.06 0.00 C
Shilpi Cable Technologies 201503 102.63 902.45 824.12 1.08 79.41 28.94 4.41 46.06 3.78 42.29 42.29 4.27 0.00 C
Shiva Cement 201406 37.40 18.76 15.87 0.15 3.04 0.86 1.04 1.14 1.14 1.14 0.06 0.00 S
Shiva Cement 201409 37.40 13.34 11.76 0.08 1.66 0.82 0.77 0.07 0.07 0.07 0.02 0.00 S
Shiva Cement 201412 37.40 18.39 16.22 0.07 2.25 0.86 0.98 0.41 0.41 0.41 0.02 0.00 S
Shiva Cement 201503 37.40 18.11 15.11 0.10 3.10 0.84 1.12 1.14 0.26 0.89 0.89 0.19 0.00 S
Shiva Global Agro Industries 201406 9.54 162.45 154.18 0.13 8.40 3.83 0.70 3.87 1.12 2.75 2.06 0.00 C
Shiva Global Agro Industries 201409 9.54 113.04 107.63 0.41 5.82 3.58 0.75 1.49 0.47 1.02 0.59 0.00 C
Shiva Global Agro Industries 201412 9.54 115.83 109.90 0.27 6.20 3.86 0.72 1.62 0.40 1.22 0.77 0.00 C
Shiva Global Agro Industries 201503 9.54 127.13 0.25 118.70 0.26 8.93 5.00 0.90 3.04 1.20 1.84 1.13 0.00 C
Shivalik Rasayan 201412 3.42 10.73 9.58 0.17 1.33 0.04 1.29 0.44 0.85 0.85 3.77 0.00 S
Shivalik Rasayan 201503 3.42 11.55 10.96 0.09 0.68 0.34 0.07 0.27 0.05 0.22 0.22 0.65 0.00 S
Shiv-Vani Oil & Gas Exploration Services201406 46.36 48.66 78.38 0.09 -29.64 102.21 61.56 -193.40 -193.40 -193.40 -41.72 0.00 C
Shiv-Vani Oil & Gas Exploration Services201409 46.36 55.32 116.58 9.81 -51.45 118.62 54.39 -224.45 -109.51 -114.95 -114.95 -24.79 0.00 C
Shiv-Vani Oil & Gas Exploration Services201412 46.36 53.61 60.35 24.67 17.94 121.48 61.54 -165.08 -165.08 -165.08 -35.61 0.00 C
Shiv-Vani Oil & Gas Exploration Services201503 46.36 47.27 68.99 32.03 10.31 89.92 151.21 -230.46 95.88 -326.34 -326.34 -70.39 0.00 C
Shree Metalloys 201406 5.26 7.71 7.49 0.04 0.26 0.22 0.01 0.04 0.04 0.04 0.08 0.00 S
Shree Metalloys 201409 5.26 8.34 8.03 0.31 0.21 0.07 0.02 0.02 0.02 0.04 0.00 S
Shree Metalloys 201412 5.26 12.11 11.73 0.38 0.23 0.09 0.06 0.02 0.04 0.04 0.07 0.00 S
Shree Metalloys 201503 5.26 10.27 10.04 0.01 0.25 0.12 0.02 0.10 0.07 0.03 0.03 0.06 0.00 S
Shree Rajivlochan Oil Extraction 201406 3.02 0.01 -0.01 0.01 -0.01 -0.01 -0.01 5.52 0.00 S
Shree Rajivlochan Oil Extraction 201409 3.02 0.10 0.10 0.01 0.02 0.00 0.01 0.00 0.01 0.01 0.00 S
Shree Rajivlochan Oil Extraction 201412 3.02 0.01 0.03 0.03 0.00 0.02 0.00 0.02 0.02 0.05 0.00 S
Shree Rajivlochan Oil Extraction 201503 3.02 0.07 0.12 0.06 0.01 0.05 0.02 0.04 0.04 0.12 0.00 S
Shree Salasar Investments 201406 0.20 0.04 0.11 0.06 -0.01 0.00 -0.01 -0.01 -0.01 -0.55 0.00 S
Shree Salasar Investments 201409 0.20 0.02 0.08 0.06 0.01 0.01 0.01 0.01 0.32 0.00 S
Shree Salasar Investments 201412 0.20 0.06 0.26 0.23 0.04 0.00 0.04 0.04 0.04 1.77 0.00 S
Shree Salasar Investments 201503 0.20 0.50 0.36 0.14 0.06 0.08 0.08 0.08 3.87 0.00 S
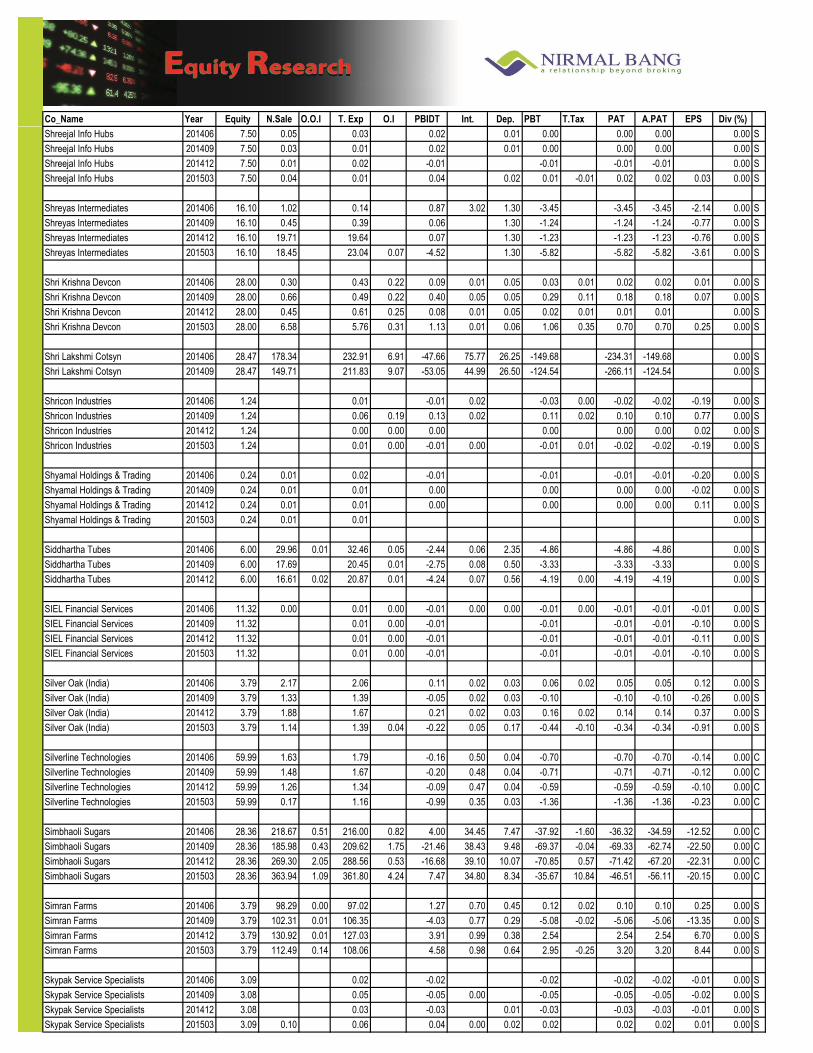
Co_Name Year Equity N.Sale O.O.I T. Exp O.I PBIDT Int. Dep. PBT T.Tax PAT A.PAT EPS Div (%)
Exp
ecte
d R
esu
lts
on
14
Au
gu
st 2
015
Shreejal Info Hubs 201406 7.50 0.05 0.03 0.02 0.01 0.00 0.00 0.00 0.00 S
Shreejal Info Hubs 201409 7.50 0.03 0.01 0.02 0.01 0.00 0.00 0.00 0.00 S
Shreejal Info Hubs 201412 7.50 0.01 0.02 -0.01 -0.01 -0.01 -0.01 0.00 S
Shreejal Info Hubs 201503 7.50 0.04 0.01 0.04 0.02 0.01 -0.01 0.02 0.02 0.03 0.00 S
Shreyas Intermediates 201406 16.10 1.02 0.14 0.87 3.02 1.30 -3.45 -3.45 -3.45 -2.14 0.00 S
Shreyas Intermediates 201409 16.10 0.45 0.39 0.06 1.30 -1.24 -1.24 -1.24 -0.77 0.00 S
Shreyas Intermediates 201412 16.10 19.71 19.64 0.07 1.30 -1.23 -1.23 -1.23 -0.76 0.00 S
Shreyas Intermediates 201503 16.10 18.45 23.04 0.07 -4.52 1.30 -5.82 -5.82 -5.82 -3.61 0.00 S
Shri Krishna Devcon 201406 28.00 0.30 0.43 0.22 0.09 0.01 0.05 0.03 0.01 0.02 0.02 0.01 0.00 S
Shri Krishna Devcon 201409 28.00 0.66 0.49 0.22 0.40 0.05 0.05 0.29 0.11 0.18 0.18 0.07 0.00 S
Shri Krishna Devcon 201412 28.00 0.45 0.61 0.25 0.08 0.01 0.05 0.02 0.01 0.01 0.01 0.00 S
Shri Krishna Devcon 201503 28.00 6.58 5.76 0.31 1.13 0.01 0.06 1.06 0.35 0.70 0.70 0.25 0.00 S
Shri Lakshmi Cotsyn 201406 28.47 178.34 232.91 6.91 -47.66 75.77 26.25 -149.68 -234.31 -149.68 0.00 S
Shri Lakshmi Cotsyn 201409 28.47 149.71 211.83 9.07 -53.05 44.99 26.50 -124.54 -266.11 -124.54 0.00 S
Shricon Industries 201406 1.24 0.01 -0.01 0.02 -0.03 0.00 -0.02 -0.02 -0.19 0.00 S
Shricon Industries 201409 1.24 0.06 0.19 0.13 0.02 0.11 0.02 0.10 0.10 0.77 0.00 S
Shricon Industries 201412 1.24 0.00 0.00 0.00 0.00 0.00 0.00 0.02 0.00 S
Shricon Industries 201503 1.24 0.01 0.00 -0.01 0.00 -0.01 0.01 -0.02 -0.02 -0.19 0.00 S
Shyamal Holdings & Trading 201406 0.24 0.01 0.02 -0.01 -0.01 -0.01 -0.01 -0.20 0.00 S
Shyamal Holdings & Trading 201409 0.24 0.01 0.01 0.00 0.00 0.00 0.00 -0.02 0.00 S
Shyamal Holdings & Trading 201412 0.24 0.01 0.01 0.00 0.00 0.00 0.00 0.11 0.00 S
Shyamal Holdings & Trading 201503 0.24 0.01 0.01 0.00 S
Siddhartha Tubes 201406 6.00 29.96 0.01 32.46 0.05 -2.44 0.06 2.35 -4.86 -4.86 -4.86 0.00 S
Siddhartha Tubes 201409 6.00 17.69 20.45 0.01 -2.75 0.08 0.50 -3.33 -3.33 -3.33 0.00 S
Siddhartha Tubes 201412 6.00 16.61 0.02 20.87 0.01 -4.24 0.07 0.56 -4.19 0.00 -4.19 -4.19 0.00 S
SIEL Financial Services 201406 11.32 0.00 0.01 0.00 -0.01 0.00 0.00 -0.01 0.00 -0.01 -0.01 -0.01 0.00 S
SIEL Financial Services 201409 11.32 0.01 0.00 -0.01 -0.01 -0.01 -0.01 -0.10 0.00 S
SIEL Financial Services 201412 11.32 0.01 0.00 -0.01 -0.01 -0.01 -0.01 -0.11 0.00 S
SIEL Financial Services 201503 11.32 0.01 0.00 -0.01 -0.01 -0.01 -0.01 -0.10 0.00 S
Silver Oak (India) 201406 3.79 2.17 2.06 0.11 0.02 0.03 0.06 0.02 0.05 0.05 0.12 0.00 S
Silver Oak (India) 201409 3.79 1.33 1.39 -0.05 0.02 0.03 -0.10 -0.10 -0.10 -0.26 0.00 S
Silver Oak (India) 201412 3.79 1.88 1.67 0.21 0.02 0.03 0.16 0.02 0.14 0.14 0.37 0.00 S
Silver Oak (India) 201503 3.79 1.14 1.39 0.04 -0.22 0.05 0.17 -0.44 -0.10 -0.34 -0.34 -0.91 0.00 S
Silverline Technologies 201406 59.99 1.63 1.79 -0.16 0.50 0.04 -0.70 -0.70 -0.70 -0.14 0.00 C
Silverline Technologies 201409 59.99 1.48 1.67 -0.20 0.48 0.04 -0.71 -0.71 -0.71 -0.12 0.00 C
Silverline Technologies 201412 59.99 1.26 1.34 -0.09 0.47 0.04 -0.59 -0.59 -0.59 -0.10 0.00 C
Silverline Technologies 201503 59.99 0.17 1.16 -0.99 0.35 0.03 -1.36 -1.36 -1.36 -0.23 0.00 C
Simbhaoli Sugars 201406 28.36 218.67 0.51 216.00 0.82 4.00 34.45 7.47 -37.92 -1.60 -36.32 -34.59 -12.52 0.00 C
Simbhaoli Sugars 201409 28.36 185.98 0.43 209.62 1.75 -21.46 38.43 9.48 -69.37 -0.04 -69.33 -62.74 -22.50 0.00 C
Simbhaoli Sugars 201412 28.36 269.30 2.05 288.56 0.53 -16.68 39.10 10.07 -70.85 0.57 -71.42 -67.20 -22.31 0.00 C
Simbhaoli Sugars 201503 28.36 363.94 1.09 361.80 4.24 7.47 34.80 8.34 -35.67 10.84 -46.51 -56.11 -20.15 0.00 C
Simran Farms 201406 3.79 98.29 0.00 97.02 1.27 0.70 0.45 0.12 0.02 0.10 0.10 0.25 0.00 S
Simran Farms 201409 3.79 102.31 0.01 106.35 -4.03 0.77 0.29 -5.08 -0.02 -5.06 -5.06 -13.35 0.00 S
Simran Farms 201412 3.79 130.92 0.01 127.03 3.91 0.99 0.38 2.54 2.54 2.54 6.70 0.00 S
Simran Farms 201503 3.79 112.49 0.14 108.06 4.58 0.98 0.64 2.95 -0.25 3.20 3.20 8.44 0.00 S
Skypak Service Specialists 201406 3.09 0.02 -0.02 -0.02 -0.02 -0.02 -0.01 0.00 S
Skypak Service Specialists 201409 3.08 0.05 -0.05 0.00 -0.05 -0.05 -0.05 -0.02 0.00 S
Skypak Service Specialists 201412 3.08 0.03 -0.03 0.01 -0.03 -0.03 -0.03 -0.01 0.00 S
Skypak Service Specialists 201503 3.09 0.10 0.06 0.04 0.00 0.02 0.02 0.02 0.02 0.01 0.00 S

Co_Name Year Equity N.Sale O.O.I T. Exp O.I PBIDT Int. Dep. PBT T.Tax PAT A.PAT EPS Div (%)
Exp
ecte
d R
esu
lts
on
14
Au
gu
st 2
015
Smilax Industries 201406 12.30 0.04 -0.04 -0.04 -0.04 -0.04 -0.04 0.00 S
Smilax Industries 201409 12.30 0.05 -0.05 -0.05 -0.05 -0.05 -0.04 0.00 S
Smilax Industries 201412 12.30 0.01 -0.01 -0.01 -0.01 -0.01 0.00 S
Smilax Industries 201503 12.30 0.01 -0.01 -0.01 -0.01 -0.01 0.00 S
Solid Stone Company 201406 5.38 10.90 10.03 0.02 0.89 0.38 0.14 0.37 0.10 0.27 0.27 0.51 6.00 S
Solid Stone Company 201409 5.38 13.12 12.15 0.08 1.04 0.41 0.14 0.50 0.19 0.31 0.31 0.58 6.00 S
Solid Stone Company 201412 5.38 14.31 13.23 0.01 1.08 0.43 0.14 0.51 0.17 0.35 0.35 0.64 6.00 S
Solid Stone Company 201503 5.38 19.20 18.06 0.11 1.24 0.58 -1.24 1.90 0.68 1.22 1.22 2.26 6.00 S
Som Datt Finance Corporation 201406 10.01 0.20 0.18 0.03 0.05 0.00 0.05 0.05 0.05 0.05 0.00 S
Som Datt Finance Corporation 201409 10.01 0.20 0.19 0.02 0.03 0.00 0.03 0.03 0.03 0.02 0.00 S
Som Datt Finance Corporation 201412 10.01 0.22 0.21 0.14 0.16 0.00 0.15 0.02 0.13 0.13 0.13 0.00 S
Som Datt Finance Corporation 201503 10.01 0.30 0.22 0.00 0.08 0.01 0.08 0.11 -0.03 -0.03 -0.03 0.00 S
Somi Conveyor Beltings 201406 11.78 15.48 0.03 12.62 0.13 3.01 0.43 1.25 1.34 0.46 0.88 0.88 0.75 0.00 S
Somi Conveyor Beltings 201409 11.78 21.02 0.01 17.96 0.18 3.25 0.51 1.27 1.47 0.50 0.97 0.97 0.82 0.00 S
Somi Conveyor Beltings 201412 11.78 23.61 0.01 20.37 0.13 3.38 0.53 1.28 1.56 0.44 1.12 1.12 0.95 0.00 S
Somi Conveyor Beltings 201503 11.78 14.59 0.02 12.02 0.89 3.48 0.65 1.33 1.50 0.20 1.30 1.30 1.10 0.00 S
Southern Ispat & Energy 201406 132.15 123.39 118.54 0.02 4.87 0.13 0.26 4.47 0.02 4.45 4.45 0.34 0.00 C
Southern Ispat & Energy 201409 132.15 286.42 273.97 12.46 0.12 0.26 12.07 0.02 12.05 12.05 0.91 0.00 C
Southern Ispat & Energy 201412 132.15 139.30 131.83 7.47 0.13 0.26 7.08 0.01 7.07 7.07 0.54 0.00 C
Southern Ispat & Energy 201503 132.15 121.02 119.02 1.99 0.12 0.26 1.61 -0.04 1.65 1.65 0.12 0.00 C
Sowbhagya Media 201406 10.93 0.64 0.60 0.05 0.09 0.09 0.00 0.00 0.00 0.00 0.00 S
Sowbhagya Media 201409 10.93 0.65 0.66 0.02 0.01 0.08 -0.07 -0.02 -0.05 -0.05 -0.04 0.00 S
Sowbhagya Media 201412 10.93 0.65 0.61 0.02 0.05 0.08 -0.03 -0.01 -0.02 -0.02 -0.02 0.00 S
Sowbhagya Media 201503 10.93 0.64 0.82 0.05 -0.13 0.00 0.07 -0.20 0.03 -0.23 -0.23 -0.21 0.00 S
Speciality Papers 201406 156.16 0.14 0.08 0.05 0.60 -0.55 -0.55 -0.55 -0.04 0.00 S
Speciality Papers 201409 156.16 0.13 0.05 0.07 0.60 -0.53 -0.53 -0.53 -0.03 0.00 S
Speciality Papers 201412 156.16 0.04 0.06 -0.02 0.60 -0.62 -0.62 -0.62 -0.04 0.00 S
Speciality Papers 201503 156.16 0.32 0.10 0.27 0.50 4.20 -3.70 -3.70 -3.70 -0.24 0.00 S
Spectacle Ventures 201406 5.15 0.02 -0.02 -0.02 -0.02 -0.02 0.00 S
Spectacle Ventures 201409 5.15 0.02 -0.02 -0.02 -0.02 -0.02 0.00 S
Spectacle Ventures 201412 5.15 0.02 -0.02 -0.02 -0.02 -0.02 0.00 S
Spectacle Ventures 201503 5.15 0.03 0.01 -0.03 -0.03 -0.03 -0.03 -0.01 0.00 S
Spenta International 201406 3.11 8.25 7.12 0.12 1.25 0.19 0.53 0.53 0.08 0.45 0.45 1.45 0.00 S
Spenta International 201409 3.11 10.53 9.38 0.12 1.27 0.15 0.55 0.57 0.14 0.43 0.43 1.39 0.00 S
Spenta International 201412 3.11 6.57 5.79 0.18 0.96 0.18 0.58 0.20 0.15 0.05 0.05 0.16 0.00 S
Spenta International 201503 2.76 10.22 9.09 0.16 1.28 0.22 0.56 0.50 0.18 0.32 0.32 1.15 0.00 S
Spisys 201412 9.05 1.99 2.13 0.00 -0.13 0.08 0.05 -0.26 0.00 -0.26 -0.26 -0.28 0.00 S
Spisys 201503 9.05 19.12 0.22 16.36 0.00 2.97 0.11 0.05 2.82 0.00 2.82 2.82 3.12 0.00 S
Splash Media & Infra 201406 9.37 0.16 0.05 0.11 0.02 0.00 0.09 0.09 0.09 0.01 0.00 S
Splash Media & Infra 201409 9.37 0.11 0.06 0.05 0.01 0.00 0.04 0.04 0.04 0.01 0.00 S
Splash Media & Infra 201412 9.37 0.17 0.07 0.10 0.01 0.00 0.09 0.09 0.09 0.01 0.00 S
Splash Media & Infra 201503 9.37 0.26 -0.12 0.13 0.02 0.01 0.00 0.01 0.01 0.01 0.00 S
SPML Infra 201406 7.33 271.27 3.60 245.86 15.36 44.37 40.53 3.23 0.61 -0.32 0.93 0.93 0.25 0.00 S
SPML Infra 201409 7.33 238.77 4.20 203.27 8.66 48.36 43.44 3.47 1.45 -0.48 1.93 1.93 0.53 0.00 S
SPML Infra 201412 7.33 295.99 5.38 261.29 9.75 49.83 38.03 3.23 8.57 1.01 7.56 7.56 2.06 0.00 S
SPML Infra 201503 7.33 554.56 3.21 532.67 34.83 59.93 50.12 3.10 6.71 3.37 3.34 3.34 0.91 0.00 S
Sportking India 201503 3.40 283.02 6.51 240.81 1.02 49.75 18.10 14.03 17.61 2.62 14.99 14.99 42.11 0.00 S

Co_Name Year Equity N.Sale O.O.I T. Exp O.I PBIDT Int. Dep. PBT T.Tax PAT A.PAT EPS Div (%)
Exp
ecte
d R
esu
lts
on
14
Au
gu
st 2
015
Springform Technology 201406 0.05 0.04 0.04 0.01 0.01 0.01 0.01 0.98 0.00 S
Springform Technology 201409 0.05 0.04 0.03 0.00 0.00 0.00 0.00 0.34 0.00 S
Springform Technology 201412 0.05 0.04 0.03 0.00 0.00 0.00 0.00 0.00 0.00 0.00 0.56 0.00 S
Springform Technology 201503 0.05 0.09 0.09 0.00 0.00 0.00 0.14 0.00 S
SPS International 201406 3.23 4.23 3.72 0.50 0.04 0.12 0.35 0.11 0.24 0.24 0.74 0.00 S
SPS International 201409 3.23 4.03 3.72 0.01 0.32 0.02 0.12 0.18 0.06 0.12 0.12 0.38 0.00 S
SPS International 201412 3.23 4.22 3.99 0.23 0.03 0.12 0.08 0.03 0.06 0.06 0.18 0.00 S
SPS International 201503 3.23 3.21 2.94 0.03 0.31 0.03 0.41 -0.13 -0.05 -0.09 -0.09 -0.27 0.00 S
Square Four Projects India 201406 9.81 0.02 0.00 -0.02 -0.02 -0.02 -0.02 -0.02 0.00 S
Square Four Projects India 201409 9.81 0.02 -0.02 -0.02 -0.02 -0.02 0.00 S
Square Four Projects India 201412 9.81 0.04 0.15 0.11 0.11 0.11 0.11 0.11 0.00 S
Square Four Projects India 201503 9.81 0.09 0.11 -0.02 -0.02 -0.02 -0.02 -0.02 0.00 S
Sree Rayalaseema Hi-Strength Hypo 201406 14.72 255.91 216.20 1.18 40.89 10.44 12.04 19.90 2.52 17.39 4.54 3.08 0.00 C
Sree Rayalaseema Hi-Strength Hypo 201409 14.72 95.89 85.47 0.41 10.82 2.38 3.02 4.47 1.60 2.87 2.87 7.42 0.00 S
Sree Rayalaseema Hi-Strength Hypo 201412 14.72 101.40 90.71 0.31 11.00 2.06 3.04 5.12 1.67 3.45 3.45 2.35 0.00 S
Sree Rayalaseema Hi-Strength Hypo 201503 14.72 100.27 93.74 0.99 7.51 4.82 0.67 6.71 1.70 5.00 5.00 3.40 0.00 S
Sreeleathers 201406 25.16 15.59 12.44 0.13 3.28 0.35 0.29 2.65 0.97 1.68 1.68 0.67 2.50 S
Sreeleathers 201409 25.16 21.64 17.80 0.24 4.08 0.36 0.29 3.43 1.25 2.18 2.18 0.87 2.50 S
Sreeleathers 201412 25.16 14.87 12.26 0.28 2.89 0.34 0.29 2.27 0.84 1.43 1.43 0.57 2.50 S
Sreeleathers 201503 25.16 14.66 11.56 1.60 4.70 0.32 0.26 4.12 0.98 3.15 3.15 1.25 2.50 S
Sri Arumuga Enterprise 201406 1.00 2.41 0.16 2.15 0.03 0.45 0.06 0.03 0.36 0.08 0.27 0.27 2.73 10.00 S
Sri Arumuga Enterprise 201409 1.00 1.11 0.08 0.98 0.01 0.21 0.06 0.03 0.11 0.04 0.07 0.07 0.73 10.00 S
Sri Arumuga Enterprise 201412 1.00 1.02 0.05 0.84 0.01 0.23 0.11 0.02 0.11 0.03 0.08 0.08 0.75 10.00 S
Sri Arumuga Enterprise 201503 1.00 1.82 0.14 1.96 0.03 0.03 0.07 0.05 -0.10 -0.01 -0.08 -0.08 -0.84 10.00 S
Sri Ganapathy Mills Company 201406 6.67 4.35 0.10 4.47 0.02 0.00 0.33 0.38 -0.75 -0.75 -0.75 -1.12 0.00 S
Sri Ganapathy Mills Company 201409 6.67 3.77 0.37 4.28 0.02 -0.12 0.49 0.39 -1.05 -1.05 -1.05 -1.58 0.00 S
Sri Ganapathy Mills Company 201412 6.67 2.05 2.43 0.02 -0.36 0.39 0.38 -1.10 -1.10 -1.10 -1.65 0.00 S
Sri Ganapathy Mills Company 201503 6.67 0.76 0.09 1.46 0.02 -0.60 0.48 -0.19 -2.04 -2.04 -2.04 -3.06 0.00 S
SSK Lifestyles 201406 3.02 0.16 0.17 -0.01 0.04 -0.05 -0.05 -0.05 -0.15 0.00 S
SSK Lifestyles 201409 3.02 0.10 0.03 0.17 -0.03 0.04 -0.07 -0.07 -0.07 -0.23 0.00 S
SSK Lifestyles 201412 7.12 0.52 0.58 -0.06 0.04 -0.10 -0.10 -0.10 -0.14 0.00 S
SSK Lifestyles 201503 7.12 0.01 -0.01 0.09 -0.11 -0.23 -0.11 -0.31 0.00 S
Star Paper Mills 201406 15.61 59.86 1.30 60.20 0.14 1.10 1.16 1.32 -1.38 0.06 -1.44 -1.44 -0.92 0.00 S
Star Paper Mills 201409 15.61 65.72 1.93 63.07 0.26 4.84 1.12 1.11 2.61 -0.06 2.67 2.67 1.71 0.00 S
Star Paper Mills 201412 15.61 69.39 1.12 66.34 0.36 4.53 1.08 1.23 2.22 2.22 2.22 1.42 0.00 S
Star Paper Mills 201503 15.61 70.59 1.39 65.86 0.18 6.30 1.04 1.20 4.06 -8.03 12.09 12.09 7.75 0.00 S
Starlite Components 201406 5.00 3.22 3.34 0.00 -0.12 0.21 0.06 -0.39 -0.39 -0.39 -0.78 0.00 S
Starlite Components 201409 5.00 8.10 7.70 0.00 0.40 0.24 0.06 0.10 0.10 0.10 0.20 0.00 S
Starlite Components 201412 9.00 8.77 0.01 8.68 0.00 0.10 0.06 0.07 -0.03 -0.03 -0.03 -0.06 0.00 S
Starlite Components 201503 9.00 6.98 0.01 6.79 0.37 0.58 0.21 1.20 -0.15 1.34 1.34 2.21 0.00 S
Starvox Electronics 201406 0.91 0.06 0.00 0.07 0.00 -0.01 0.00 -0.01 -0.01 -0.01 0.00 S
Starvox Electronics 201409 0.95 0.04 0.03 0.18 -0.11 0.00 -0.11 -0.11 -0.11 0.00 S
Starvox Electronics 201412 0.95 0.02 0.01 0.07 -0.03 -0.03 -0.03 -0.03 0.00 S
Starvox Electronics 201503 0.95 0.16 0.04 0.40 -0.21 -0.21 -0.21 -0.21 -2.20 0.00 S
Steel Authority Of India 201406 4130.53 11195.68 145.52 10211.38 195.78 1325.60 304.95 407.95 612.70 82.82 529.88 529.88 1.28 20.00 S
Steel Authority Of India 201409 4130.53 11565.59 113.08 10342.26 161.97 1498.38 355.78 391.66 750.94 101.45 649.49 649.49 1.57 20.00 S
Steel Authority Of India 201412 4130.53 10977.41 129.91 9899.21 345.21 1553.32 366.57 466.66 720.08 140.99 579.09 579.09 1.40 20.00 S
Steel Authority Of India 201503 4130.53 11469.37 115.74 10655.25 279.26 1209.12 426.92 507.01 275.19 -59.03 334.22 334.22 0.81 20.00 S

Co_Name Year Equity N.Sale O.O.I T. Exp O.I PBIDT Int. Dep. PBT T.Tax PAT A.PAT EPS Div (%)
Exp
ecte
d R
esu
lts
on
14
Au
gu
st 2
015
Stellant Securities (India) 201406 3.70 0.01 -0.01 -0.01 -0.01 -0.01 0.00 S
Stellant Securities (India) 201409 3.70 0.01 -0.01 -0.01 -0.01 -0.01 0.00 S
Stellant Securities (India) 201412 3.70 0.00 0.00 0.00 0.00 0.00 0.00 0.00 S
Stellant Securities (India) 201503 3.70 0.68 0.90 0.02 -0.20 0.01 -0.21 -0.21 -0.21 -0.56 0.00 S
Sterling Biotech 201406 26.80 184.36 1.30 147.70 37.96 127.52 64.06 -153.61 -49.84 -110.27 -103.77 -4.11 0.00 S
Sterling Biotech 201409 27.21 172.75 1.01 146.00 27.76 128.58 63.83 -164.64 -53.42 -116.72 -111.22 -4.29 0.00 S
Sterling Biotech 201412 27.21 121.63 0.75 109.93 12.45 87.60 84.80 -159.95 -51.89 -127.38 -108.06 -4.68 0.00 S
Sterling Biotech 201503 27.21 100.63 1.43 88.90 13.15 76.39 70.50 -133.74 -43.39 -90.35 -90.35 -3.32 0.00 S
Suchak Trading 201406 11.73 0.04 0.04 0.03 0.03 0.01 0.02 0.02 0.02 0.00 S
Suchak Trading 201409 11.73 0.06 0.05 0.03 0.05 0.01 0.04 0.04 0.04 0.00 S
Suchak Trading 201412 11.73 0.32 0.30 0.04 0.05 0.01 0.04 0.04 0.04 0.00 S
Suchak Trading 201503 11.73 4.16 4.16 0.01 0.00 0.03 -0.03 0.05 -0.08 -0.08 0.00 S
Suchitra Finance & Trading Co 201406 9.32 0.02 0.10 0.00 -0.07 0.00 0.00 -0.08 0.00 -0.08 -0.08 -0.08 0.00 S
Suchitra Finance & Trading Co 201409 9.32 0.05 0.02 0.03 0.03 0.03 0.03 0.03 0.00 S
Suchitra Finance & Trading Co 201412 9.32 0.11 0.04 0.07 0.02 0.06 0.00 0.06 0.06 0.06 0.00 S
Suchitra Finance & Trading Co 201503 9.32 0.16 0.05 0.11 0.08 0.00 0.03 0.02 0.02 0.02 0.02 0.00 S
Sudar Industries 201406 22.50 253.16 0.13 223.93 29.36 9.57 2.85 16.94 5.50 11.44 11.44 5.09 0.00 S
Sudar Industries 201409 22.50 302.16 0.62 272.09 0.01 30.69 8.56 2.88 19.25 6.25 13.01 13.01 5.78 0.00 S
Sudar Industries 201412 22.50 307.17 0.84 278.13 29.88 11.18 2.90 15.80 5.13 10.67 10.67 4.74 0.00 S
Sudar Industries 201503 22.50 135.53 0.22 161.86 -26.11 10.34 2.84 -39.28 -39.28 -39.28 -17.46 0.00 C
Sudarshan Chemical Industries 201406 6.92 267.25 238.76 8.83 37.32 11.44 9.70 16.18 4.60 11.58 11.58 16.73 87.50 S
Sudarshan Chemical Industries 201409 6.92 301.75 1.21 267.31 4.62 40.27 6.85 9.97 23.45 7.01 16.44 16.44 23.75 87.50 S
Sudarshan Chemical Industries 201412 13.85 243.98 1.54 218.39 4.16 31.29 6.78 9.64 14.87 4.05 10.82 10.82 1.56 87.50 S
Sudarshan Chemical Industries 201503 13.85 269.83 2.74 254.68 5.42 23.31 7.74 10.45 5.12 1.55 3.57 3.57 0.51 87.50 S
Sudev Industries 201406 3.50 0.01 -0.01 -0.01 -0.01 -0.01 0.00 S
Sudev Industries 201409 3.50 0.00 0.00 0.00 0.00 0.00 0.00 S
Sudev Industries 201412 3.50 0.00 0.00 0.00 0.00 0.00 0.00 S
Sudev Industries 201503 3.50 0.01 0.00 0.00 0.00 0.00 0.00 0.00 S
Sundram Fasteners 201406 21.01 566.81 11.80 494.06 1.11 85.66 5.54 27.50 52.62 14.50 38.12 38.12 1.81 175.00 S
Sundram Fasteners 201409 21.01 606.34 12.42 534.38 3.10 87.48 5.43 15.19 66.86 15.77 51.09 51.09 2.44 175.00 S
Sundram Fasteners 201412 21.01 575.46 13.16 530.58 5.18 63.22 5.47 21.76 35.99 5.86 30.13 30.13 1.43 175.00 S
Sundram Fasteners 201503 21.01 581.78 18.62 553.96 13.97 60.41 4.94 23.87 21.60 5.63 15.97 15.97 0.76 175.00 S
Sungold Capital 201406 18.40 0.13 0.00 0.11 0.02 0.00 0.01 0.00 0.01 0.01 0.01 0.00 S
Sungold Capital 201409 18.40 0.16 0.01 0.15 0.02 0.00 0.02 0.01 0.02 0.02 0.01 0.00 S
Sungold Capital 201412 18.40 0.16 0.01 0.14 0.02 0.00 0.02 0.01 0.01 0.01 0.01 0.00 S
Sungold Capital 201503 18.40 0.26 0.00 0.20 0.07 0.02 0.05 0.02 0.03 0.03 0.17 0.00 S
Sunil Industries 201406 4.20 30.21 28.95 0.14 1.39 0.70 0.20 0.49 0.15 0.34 0.34 0.80 0.00 S
Sunil Industries 201409 4.20 40.21 38.06 0.07 2.22 0.76 0.34 1.11 0.35 0.76 0.76 1.80 0.00 S
Sunil Industries 201412 4.20 100.74 98.67 0.04 2.10 0.77 0.27 1.07 0.36 0.71 0.71 1.69 0.00 S
Sunil Industries 201503 4.20 30.59 29.21 0.23 1.62 0.76 0.36 0.50 0.30 0.20 0.20 0.47 0.00 S
Sunraj Diamond Exports 201406 5.33 10.53 9.90 0.04 0.67 0.29 0.04 0.34 0.12 0.22 0.22 0.41 0.00 S
Sunraj Diamond Exports 201409 5.33 10.21 9.53 0.06 0.75 0.14 0.04 0.57 0.18 0.38 0.38 0.72 0.00 S
Sunraj Diamond Exports 201412 5.33 1.51 1.27 0.03 0.28 0.13 0.04 0.11 0.05 0.07 0.07 0.12 0.00 S
Sunraj Diamond Exports 201503 5.33 -0.07 0.39 0.02 -0.44 0.60 0.02 -1.05 -0.04 -1.01 -1.01 -1.90 0.00 S
Sunrise Asian 201406 45.66 38.28 37.89 0.39 0.01 0.38 0.12 0.26 0.26 0.06 0.00 S
Sunrise Asian 201409 45.66 42.53 42.08 0.00 0.44 0.00 0.02 0.43 0.14 0.28 0.28 0.06 0.00 S
Sunrise Asian 201412 45.66 39.55 39.03 0.00 0.54 0.02 0.52 0.20 0.32 0.32 0.07 0.00 S
Sunrise Asian 201503 45.66 49.53 0.33 49.73 0.13 0.13 0.04 0.09 0.09 0.20 0.00 S

Co_Name Year Equity N.Sale O.O.I T. Exp O.I PBIDT Int. Dep. PBT T.Tax PAT A.PAT EPS Div (%)
Exp
ecte
d R
esu
lts
on
14
Au
gu
st 2
015
Superhouse 201406 11.42 174.53 0.93 154.25 0.24 21.45 5.28 2.87 13.23 4.61 8.63 8.63 7.82 15.00 S
Superhouse 201409 11.42 196.47 1.04 173.34 0.26 24.42 4.55 4.52 15.10 5.28 9.82 9.82 8.90 15.00 S
Superhouse 201412 11.42 168.64 0.98 147.57 0.30 22.35 5.00 3.50 13.39 4.61 8.78 8.78 7.96 15.00 S
Superhouse 201503 11.42 166.98 1.15 153.61 0.51 15.03 4.46 2.36 9.21 3.97 5.24 5.24 4.76 15.00 S
Superspace Infrastructure 201406 21.63 0.33 0.12 0.21 0.00 0.21 0.21 0.21 0.01 0.00 S
Superspace Infrastructure 201409 21.63 0.65 0.12 0.54 0.00 0.00 0.54 0.18 0.36 0.36 0.02 0.00 S
Superspace Infrastructure 201412 21.63 1.42 0.44 1.44 0.43 0.00 0.43 0.14 0.43 0.29 0.02 0.00 S
Supreme Infrastructure India 201406 20.09 381.11 317.20 1.19 65.10 37.96 10.27 16.86 5.47 11.39 11.39 5.67 15.00 S
Supreme Infrastructure India 201409 20.09 321.51 271.19 3.69 54.00 41.29 8.89 3.83 1.24 2.59 2.59 1.29 15.00 S
Supreme Infrastructure India 201412 20.09 400.93 340.02 2.95 63.86 49.42 9.21 5.23 1.70 3.53 3.53 1.76 15.00 S
Supreme Infrastructure India 201503 25.70 420.17 345.35 2.77 77.59 61.27 8.94 7.39 7.65 -0.26 -0.26 -0.12 15.00 S
Surya Funcity 201412 5.37 0.79 0.63 0.16 0.13 0.14 -0.11 -0.11 -0.11 -0.17 0.00 S
Surya Industrial Corporation 201406 4.47 0.01 -0.01 -0.01 -0.01 -0.01 -0.03 0.00 S
Surya Industrial Corporation 201409 4.47 0.02 0.02 0.01 0.01 0.01 0.01 0.01 0.00 S
Surya Industrial Corporation 201412 12.33 0.14 -0.14 -0.14 -0.14 -0.14 -0.11 0.00 S
Surya Industrial Corporation 201503 12.33 7.38 7.32 0.13 0.18 0.18 0.18 0.18 0.01 0.00 S
Suryakrupa Finance 201406 1.00 0.02 0.02 0.00 -0.06 -0.06 -0.06 -0.06 0.00 S
Suryakrupa Finance 201409 1.00 0.01 0.00 0.00 0.00 0.00 0.00 0.00 S
Suryakrupa Finance 201412 1.00 0.01 -0.01 0.01 0.01 0.01 -0.01 0.00 S
Suryakrupa Finance 201503 1.00 0.23 0.20 0.03 0.03 0.03 0.03 0.29 0.00 S
Suryanagri Fin-Lease 201406 3.37 0.16 0.18 -0.02 -0.02 -0.02 -0.02 -0.01 0.00 S
Suryanagri Fin-Lease 201409 3.37 0.08 0.09 -0.01 -0.01 -0.01 -0.01 0.00 S
Suryanagri Fin-Lease 201412 3.37 0.52 0.51 0.02 0.02 0.02 0.02 0.00 S
Suryanagri Fin-Lease 201503 3.37 3.17 3.15 0.02 0.02 0.01 0.02 0.01 0.00 S
Suven Life Sciences 201406 11.68 141.53 83.65 1.08 58.96 1.16 2.39 51.35 16.61 34.74 34.74 2.97 60.00 S
Suven Life Sciences 201409 11.68 139.83 101.44 1.42 39.81 1.33 2.48 32.78 7.94 24.84 24.84 2.13 60.00 S
Suven Life Sciences 201412 12.73 128.83 80.50 2.27 50.60 1.01 2.45 44.78 12.55 32.23 32.23 2.73 60.00 S
Suven Life Sciences 201503 12.73 110.66 86.16 3.81 28.31 1.21 2.45 22.65 5.70 16.95 16.95 1.41 60.00 S
SVP Global Ventures 201406 0.77 11.32 11.25 0.07 0.04 0.03 0.03 0.03 0.41 0.00 S
SVP Global Ventures 201409 1.27 11.63 11.56 0.07 0.04 0.04 0.04 0.04 0.29 0.00 S
SVP Global Ventures 201412 1.27 0.27 0.06 0.28 0.05 0.04 0.01 0.01 0.01 0.09 0.00 S
SVP Global Ventures 201503 1.27 14.00 0.03 13.79 0.24 0.03 0.21 0.11 0.11 0.11 0.85 0.00 S
Syncom Healthcare 201406 40.00 14.39 15.34 0.64 -0.31 1.03 0.92 -2.26 -2.26 -2.26 -0.57 0.00 S
Syncom Healthcare 201409 40.00 23.47 22.25 0.90 2.12 0.91 0.96 0.25 0.25 0.25 0.06 0.00 S
Syncom Healthcare 201412 40.00 12.05 10.70 0.55 1.90 1.19 0.94 -0.23 -0.23 -0.23 -0.06 0.00 S
Syncom Healthcare 201503 40.00 11.96 12.00 0.90 0.85 1.44 2.52 -3.10 -1.53 -1.57 -1.57 -0.39 0.00 S
Synthiko Foils 201406 0.86 4.15 0.10 3.96 0.01 0.30 0.13 0.04 0.12 0.03 0.09 0.09 1.09 0.00 S
Synthiko Foils 201409 0.86 6.19 0.08 5.90 0.08 0.45 0.20 0.05 0.20 0.07 0.14 0.14 -1.59 0.00 S
Synthiko Foils 201412 0.86 5.03 0.06 4.69 0.00 0.40 0.22 0.05 0.13 0.05 0.09 0.09 1.01 0.00 S
Synthiko Foils 201503 0.86 5.32 0.17 5.15 0.03 0.36 0.23 0.07 0.07 -0.06 0.13 0.13 1.53 0.00 S
Syschem (India) 201406 15.91 2.72 3.21 0.02 -0.47 0.84 0.54 -1.84 -1.84 -1.84 -0.12 0.00 S
Syschem (India) 201409 15.91 1.12 1.54 0.02 -0.40 1.01 0.54 -1.96 -1.96 -1.96 -0.12 0.00 S
Syschem (India) 201412 15.91 0.88 1.38 0.04 -0.47 1.05 0.54 -2.05 -2.05 -2.05 -0.13 0.00 S
Syschem (India) 201503 15.91 6.65 7.83 2.09 0.92 0.31 0.61 -1.37 1.98 1.98 0.12 0.00 S
T&I Global 201406 5.07 15.96 0.28 15.73 0.16 0.66 0.00 0.18 0.48 0.48 0.48 0.94 5.00 S
T&I Global 201409 5.07 11.94 0.44 11.41 -0.12 0.84 0.01 0.29 0.55 0.00 0.55 0.55 1.08 5.00 S
T&I Global 201412 5.07 19.94 0.98 20.30 0.04 0.65 0.03 0.24 0.39 0.00 0.39 0.39 0.76 5.00 S
T&I Global 201503 5.07 24.06 -0.51 23.72 0.78 0.60 0.28 0.21 0.12 0.61 -0.49 -0.49 -0.97 5.00 S

Co_Name Year Equity N.Sale O.O.I T. Exp O.I PBIDT Int. Dep. PBT T.Tax PAT A.PAT EPS Div (%)
Exp
ecte
d R
esu
lts
on
14
Au
gu
st 2
015
Taaza International 201406 7.26 66.52 62.99 0.02 3.54 2.71 0.04 0.80 0.13 0.67 0.63 0.86 0.00 C
Taaza International 201409 7.26 106.33 101.26 0.04 5.11 3.94 0.03 1.14 0.47 0.67 0.62 0.92 0.00 C
Taaza International 201412 7.26 80.58 76.20 0.03 4.41 3.24 0.03 1.13 0.54 0.59 0.54 0.81 0.00 C
Taaza International 201503 7.26 158.86 157.85 7.00 8.00 6.54 0.10 1.37 -0.33 1.70 1.58 2.35 0.00 C
Taneja Aerospace & Aviation 201406 12.47 7.00 5.73 0.82 2.09 1.97 0.96 -0.84 -0.84 -0.84 -0.34 0.00 S
Taneja Aerospace & Aviation 201409 12.47 8.49 7.79 0.68 1.38 1.74 0.99 -1.36 -1.36 -1.36 -0.54 0.00 S
Taneja Aerospace & Aviation 201412 12.47 8.18 12.28 0.74 -3.36 1.37 0.99 -5.71 -5.71 -5.71 -2.29 0.00 S
Taneja Aerospace & Aviation 201503 12.47 8.02 12.07 1.34 -2.70 1.87 0.52 -5.18 -5.56 0.37 0.38 0.15 0.00 S
Tarai Foods 201406 14.34 0.55 0.01 0.51 0.04 0.00 0.13 -0.08 -0.08 -0.08 -0.06 0.00 S
Tarai Foods 201409 14.34 0.60 0.80 -0.19 0.13 -0.32 -0.32 -0.32 -0.22 0.00 S
Tarai Foods 201412 14.34 0.52 0.51 0.01 0.00 0.11 -0.20 -0.20 -0.20 -0.14 0.00 S
Tarai Foods 201503 14.34 1.58 0.01 1.73 0.00 -0.14 0.38 -0.52 10.33 -0.52 7.20 0.00 S
Tarang Projects & Consultant 201406 14.40 0.06 0.07 0.02 0.00 0.00 0.00 0.00 0.00 S
Tarang Projects & Consultant 201409 14.40 0.09 0.08 0.03 0.04 0.04 0.04 0.04 0.00 S
Tarang Projects & Consultant 201412 14.40 0.10 0.12 0.15 0.13 0.13 0.13 0.13 0.00 S
Tarang Projects & Consultant 201503 14.40 35.60 35.15 0.03 0.47 0.02 0.46 0.20 0.26 0.26 0.18 0.00 S
Tarapur Transformers 201406 19.50 12.34 12.89 0.33 -0.22 1.60 1.75 -3.56 -3.56 -3.56 -1.83 0.00 S
Tarapur Transformers 201409 19.50 13.06 13.52 0.40 -0.06 1.68 0.52 -2.26 -2.26 -2.26 -1.16 0.00 S
Tarapur Transformers 201412 19.50 7.83 8.37 0.62 0.07 0.07 0.51 -0.50 -0.50 -0.50 -0.26 0.00 S
Tarapur Transformers 201503 19.50 4.07 5.29 0.54 -0.68 0.19 0.48 -1.34 -1.34 -1.34 -0.69 0.00 S
Tarrif Cine & Finance 201406 0.25 0.00 0.01 0.00 0.00 0.00 0.00 0.00 -0.13 0.00 S
Tarrif Cine & Finance 201409 0.25 0.00 0.02 0.00 -0.01 -0.01 -0.01 -0.01 -0.52 0.00 S
Tarrif Cine & Finance 201412 0.25 0.00 0.01 0.00 0.00 0.00 0.00 0.00 -0.15 0.00 S
Tarrif Cine & Finance 201503 0.25 0.00 0.01 0.03 0.02 0.02 0.02 0.02 0.92 0.00 S
Tej Infoways 201406 3.49 5.42 5.25 0.17 0.01 0.13 0.04 0.01 0.03 0.03 0.08 0.00 S
Tej Infoways 201409 3.49 5.62 5.45 0.17 0.01 0.13 0.04 0.01 0.03 0.03 0.08 0.00 S
Tej Infoways 201412 3.49 6.15 5.98 0.17 0.00 0.13 0.04 0.01 0.03 0.03 0.10 0.00 S
Tej Infoways 201503 3.49 6.19 5.32 0.87 0.01 0.73 0.14 0.04 0.10 0.10 0.28 0.00 S
TeleCanor Global 201406 9.61 0.01 0.09 0.00 -0.08 0.29 0.05 -0.42 0.00 -0.42 -0.42 -0.43 0.00 S
TeleCanor Global 201409 8.91 0.01 0.10 -0.10 0.29 0.05 -0.43 -0.43 -0.43 -0.48 0.00 S
TeleCanor Global 201412 9.61 0.00 0.09 -0.08 0.29 0.04 -0.41 -0.41 -0.41 -0.42 0.00 S
TeleCanor Global 201503 9.61 0.01 0.03 -0.03 0.29 0.03 -0.34 -0.34 -0.34 -0.36 0.00 S
Terai Tea Company 201406 6.90 13.34 10.24 0.09 3.20 1.04 0.44 1.72 1.72 1.72 0.00 S
Terai Tea Company 201409 6.90 25.96 22.21 0.07 3.82 1.44 0.46 1.91 1.91 1.91 0.00 S
Terai Tea Company 201412 6.90 22.15 21.65 0.06 0.55 1.22 0.46 -1.13 -1.13 -1.13 0.00 S
Terai Tea Company 201503 6.90 58.12 59.06 0.78 -0.16 1.15 0.39 -1.69 0.21 -1.91 -1.91 0.00 S
Thakkers Developers 201406 9.00 9.98 0.14 4.81 0.08 5.38 2.81 0.28 2.30 0.26 2.03 2.03 2.26 0.00 S
Thakkers Developers 201409 9.00 9.18 0.21 4.64 0.05 4.80 2.88 0.29 1.63 0.01 1.62 1.62 1.80 0.00 S
Thakkers Developers 201412 9.00 8.93 0.33 5.47 0.05 3.85 2.80 0.30 0.75 -0.06 0.82 0.82 0.91 0.00 C
Thakkers Developers 201503 9.00 17.58 0.22 8.20 0.03 9.62 2.69 0.29 6.63 4.01 2.63 2.63 2.92 0.00 S
Thomas Scott (India) 201406 3.39 7.09 0.01 6.87 0.23 0.00 0.01 0.21 0.21 0.21 0.63 0.00 S
Thomas Scott (India) 201409 3.39 5.65 -0.01 6.26 0.01 -0.62 0.00 0.01 -0.63 -0.63 -0.63 -1.86 0.00 S
Thomas Scott (India) 201412 3.39 2.65 3.28 0.00 -0.62 0.01 -0.64 -0.64 -0.64 -1.87 0.00 S
Thomas Scott (India) 201503 3.39 10.74 0.09 14.34 -3.51 0.00 0.08 -3.60 -3.60 -3.60 -10.61 0.00 S
Tilaknagar Industries 201406 124.27 163.78 50.19 146.34 0.56 68.19 20.34 8.51 39.34 8.45 30.89 30.89 2.49 8.00 C
Tilaknagar Industries 201409 124.56 160.73 20.60 151.06 0.51 30.78 21.42 8.52 0.83 0.27 0.56 0.56 0.05 8.00 C
Tilaknagar Industries 201412 124.67 178.95 23.34 170.71 0.82 32.39 22.69 8.51 1.18 2.18 -0.99 -0.99 -0.08 8.00 C
Tilaknagar Industries 201503 124.76 124.24 26.41 185.18 0.47 -34.06 33.00 2.13 -69.19 1.43 -70.62 -70.61 -4.72 8.00 C

Co_Name Year Equity N.Sale O.O.I T. Exp O.I PBIDT Int. Dep. PBT T.Tax PAT A.PAT EPS Div (%)
Exp
ecte
d R
esu
lts
on
14
Au
gu
st 2
015
Tips Industries 201406 15.36 8.16 5.61 0.38 2.93 2.54 0.47 -0.08 -0.08 -0.08 -0.05 10.00 S
Tips Industries 201409 15.36 78.00 57.96 0.37 20.41 2.87 0.43 17.10 3.57 13.53 13.53 8.81 10.00 S
Tips Industries 201412 15.36 5.98 6.81 0.37 -0.46 3.01 0.43 -3.90 -0.82 -3.08 -3.08 -2.01 10.00 S
Tips Industries 201503 15.36 10.21 16.81 0.34 -6.26 3.12 0.43 -9.81 -2.14 -7.67 -7.67 -4.99 10.00 S
Tirupati Foam 201406 4.41 20.53 18.43 0.16 2.27 1.30 0.60 0.37 -0.07 0.43 0.43 0.98 15.00 S
Tirupati Foam 201409 4.41 19.52 17.18 0.02 2.36 1.30 0.62 0.45 -0.05 0.50 0.50 1.12 15.00 S
Tirupati Foam 201412 4.41 23.58 21.18 0.10 2.51 1.29 0.64 0.58 0.39 0.19 0.19 0.42 15.00 S
Tirupati Foam 201503 4.41 22.66 19.82 0.09 2.93 1.30 1.01 0.62 0.42 0.20 0.20 0.46 15.00 S
Tirupati Industries (India) 201406 5.43 9.76 0.02 9.03 0.01 0.76 0.31 0.04 0.42 0.08 0.34 0.34 0.63 0.00 S
Tirupati Industries (India) 201409 5.67 10.38 9.76 0.65 1.27 0.28 0.04 0.96 0.18 0.78 0.78 1.37 0.00 S
Tirupati Industries (India) 201412 5.67 14.77 0.03 14.46 0.74 1.08 0.28 0.04 1.14 0.22 0.92 0.92 1.63 0.00 S
Tirupati Inks 201406 25.10 104.61 97.26 0.16 7.51 3.56 0.45 3.50 1.14 2.37 2.37 0.94 0.00 S
Tirupati Inks 201409 25.10 80.57 80.97 0.15 -0.24 4.48 0.46 -5.18 -1.14 -4.05 -4.05 -1.61 0.00 S
Tirupati Inks 201412 25.10 48.51 54.12 0.20 -5.42 3.93 0.46 -9.81 -9.81 -9.81 -3.91 0.00 S
Tirupati Inks 201503 25.10 30.99 44.61 0.11 -13.51 4.07 0.42 -18.00 -18.00 -18.00 -7.17 0.00 S
Total Hospitality 201406 8.06 0.00 0.09 0.00 -0.09 0.00 -0.09 0.00 -0.09 -0.09 -0.11 0.00 S
Total Hospitality 201409 8.06 0.08 -0.08 -0.08 -0.08 -0.08 -0.10 0.00 S
Total Hospitality 201412 8.06 0.08 -0.08 -0.08 -0.08 -0.08 -0.10 0.00 S
Total Hospitality 201503 8.06 0.06 -0.06 -0.06 -0.06 -0.06 -0.07 0.00 S
Trans Financial Resources 201406 5.02 0.01 0.00 0.00 0.01 0.00 0.01 0.00 0.01 0.01 0.02 0.00 S
Trans Financial Resources 201409 5.02 0.01 0.00 0.00 0.01 0.00 0.01 0.00 0.01 0.01 0.02 0.00 S
Trans Financial Resources 201412 5.02 0.01 0.00 0.01 0.01 0.01 0.01 0.00 S
Trans Financial Resources 201503 5.02 0.03 0.00 0.02 0.01 0.01 0.01 0.01 0.01 0.00 S
Transchem 201406 12.24 0.17 0.58 0.41 0.38 0.03 0.03 0.03 0.02 0.00 S
Transchem 201409 12.24 0.26 0.50 0.24 0.02 0.36 -0.14 -0.14 -0.14 -0.11 0.00 S
Transchem 201412 12.24 0.19 0.51 0.32 0.38 -0.06 -0.06 -0.06 -0.05 0.00 S
Transchem 201503 12.24 0.17 0.51 0.34 -0.07 0.29 0.29 0.29 0.23 0.00 S
Transgene Biotek 201406 75.77 0.11 0.53 -0.42 0.00 4.29 -4.71 -4.71 -4.71 -0.62 0.00 S
Transgene Biotek 201409 75.77 0.09 0.70 -0.62 4.32 -4.93 -4.93 -4.93 -0.65 0.00 S
Transgene Biotek 201412 75.77 0.08 0.38 -0.30 0.32 4.33 -4.95 -4.95 -4.95 -0.65 0.00 S
Transgene Biotek 201503 75.77 0.06 0.42 -0.37 0.00 4.24 -4.60 -4.60 -4.60 -0.61 0.00 S
Trend Electronics 201406 7.50 368.14 0.10 359.21 2.03 11.06 17.16 5.60 -11.70 -3.03 -8.67 -8.67 -11.56 0.00 S
Trend Electronics 201409 7.50 373.52 0.09 361.44 0.23 12.40 17.13 5.63 -10.36 -2.25 -8.11 -8.11 -10.81 0.00 S
Trend Electronics 201412 7.50 372.27 0.13 359.07 0.09 13.42 17.29 5.01 -8.88 -1.32 -7.56 -7.56 -10.08 0.00 S
Trend Electronics 201503 7.50 366.83 0.09 352.01 0.86 15.77 18.23 5.08 -7.54 -1.50 -6.04 -6.04 -8.05 0.00 S
TRF 201406 11.00 296.03 293.49 2.17 4.72 14.12 3.37 -3.63 1.99 -5.62 -6.19 -5.62 0.00 C
TRF 201409 11.00 246.46 235.97 0.55 11.03 14.30 3.18 -6.45 2.60 -9.05 -9.28 -8.43 0.00 C
TRF 201412 11.00 260.04 261.40 1.28 -0.08 15.13 3.61 22.68 1.70 20.99 20.64 18.75 0.00 C
Tricom Fruit Products 201406 15.94 0.08 0.27 -0.19 1.37 0.64 -2.77 -2.77 -2.77 -1.74 0.00 S
Tricom Fruit Products 201409 17.09 0.00 0.01 0.26 0.00 -0.25 1.41 0.64 -2.30 -2.30 -2.30 -1.34 0.00 S
Tricom Fruit Products 201412 17.09 0.07 0.28 0.00 -0.20 1.45 0.64 -2.29 -2.29 -2.29 -1.34 0.00 S
Tricom Fruit Products 201503 17.09 0.12 0.64 0.03 -0.49 1.50 0.62 -2.61 -2.61 -2.61 -1.52 0.00 S
Tricom India 201406 15.84 13.14 12.03 0.08 1.19 2.33 5.08 -6.21 0.14 -6.36 -6.36 -0.80 0.00 C
Tricom India 201409 15.84 12.46 12.51 2.22 2.17 0.50 4.81 -3.15 0.52 -3.66 -3.66 -0.46 0.00 C
Tricom India 201412 15.84 7.20 6.85 2.31 2.66 1.05 4.68 -15.03 0.63 -15.66 -15.66 -1.98 0.00 C
Tricom India 201503 15.84 5.55 6.11 0.03 -0.53 2.56 4.57 -16.20 0.62 -16.83 -16.83 -2.12 0.00 C

Co_Name Year Equity N.Sale O.O.I T. Exp O.I PBIDT Int. Dep. PBT T.Tax PAT A.PAT EPS Div (%)
Exp
ecte
d R
esu
lts
on
14
Au
gu
st 2
015
Trio Mercantile & Trading 201406 5.58 1.89 0.77 1.96 0.06 0.76 0.01 0.02 0.73 0.23 0.50 0.50 0.90 0.00 S
Trio Mercantile & Trading 201409 5.58 3.56 0.24 3.64 0.01 0.18 0.01 0.02 0.15 0.15 0.15 0.02 0.00 S
Trio Mercantile & Trading 201412 5.58 4.94 5.04 0.15 0.05 0.02 0.02 0.02 0.01 0.01 0.01 0.02 0.00 S
Trio Mercantile & Trading 201503 5.58 1.99 2.64 0.07 -0.57 0.01 0.01 -0.59 -0.59 -0.59 -0.11 0.00 S
Triochem Products 201406 0.25 10.55 0.03 9.55 0.03 1.05 0.03 0.08 0.94 0.29 0.65 0.65 26.50 0.00 S
Triochem Products 201409 0.25 9.47 0.03 9.25 0.01 0.25 0.05 0.08 0.12 0.07 0.06 0.06 2.30 0.00 S
Triochem Products 201412 0.25 6.06 0.01 6.08 0.02 0.01 0.27 0.08 -0.34 -0.17 -0.17 -0.17 -6.85 0.00 S
Triochem Products 201503 0.25 4.43 0.12 4.59 0.02 -0.03 0.07 0.08 -0.18 -0.06 -0.12 -0.12 -4.97 0.00 S
Triveni Engineering & Industries 201406 25.79 575.41 0.48 542.68 3.07 36.28 33.36 14.65 -11.73 -3.21 -8.52 -5.89 -0.23 0.00 C
Triveni Engineering & Industries 201409 25.79 455.10 0.38 462.85 2.55 -4.82 29.94 15.13 -49.89 -13.19 -36.70 -27.89 -1.08 0.00 C
Triveni Engineering & Industries 201412 25.79 580.29 1.42 600.89 2.63 -16.55 25.21 14.82 -56.58 -18.33 -38.25 -32.68 -1.27 0.00 C
Triveni Engineering & Industries 201503 25.79 444.46 3.38 472.48 3.74 -20.90 33.57 14.62 -69.09 17.37 -86.46 -85.60 -3.32 0.00 C
Triveni Turbine 201406 33.00 119.56 1.53 99.07 3.35 25.37 0.12 4.06 21.19 6.97 14.22 14.22 0.43 85.00 S
Triveni Turbine 201409 33.00 155.61 0.16 120.94 4.56 39.39 0.02 4.00 35.37 11.50 23.87 23.87 0.72 85.00 S
Triveni Turbine 201412 33.00 150.19 0.30 118.71 6.68 38.46 0.08 3.92 34.46 10.86 23.60 23.60 0.72 85.00 S
Triveni Turbine 201503 33.00 191.90 3.61 161.55 16.32 50.28 0.42 2.52 44.54 15.15 29.39 29.39 0.89 85.00 S
Tuni Textile Mills 201406 13.06 4.21 0.29 4.09 0.05 0.45 0.26 0.13 0.07 0.05 0.02 0.02 0.00 S
Tuni Textile Mills 201409 13.06 8.50 0.20 8.33 0.04 0.41 0.22 0.13 0.05 0.00 0.05 0.05 0.00 S
Tuni Textile Mills 201412 13.06 4.16 0.06 3.83 0.05 0.45 0.22 0.14 0.08 0.01 0.07 0.07 0.00 S
Tuni Textile Mills 201503 13.06 12.15 0.20 11.95 0.07 0.47 0.23 0.42 -0.18 -0.09 -0.09 -0.09 -0.01 0.00 S
Twinstar Industries 201406 22.50 27.50 27.10 0.02 0.42 0.15 0.12 0.15 0.15 0.15 0.01 0.00 S
Twinstar Industries 201409 22.50 20.25 19.99 0.09 0.35 0.14 0.13 0.08 0.08 0.08 0.04 0.00 S
Twinstar Industries 201412 22.50 15.06 14.70 0.02 0.37 0.18 0.13 0.07 0.07 0.07 0.00 S
Twinstar Industries 201503 22.50 37.37 35.84 -0.09 1.45 0.18 1.20 0.07 -0.21 0.27 0.27 0.01 0.00 S
Tyroon Tea Company 201406 3.51 0.97 1.04 0.38 0.31 0.04 0.10 0.17 0.17 0.17 0.49 10.00 S
Tyroon Tea Company 201409 3.51 9.97 6.75 0.50 3.71 0.03 0.12 3.57 3.57 3.57 10.49 10.00 S
Tyroon Tea Company 201412 3.51 6.88 6.74 0.19 0.33 0.01 0.11 0.21 0.21 0.21 0.61 10.00 S
Tyroon Tea Company 201503 3.51 3.95 7.91 0.17 -3.79 0.01 0.13 -3.93 0.16 -4.09 -4.09 -12.01 10.00 S
Unimin India 201406 20.18 0.15 0.08 0.08 0.45 -0.38 -0.38 -0.38 -0.19 0.00 S
Unimin India 201409 20.18 0.24 0.10 0.15 0.45 -0.31 -0.31 -0.31 -0.15 0.00 S
Unimin India 201412 20.18 0.30 0.10 0.20 0.45 -0.26 -0.26 -0.26 -0.13 0.00 S
Unimin India 201503 20.18 0.30 0.24 0.06 0.45 -0.39 -0.39 -0.39 -0.20 0.00 S
Unistar Multimedia 201406 10.00 0.02 -0.02 -0.02 -0.02 -0.02 -0.02 0.00 S
Unistar Multimedia 201409 10.00 0.01 -0.01 -0.01 -0.01 -0.01 -0.01 0.00 S
Unistar Multimedia 201412 10.00 0.23 0.26 -0.03 -0.03 -0.03 -0.03 -0.03 0.00 S
Unistar Multimedia 201503 10.00 40.01 -40.01 -40.01 -40.01 -40.01 -40.00 0.00 S
Unisys Softwares & Holding Industries201406 23.00 141.88 0.45 141.66 0.68 0.11 0.57 0.57 0.57 0.25 0.00 S
Unisys Softwares & Holding Industries201409 23.00 13.33 1.00 13.39 0.00 0.94 0.58 0.11 0.25 0.00 0.25 0.25 0.11 0.00 S
Unisys Softwares & Holding Industries201412 23.00 105.43 0.85 105.20 1.08 0.29 0.11 0.68 0.68 0.68 0.30 0.00 S
Unisys Softwares & Holding Industries201503 23.00 212.50 1.01 213.47 0.04 0.72 0.11 -0.79 0.33 -1.12 -1.12 -0.49 0.00 S
Unitech International 201406 9.99 6.51 5.45 1.06 1.06 1.06 1.06 0.00 S
Unitech International 201409 9.99 28.70 29.51 0.03 -0.78 0.00 -0.78 0.00 -0.78 -0.78 -0.77 0.00 S
Unitech International 201412 9.99 17.85 18.11 0.02 -0.24 0.06 -0.30 -0.30 -0.30 -0.30 0.00 S
Unitech International 201503 9.99 29.88 29.51 0.04 0.40 0.06 0.23 0.11 0.11 0.11 0.11 0.00 S
United Van Der Horst 201406 4.00 1.62 1.17 0.00 0.45 0.13 0.10 0.22 -0.04 0.27 0.27 0.67 0.00 S
United Van Der Horst 201409 4.00 2.15 1.70 0.46 0.13 0.09 0.24 -0.01 0.25 0.25 0.61 0.00 S
United Van Der Horst 201412 4.00 0.88 1.38 0.03 -0.46 0.13 0.10 -0.69 -0.01 -0.68 -0.68 -1.70 0.00 S
United Van Der Horst 201503 4.00 0.60 1.08 -0.49 0.12 0.10 -0.79 -0.03 -0.76 -0.76 -1.90 0.00 S

Co_Name Year Equity N.Sale O.O.I T. Exp O.I PBIDT Int. Dep. PBT T.Tax PAT A.PAT EPS Div (%)
Exp
ecte
d R
esu
lts
on
14
Au
gu
st 2
015
Universal Prime Aluminium 201406 7.97 0.08 0.11 0.04 0.01 0.03 0.01 0.02 0.02 0.02 0.00 S
Universal Prime Aluminium 201409 7.97 0.21 0.16 -0.06 0.01 -0.06 -0.06 -0.06 -0.08 0.00 S
Universal Prime Aluminium 201412 7.97 0.10 0.05 -0.06 0.01 -0.06 -0.06 -0.06 -0.08 0.00 S
Universal Prime Aluminium 201503 7.97 0.12 0.09 -0.03 0.01 -2.39 -0.05 -2.35 -2.35 -2.94 0.00 S
Upasana Finance 201406 4.28 0.10 0.20 0.14 0.16 0.16 0.02 0.14 0.14 0.33 0.00 S
Upasana Finance 201409 4.28 0.10 0.21 0.24 0.06 0.06 -0.01 0.07 0.07 0.16 0.00 S
Upasana Finance 201412 4.28 0.10 0.19 0.13 0.16 0.16 0.02 0.13 0.13 0.31 0.00 S
Upasana Finance 201503 4.28 0.66 0.20 0.19 0.66 0.02 0.65 0.20 0.45 0.45 1.05 0.00 S
UTL Industries 201406 3.26 0.06 0.09 -0.03 -0.03 0.00 -0.03 -0.03 -0.09 0.00 S
UTL Industries 201409 3.26 0.08 0.11 -0.04 -0.04 -0.04 -0.04 -0.12 0.00 S
UTL Industries 201412 3.26 0.02 0.06 -0.04 -0.04 -0.04 -0.04 -0.12 0.00 S
UTL Industries 201503 0.33 0.01 0.04 0.01 -0.02 0.00 -0.02 0.01 -0.03 -0.03 -0.09 0.00 S
Uttam Value Steels 201406 1322.94 1496.41 1410.22 12.79 98.98 75.17 27.97 -4.16 -4.16 -4.16 -0.03 0.00 S
Uttam Value Steels 201409 1322.94 1206.27 1136.20 21.16 91.23 67.72 28.30 -4.79 -4.79 -4.79 -0.04 0.00 S
Uttam Value Steels 201412 1322.94 1033.06 965.49 11.09 78.66 60.21 26.43 -7.98 -7.98 -7.98 -0.06 0.00 S
Uttam Value Steels 201503 1322.94 1253.30 1188.79 14.62 79.13 67.21 26.32 -14.40 -14.40 -14.40 -0.24 0.00 S
Vadilal Dairy International 201406 3.19 18.15 15.10 0.16 3.21 0.01 0.13 3.07 3.04 3.07 9.51 0.00 S
Vadilal Dairy International 201409 3.19 5.06 5.15 0.05 -0.05 0.00 0.15 -0.20 -0.22 -0.20 -0.68 0.00 S
Vadilal Dairy International 201412 3.19 7.06 7.05 1.09 1.09 0.00 0.16 0.93 0.84 0.93 2.64 0.00 S
Vadilal Dairy International 201503 3.19 9.05 0.02 8.15 0.92 0.01 0.46 0.25 0.09 0.21 0.16 0.66 0.00 S
Vaghani Techno-Build 201406 5.22 0.00 0.05 0.01 -0.03 0.04 -0.07 0.00 -0.07 -0.07 -0.14 0.00 S
Vaghani Techno-Build 201409 5.22 0.04 0.02 -0.02 0.05 -0.06 -0.06 -0.06 -0.12 0.00 S
Vaghani Techno-Build 201412 5.22 0.03 0.02 -0.01 0.04 -0.05 -0.05 -0.05 -0.10 0.00 S
Vaghani Techno-Build 201503 5.22 0.05 0.15 0.10 0.10 0.20 -0.09 -0.09 -0.18 0.00 S
Vakrangee 201406 50.35 681.23 0.01 524.98 0.67 156.92 20.48 40.72 95.72 19.54 76.19 76.19 1.51 25.00 C
Vakrangee 201409 50.35 698.28 0.00 517.44 2.37 183.21 20.41 41.13 121.67 41.60 80.07 80.07 1.59 25.00 C
Vakrangee 201412 50.35 702.16 0.02 508.67 2.43 195.94 19.67 41.11 135.16 45.82 89.35 89.35 1.77 25.00 C
Vakrangee 201503 50.35 698.77 0.00 506.16 0.45 193.06 14.38 41.90 136.78 60.53 76.25 76.25 1.51 25.00 C
Vallabh Steels 201406 4.95 27.59 25.47 2.12 1.67 0.23 0.22 0.03 0.18 0.18 0.37 0.00 S
Vallabh Steels 201409 4.95 30.66 28.37 2.29 1.79 0.23 0.26 0.06 0.21 0.21 0.41 0.00 S
Vallabh Steels 201412 4.95 46.20 44.89 1.31 0.57 0.23 0.51 0.10 0.42 0.42 0.84 0.00 S
Vallabh Steels 201503 4.95 33.25 33.56 0.07 -0.24 0.20 0.04 -0.48 -1.96 1.47 1.47 2.97 0.00 S
Valson Industries 201406 7.66 27.16 0.23 25.74 1.66 0.35 0.77 0.54 0.15 0.39 0.39 0.51 10.00 S
Valson Industries 201409 7.66 30.24 0.22 28.61 0.00 1.85 0.32 0.77 0.76 0.37 0.40 0.40 0.52 10.00 S
Valson Industries 201412 7.66 25.62 0.23 24.38 1.47 0.29 0.77 0.41 0.15 0.26 0.26 0.34 10.00 S
Valson Industries 201503 7.66 23.25 1.32 22.35 2.22 0.27 0.76 1.18 0.08 1.11 1.11 1.44 10.00 S
Value Industries 201406 39.19 378.27 0.44 350.37 0.17 28.51 23.13 19.06 -13.68 -2.65 -11.03 -11.03 -2.81 0.00 S
Value Industries 201409 39.19 380.16 0.41 350.07 0.19 30.69 23.07 19.38 -11.76 -2.25 -9.51 -9.51 -2.43 0.00 S
Value Industries 201412 39.19 381.79 0.08 349.50 0.07 32.44 25.34 19.21 -12.11 -1.72 -10.39 -10.39 -2.65 0.00 S
Value Industries 201503 39.19 374.06 0.59 340.16 0.43 34.92 26.39 18.87 -10.34 -2.00 -8.34 -8.34 -2.13 0.00 S
Vantage Corporate Services 201406 5.51 0.11 0.09 0.02 0.00 0.01 0.01 0.01 0.02 0.00 S
Vantage Corporate Services 201409 5.51 0.14 0.48 -0.34 0.00 -0.34 -0.34 -0.34 -0.61 0.00 S
Vantage Corporate Services 201412 5.51 0.23 0.22 0.01 0.01 0.01 0.01 0.01 0.02 0.00 S
Vantage Corporate Services 201503 5.51 0.30 0.29 0.01 0.04 -0.03 0.03 -0.06 -0.06 -0.10 0.00 S
Vardhaman Laboratories 201406 4.13 0.02 -0.02 -0.02 -0.02 -0.02 -0.05 0.00 S
Vardhaman Laboratories 201409 4.13 0.01 0.01 0.00 0.00 0.00 0.00 -0.01 0.00 S
Vardhaman Laboratories 201412 4.13 0.02 0.01 -0.01 -0.01 -0.01 -0.01 -0.02 0.00 S
Vardhaman Laboratories 201503 4.13 0.01 0.01 0.01 0.01 0.01 0.01 0.01 0.00 S

Co_Name Year Equity N.Sale O.O.I T. Exp O.I PBIDT Int. Dep. PBT T.Tax PAT A.PAT EPS Div (%)
Exp
ecte
d R
esu
lts
on
14
Au
gu
st 2
015
Vardhman Industries 201406 7.90 69.27 63.66 5.61 2.42 1.55 1.64 0.30 1.34 1.34 1.70 10.00 S
Vardhman Industries 201409 7.90 78.62 73.82 4.80 1.23 1.44 2.14 0.42 1.72 1.72 2.18 10.00 S
Vardhman Industries 201412 7.90 79.32 74.47 4.85 2.11 1.47 1.27 0.25 1.02 1.02 1.29 10.00 S
Vardhman Industries 201503 7.90 56.12 0.01 56.01 0.13 0.07 2.60 -2.55 -1.97 -0.58 -0.58 -0.73 10.00 S
VB Industries 201412 13.11 0.16 0.05 0.00 0.11 0.00 0.00 0.11 0.00 0.11 0.11 0.09 0.00 S
VB Industries 201503 13.11 22.44 22.51 -0.07 0.00 -0.07 0.06 -0.14 -0.14 -0.11 0.00 S
Veer Energy & Infrastructure 201406 7.11 6.55 0.93 5.40 2.09 0.21 0.26 1.62 0.32 1.30 1.30 0.18 6.00 S
Veer Energy & Infrastructure 201409 7.11 13.57 0.73 13.28 0.01 1.03 0.18 0.26 0.59 0.59 0.59 0.08 6.00 S
Veer Energy & Infrastructure 201412 7.11 6.77 0.50 6.86 0.01 0.41 0.02 0.26 0.13 0.13 0.13 0.02 6.00 S
Veer Energy & Infrastructure 201503 7.11 18.28 0.41 17.70 0.17 1.16 0.22 0.25 0.69 0.07 0.62 0.62 0.09 6.00 S
Veerhealth Care 201406 6.93 0.03 0.13 0.13 0.02 0.01 0.01 0.01 0.01 0.00 S
Veerhealth Care 201409 6.93 0.56 0.53 0.05 0.08 0.01 0.08 0.08 0.08 0.01 0.00 S
Veerhealth Care 201412 6.93 0.44 0.34 0.03 0.13 0.05 0.08 0.08 0.08 0.01 0.00 S
Veerhealth Care 201503 6.93 0.35 0.53 0.28 0.10 0.03 0.05 0.02 0.10 -0.08 -0.08 -0.01 0.00 S
VenkyS (India) 201406 9.39 425.89 14.64 423.03 7.22 24.72 15.86 6.23 2.63 1.05 1.58 1.58 1.68 50.00 S
VenkyS (India) 201409 9.39 341.74 12.91 347.86 8.07 14.86 19.39 11.19 -15.72 -2.57 -13.15 -13.15 -14.00 50.00 S
VenkyS (India) 201412 9.39 438.18 12.23 405.27 7.70 52.84 19.99 9.04 25.36 5.47 19.89 19.89 21.17 50.00 S
VenkyS (India) 201503 9.39 467.08 18.14 455.59 10.46 40.09 18.95 5.69 15.45 5.07 10.38 10.38 11.05 50.00 S
Vertical Industries 201406 7.80 0.00 0.00 0.00 0.00 0.00 0.00 S
Vertical Industries 201409 7.80 0.02 0.02 0.00 0.00 0.00 0.00 0.00 S
Vertical Industries 201412 7.80 0.02 0.05 -0.03 -0.03 -0.03 -0.03 0.00 S
Vertical Industries 201503 7.80 0.01 0.01 0.00 0.00 0.00 0.00 0.00 S
Vibros Organics 201406 5.41 0.05 -0.05 -0.05 -0.05 -0.05 -0.09 0.00 S
Vibros Organics 201409 5.41 0.00 0.00 0.00 0.00 0.00 -0.01 0.00 S
Vibros Organics 201412 5.41 0.00 0.00 0.00 0.00 0.00 0.00 S
Vibros Organics 201503 5.41 0.01 -0.01 -0.01 -0.01 -0.01 -0.02 0.00 S
Viceroy Hotels 201406 42.41 23.82 1.13 18.69 6.26 5.94 3.73 -3.42 -0.19 -3.23 -3.23 -0.76 0.00 C
Viceroy Hotels 201409 42.41 26.86 0.99 20.35 7.50 6.15 3.84 -2.50 -0.26 -2.24 -2.24 -0.53 0.00 C
Viceroy Hotels 201412 42.41 27.75 1.16 20.31 8.60 6.01 3.11 -0.53 0.21 -0.73 -0.73 -0.17 0.00 C
Viceroy Hotels 201503 42.41 27.16 1.23 17.95 10.43 6.63 3.41 0.39 0.27 0.12 0.12 0.03 0.00 C
Videocon Industries 201406 318.76 3124.83 10.74 2571.91 216.48 780.14 584.83 182.34 12.97 2.75 10.22 10.22 0.32 20.00 S
Videocon Industries 201409 318.76 3187.31 11.29 2639.92 209.26 767.94 585.67 180.58 1.69 0.35 1.34 1.34 0.04 20.00 S
Videocon Industries 201412 334.46 3135.14 2.69 2572.44 217.33 782.72 589.98 170.07 22.67 4.06 18.61 18.61 0.58 20.00 S
Videocon Industries 201503 334.46 3079.27 10.87 2540.08 213.47 763.53 591.35 159.22 12.96 2.50 10.46 10.46 0.31 20.00 S
Vikas Granaries 201406 18.12 77.12 73.43 0.00 3.69 0.05 3.38 0.26 0.16 0.10 0.10 0.06 0.00 S
Vikas Granaries 201409 18.12 64.99 61.50 3.48 0.02 3.38 0.08 -0.03 0.11 0.11 0.06 0.00 S
Vikas Granaries 201412 18.12 81.19 77.53 3.66 0.00 3.38 0.27 0.16 0.12 0.12 0.06 0.00 S
Vikas Granaries 201503 18.12 69.42 65.54 0.03 3.92 0.03 3.86 0.02 -0.05 0.07 0.07 0.04 0.00 S
Vimal Oil & Foods 201406 15.02 707.76 686.43 21.34 12.86 0.85 7.63 1.91 5.72 5.72 3.81 12.00 S
Vimal Oil & Foods 201409 15.02 649.23 628.31 0.03 20.95 12.16 0.76 8.03 2.01 6.01 6.01 4.00 12.00 S
Vimal Oil & Foods 201412 15.02 737.29 710.99 26.30 17.28 0.83 8.19 2.04 6.15 6.15 4.09 12.00 S
Vimal Oil & Foods 201503 15.02 940.40 912.44 0.14 28.10 21.41 5.01 1.68 1.52 0.17 0.17 0.11 12.00 S
Vinaditya Trading Company 201406 0.15 0.05 0.03 0.02 0.02 0.02 0.02 1.00 0.00 S
Vinaditya Trading Company 201409 0.15 0.01 0.05 0.04 0.04 0.04 0.04 2.35 0.00 S
Vinaditya Trading Company 201412 0.15 0.05 0.03 0.01 0.01 0.01 0.01 0.83 0.00 S
Vinaditya Trading Company 201503 0.15 0.16 0.10 -0.06 -0.06 0.01 -0.07 -0.07 -4.58 0.00 S

Co_Name Year Equity N.Sale O.O.I T. Exp O.I PBIDT Int. Dep. PBT T.Tax PAT A.PAT EPS Div (%)
Exp
ecte
d R
esu
lts
on
14
Au
gu
st 2
015
Vinayak Polycon International 201406 3.08 5.75 5.37 0.39 0.14 0.18 0.06 0.06 0.06 0.20 0.00 S
Vinayak Polycon International 201409 3.08 5.14 4.73 0.41 0.13 0.23 0.04 0.04 0.04 0.14 0.00 S
Vinayak Polycon International 201412 3.08 3.12 2.78 0.35 0.08 0.23 0.03 0.03 0.03 0.11 0.00 S
Vinayak Polycon International 201503 3.08 3.11 0.01 2.92 0.20 0.06 0.12 0.03 0.05 -0.02 -0.02 -0.08 0.00 S
Virgo Global Media 201406 4.20 0.02 0.02 0.01 0.00 0.00 0.00 0.00 0.00 0.00 S
Virgo Global Media 201409 4.20 0.01 0.00 0.01 0.02 0.02 0.02 0.02 0.01 0.00 S
Virgo Global Media 201412 4.20 0.03 0.03 0.01 0.01 0.00 0.00 0.00 0.00 0.00 S
Virgo Global Media 201503 4.20 0.02 0.04 0.02 0.01 0.00 -0.01 0.00 -0.01 -0.01 -0.01 0.00 S
Virtual Global Education 201406 42.37 2.61 2.58 0.04 0.00 0.03 0.03 0.03 0.00 S
Virtual Global Education 201409 42.37 2.75 2.72 0.04 0.00 0.04 0.04 0.04 0.00 S
Virtual Global Education 201412 42.37 2.92 0.16 3.00 0.08 0.01 0.03 0.05 0.05 0.05 0.00 S
Virtual Global Education 201503 42.37 3.01 1.18 4.10 0.09 0.01 0.04 0.05 0.05 0.05 0.00 S
Virtualsoft Systems 201406 10.30 2.30 0.18 2.99 -0.51 0.02 0.03 -0.55 -0.55 -0.55 -0.54 0.00 C
Virtualsoft Systems 201409 10.30 1.68 0.07 3.40 -1.65 0.09 0.03 -1.76 -1.76 -1.76 -1.71 0.00 C
Virtualsoft Systems 201412 10.30 4.78 0.32 7.91 -2.81 0.12 0.06 -2.99 -2.99 -2.99 -2.91 0.00 C
Virtualsoft Systems 201503 10.30 2.50 -0.18 3.50 -1.18 0.41 0.15 -1.79 -1.79 -1.79 -1.73 0.00 C
Visa Steel 201406 110.00 341.77 8.15 317.39 2.79 35.31 39.76 19.11 -38.39 0.78 -39.17 -29.41 -2.67 0.00 C
Visa Steel 201409 110.00 372.64 3.65 378.95 6.50 3.84 61.35 15.22 -79.93 1.41 -78.59 -69.13 -6.28 0.00 C
Visa Steel 201412 110.00 271.98 3.04 266.19 2.32 11.15 49.33 17.76 -57.72 -57.72 -50.91 -4.63 0.00 C
Visa Steel 201503 110.00 273.62 5.43 301.88 3.28 -19.55 78.92 24.65 -123.34 3.83 -127.17 -123.46 -11.22 0.00 C
Visagar Financial Services 201406 6.50 0.04 0.04 0.00 S
Visagar Financial Services 201409 6.50 0.28 0.05 0.23 0.00 0.23 0.23 0.23 0.00 S
Visagar Financial Services 201412 6.50 0.11 0.02 0.09 0.09 0.09 0.09 0.00 S
Visagar Financial Services 201503 6.50 0.16 0.04 0.14 0.06 0.29 0.00 -0.23 0.03 -0.26 -0.26 -0.04 0.00 S
Visu International 201406 38.33 1.97 2.70 0.17 -0.57 0.01 0.09 -0.66 -0.66 -0.66 -0.17 0.00 C
Visu International 201409 38.33 2.98 3.26 0.79 0.51 0.02 0.09 0.41 0.41 0.41 0.11 0.00 C
Visu International 201412 38.33 1.89 3.10 0.81 -0.40 0.01 0.09 -0.49 -0.49 -0.49 -0.13 0.00 C
Visu International 201503 38.33 2.15 2.59 0.53 0.08 0.02 0.09 -0.02 -0.02 -0.02 -0.01 0.00 C
Vital Communications 201406 37.97 0.01 -0.01 -0.01 -0.01 -0.01 0.00 S
Vital Communications 201409 37.97 0.02 -0.02 -0.02 -0.02 -0.02 0.00 S
Vital Communications 201412 37.97 0.00 0.00 0.00 0.00 0.00 0.00 0.00 0.00 0.00 0.00 S
Vital Communications 201503 37.97 0.00 0.00 0.00 0.00 0.00 -0.01 -0.01 0.00 S
VMS Industries 201406 16.47 30.29 1.12 30.09 1.32 0.86 0.16 0.30 0.08 0.22 0.22 0.13 0.00 S
VMS Industries 201409 16.47 40.17 0.46 39.90 0.73 0.28 0.16 0.29 0.13 0.16 0.16 0.10 0.00 S
VMS Industries 201412 16.47 11.83 12.59 1.40 0.64 0.08 0.16 0.39 0.18 0.21 0.21 0.13 0.00 S
VMS Industries 201503 16.47 0.72 0.00 0.72 0.46 0.24 0.02 -0.07 0.09 0.09 0.05 0.00 S
Voltamp Transformers 201406 10.12 83.35 79.27 6.16 10.24 0.07 1.96 8.21 1.48 6.73 6.73 6.65 100.00 S
Voltamp Transformers 201409 10.12 134.46 131.93 5.38 7.92 0.09 2.04 5.79 0.90 4.90 4.90 4.84 100.00 S
Voltamp Transformers 201412 10.12 129.13 124.75 3.63 8.01 0.08 1.80 6.13 1.52 4.61 4.61 4.55 100.00 S
Voltamp Transformers 201503 10.12 169.95 161.19 5.99 14.74 0.06 1.42 13.26 1.09 12.18 12.18 12.04 100.00 S
Vora Constructions 201406 2.00 4.71 0.01 4.66 0.07 0.07 0.01 0.06 0.06 0.30 0.00 S
Vora Constructions 201409 2.00 7.31 0.00 7.53 -0.22 -0.22 -0.22 -0.22 0.00 S
Vora Constructions 201412 2.00 5.86 0.01 6.06 -0.20 -0.20 -0.01 -0.19 -0.19 0.00 S
Vora Constructions 201503 2.00 0.32 0.00 0.33 0.00 0.00 0.00 0.00 -0.01 0.00 S
Walchandnagar Industries 201406 7.61 145.72 3.10 131.51 4.24 21.55 12.62 4.40 4.53 4.53 4.53 1.19 20.00 S
Walchandnagar Industries 201409 7.61 152.08 4.03 151.20 1.92 6.83 13.27 4.57 -11.01 -6.22 -4.79 -4.79 -1.26 20.00 S
Walchandnagar Industries 201412 7.61 162.45 2.09 169.12 0.29 -4.29 13.83 7.12 -25.66 -25.66 -25.66 -6.74 20.00 S
Walchandnagar Industries 201503 7.61 140.66 0.39 135.67 1.71 7.09 14.07 5.46 -12.44 3.11 -15.55 -15.55 -4.08 20.00 S

Co_Name Year Equity N.Sale O.O.I T. Exp O.I PBIDT Int. Dep. PBT T.Tax PAT A.PAT EPS Div (%)
Exp
ecte
d R
esu
lts
on
14
Au
gu
st 2
015
Warner Multimedia 201406 18.56 0.02 0.02 0.00 0.00 0.00 0.00 0.00 0.00 S
Warner Multimedia 201409 18.56 0.02 0.02 0.00 0.00 0.00 0.00 0.00 0.00 S
Warner Multimedia 201412 18.56 0.03 0.02 0.02 0.02 0.02 0.02 0.01 0.00 S
Warner Multimedia 201503 18.56 0.22 -0.04 0.22 -0.04 0.01 -0.05 -0.05 -0.05 -0.03 0.00 S
Websol Energy Systems 201406 21.97 38.47 40.25 -1.78 9.06 4.17 -14.26 -14.26 -14.26 -6.49 0.00 S
Websol Energy Systems 201409 21.97 76.30 74.01 2.29 0.18 4.27 -2.61 -2.61 -2.61 -1.19 0.00 S
Websol Energy Systems 201412 21.97 105.21 102.39 0.12 2.94 4.04 0.95 0.95 0.95 0.43 0.00 S
Websol Energy Systems 201503 21.97 135.78 134.05 0.62 2.35 -7.17 3.78 -3.06 0.47 -36.49 -3.53 -16.61 0.00 S
Welterman International 201406 4.39 5.89 6.26 0.01 -0.36 0.02 -0.38 -0.38 -0.38 -0.81 0.00 S
Welterman International 201409 4.44 5.54 5.77 0.00 -0.23 0.02 -0.25 -0.25 -0.25 -0.54 0.00 S
Welterman International 201412 4.44 7.03 7.11 0.03 -0.06 0.02 -0.08 -0.08 -0.08 -0.17 0.00 S
Welterman International 201503 4.44 0.02 0.22 0.03 -0.17 -0.01 -0.16 -2.11 -0.16 -4.53 0.00 S
Winsome Yarns 201406 70.71 80.86 5.08 90.57 0.24 -4.39 14.82 5.46 -24.67 -24.67 -24.67 -3.49 0.00 S
Winsome Yarns 201409 70.71 84.92 5.65 112.13 1.28 -20.28 13.57 5.42 -39.27 -39.27 -39.27 -5.55 0.00 S
Winsome Yarns 201412 70.71 99.97 8.59 129.54 2.99 -17.99 14.72 3.62 -36.33 -36.33 -36.33 -0.51 0.00 S
Winsome Yarns 201503 70.71 84.51 8.28 110.25 0.19 -17.27 -11.97 5.12 -10.42 -10.42 -10.42 -1.47 0.00 S
Yarn Syndicate 201406 3.75 0.25 0.02 -0.23 0.02 0.07 -0.32 0.00 -0.32 -0.32 -0.85 0.00 S
Yarn Syndicate 201409 3.75 0.27 0.02 -0.26 0.02 0.06 -0.34 -0.01 -0.34 -0.34 -0.90 0.00 S
Yarn Syndicate 201412 3.75 0.01 0.28 0.02 -0.26 0.02 0.07 -0.34 -0.01 -0.33 -0.33 -0.89 0.00 S
Yarn Syndicate 201503 3.75 0.68 0.02 -0.67 0.02 0.07 -0.75 -0.03 -0.73 -0.73 -1.93 0.00 S
YKM Industries 201406 4.49 0.01 -0.01 -0.01 -0.01 -0.01 -0.03 0.00 S
YKM Industries 201409 4.49 0.00 0.01 0.00 -0.01 0.00 -0.01 0.00 -0.01 -0.01 -0.02 0.00 S
YKM Industries 201412 4.49 0.01 -0.01 -0.01 -0.01 -0.01 -0.02 0.00 S
YKM Industries 201503 4.49 0.01 -0.01 -0.01 -0.01 0.00 0.00 0.00 S
Yogi Infra Projects 201406 16.85 0.08 0.21 0.13 0.13 0.13 0.13 0.08 0.00 S
Yogi Infra Projects 201409 16.85 0.07 0.21 0.14 0.14 0.14 0.14 0.09 0.00 S
Yogi Infra Projects 201412 16.85 0.08 0.22 0.15 0.15 0.15 0.15 0.09 0.00 S
Yogi Infra Projects 201503 16.85 0.10 0.30 0.20 0.00 0.20 0.19 -0.01 0.00 -0.01 0.00 S
York Exports 201406 3.36 1.24 0.02 0.94 0.31 0.10 0.13 0.08 0.08 0.08 0.22 0.00 S
York Exports 201409 3.36 3.56 3.28 0.11 0.39 0.13 0.13 0.13 0.03 0.11 0.11 0.31 0.00 S
York Exports 201412 3.36 4.76 0.02 4.53 0.32 0.58 0.11 0.13 0.09 0.00 0.09 0.09 0.25 0.00 S
York Exports 201503 3.36 0.69 -0.02 3.17 -2.50 0.11 0.12 -2.74 -0.02 -2.72 -2.72 -8.09 0.00 S
Yuvraaj Hygiene Product 201406 6.92 3.61 3.12 0.50 0.22 0.21 0.07 0.02 0.05 0.05 0.01 0.00 S
Yuvraaj Hygiene Product 201409 6.92 3.88 3.41 0.47 0.25 0.21 0.02 0.01 0.01 0.01 0.00 S
Yuvraaj Hygiene Product 201412 6.92 2.46 2.26 0.20 0.21 0.21 -0.22 -0.07 -0.15 -0.15 -0.02 0.00 S
Yuvraaj Hygiene Product 201503 6.92 2.91 2.69 0.00 0.22 0.23 0.55 -0.56 -0.09 -0.47 -0.47 -0.07 0.00 S
Zen Technologies 201406 7.72 3.66 9.76 0.79 -5.31 0.26 0.51 -6.09 -6.09 -6.09 -7.89 10.00 S
Zen Technologies 201409 7.72 2.90 9.13 0.81 -5.42 0.48 0.52 -6.42 -6.42 -6.42 -8.32 10.00 S
Zen Technologies 201412 7.72 7.44 9.96 0.87 -1.65 0.62 0.50 -2.77 -2.77 -2.77 -0.36 10.00 S
Zen Technologies 201503 7.72 78.55 57.67 3.32 24.20 2.13 2.25 19.82 4.08 15.74 15.74 2.04 10.00 C
Zenith Capitals 201406 1.92 0.03 -0.03 0.01 -0.04 -0.04 -0.04 0.00 S
Zenith Capitals 201409 1.92 0.03 -0.03 -0.03 -0.03 -0.03 -0.01 0.00 S
Zenith Capitals 201412 1.92 0.03 -0.03 -0.03 -0.03 -0.03 -0.01 0.00 S
Zenith Capitals 201503 1.92 0.05 -0.05 -0.05 -0.05 -0.05 -2.78 0.00 S
Zenith Computers 201406 15.48 11.42 9.42 0.06 2.06 1.68 0.26 0.12 0.12 0.12 0.08 0.00 S
Zenith Computers 201409 15.48 4.39 13.12 0.07 -8.66 1.67 0.10 -10.43 -10.43 -10.43 -6.73 0.00 S
Zenith Computers 201412 15.48 4.08 18.87 0.29 -14.50 1.67 0.13 -16.30 -16.30 -16.30 -10.53 0.00 S
Zenith Computers 201503 15.48 3.01 5.21 0.24 -1.96 2.41 0.94 -5.30 -5.30 -5.30 -3.43 0.00 S

Co_Name Year Equity N.Sale O.O.I T. Exp O.I PBIDT Int. Dep. PBT T.Tax PAT A.PAT EPS Div (%)
Exp
ecte
d R
esu
lts
on
14
Au
gu
st 2
015
Zigma Software 201406 41.76 0.10 0.03 -0.07 0.03 -0.10 -0.10 -0.10 0.00 S
Zigma Software 201409 41.76 0.15 0.06 -0.10 0.03 -0.12 -0.12 -0.12 0.00 S
Zigma Software 201412 41.76 0.17 0.05 -0.12 0.03 -0.15 -0.15 -0.15 0.00 S
Zigma Software 201503 41.76 0.08 0.04 -0.04 0.03 -0.06 -0.06 -0.06 0.00 S
Zodiac Ventures 201406 3.73 0.18 0.00 -0.18 -0.25 -0.25 -0.25 -0.68 4.00 S
Zodiac Ventures 201409 3.73 0.18 -0.18 -0.18 -0.18 -0.18 -0.05 4.00 S
Zodiac Ventures 201412 3.73 1.00 0.27 0.74 0.12 0.61 0.06 0.55 0.55 0.15 4.00 S
Zodiac Ventures 201503 3.73 1.00 0.33 0.67 0.09 0.58 0.23 0.35 0.35 0.09 4.00 S
Zyden Gentec 201406 11.11 0.34 0.37 0.19 0.16 0.06 0.10 0.10 0.10 0.09 0.00 C
Zyden Gentec 201409 11.11 0.05 0.19 0.14 0.06 0.08 0.08 0.08 0.07 0.00 C
Zyden Gentec 201412 11.11 0.02 0.19 0.16 0.06 0.10 0.10 0.10 0.01 0.00 C
Zyden Gentec 201503 11.11 0.05 0.17 0.12 0.03 0.09 0.09 0.09 0.01 0.00 C
Zylog Systems 201406 29.50 200.45 217.52 2.49 -14.57 2.58 40.16 -57.30 -2.64 -54.67 -54.67 -9.27 0.00 S
Zylog Systems 201409 29.50 44.34 228.60 11.30 -172.95 0.00 40.19 -213.14 -1.57 -211.58 -211.58 -35.86 0.00 S
Zylog Systems 201412 29.50 62.73 229.94 17.93 -149.28 9.99 43.56 -202.82 -5.33 -197.50 -197.50 -33.48 0.00 C
Zylog Systems 201503 29.50 58.13 50.78 -9.99 -2.63 1.85 43.15 -48.34 0.31 -169.63 -169.63 -28.75 0.00 C
This Document has been prepared by Nirmal Bang Research (A Division of Nirmal Bang Securities Pvt. ). The information, analysis and estimates contained herein
are based on Nirmal Bang Research assessment and have been obtained from sources believed to be reliable. This document is meant for the use of the intended
recipient only. This document, at best, represents Nirmal Bang Research opinion and is meant for general information only. Nirmal Bang Research, its directors,
officers or employees shall not in anyway be responsible for the contents stated herein. Nirmal Bang Research expressly disclaims any and all liabilities that may
arise from information, errors or omissions in this connection. This document is not to be considered as an offer to sell or a solicitation to buy any securities. Nirmal
Bang Research, its affiliates and their employees may from time to time hold positions in securities referred to herein. Nirmal Bang Research or its affiliates may
from time to time solicit from or perform investment banking or other services for any company mentioned in this document.
Nirmal Bang Research (Division of Nirmal Bang Securities Pvt. )
B-2, 301/302, Marathon Innova,
Opp. Peninsula Corporate Park
Off. Ganpatrao Kadam Marg
Lower Parel (W), Mumbai-400013
Board No. : 91 22 3926 8000/8001
Fax. : 022 3926 8010
Disclaimer: