Expanding Premium Tax Credits to Middle-Income Families ...
12
Jessica Banthin and Michael Simpson February 2021 Most people under age 65, even if they are ineligible for Medicaid or some other public program, are eligible for various tax subsidies such as exclusions, deductions, and credits that reduce the cost of purchasing private health insurance. One group excluded from receiving tax subsidies under current law is people without access to an offer of employer-sponsored insurance (ESI) and whose incomes exceed the eligibility threshold for premium tax credits in the Marketplace. 1 In this brief, we analyze a policy that would expand Marketplace premium tax credits to some people in this group. Most people with family incomes from 400 to 600 percent of the federal poverty level (FPL) are covered by health insurance through an employer-sponsored plan. 2 The small share of people in this group without access to coverage through an employer generally purchase a plan in the nongroup market, but some are uninsured. In the nongroup market, however, people must pay the full gross premium of any plan they choose because they are ineligible for the premium tax credits that reduce out-of-pocket premiums for people with lower incomes enrolling in coverage through the Marketplaces. Under current law, premium tax credits are available in the Marketplaces only for people with incomes from 100 to 400 percent of FPL who also meet other requirements. A policy that expands premium tax credits by raising the eligibility cutoff from 400 to 600 percent of FPL would lessen the financial burden of high premiums for such families and increase Marketplace enrollment for this group. A potential drawback of expanding premium tax credit eligibility to those with incomes up to 600 percent of FPL is that some employers might stop offering ESI to their workers. Small employers, in particular, are potentially the most likely to stop offering insurance, because their workforces tend to be lower income than those of large employers, and they are exempt from the employer responsibility HEALTH POLICY CENTER Expanding Premium Tax Credits to Middle- Income Families Would Reduce the Number of People Uninsured and Increase Marketplace Enrollment
Transcript of Expanding Premium Tax Credits to Middle-Income Families ...
Jessica Banthin and Michael Simpson
February 2021
Most people under age 65, even if they are ineligible for Medicaid or some other public
program, are eligible for various tax subsidies such as exclusions, deductions, and
credits that reduce the cost of purchasing private health insurance. One group excluded
from receiving tax subsidies under current law is people without access to an offer of
employer-sponsored insurance (ESI) and whose incomes exceed the eligibility threshold
for premium tax credits in the Marketplace.1 In this brief, we analyze a policy that would
expand Marketplace premium tax credits to some people in this group.
Most people with family incomes from 400 to 600 percent of the federal poverty level (FPL) are
covered by health insurance through an employer-sponsored plan.2 The small share of people in this
group without access to coverage through an employer generally purchase a plan in the nongroup
market, but some are uninsured. In the nongroup market, however, people must pay the full gross
premium of any plan they choose because they are ineligible for the premium tax credits that reduce
out-of-pocket premiums for people with lower incomes enrolling in coverage through the
Marketplaces. Under current law, premium tax credits are available in the Marketplaces only for
people with incomes from 100 to 400 percent of FPL who also meet other requirements. A policy that
expands premium tax credits by raising the eligibility cutoff from 400 to 600 percent of FPL would
lessen the financial burden of high premiums for such families and increase Marketplace enrollment
for this group.
A potential drawback of expanding premium tax credit eligibility to those with incomes up to 600
percent of FPL is that some employers might stop offering ESI to their workers. Small employers, in
particular, are potentially the most likely to stop offering insurance, because their workforces tend to
be lower income than those of large employers, and they are exempt from the employer responsibility
H EA L T H P O L I C Y C EN T ER
Expanding Premium Tax Credits to Middle-Income Families Would Reduce the Number of People Uninsured and Increase Marketplace Enrollment
2 E X P A N D I N G E L I G IB I L I TY F O R P R E M I UM T A X C R E D I T S T O M I D D L E - IN C OM E F A M I LI E S
requirements of the Affordable Care Act (ACA). Were employers to stop offering insurance because of
an expansion of premium tax credits to higher-income workers, not all of their workers would
necessarily enroll in alternative insurance options through the nongroup market or other public
programs. If enough employers were to stop offering health insurance coverage to their workers, then
the expansion policy might result in an increase in the number of uninsured, the opposite of its
intended effect. However, as we detail below, we find such concerns unwarranted.
We find expanding premium tax credits to families with incomes up to 600 percent of FPL would
reduce the number of people uninsured while substantially increasing Marketplace-based nongroup
insurance coverage. Our results show very few employers currently offering insurance to their
workers would find it advantageous to stop offering coverage if tax credits were expanded in this way.
Our results are also consistent with evidence that employers have not responded to the ACA by
dropping coverage: Ever since the ACA was first proposed, some policymakers have worried the
subsidies available in the nongroup market would encourage employers to stop offering ESI to their
employees. Contrary to that prediction, however, research shows most employers responded to the
ACA by increasing the rates at which they offer insurance to their employees, and total ESI coverage
has increased since 2014 (Gangopadhyaya and Garrett 2020; McMorrow, Blumberg, and Holahan
2020).
The policy examined here would make Marketplace coverage more affordable and eliminate the
subsidy cliff (the abrupt elimination of premium tax credits) that occurs at the current cutoff threshold
of 400 percent of FPL. Under current law, as a family’s income increases by $1 above 400 percent of
FPL, their premium tax credit falls from as much as several thousand dollars (depending on family size
and age of the family members) to $0. Such cliffs can create disincentives for families to take on more
work or switch to higher-paying jobs, because the loss of federal subsidies would worsen their net
finances. The policy proposed here would shift the subsidy cliff to higher income levels, reducing its
size and affecting fewer people.
A Reform to Expand Eligibility for Premium Tax Credits
The policy we analyze would expand the population eligible for premium tax credits under the ACA
from individuals and families with incomes from 100 to 400 percent of FPL to those with incomes
from 400 to 600 percent of FPL. If the policy were implemented in 2020, premiums for the
Marketplace benchmark plan for newly eligible households would have been limited to 9.78 percent of
income, matching the percentage-of-income limit applied to enrollees with incomes from 300 to 400
percent of FPL.3 The subsidy shrinks as incomes rise, so the new subsidies would be smaller than those
available to lower-income families. Other eligibility exclusions under current law would still apply:
immigrants without documentation, people with an ESI offer deemed affordable to them, and people
eligible for Medicaid, the Children’s Health Insurance Program, or Medicare would be ineligible.
The policy is intended to extend tax subsidies to one of the few groups of people without
widespread access to subsidies under current law and improve affordability for those paying very high
E X P A N D I N G E L I G IB I L I TY F O R P R E M I UM T A X C R E D I T S T O M I D D L E - IN C OM E F A M I LI E S 3
premiums.4 We expect the policy would modestly increase overall insurance coverage. Though the
uninsurance rate is already quite low in this income group, the policy would increase coverage by
attracting some people into the Marketplace who have found ACA-compliant insurance unaffordable
and chosen to either remain uninsured or purchase non-ACA-compliant insurance, such as short-term,
limited-duration (STLD) policies.
ACA-noncompliant plans have lower premiums than ACA-compliant plans, but they typically
exclude coverage for preexisting conditions and limit or exclude coverage for certain services, such as
prescription drugs, maternity care, mental health treatment, and substance use disorder treatment.
Such plans can end up costing families more if they are unlucky enough to experience an illness that
requires treatment not covered under the minimal benefits in the STLD plan.
By specifying a cap on the percentage of income households are asked to spend on nongroup
insurance premiums, premium tax credits under the ACA are structured so that as incomes rise, the
amount of the subsidy falls and the amount paid directly by the enrollee increases. Under the policy
analyzed here, Marketplace enrollees with incomes from 400 to 600 percent of FPL would pay more
for the same coverage and receive smaller subsidies than similar families with lower incomes.5 For
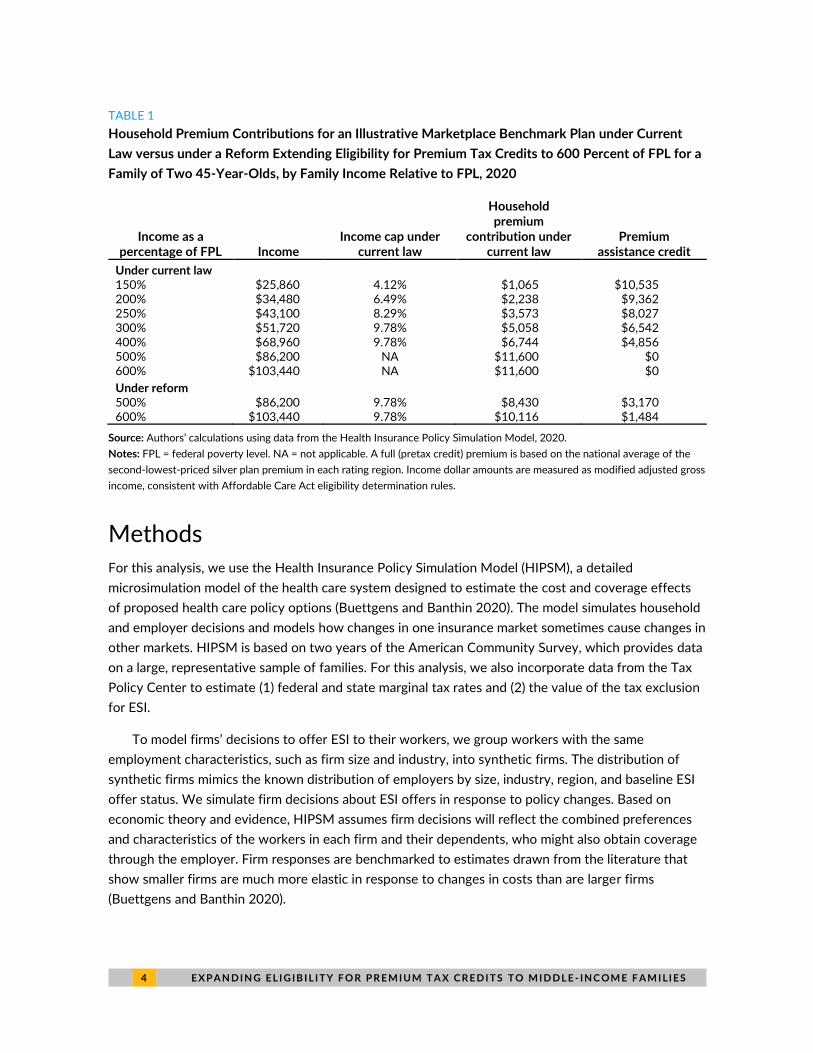
example, a family of two 45-year-olds with family income just below 400 percent of FPL ($68,960 in
2020) would pay $6,744 annually for the average benchmark plan (table 1). A similar family with
income just below 500 percent of FPL ($86,200 in 2020) would receive no subsidy today: under
current law they would pay the full premium, or $11,600 annually, for the average benchmark plan.
Under a policy of expanded eligibility for tax credits, the same family with income just below 500
percent of FPL would pay $8,430 in premiums annually. A similar family with income just below 600
percent of FPL ($103,440 in 2020) would pay $10,116 annually.
As noted above, under current law, some families face a subsidy cliff at 400 percent of FPL. When
their income falls at or just below that level, they are eligible for tax subsidies to purchase insurance,
but if they earn just a few dollars more than that threshold, they are ineligible for any subsidy. If the
example family above earned a few dollars more than $68,960, they would lose their premium tax
credit of $6,744 and be faced with the full cost of coverage—in this case, about $11,600.
By extending the cutoff on premium tax credit eligibility to 600 percent of FPL, the reform would
reduce the size of the cliff and the number of people facing it. First, there are fewer families and
individuals with incomes near 600 percent of FPL than with incomes near 400 percent of FPL, so
fewer people would be potentially exposed to the cliff.6 Second, the size of the cliff, measured by the
value of premium tax credits, shrinks as incomes rise. Fewer families with incomes above 400 percent
of FPL would face a full premium exceeding 9.78 percent of their income.7 In the example above, for
instance, a family with income slightly exceeding 400 percent of FPL would lose $4,856 in annual
insurance subsidies under current law (table 1). Under the reform, a family with income slightly
exceeding 600 percent of FPL would lose only about one-third that amount, $1,484 in annual
insurance subsidies.8
4 E X P A N D I N G E L I G IB I L I TY F O R P R E M I UM T A X C R E D I T S T O M I D D L E - IN C OM E F A M I LI E S
TABLE 1
Household Premium Contributions for an Illustrative Marketplace Benchmark Plan under Current
Law versus under a Reform Extending Eligibility for Premium Tax Credits to 600 Percent of FPL for a
Family of Two 45-Year-Olds, by Family Income Relative to FPL, 2020
Income as a percentage of FPL
Income Income cap under
current law
Household premium
contribution under current law
Premium assistance credit
Under current law 150% $25,860 4.12% $1,065 $10,535 200% $34,480 6.49% $2,238 $9,362 250% $43,100 8.29% $3,573 $8,027 300% $51,720 9.78% $5,058 $6,542 400% $68,960 9.78% $6,744 $4,856 500% $86,200 NA $11,600 $0 600% $103,440 NA $11,600 $0
Under reform 500% $86,200 9.78% $8,430 $3,170 600% $103,440 9.78% $10,116 $1,484
Source: Authors’ calculations using data from the Health Insurance Policy Simulation Model, 2020.
Notes: FPL = federal poverty level. NA = not applicable. A full (pretax credit) premium is based on the national average of the
second-lowest-priced silver plan premium in each rating region. Income dollar amounts are measured as modified adjusted gross
income, consistent with Affordable Care Act eligibility determination rules.
Methods
For this analysis, we use the Health Insurance Policy Simulation Model (HIPSM), a detailed
microsimulation model of the health care system designed to estimate the cost and coverage effects
of proposed health care policy options (Buettgens and Banthin 2020). The model simulates household
and employer decisions and models how changes in one insurance market sometimes cause changes in
other markets. HIPSM is based on two years of the American Community Survey, which provides data
on a large, representative sample of families. For this analysis, we also incorporate data from the Tax
Policy Center to estimate (1) federal and state marginal tax rates and (2) the value of the tax exclusion
for ESI.
To model firms’ decisions to offer ESI to their workers, we group workers with the same
employment characteristics, such as firm size and industry, into synthetic firms. The distribution of
synthetic firms mimics the known distribution of employers by size, industry, region, and baseline ESI
offer status. We simulate firm decisions about ESI offers in response to policy changes. Based on
economic theory and evidence, HIPSM assumes firm decisions will reflect the combined preferences
and characteristics of the workers in each firm and their dependents, who might also obtain coverage
through the employer. Firm responses are benchmarked to estimates drawn from the literature that
show smaller firms are much more elastic in response to changes in costs than are larger firms
(Buettgens and Banthin 2020).
E X P A N D I N G E L I G IB I L I TY F O R P R E M I UM T A X C R E D I T S T O M I D D L E - IN C OM E F A M I LI E S 5
Employers’ Decisions about Offering Coverage
to Employees
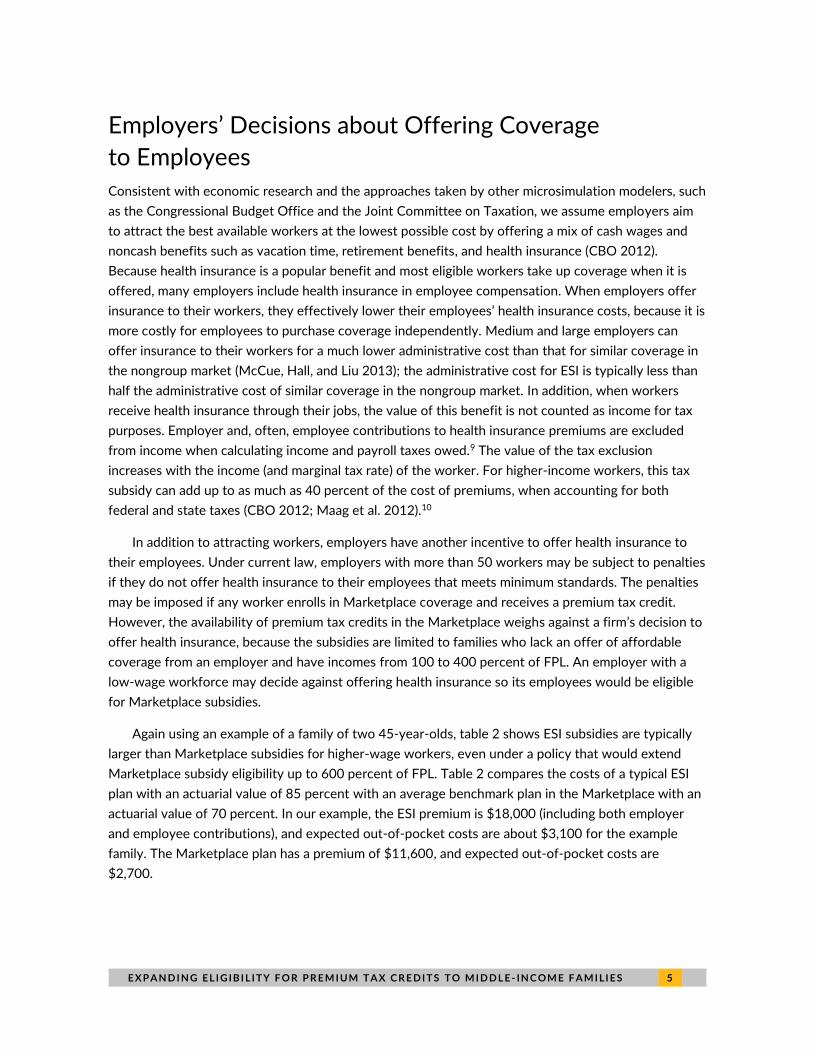
Consistent with economic research and the approaches taken by other microsimulation modelers, such
as the Congressional Budget Office and the Joint Committee on Taxation, we assume employers aim
to attract the best available workers at the lowest possible cost by offering a mix of cash wages and
noncash benefits such as vacation time, retirement benefits, and health insurance (CBO 2012).
Because health insurance is a popular benefit and most eligible workers take up coverage when it is
offered, many employers include health insurance in employee compensation. When employers offer
insurance to their workers, they effectively lower their employees’ health insurance costs, because it is
more costly for employees to purchase coverage independently. Medium and large employers can
offer insurance to their workers for a much lower administrative cost than that for similar coverage in
the nongroup market (McCue, Hall, and Liu 2013); the administrative cost for ESI is typically less than
half the administrative cost of similar coverage in the nongroup market. In addition, when workers
receive health insurance through their jobs, the value of this benefit is not counted as income for tax
purposes. Employer and, often, employee contributions to health insurance premiums are excluded
from income when calculating income and payroll taxes owed.9 The value of the tax exclusion
increases with the income (and marginal tax rate) of the worker. For higher-income workers, this tax
subsidy can add up to as much as 40 percent of the cost of premiums, when accounting for both
federal and state taxes (CBO 2012; Maag et al. 2012).10
In addition to attracting workers, employers have another incentive to offer health insurance to
their employees. Under current law, employers with more than 50 workers may be subject to penalties
if they do not offer health insurance to their employees that meets minimum standards. The penalties
may be imposed if any worker enrolls in Marketplace coverage and receives a premium tax credit.
However, the availability of premium tax credits in the Marketplace weighs against a firm’s decision to
offer health insurance, because the subsidies are limited to families who lack an offer of affordable
coverage from an employer and have incomes from 100 to 400 percent of FPL. An employer with a
low-wage workforce may decide against offering health insurance so its employees would be eligible
for Marketplace subsidies.
Again using an example of a family of two 45-year-olds, table 2 shows ESI subsidies are typically
larger than Marketplace subsidies for higher-wage workers, even under a policy that would extend
Marketplace subsidy eligibility up to 600 percent of FPL. Table 2 compares the costs of a typical ESI
plan with an actuarial value of 85 percent with an average benchmark plan in the Marketplace with an
actuarial value of 70 percent. In our example, the ESI premium is $18,000 (including both employer
and employee contributions), and expected out-of-pocket costs are about $3,100 for the example
family. The Marketplace plan has a premium of $11,600, and expected out-of-pocket costs are
$2,700.
6 E X P A N D I N G E L I G IB I L I TY F O R P R E M I UM T A X C R E D I T S T O M I D D L E - IN C OM E F A M I LI E S
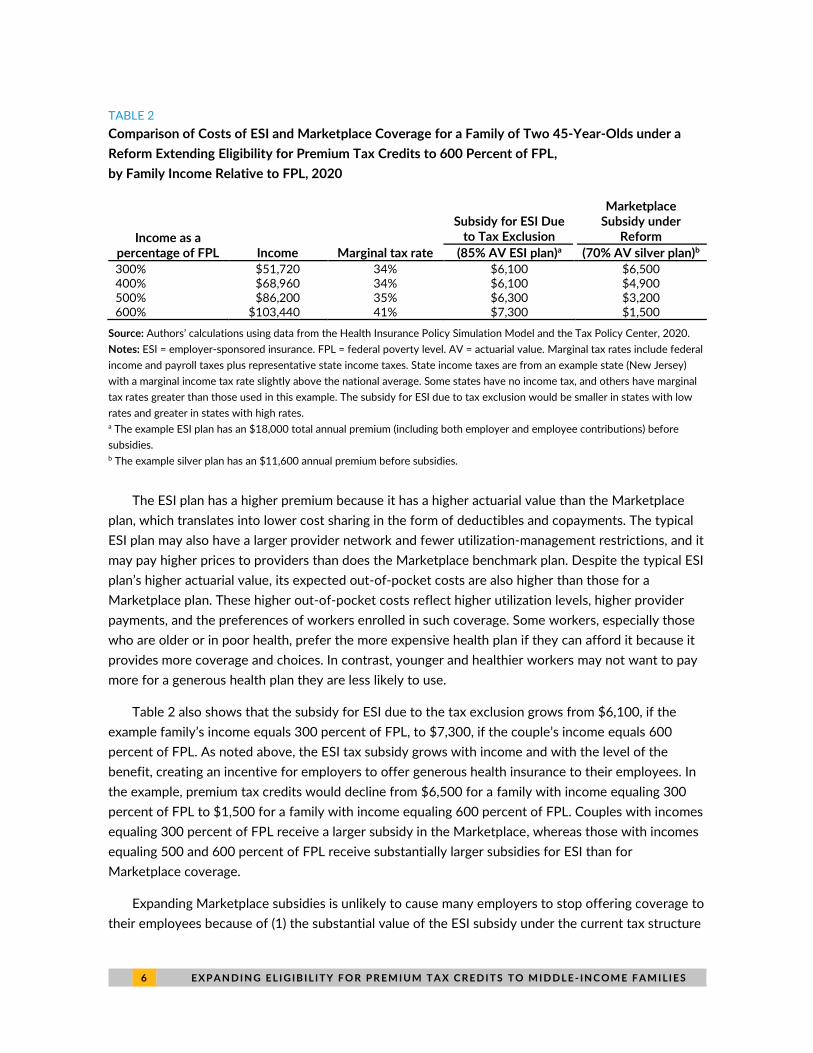
TABLE 2
Comparison of Costs of ESI and Marketplace Coverage for a Family of Two 45-Year-Olds under a
Reform Extending Eligibility for Premium Tax Credits to 600 Percent of FPL,
by Family Income Relative to FPL, 2020
Income as a percentage of FPL Income Marginal tax rate
Subsidy for ESI Due to Tax Exclusion
Marketplace Subsidy under
Reform
(85% AV ESI plan)a (70% AV silver plan)b
300% $51,720 34% $6,100 $6,500 400% $68,960 34% $6,100 $4,900 500% $86,200 35% $6,300 $3,200 600% $103,440 41% $7,300 $1,500
Source: Authors’ calculations using data from the Health Insurance Policy Simulation Model and the Tax Policy Center, 2020.
Notes: ESI = employer-sponsored insurance. FPL = federal poverty level. AV = actuarial value. Marginal tax rates include federal
income and payroll taxes plus representative state income taxes. State income taxes are from an example state (New Jersey)
with a marginal income tax rate slightly above the national average. Some states have no income tax, and others have marginal
tax rates greater than those used in this example. The subsidy for ESI due to tax exclusion would be smaller in states with low
rates and greater in states with high rates. a The example ESI plan has an $18,000 total annual premium (including both employer and employee contributions) before
subsidies. b The example silver plan has an $11,600 annual premium before subsidies.
The ESI plan has a higher premium because it has a higher actuarial value than the Marketplace
plan, which translates into lower cost sharing in the form of deductibles and copayments. The typical
ESI plan may also have a larger provider network and fewer utilization-management restrictions, and it
may pay higher prices to providers than does the Marketplace benchmark plan. Despite the typical ESI
plan’s higher actuarial value, its expected out-of-pocket costs are also higher than those for a
Marketplace plan. These higher out-of-pocket costs reflect higher utilization levels, higher provider
payments, and the preferences of workers enrolled in such coverage. Some workers, especially those
who are older or in poor health, prefer the more expensive health plan if they can afford it because it
provides more coverage and choices. In contrast, younger and healthier workers may not want to pay
more for a generous health plan they are less likely to use.
Table 2 also shows that the subsidy for ESI due to the tax exclusion grows from $6,100, if the
example family’s income equals 300 percent of FPL, to $7,300, if the couple’s income equals 600
percent of FPL. As noted above, the ESI tax subsidy grows with income and with the level of the
benefit, creating an incentive for employers to offer generous health insurance to their employees. In
the example, premium tax credits would decline from $6,500 for a family with income equaling 300
percent of FPL to $1,500 for a family with income equaling 600 percent of FPL. Couples with incomes
equaling 300 percent of FPL receive a larger subsidy in the Marketplace, whereas those with incomes
equaling 500 and 600 percent of FPL receive substantially larger subsidies for ESI than for
Marketplace coverage.
Expanding Marketplace subsidies is unlikely to cause many employers to stop offering coverage to
their employees because of (1) the substantial value of the ESI subsidy under the current tax structure
E X P A N D I N G E L I G IB I L I TY F O R P R E M I UM T A X C R E D I T S T O M I D D L E - IN C OM E F A M I LI E S 7
and (2) stable rates of employers offering coverage after ACA implementation. In 2013, the year
before implementation of most of the ACA’s coverage reforms, about 85 percent of all employers
offered health insurance to their employees; offer rates remained steady in the wake of the newly
available Marketplace subsidies (Gangopadhyaya and Garrett 2020; McMorrow, Blumberg, and
Holahan 2020; Miller, Keenan, and Vistnes 2019). Over 2014 and 2015, some small firms (50 or fewer
workers) that had previously offered insurance dropped coverage, while others that had not offered
insurance began offering it, resulting in stable patterns of coverage among small firms (Vistnes et al.
2017). Among medium-size firms (51 to 100 workers), about 27 percent added and 3 percent dropped
offers of coverage during this period. Ninety-eight percent of large firms (100 or more workers)
offered insurance in 2013. Between 2014 and 2018, offer rates increased among both medium and
large firms (Miller, Keenan, and Vistnes 2019).
Results
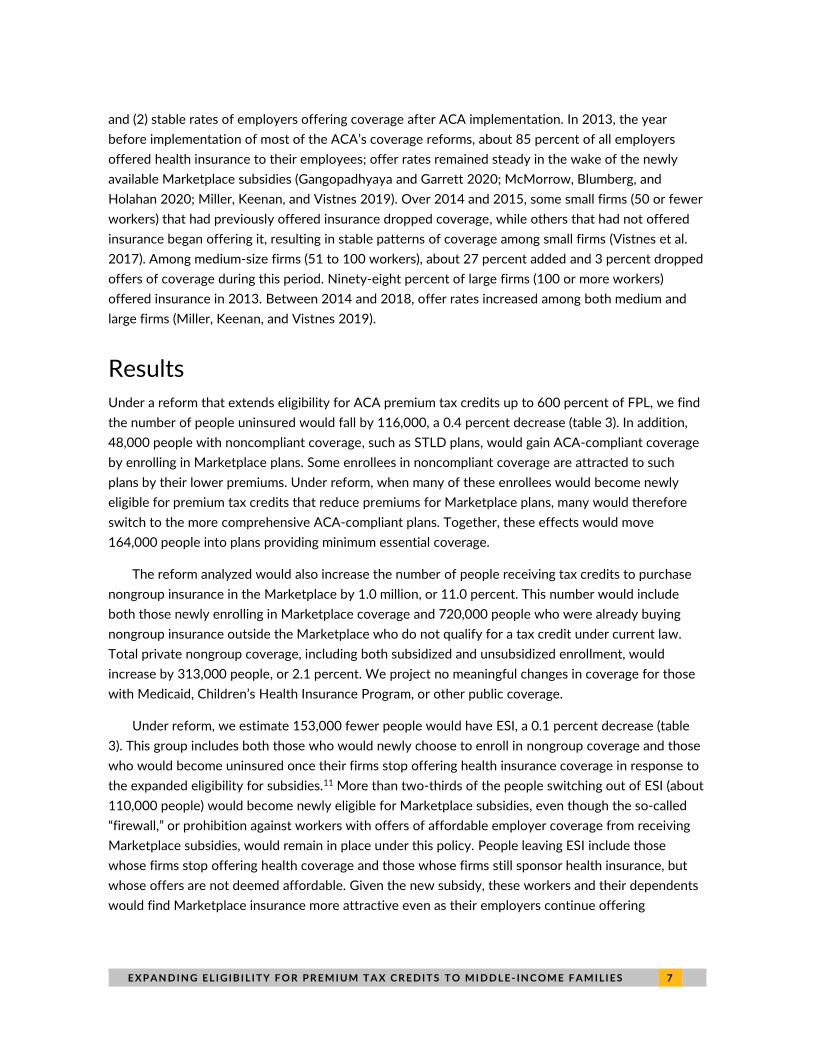
Under a reform that extends eligibility for ACA premium tax credits up to 600 percent of FPL, we find
the number of people uninsured would fall by 116,000, a 0.4 percent decrease (table 3). In addition,
48,000 people with noncompliant coverage, such as STLD plans, would gain ACA-compliant coverage
by enrolling in Marketplace plans. Some enrollees in noncompliant coverage are attracted to such
plans by their lower premiums. Under reform, when many of these enrollees would become newly
eligible for premium tax credits that reduce premiums for Marketplace plans, many would therefore
switch to the more comprehensive ACA-compliant plans. Together, these effects would move
164,000 people into plans providing minimum essential coverage.
The reform analyzed would also increase the number of people receiving tax credits to purchase
nongroup insurance in the Marketplace by 1.0 million, or 11.0 percent. This number would include
both those newly enrolling in Marketplace coverage and 720,000 people who were already buying
nongroup insurance outside the Marketplace who do not qualify for a tax credit under current law.
Total private nongroup coverage, including both subsidized and unsubsidized enrollment, would
increase by 313,000 people, or 2.1 percent. We project no meaningful changes in coverage for those
with Medicaid, Children’s Health Insurance Program, or other public coverage.
Under reform, we estimate 153,000 fewer people would have ESI, a 0.1 percent decrease (table
3). This group includes both those who would newly choose to enroll in nongroup coverage and those
who would become uninsured once their firms stop offering health insurance coverage in response to
the expanded eligibility for subsidies.11 More than two-thirds of the people switching out of ESI (about
110,000 people) would become newly eligible for Marketplace subsidies, even though the so-called
“firewall,” or prohibition against workers with offers of affordable employer coverage from receiving
Marketplace subsidies, would remain in place under this policy. People leaving ESI include those
whose firms stop offering health coverage and those whose firms still sponsor health insurance, but
whose offers are not deemed affordable. Given the new subsidy, these workers and their dependents
would find Marketplace insurance more attractive even as their employers continue offering
8 E X P A N D I N G E L I G IB I L I TY F O R P R E M I UM T A X C R E D I T S T O M I D D L E - IN C OM E F A M I LI E S
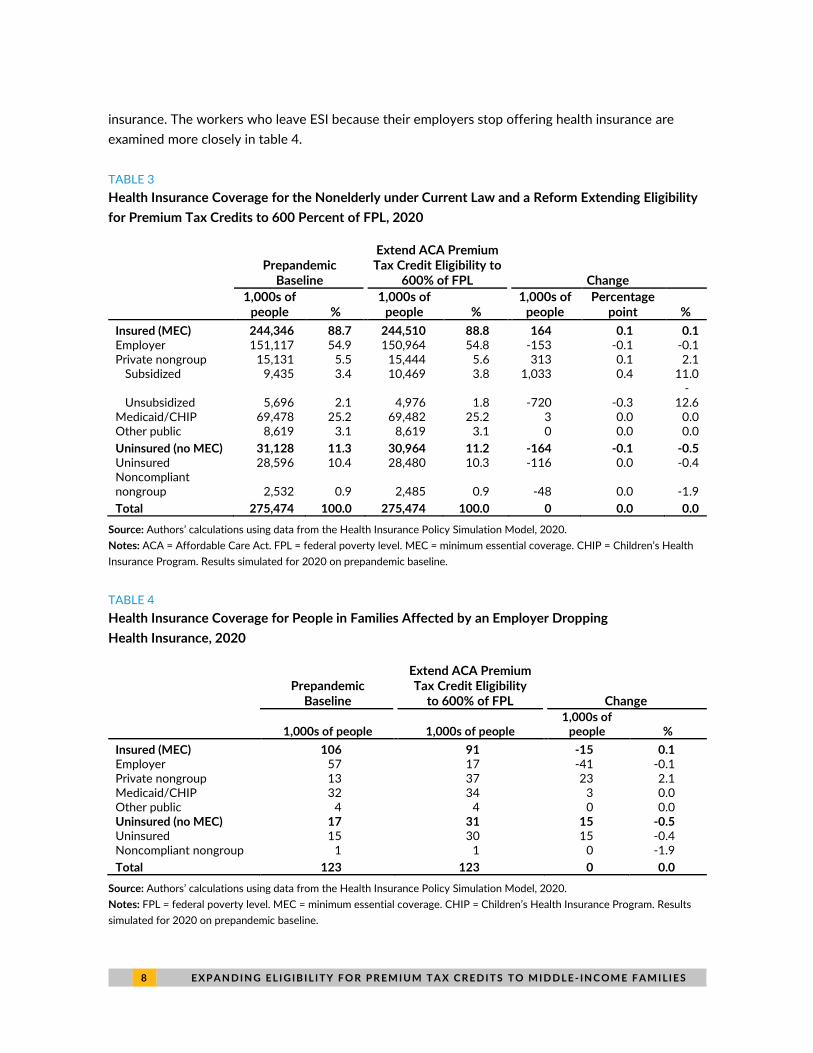
insurance. The workers who leave ESI because their employers stop offering health insurance are
examined more closely in table 4.
TABLE 3
Health Insurance Coverage for the Nonelderly under Current Law and a Reform Extending Eligibility
for Premium Tax Credits to 600 Percent of FPL, 2020
Prepandemic
Baseline
Extend ACA Premium Tax Credit Eligibility to
600% of FPL Change
1,000s of
people % 1,000s of
people % 1,000s of
people Percentage
point %
Insured (MEC) 244,346 88.7 244,510 88.8 164 0.1 0.1 Employer 151,117 54.9 150,964 54.8 -153 -0.1 -0.1 Private nongroup 15,131 5.5 15,444 5.6 313 0.1 2.1
Subsidized 9,435 3.4 10,469 3.8 1,033 0.4 11.0
Unsubsidized 5,696 2.1 4,976 1.8 -720 -0.3 -
12.6 Medicaid/CHIP 69,478 25.2 69,482 25.2 3 0.0 0.0 Other public 8,619 3.1 8,619 3.1 0 0.0 0.0
Uninsured (no MEC) 31,128 11.3 30,964 11.2 -164 -0.1 -0.5 Uninsured 28,596 10.4 28,480 10.3 -116 0.0 -0.4 Noncompliant nongroup 2,532 0.9 2,485 0.9 -48 0.0 -1.9
Total 275,474 100.0 275,474 100.0 0 0.0 0.0
Source: Authors’ calculations using data from the Health Insurance Policy Simulation Model, 2020.
Notes: ACA = Affordable Care Act. FPL = federal poverty level. MEC = minimum essential coverage. CHIP = Children’s Health
Insurance Program. Results simulated for 2020 on prepandemic baseline.
TABLE 4
Health Insurance Coverage for People in Families Affected by an Employer Dropping
Health Insurance, 2020
Prepandemic
Baseline
Extend ACA Premium Tax Credit Eligibility
to 600% of FPL Change
1,000s of people 1,000s of people 1,000s of
people %
Insured (MEC) 106 91 -15 0.1 Employer 57 17 -41 -0.1 Private nongroup 13 37 23 2.1 Medicaid/CHIP 32 34 3 0.0 Other public 4 4 0 0.0 Uninsured (no MEC) 17 31 15 -0.5 Uninsured 15 30 15 -0.4 Noncompliant nongroup 1 1 0 -1.9
Total 123 123 0 0.0
Source: Authors’ calculations using data from the Health Insurance Policy Simulation Model, 2020.
Notes: FPL = federal poverty level. MEC = minimum essential coverage. CHIP = Children’s Health Insurance Program. Results
simulated for 2020 on prepandemic baseline.
E X P A N D I N G E L I G IB I L I TY F O R P R E M I UM T A X C R E D I T S T O M I D D L E - IN C OM E F A M I LI E S 9
We estimate firms employing about 50,000 workers would stop offering insurance because of this
policy.12 However, not all of those workers and their dependents are enrolled in an employer plan
under current law. In table 4, we provide a closer look at the resulting changes in coverage among
those workers and their family members, a group totaling 123,000 people. We estimate less than half
of this group (57,000 workers and dependents) are enrolled in ESI under current law. Others are
enrolled in nongroup coverage (13,000) and Medicaid (32,000), whereas 15,000 are uninsured (table
4). Also, some families that would lose coverage under the policy would have access to another offer
of ESI through a spouse, which we estimate most would take up. Under the policy, we estimate
41,000 people would ultimately lose ESI coverage. Of those losing ESI, 23,000 would move to
nongroup coverage and 3,000 would enroll in Medicaid. We expect 15,000 people would become
uninsured.
These changes in coverage would increase federal spending by $4.0 billion. Premium tax credit
spending would increase by $4.5 billion, or 8 percent, but would be offset somewhat by a $0.5 billion
drop in spending on uncompensated care as the number of people uninsured falls. The increase in the
federal deficit from the additional spending would also be offset by $0.3 billion in increased federal
revenues, because people who lose ESI are expected to receive higher taxable wages in lieu of
employer-paid premiums.
Discussion
We find a policy that extends premium tax credits to people with incomes up to 600 percent of FPL
would reduce the number of people uninsured by 116,000 and newly provide minimum essential
coverage to almost another 50,000 people currently buying lower-value STLD plans. It would also
improve affordability of coverage among targeted families without access to affordable employer-
sponsored coverage and reduce the subsidy cliff by shifting it to 600 percent FPL and decreasing its
size. Expanding eligibility for premium tax credits as described here is a relatively small reform that
would cost $4.0 billion in federal spending.
We estimate about 15,000 people would become newly uninsured under this reform, about 6,000
of whom have incomes below 400 percent of FPL. Most of these 15,000 people would be eligible for
subsidized coverage in the Marketplace. If this premium tax credit expansion were combined with
other reforms, however, that number might be reduced. For example, a reform that increases outreach
and enrollment assistance to people eligible for subsidized coverage but uninsured could reduce the
number of people becoming uninsured. Also, firms that do not offer ESI might assist employees in
signing up for Marketplace coverage or Medicaid, further increasing coverage.
In addition to immediate effects on affordability and coverage, the policy may have longer-term
effects that would promote competitiveness and stability in nongroup insurance markets. The number
of people receiving premium tax credits through the Marketplace would increase notably by 1.0
million, or more than 10 percent. The larger market size might encourage insurers to newly enter the
market, expand their existing participation to new rating areas, or increase plan offerings.
1 0 E X P A N D I N G E L I G IB I L I TY F O R P R E M I UM T A X C R E D I T S T O M I D D L E - IN C OM E F A M I LI E S
Notes 1 Self-employed people in this group may benefit from the self-employment tax deduction of health insurance
premiums.
2 For a family of two adults, this FPL represents income between $67,640 and $101,460.
3 These caps change slightly from year to year. In 2021, the cap is 9.83 percent of income.
4 A small number of self-employed people take advantage of the deduction for health insurance allowed under current law.
5 Families are referred to here as being similar if they have the same number of members of the same age and
live in the same premium rating region.
6 According to the Health Insurance Policy Simulation Model, 2.6 million people under age 65 have incomes
between 395 and 405 percent of FPL, including 143,000 uninsured people and 131,000 people with nongroup
coverage. About 1.3 million people in this age range have incomes between 595 and 605 percent of FPL,
including 44,000 uninsured people and 43,000 people with nongroup coverage.
7 People who might face premiums exceeding 9.78 percent of their income include those who are older, have
large families, or live in geographic areas with higher premiums.
8 Elimination or reduction of the premium tax credit subsidy cliff would reduce disincentives to work for
people with incomes near the cliff, but other incentives could offset this change for people in the new subsidy
income range. People leaving ESI to take up the nongroup subsidy would see an increase in their effective
marginal tax rate as they lose the tax preference for their health premiums.
9 Employee contributions to Flexible Spending Accounts, Health Savings Accounts, and Health Reimbursement
Arrangements are also excluded from income and payroll taxes. See “Reduce Tax Subsidies for Employment-
Based Health Insurance,” Congressional Budget Office, December 13, 2018, https://www.cbo.gov/budget-
options/54798.
10 This estimate reflects savings after accounting for federal and state income and payroll taxes and uses New
Jersey to represent the median state tax rate.
11 This group also includes a very small number of people who would enroll in Medicaid.
12 About 95 percent of those firms are estimated to have fewer than 25 employees.
References Buettgens, Matthew, and Jessica Banthin. 2020. The Health Insurance Policy Simulation Model for 2020.
Washington, DC: Urban Institute.
CBO (Congressional Budget Office). 2012. CBO and JCT’s Estimates of the Effects of the Affordable Care Act on the Number of People Obtaining Employment-Based Health Insurance. Washington, DC: Congressional Budget Office.
Gangopadhyaya, Anuj, and Bowen Garrett. 2020. “How Workers Fared under the ACA.” Journal of Health Politics, Policy and Law 45 (5): 863–87.
Maag, Elaine, C. Eugene Steuerle, Ritadhi Chakravarti, and Caleb Quakenbush. 2012. “How Marginal Tax Rates Affect Families at Various Levels of Poverty.” National Tax Journal 65 (4): 759–82.
McCue, Michael, Mark Hall, and Xinliang Liu. 2013. “Impact of Medical Loss Regulation on the Financial Performance of Health Insurers.” Health Affairs 32 (9). https://doi.org/10.1377/hlthaff.2012.1316.
McMorrow, Stacey, Linda J. Blumberg, and John Holahan. 2020. “Ten Years Later: Reflections on Critics’ Worst-Case Scenarios for the Affordable Care Act.” Journal of Health Politics, Policy and Law 45 (4): 465–83.
E X P A N D I N G E L I G IB I L I TY F O R P R E M I UM T A X C R E D I T S T O M I D D L E - IN C OM E F A M I LI E S 1 1
Miller, G. Edward, Patricia Keenan, and Jessica Vistnes. 2019. “Trends in Health Insurance at Private Employers, 2008–2018.” Statistical brief 524. Rockville, MD: Agency for Healthcare Research and Quality.
Vistnes, Jessica P., Frederick Rohde, G. Edward Miller, and Philip F. Cooper. 2017. “Substantial Churn in Health Insurance Offerings by Small Employers, 2014–15.” Health Affairs 36 (9): 1632–36. https://doi.org/10.1377/hlthaff.2017.0431.
About the Authors
Jessica Banthin is a senior fellow in the Health Policy Center at the Urban Institute, where she studies
the effects of health insurance reform policies on coverage and costs. Before joining the Urban
Institute, she served more than 25 years in the federal government, most recently as deputy director
for health at the Congressional Budget Office. During her eight-year term at the Congressional Budget
Office, Banthin directed the production of numerous major cost estimates of legislative proposals to
modify the Affordable Care Act. She has special expertise in the design of microsimulation models for
analyzing health insurance coverage and a deep background in the design and use of household and
employer survey data. She earned her PhD in economics from the University of Maryland, College
Park, and her AB from Harvard University.
Michael Simpson is a principal research associate in the Health Policy Center with 25 years of
experience developing economic models and using survey and administrative data. His current work
focuses on using Urban’s Health Insurance Policy Simulation Model to project health insurance
coverage and spending both in the baseline and under policy alternatives. Before joining Urban,
Simpson developed the Congressional Budget Office’s long-term dynamic microsimulation model. He
analyzed numerous policy reform proposals, investigated differences between various projections of
Social Security finances and benefits, quantified the importance of Monte Carlo variation in model
results, and created multiple methods to demonstrate uncertainty in projections.
1 2 E X P A N D I N G E L I G IB I L I TY F O R P R E M I UM T A X C R E D I T S T O M I D D L E - IN C OM E F A M I LI E S
Acknowledgments
This brief was funded by the Bernard and Anne Spitzer Charitable Trust. We are grateful to them and
to all our funders, who make it possible for Urban to advance its mission.
The views expressed are those of the authors and should not be attributed to the Urban Institute,
its trustees, or its funders. Funders do not determine research findings or the insights and
recommendations of Urban experts. Further information on the Urban Institute’s funding principles is
available at urban.org/fundingprinciples.
The authors are grateful for review and comments by David Weiner, Linda Blumberg, and John
Holahan and for editorial assistance by Rachel Kenney and Elaine Eldridge.
ABOUT THE URBAN INSTITUTE The nonprofit Urban Institute is a leading research organization dedicated to developing evidence-based insights that improve people’s lives and strengthen communities. For 50 years, Urban has been the trusted source for rigorous analysis of complex social and economic issues; strategic advice to policymakers, philanthropists, and practitioners; and new, promising ideas that expand opportunities for all. Our work inspires effective decisions that advance fairness and enhance the well-being of people and places.
Copyright © February 2021. Urban Institute. Permission is granted for reproduction of this file, with attribution to the Urban Institute.
500 L’Enfant Plaza SW Washington, DC 20024
www.urban.org