Exmoor National Park Annual Monitoring Report2013-2014€¦ · View or download the AMR on ... 2.2...
65
Exmoor National Park AnnualMonitoringReport 2013-2014
Transcript of Exmoor National Park Annual Monitoring Report2013-2014€¦ · View or download the AMR on ... 2.2...

Exmoor National ParkAnnual�Monitoring�Report 2013-2014

Annual Monitoring Report 2013/14
Support to the Community & Business 1
If you have any queries relating to the Annual Monitoring Report please contact:
Policy & Community Team Exmoor National Park Authority Exmoor House Dulverton Somerset TA22 9HL
Tel: 01398 323665 E-mail: [email protected]
View or download the AMR on our website:
www.exmoor-nationalpark.gov.uk/planning/planning-policy/local-development-framework/annual-monitoring-reports
Annual Monitoring Report 2013/14
Support to the Community & Business 2
CONTENTS 1 2013/14 HEADLINE INFORMATION ........................................................ 4
2 CHALLENGES & OPPORTUNITIES ......................................................... 6
3 INTRODUCTION ..................................................................................... 11
4 LOCAL DEVELOPMENT SCHEME IMPLEMENTATION ....................... 13
5 DUTY TO COOPERATE ......................................................................... 17
6 EXMOOR NATIONAL PARK PROFILE .................................................. 18
7 POLICY PERFORMANCE ...................................................................... 22
8 EVALUATION OF PLANNING APPLICATIONS ..................................... 54
9 APPENDIX 1: HOUSING COMPLETIONS 2013/14 ................................ 58
10 APPENDIX 2 – STATUS OF EXMOOR’S RIVERS AND STREAMS ... 63
11 GLOSSARY ......................................................................................... 64

Annual Monitoring Report 2013/14
Support to the Community & Business 3
This page has been intentionally left blank

Annual Monitoring Report 2013/14
Support to the Community & Business 4
1 2013/14 HEADLINE INFORMATION PROGRESS ON THE EMERGING LOCAL PLAN 1.1 Progress made during the reporting period 1 April 2013 to 31 March 2014 in preparing
the Exmoor National Park Local Plan included:
Completing policy drafting through discussion with officers and members of the Local Plan Advisory Group in preparation for the Authority to formally consider the full policy framework of the draft Local Plan.
Consulting on the Draft Exmoor National Park Local Plan between November and December 2013.
Continued support to the Lynton & Lynmouth community in finalisation of their Neighbourhood Plan, including submission of the draft Lyn Plan to the National Park Authority. The community referendum was held on Thursday 21 November 2013 when the majority voted in favour of the Neighbourhood Plan. The results were: YES - 187 votes; NO - 45 votes. The Lyn Plan has been made part of the development plan for the Lynton & Lynmouth neighbourhood area by Exmoor National Park Authority and will be used to decide planning applications locally.
Progressing key elements of the Local Plan evidence base including the Open Space Strategy, Orchard Review and Landscape Sensitivity Study, Strategic Flood Risk Assessment (SFRA) Level 1 Addendum, Strategic Housing Market Area Assessment (SHMAA) Update, and Strategic Housing Availability Assessment (SHLAA).
POLICY IMPLEMENTATION AND MONITORING
1.2 The development plan for the National Park consists of the ‘saved’ policies within the adopted Exmoor National Park Local Plan 2001-20111. The Local Plan was adopted in March 2005 and the key policy aims are well established, particularly with regard to the provision of local needs affordable housing.
1.3 Affordable Housing: The Authority continues to be proactive in putting in place mechanisms to assist with achievement of affordable housing consistent with Plan policies. For instance, working closely with the local Rural Housing Project to deliver local needs affordable and intermediate (e.g. self-build and shared-ownership) housing. During the monitoring period 20 affordable homes were completed:
15 at Villes Lane, Porlock 1 at Sparkhayes Campsite, Porlock 1 at Dulverton 1 at Winsford 1 at Withypool 1 at Brendon
A further 9 affordable housing units were under construction (1 at Dunster, 2 at Cutcombe, 2 at Dulverton, 2 at Lynton and 2 at Lynmouth) and a further 14 affordable
1 The Somerset & Exmoor National Park Joint Structure Plan was formally abolished on 20th May 2013 – see Chapter 3 for further information.

Annual Monitoring Report 2013/14
Support to the Community & Business 5
units have planning permission but construction has not started (2 at Exton, 3 at Roadwater, 4 at Lynton, 4 at Lynmouth and 1 at North Molton)2.
1.4 Renewable Energy: The introduction of the national ‘Feed in Tariff’ (FIT) in 2010 and local schemes including Carbon Neutral Exmoor3 encouraged the installation of renewable energy technologies. This resulted in a significant increase in applications for renewable energy systems, particularly solar photovoltaic panels.
1.5 However the previous monitoring year 2012/13 saw a decline in the number of applications, likely to be in response to changes to the FIT payments. This monitoring year has seen the level of applications for renewable energy technologies stabilise at a similar level to that of 2012/13. It should be noted that some technologies can be installed through permitted development rights - a class of development that is automatically granted planning permission by the Government.
1.6 November 2011 also saw the introduction of the renewable heat incentive (RHI); a Government initiative that pays for heat produced from some renewable energy systems to heat buildings for the non-domestic sector (businesses, industry and public sector). The Exmoor Woodheat project4 made 12 grants of £3,000 available for domestic log, wood chip/pellet heating systems approved under the Microgeneration Certification Scheme.
1.7 The Government’s domestic RHI scheme opened in April 2014 as a financial incentive scheme designed to encourage uptake of renewable heating among domestic consumers. The domestic RHI is targeted at, but not limited to, homes off the gas grid, as those without mains gas have the most potential to save on fuel bills and decrease carbon emissions. The scheme covers single domestic dwellings and is open to homeowners, private landlords, social landlords and self-builders. It is not open to new build properties other than self-build. This monitoring year has seen a slight increase in the number of applications for woodchip/biomass boiler installations and associated infrastructure.
1.8 Economic Development: During the monitoring period the Authority permitted a range of economic development proposals including two major development proposals.
Business Development: The most significant development was an extension to the existing business premises at Shearwell Data near Wheddon Cross. Other development proposals included: a new workshop adjoining an existing forge; change of use and conversion of former public conveniences to a commercial building; change of use of flat to offices and retail floorspace for archive storage.
Agriculture and Forestry: Applications for this sector included 6km of track creation and 5km of track improvements and 33 agricultural buildings and extensions.
Tourism: A major application was approved for a Visitor hub and enhanced recreational facilities at Nutcombe Bottom (Dunster Forest Park). Additional proposals included the retention of miniature railway and storage shed at Woody Bay station; creation of 6 self catering holiday units through conversion or change of use of existing buildings; and small scale provision of other serviced and non-serviced accommodation.
2 Note: This relates to the status of construction during the monitoring period. Planning consents may have been issued outside the monitoring period. 3 A 3 year project funded through the Low Carbon Communities Challenge and instigated by Exmoor National Park Authority to help to transform Exmoor into a low carbon community. 4 A project managed by Exmoor National Park Authority with funding from the Department of Energy and Climate Change.

Annual Monitoring Report 2013/14
Support to the Community & Business 6
2 CHALLENGES & OPPORTUNITIES LOCAL PLAN 2.1 Following on from progress made during this monitoring year (see page 4, para 1.1), the
key stages for the 2014/15 monitoring year are:
To ensure the evidence base is up to date to inform the Publication Version of the Local Plan and the Plan Policies (Proposals) Map;
Considering the responses to the Draft Local Plan consultation; and amending the Plan as necessary;
Engaging partners to finalise and sign up to the Duty to Co-operate Protocol; Finalising the Publication Draft Local Plan; Informal meeting with the Planning Inspectorate on the soundness of the Plan and
the evidence base; Authority to formally sign off Publication Version of the Local Plan for consultation.
2.2 The evidence base will include documents produced by the Policy and Community Team on an annual basis such as the Annual House Price Survey5 as well as commissioned studies and other relevant reports, plans and studies. Further consideration may also be required in relation to the Local Plan preparation if there is an announcement from Government on the S106 thresholds for affordable housing which may affect ability to deliver affordable housing on small brownfield sites including those arising from conversions (the Government consulted on these proposals during March – May 2014).
2.3 The publication of the National Planning Policy Framework (NPPF) in March 2012 has enabled it to be taken into account during drafting of the emerging Local Plan. The NPPF continues to give great weight to conserving landscape and scenic beauty in National Parks which have the highest status of protection. The NPPF also refers to the National Parks Vision and Circular6 .
2.4 The emerging Local Plan will address particular issues raised through consultation and engagement and those of national/international concern, including:
supporting businesses and communities
assisting in providing local needs affordable housing
responding to the challenges of climate change
encouraging access to the broadband and telecommunications network and
continuing to conserve and enhance Exmoor’s environment.
MAJOR DEVELOPMENTS
2.5 The criteria relating to the scale of major development is determined nationally. Major development means development of 10 dwellings or more, provision of non-residential building(s) with a floorspace of 1000m2 or more, development on a site of 1 hectare or more, minerals and waste development, or the winning or working of minerals7. During the 2013/14 the Authority approved two major applications:
5 These reports can be found at: www.exmoor-nationalpark.gov.uk/ldf_evidence_base.htm 6 English National Parks and the Broads UK Government Vision and Circular 2010 (Defra) 7 The Town and Country Planning (Development Management Procedure) (England) Order 2010 section (2)
Annual Monitoring Report 2013/14
Support to the Community & Business 7
At Shearwell Data Ltd within Cutcombe Parish for re-development of the site to replace an existing agricultural building and workshop lean-to with a purpose built B1 office, research and development and light industry workspace (2,153m² gross external area), 40kw roof mounted solar photo voltaic array, change of use and extension of existing agricultural storage building to B1 light industry (371m² gross external area), extension of car park, landscaping and new access drive.
A proposal by the Crown Estate for the development of a visitor hub building and recreational facilities including alterations to access at Nutcombe Bottom (Dunster Forest Park) in the Parish of Carhampton.
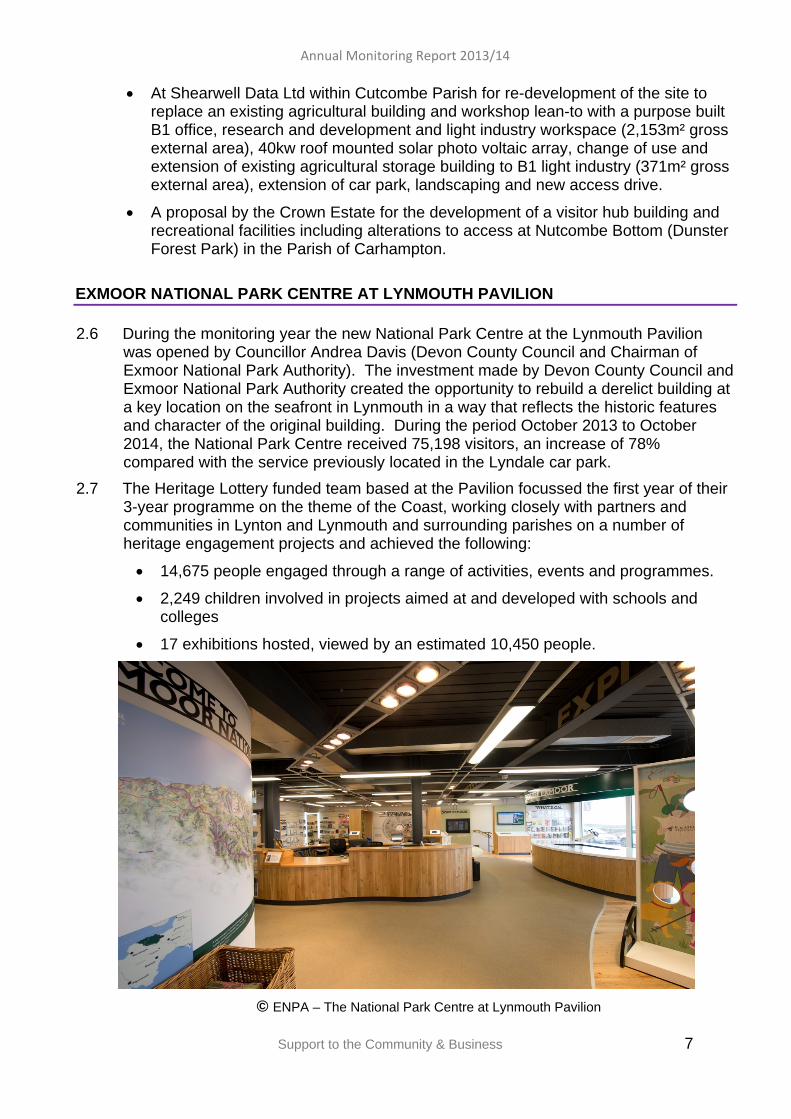
EXMOOR NATIONAL PARK CENTRE AT LYNMOUTH PAVILION 2.6 During the monitoring year the new National Park Centre at the Lynmouth Pavilion
was opened by Councillor Andrea Davis (Devon County Council and Chairman of Exmoor National Park Authority). The investment made by Devon County Council and Exmoor National Park Authority created the opportunity to rebuild a derelict building at a key location on the seafront in Lynmouth in a way that reflects the historic features and character of the original building. During the period October 2013 to October 2014, the National Park Centre received 75,198 visitors, an increase of 78% compared with the service previously located in the Lyndale car park.
2.7 The Heritage Lottery funded team based at the Pavilion focussed the first year of their 3-year programme on the theme of the Coast, working closely with partners and communities in Lynton and Lynmouth and surrounding parishes on a number of heritage engagement projects and achieved the following:
14,675 people engaged through a range of activities, events and programmes.
2,249 children involved in projects aimed at and developed with schools and colleges
17 exhibitions hosted, viewed by an estimated 10,450 people.
© ENPA – The National Park Centre at Lynmouth Pavilion

Annual Monitoring Report 2013/14
Support to the Community & Business 8
MOBILE INFRASTRUCTURE PROJECT AND RURAL BROADBAND DELIVERY
2.8 The Department for Culture, Media & Sport has begun implementing the Government’s Mobile Infrastructure Project. The project recognises that some rural areas of the UK do not get good quality mobile coverage and the Government is providing £150 million to improve mobile coverage in areas where there is currently no coverage from any of the Mobile Network Operators (known as ‘not-spots’) and where the market would not deliver.
2.9 Exmoor National Park Authority is continuing to work closely with the Mobile Infrastructure Project on potential opportunities to improve mobile coverage for those communities that have no mobile signal, while ensuring that Exmoor’s natural beauty is conserved. Work is ongoing and it is anticipated that the next monitoring period (April 2014-March 2015) will report outcomes enabling Exmoor’s communities to benefit from improved telecommunications coverage through delivery of the Project.
2.10 The Mobile Infrastructure Project is being run alongside the Government’s plans to improve the UK’s broadband network. The Government, through Broadband Delivery UK (BDUK), initially set aside £530 million of public funding to help BDUK reach 90 per cent of premises by 2016. Locally, the scheme is being delivered by the Connecting Devon and Somerset Programme (CDS), a public-private partnership of six local authorities (Somerset, Devon, North Somerset, Torbay, Plymouth and Bath and North East Somerset) and private delivery partner BT.
2.11 The Superfast Extension Programme (SEP) represents a further £250 million government funding investment with an ambition to extend Superfast Broadband to 95 per cent of the UK by the end of 2017 and following application by Devon and Somerset County Councils, the CDS programme will benefit from a further £22.75m.
2.12 The Devon and Somerset area has also been selected by central Government as one of the pilot areas for the £10 million innovation fund (set up to explore alternative technologies for the final 5%) and £175,000 has been granted to fund a pilot scheme in the area, coordinated directly by Broadband Delivery UK.
2.13 Through the monitoring period Exmoor National Park Authority has been working with CDS to ensure the best possible outcomes for Exmoor’s communities. The programme is currently evaluating areas in the National Park to determine which communities can benefit from faster broadband services through the scheme.
2.14 Exmoor and Dartmoor National Park Authorities also submitted a bid to the Rural Community Broadband Fund for funding for projects that will give the most remote or sparsely populated rural areas (which may not be covered by the Connecting & Somerset Programme) the potential to receive superfast broadband.
GOVERNMENT PROPOSALS FOR GREATER FLEXIBILITY FOR CHANGES OF USE
2.15 Between August-October 2013, the Department for Communities and Local Government consulted8 on greater flexibilities for change of use, including a proposal to introduce permitted development rights for existing buildings used for agricultural purposes to change to a dwelling house. Exmoor National Park Authority raised concerns that the conversion or redevelopment of agricultural barns to residential use would harm the special qualities of Exmoor; undermine the Authority’s focus on delivery of housing to meet the needs of the local community; and would be
8 The consultation proposed amendments to the Town and Country Planning (General Permitted Development) Order 1995.
Annual Monitoring Report 2013/14
Support to the Community & Business 9
detrimental to its ability to ensure the safeguarding of protected wildlife species and Exmoor’s Dark Sky Reserve status. Following similar objections from other National Park Authorities, the Government has excluded National Parks and other designated protected landscapes from this change to permitted development rights.
THRESHOLD FOR SECTION 106 AFFORDABLE HOUSING CONTRIBUTIONS
2.16 In the 2013 Autumn Statement, the Chancellor of the Exchequer announced a government intention to publish a consultation paper on proposals to introduce a 10-unit threshold for Section 1069 affordable housing contributions with the aim of reducing costs for small house builders and increasing house building. This change in policy would restrict the use of section 106 planning obligation contributions where sites contain 10 units or less. Greenfield rural exception sites10 would be excluded however the consultation also proposed that buildings brought back into use should be exempt from section 106 requirements.
2.17 Exmoor National Park Authority welcomed the exemption of rural exception sites from the proposed 10 unit threshold for S106 affordable housing contributions. However, the Authority strongly objected to the application of the 10-unit threshold to smaller housing schemes. It raised concern that the threshold would be applied to existing buildings and other brownfield sites within the National Park, with the consequence that no affordable housing could be provided on this type of site. If the proposed threshold were brought into effect, it would undermine the policy approach set out in the Exmoor Local Plan and the Lynton & Lynmouth Neighbourhood Plan, and would delay progress of the emerging Local Plan by severely compromising the flexibility incorporated in the draft policies which aim to ensure that the housing needs of Exmoor’s communities are addressed.
2.18 The consultation closed on 4 May 2014. At the time of publishing this monitoring report (December 2014), the Government has announced that the proposal to exempt developments of 10 homes or less from section 106 affordable housing contributions will go ahead. However a lower threshold will apply in designated rural areas such as National Parks where authorities may choose to implement a threshold of five units or less, beneath which affordable housing tariff style contributions should not be sought. The detail of the changes is currently being analysed and the impact on housing policy in the National Park will be set out in the next (2014/15) monitoring report.
MAJOR ENERGY INFRASTRUCTURE PROPOSALS 2.19 COMMERCIAL WIND FARM PROPOSALS: In recent years the Authority has
received a number of consultations for commercial wind farms on land surrounding the National Park. The Authority was concerned with the impact, both individually and cumulatively, of proposed wind turbines on the setting of the National Park.
2.20 Batsworthy Cross: In 2011, the planning application for the wind farm proposal (9 turbines) at Batsworthy Cross was refused by North Devon Council. The applicant appealed against the decision and a public inquiry was held. In October 2012 the 18MW development was allowed on appeal, with the Inspector concluding that the
9 Section 106 contributions (or planning obligations) arise from agreements made between a local planning authority and a developer to address concerns about affordable housing levels or the costs of providing new infrastructure. 10 As a remote area with all settlements defined as rural, the use of the rural-exception sites approach for affordable housing to meet local needs is appropriate for Exmoor National Park. The exceptions approach does not define or allocate sites in a plan.

Annual Monitoring Report 2013/14
Support to the Community & Business 10
Batsworthy site was beyond the National Park setting, there would be only limited harm to Exmoor and the harm did not significantly outweigh the benefits from a reduction in carbon dioxide emissions. The decision was influenced by the National Planning Policy Framework (NPPF) which provides that where relevant policies (e.g. the adopted North Devon Local Plan) are out of date, permission is granted unless the adverse impacts of doing so would significantly and demonstrably outweigh the benefits when assessed against policies in the NPPF. A subsequent legal challenge in the High Court against the Inspector’s decision was dismissed in May 2013.
2.21 It is understood that work on the Batsworthy Cross Wind Farm is expected to start in spring 2015 and the construction on land near Knowstone next to the A361 North Devon Link Road will take around 18 months.
2.22 COMMUNITY WIND FARM PROPOSALS: During the monitoring year, a Community Wind Co-operative scheme for the erection of a single wind turbine up to 78 metres to tip height at land at Knightacott, near Bratton Fleming, Devon was refused by North Devon Council. Although outside the National Park boundary, the main issue was considered to be the effect of the wind turbine on the character and appearance of the landscape and the role of that landscape in protecting the moorland fringe as the setting for Exmoor National Park. An appeal against refusal to grant planning consent was made; however this was subsequently dismissed as the Inspector considered the harm to the character and appearance of the area and consequent damage to the setting of Exmoor National Park outweighed policy support for the provision of renewable energy.
2.23 HINKLEY POINT NUCLEAR REACTOR PROPOSALS: In 2011, NNB Generation Company Limited (EDF Energy subsidiary) submitted a Development Consent Order to the Planning Inspectorate (National Infrastructure Planning) to build and operate a nuclear power station at Hinkley on the West Somerset coast, north of Stogursey11 and construct associated developments in the surrounding area.
2.24 West Somerset, Sedgemoor and Somerset County Councils jointly submitted a Local Impact Report to the Planning Inspectorate to inform the examination process which provided analysis of the impacts on a wide range of topics including transport, the housing market (including within the National Park), employment, education, ecology, landscape, archaeology, flood risk, coastal change and community impact mitigation. The councils also raised concerns which they considered had not been fully addressed by the application.
2.25 The Secretary of State consented to grant planning permission for the Hinkley C reactor (3260MW output) and associated development on 19 March 201312 and EDF expected to make a final investment decision in relation to the construction of the nuclear plant by July 2014, after striking a subsidy deal with the UK government. However in March 2014, it was announced that due to an ongoing European Commission investigation into whether the subsidy would constitute illegal state aid, EDF was forced to delay its decision.
2.26 Further developments relating to the proposed nuclear plant fall outside the monitoring period 2013/14 and will be contained in the next monitoring report.
11 http://www.westsomersetonline.gov.uk/hinkleypoint 12 http://infrastructure.planningportal.gov.uk/wp-content/ipc/uploads/projects/EN010001/3.%20Post%20Decision%20Information/Decision/130319_EN010001_SoS%20HPC%20Decision%20Letter.pdf

Annual Monitoring Report 2013/14
Support to the Community & Business 11
3 INTRODUCTION
3.1 This is Exmoor National Park Authority’s tenth Annual Monitoring Report (AMR). The Report examines the implementation of the adopted Exmoor National Park Local Plan (including minerals and waste policies) for the period 1 April 2013 to 31 March 2014 and progress with the emerging Local Plan.
EXMOOR NATIONAL PARK LOCAL PLAN 2001-2011
3.2 The Local Plan was formally adopted in March 2005. Following the introduction of the Planning and Compulsory Purchase Act 2004, the Local Plan policies were saved for a 3 year period following adoption. The Authority applied to Government Office to save all policies until they were replaced by future development plan documents and Government Office confirmed that all of the Local Plan policies were saved in February 2008. The Local Plan forms the development plan for the National Park with which all proposals should accord unless material considerations indicate otherwise.
3.3 Since the publication of the NPPF on 27 March 2012, the primary focus has been the preparation of the emerging Local Plan. The NPPF confirms that great weight should be given to the conservation of the landscape and scenic beauty which have the highest status of protection including wildlife and cultural heritage in National Parks, with reference to the National Parks Vision and Circular13.
EXMOOR NATIONAL PARK AUTHORITY
3.4 Approximately two thirds of Exmoor National Park lies in Somerset within West Somerset District, and one third in Devon within North Devon District.
3.5 The statutory purposes of National Parks are set out under the National Parks and Access to the Countryside Act 1949, as amended by the Environment Act 1995:
to conserve and enhance the natural beauty, wildlife and cultural heritage (of the National Parks); and
to promote opportunities for the understanding and enjoyment of the special qualities (of the National Parks) by the public.
In pursuing National Park purposes, National Park Authorities have a duty to: seek to foster the economic and social well-being of local communities within the National Park and shall for that purpose co-operate with local authorities and public bodies whose functions include the promotion of economic or social development within the area of the National Park.
3.6 The National Park Authority has general power, therefore, to do anything which is calculated to facilitate, or is conducive to, the accomplishment of the National Park purposes.
3.7 The Authority is the sole planning authority for the area of the National Park, (including planning for minerals and waste) but does not have the range of responsibilities of District and County Councils, and is known as a ‘single purpose’ authority. The District and County Councils remain responsible for important functions within the National Park area including housing, traffic and transport, education, social services and economic development.
13 English National Parks and the Broads: UK Government Vision and Circular 2010

Annual Monitoring Report 2013/14
Support to the Community & Business 12
NATIONAL PARK PARTNERSHIP PLAN 2012-2017
3.8 The National Park Authority has a duty to prepare a National Park Management Plan (NPMP) under Section 66(1) of the Environment Act 1995, and to review the plan every five years. The new management plan was adopted by the Authority in April 2012 as the Exmoor National Park Partnership Plan 2012-17 requiring the involvement of partner organisations working together to achieve the priorities and actions supporting the overall vision and objectives. The vision and objectives prepared for the Partnership Plan will be shared with the emerging Local Plan.
3.9 The Partnership Plan is the main plan setting out an overarching vision for Exmoor, with objectives and targets for the whole National Park up to 2017 but also recognising longer term aims, and should be seen as a focused plan for the National Park which informs plans/programmes within the Authority and those of partner organisations.
3.10 National planning guidance recognises that National Park Management Plans underpin partnership working and the delivery of designation objectives. Whilst not part of the development plan, the management plans provide evidence and principles which can be taken into account in the Local Plan and any neighbourhood plans. They may also be material considerations in making decisions relating to individual planning applications14.
NATIONAL PARKS CIRCULAR 2010
3.11 The 2010 National Parks Circular15 sets out a joint 2030 vision for National Parks which will help guide long-term planning and decision-making. Consequently the National Park Circular is significant national guidance that will help to inform the content of the emerging Local Plan.
3.12 Progress to meet the vision in the short term has focused on the achievement of key outcomes over the next 5 years and are the Government’s priorities for National Parks:
A renewed focus on achieving the Park Purposes. Leading the way in adapting to and mitigating climate change. Secure a diverse and healthy natural environment, enhanced cultural heritage and
inspiring lifelong behaviour change towards sustainable living and enjoyment of the countryside.
To foster and maintain vibrant, healthy and productive living and working communities.
Working in partnership to maximise the benefits delivered.
14 http://planningguidance.planningportal.gov.uk/blog/guidance/natural-environment/landscape/ 15 English National Parks and the Broads – UK Government Vision and Circular 2010 http://archive.defra.gov.uk/rural/documents/national-parks/vision-circular2010.pdf

Annual Monitoring Report 2013/14
Support to the Community & Business 13
LOCAL ENTERPRISE PARTNERSHIPS
3.13 The Heart of the South West Local Enterprise Partnership (LEP) is an economic
alliance covering the areas of Devon, Somerset, Torbay and Plymouth. LEPs have been formed to help determine local economic priorities and to help deliver Government objectives for economic growth and job creation. They are also a means for local authorities to work with businesses in the private sector to achieve economic recovery.
3.14 The NPPF states that local planning authorities should work and consult with LEPs to develop strategic priorities to enable the delivery of sustainable development and a Strategic Economic Plan has been produced which recognises the value of National Parks. A full business plan has also been published which outlines the strategic vision and objectives for the LEP over the next five years. Dartmoor and Exmoor National Park Authorities are now working to prepare an economic prospectus to further demonstrate the growth opportunities that National Parks can provide to the Heart of the South West area, with the aim of ensuring potential projects are made known to the LEP and to attract relevant funding as and when opportunities arise.
4 LOCAL DEVELOPMENT SCHEME IMPLEMENTATION
LOCAL DEVELOPMENT SCHEME (LDS)
4.1 The LDS is a three year timetable setting out key milestones for local plans and other
local development documents. The previous LDS came into effect in April 2007 with an end date in March 2010: it is no longer valid and is currently under review. Key milestones for the Local Plan are available on the National Park website. The Localism Act contains a provision that removes the requirement to consult the Secretary of State; therefore the Authority is able to revise the LDS and ensure it is publicly available.
STATEMENT OF COMMUNITY INVOLVEMENT (SCI)
4.2 The SCI is a key document which sets out how the Authority will consult stakeholders and the local community on the preparation of local development documents and planning applications for Exmoor National Park. The SCI was found sound by an independent inspector and adopted on 1 August 2006.
4.3 Amendments to legislation mean that the SCI can be revised and adopted without the requirements of examination by an independent inspector as originally set out by the Planning and Compulsory Purchase Act 2004. It is intended that the SCI will be reviewed to reflect recent legislation requirements including emphasis on neighbourhood planning.
Annual Monitoring Report 2013/14
Support to the Community & Business 14
EMERGING LOCAL PLAN
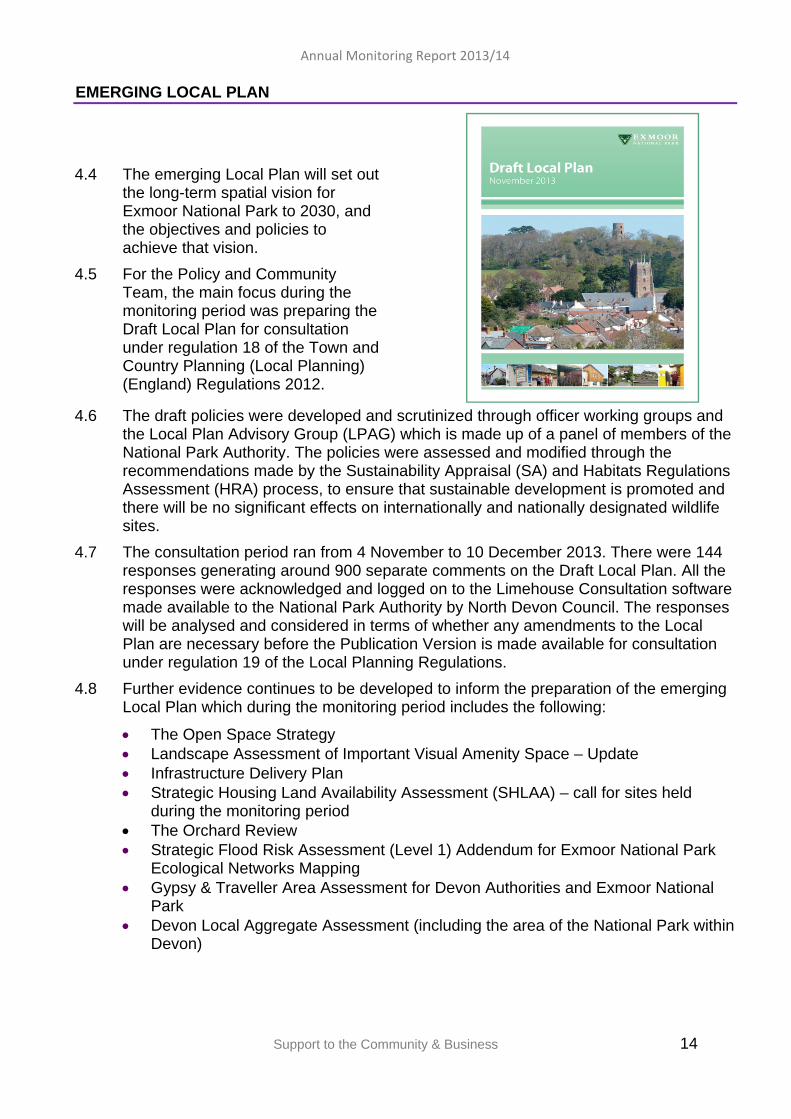
4.4 The emerging Local Plan will set out the long-term spatial vision for Exmoor National Park to 2030, and the objectives and policies to achieve that vision.
4.5 For the Policy and Community Team, the main focus during the monitoring period was preparing the Draft Local Plan for consultation under regulation 18 of the Town and Country Planning (Local Planning) (England) Regulations 2012.
4.6 The draft policies were developed and scrutinized through officer working groups and the Local Plan Advisory Group (LPAG) which is made up of a panel of members of the National Park Authority. The policies were assessed and modified through the recommendations made by the Sustainability Appraisal (SA) and Habitats Regulations Assessment (HRA) process, to ensure that sustainable development is promoted and there will be no significant effects on internationally and nationally designated wildlife sites.
4.7 The consultation period ran from 4 November to 10 December 2013. There were 144 responses generating around 900 separate comments on the Draft Local Plan. All the responses were acknowledged and logged on to the Limehouse Consultation software made available to the National Park Authority by North Devon Council. The responses will be analysed and considered in terms of whether any amendments to the Local Plan are necessary before the Publication Version is made available for consultation under regulation 19 of the Local Planning Regulations.
4.8 Further evidence continues to be developed to inform the preparation of the emerging Local Plan which during the monitoring period includes the following:
The Open Space Strategy Landscape Assessment of Important Visual Amenity Space – Update Infrastructure Delivery Plan Strategic Housing Land Availability Assessment (SHLAA) – call for sites held
during the monitoring period The Orchard Review Strategic Flood Risk Assessment (Level 1) Addendum for Exmoor National Park
Ecological Networks Mapping Gypsy & Traveller Area Assessment for Devon Authorities and Exmoor National
Park Devon Local Aggregate Assessment (including the area of the National Park within
Devon)

Annual Monitoring Report 2013/14
Support to the Community & Business 15
EVIDENCE COMPLETED:
Strategic Flood Risk Assessment (Level 1) – Joint Study with West Somerset Council (2009)
Employment Land Review (2009)
Quantitative Needs Assessment (Retail Report) – Joint Study with West Somerset Council (2011)
Strategic Housing Market Area Assessment (SHMA) – Joint Study with North Devon, Torridge, and West Somerset (2008)
Strategic Housing Market Assessment: North Devon and Torridge Update (2012)
Strategic Housing Market Assessment Update: Exmoor National Park in West Somerset (2014)
Landscape Sensitivity Study (2013)
Assessment of Housing and Affordable Housing Needs (including demographic projections) (2011)
Exmoor Viability Report (2011)
Residential Conversion Viability (2012)
Settlement Assessment Report (2012)
Analysis of Smaller Settlements (2013)
Somerset and Exmoor National Park Local Aggregate Assessment (2013)
4.9 There have been, and will continue to be, discussions regarding opportunities for joint-working and information sharing with both West Somerset and North Devon Councils to ensure that cross-boundary issues are acknowledged in forthcoming planning documents. The Localism Act 2011 (Section 110) introduces the ‘duty to cooperate’ in relation to planning of sustainable development. This includes engaging constructively with neighbouring authorities and other organisations in relation to strategic matters in the preparation of development plan documents. Further information relating to how this duty is being accomplished can be found in the Section 5.
4.10 The sharing of experiences and discussion of common issues in relation to planning policy with other National Park Authorities through the National Parks Policy Officer Group (NPPOG) also provides an important source of information and experience in relation to addressing changes in the planning system and the potential implications for protected landscapes.
LYNTON & LYNMOUTH NEIGHBOURHOOD PLAN
4.11 Lynton & Lynmouth Town Council, as the qualifying body responsible for the preparation of the Neighbourhood Plan, submitted ‘The Lyn Plan’ to the National Park Authority on 16 April 2013. The Authority subsequently arranged for the Neighbourood Plan consultation during May and June 2013. The Neighbourhood Plan together with supporting documents and responses to the consultation were then considered by an independent inspector who recommended that the Plan should proceed to a referendum in August 2013. Arrangements for the referendum were made with North Devon Council for Thursday 21 November 2013.

Annual Monitoring Report 2013/14
Support to the Community & Business 16
4.12 Following the successful outcome of the community referendum, this monitoring period saw the coming into force of the Lynton & Lynmouth Neighbourhood Plan – The Lyn Plan - on 3 December 2013. Lynton & Lynmouth Town Council and partners were one of the first 17 Front Runners to trial the Neighbourhood Plan process and prepare a Plan for their area which sets out development and planning policies in response to the particular issues that are important to their local community. The Neighbourhood Plan was the fourth in the country and the first in a Nationa Park.
4.13 The Neighbourhood Plan has to be in general conformity with the higher level plans including the Local Plan and should have regard to the National Planning Policy Framework. Therefore both the Exmoor National Park Local Plan and the Neighbourhood Plan will form the development plan for the local area, with all relevant policies taken into account and the decision made accordingly, unless other material planning considerations indicate otherwise.

Annual Monitoring Report 2013/14
Support to the Community & Business 17
5 DUTY TO COOPERATE
5.1 The Duty to Cooperate (DtC) was introduced by the Localism Act 2011. It places a legal duty on local planning authorities and public bodies to engage constructively on strategic cross boundary matters on an ongoing basis to maximise the effectiveness of Local Plan preparation. The Authority is required to report on progress with the DtC in the preparation of development plan documents (i.e. the Local Plan) that relate to strategic matters in its Annual Monitoring Report16. Section 11A of the 1949 National Parks and Access to the Countryside Act (as amended) also requires relevant authorities (including public bodies) in exercising or performing any of their functions to effect land within a National Park to have regard to the National Park Authority’s statutory purposes.
5.2 During the monitoring period officers have met with policy officers from North Devon Council, Torridge District Council and West Somerset Council to discuss progress of the emerging local plan progress, evidence base preparation and updates and shared strategic policy approaches, particularly in relation to the distribution of housing across the Housing Market Area. A further meeting was held with West Somerset Council officers to discuss the issues raised in relation to their consultation response to the Exmoor National Park Draft Local Plan. Meetings have also taken place at county level with officers attending the Devon Planning Officer Group and the Somerset Strategic Planning Conference Officers Group to discuss issues and concerns regarding planning and to provide a forum for joint working.
5.3 During the monitoring period the Authority responded to three development plan consultations from neighbouring planning authorities, in line with meeting the DtC: Somerset Draft Local Aggregate Assessment; Draft West Somerset Local Plan – revised preferred strategy; and Second Devon Draft Local Aggregate Assessment.
5.4 The Devon Duty to Cooperate Protocol and Somerset Duty to Cooperate Statement (Somerset Minerals Plan) were approved as being appropriate mechanisms for assisting the National Park Authority to fulfill its legal duty to cooperate with other planning authorities and relevant organisations.
5.5 Joint working with the adjoining minerals planning authorities, Devon County Council and Somerset County Council, related to the inclusion of the relevant area of the National Park within Local Aggregate Assessments (LAAs)17 for Devon and Somerset. Given the geographical location of the mineral planning authorities, and the limited scope for mineral working in Exmoor National Park, it was deemed appropriate by Exmoor National Park Authority and Devon and Somerset County Councils to produce a joint LAA for Exmoor National Park Authority and Somerset County Council, and a joint LAA for Devon which encompasses the mineral planning authorities of Exmoor National Park Authority, Devon County Council, Dartmoor National Park Authority, Plymouth City Council and Torbay Council. The Somerset LAA was finalised during the monitoring period.
5.6 Compliance with the DtC will progress as the Local Plan is prepared and neighbouring authorities will respond to consultation on the publication version of the Draft Local Plan in 2015 if there are cross boundary strategic issues of concern. The inspector when examining the Local Plan against the test of soundness will also need to be satisfied that the Authority has complied with the DtC and that the plan demonstrates effective joint working to meet strategic cross boundary priorities. The DtC is a legal test and should demonstrate effective cooperation.
16 Regulation 34 (6) of The Town and Country Planning (Local Planning) (England) Regulations 2012 17 An LAA is an annual assessment of the demand and supply of aggregates in a minerals planning authority’s area and should contain a forecast of demand for aggregates, an analysis of all aggregate supply options, and an assessment of the balance between demand and supply. The NPPF states that mineral planning authorities should produce an LAA either individually or jointly by agreement with other mineral planning authorities

Annual Monitoring Report 2013/14
Support to the Community & Business 18
6 EXMOOR NATIONAL PARK PROFILE
6.1 The Annual Monitoring Report has previously presented a spatial portrait of the National Park area defined by the key spatial contexts presented in the Park Profile below. It is considered that the update of the State of the Park Report will provide the most comprehensive overview for Exmoor and will help to inform the spatial portrait for the Local Plan meaning it is unnecessary to repeat this information within this report.
6.2 The Park Profile set out in table 6.1 below provides a simple overview and context of the National Park and contains some of the most recent 2011 census data for the National Park released by the Office of National Statistics (ONS) during 2013/14.
TABLE 6.1 EXMOOR NATIONAL PARK PROFILE INDICATOR RESULT SOURCE
AR
EA
Total Park area 692.8 sq km
OS\Designation maps Somerset 491.9 sq km
Devon 200.9 sq km
Parishes totally / partly in the National Park
43
PO
PU
LA
TIO
N
Population 10,273 (10,266)
ONS - derived from 2011 Census (2012 mid-term estimates)
Age 0-14 1,176 (1,143)
Age 15-74 7,721 (7,640)
Age 75+ 1,376 (1,443)
Population Density 0.1 per hectare
HO
US
ING
Dwelling Type:
ONS – derived from 2011 Census (2001 Census)
Detached 47.2% (49.1%)
Semi-detached 25.6% (25.9%)
Terraced 16.4% (16.3%)
Flat/Maisonette 10.3% (8.4%)
Mobile home/caravan 0.4% (0.4%) Households with at least one usual resident
80.8% - 4678(86.3% - 4896)
Household spaces 5789 (5675)18
Household spaces not used as main residence
19.2% (13.7%)
Household Tenure Owner occupied (including shared ownership)
66.4% (68.3%)
Private rented (private landlord or letting agency)
13.6% (11.7%)
Social Rented (other and local authority)
14% (12.8%)
Other private rented/ Living rent free
6% (7.5%)
Average household size 2.1 (2.2) residents per occupied household Quality of housing stock Unknown – data held by districts
Total no. of dwellings 5787
18 A household space is the space taken by one household, including that of just one person. Shared dwellings may accommodate a number of households. A dwelling is a self contained unit of accommodation which may include one or more household spaces.

Annual Monitoring Report 2013/14
Support to the Community & Business 19
H
OU
SIN
G
Household Composition
ONS - derived from 2011 Census (2001 Census)
Single person households Aged over 65: 17.7% (19.2%) Other: 13.7% (12.38%)
Households without the sole use of one family (student hostels, residential homes etc)
With dependent children: (1.61%)
All students: (0%)
All over 65: (0.86%)
Other: (3.41%)
Family households All over 65: 15.1% (14.77%)
Married couple households
No children: 18.7% (17.26%)
With dependent children: 10.0% (12.77%)
All children not dependent: 5.5% (4.66%)
Cohabiting couple households
No children: 4.6% (4.41%)
With dependent children: 2.9% (2.96%)
All children not dependent: 0.4% (0.22%)
Lone parent households With dependent children: 3.5% (3.29%)
All children not dependent: 2.4% 2.21%)
Other household types 5.3%
HE
AL
TH
& W
EL
L-B
EIN
G
Deprivation: Lowest IMD rank
West Somerset 005b (Dulverton & Brushford) 11093
Index of Multiple Deprivation (2010) IMD Ranking19
Highest IMD rank North Devon 002d (Lynton & Lynmouth Area) 17506
Life Expectancy at birth
North Devon: Male 79.7 years Female 83.4 years
Source: National Statistics Primary Care Organisations, England, 2008-10. On 30 April 2013, the Office for National Statistics (ONS) published mid-2002 to mid-2010 subnational population estimates, revised following the 2011 Census. Therefore, previously published life expectancy figures for England and Wales, England, Wales, English regions, counties in England, and unitary and local authorities in England and Wales have been revised and are presented in this release.
Somerset: Male 79.4 years Female 83.8 years
Households with at least one person with a long-term health problem or disability
28.2% (35.4%) ONS - derived from 2011 Census(2001 Census)
EC
ON
OM
Y Total unemployment - % of
population aged 16 – 64 claiming Job Seekers Allowance (May 2014)
1.1% - West Somerset 1.2% - North Devon Percentages for both districts are lower than the South West (1.7%).
Source: 2013 NOMIS earnings by residence - no separate data available for the National Park. Average earnings: North Devon £412 average full time gross weekly pay
Average earnings: W. Somerset £437 average full time gross weekly pay
19 IMD Ranking: 1 = most deprived area, 32482 = least deprived area, 16241 = mid-point
Annual Monitoring Report 2013/14
Support to the Community & Business 20
T
RA
NS
PO
RT
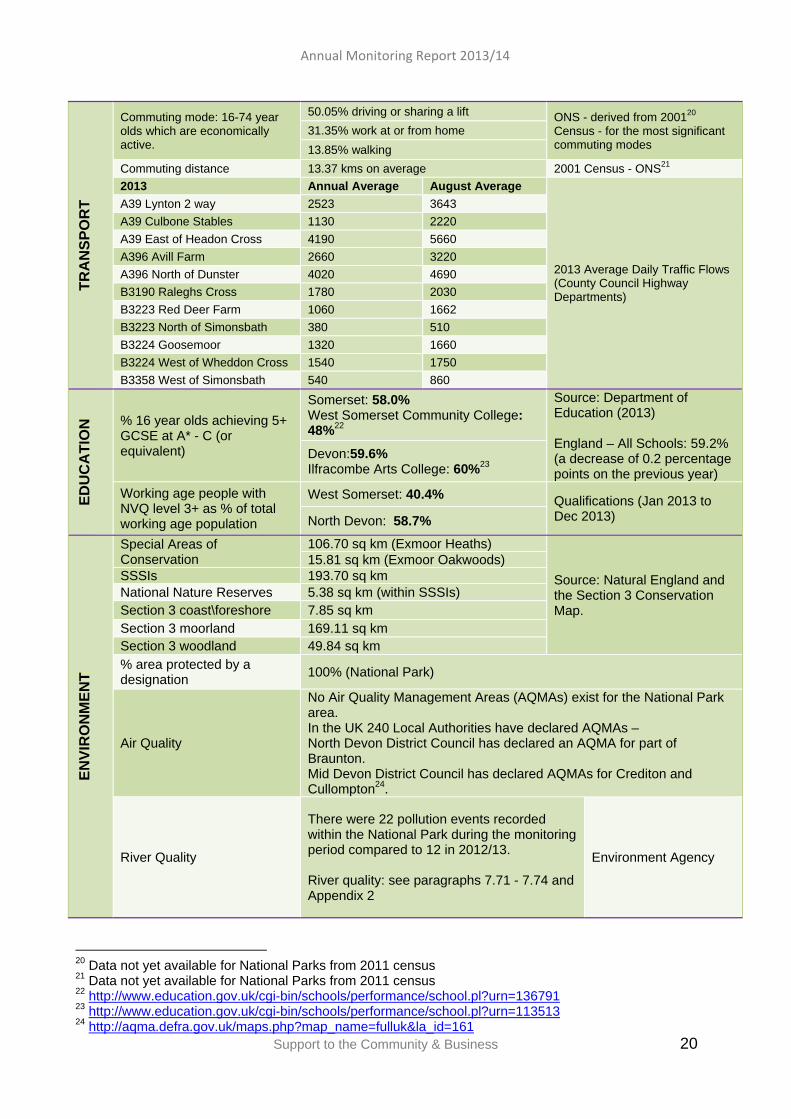
Commuting mode: 16-74 year olds which are economically active.
50.05% driving or sharing a lift ONS - derived from 200120 Census - for the most significant commuting modes
31.35% work at or from home
13.85% walking
Commuting distance 13.37 kms on average 2001 Census - ONS21
2013 Annual Average August Average
2013 Average Daily Traffic Flows (County Council Highway Departments)
A39 Lynton 2 way 2523 3643
A39 Culbone Stables 1130 2220
A39 East of Headon Cross 4190 5660
A396 Avill Farm 2660 3220
A396 North of Dunster 4020 4690
B3190 Raleghs Cross 1780 2030
B3223 Red Deer Farm 1060 1662
B3223 North of Simonsbath 380 510
B3224 Goosemoor 1320 1660
B3224 West of Wheddon Cross 1540 1750
B3358 West of Simonsbath 540 860
ED
UC
AT
ION
% 16 year olds achieving 5+ GCSE at A* - C (or equivalent)
Somerset: 58.0% West Somerset Community College: 48%22
Source: Department of Education (2013) England – All Schools: 59.2% (a decrease of 0.2 percentage points on the previous year)
Devon:59.6% Ilfracombe Arts College: 60%23
Working age people with NVQ level 3+ as % of total working age population
West Somerset: 40.4% Qualifications (Jan 2013 to Dec 2013) North Devon: 58.7%
EN
VIR
ON
ME
NT
Special Areas of Conservation
106.70 sq km (Exmoor Heaths)
Source: Natural England and the Section 3 Conservation Map.
15.81 sq km (Exmoor Oakwoods) SSSIs 193.70 sq km National Nature Reserves 5.38 sq km (within SSSIs) Section 3 coast\foreshore 7.85 sq km Section 3 moorland 169.11 sq km Section 3 woodland 49.84 sq km % area protected by a designation
100% (National Park)
Air Quality
No Air Quality Management Areas (AQMAs) exist for the National Park area. In the UK 240 Local Authorities have declared AQMAs – North Devon District Council has declared an AQMA for part of Braunton. Mid Devon District Council has declared AQMAs for Crediton and Cullompton24.
River Quality
There were 22 pollution events recorded within the National Park during the monitoring period compared to 12 in 2012/13. River quality: see paragraphs 7.71 - 7.74 and Appendix 2
Environment Agency
20 Data not yet available for National Parks from 2011 census 21 Data not yet available for National Parks from 2011 census 22 http://www.education.gov.uk/cgi-bin/schools/performance/school.pl?urn=136791 23 http://www.education.gov.uk/cgi-bin/schools/performance/school.pl?urn=113513 24 http://aqma.defra.gov.uk/maps.php?map_name=fulluk&la_id=161

Annual Monitoring Report 2013/14
Support to the Community & Business 21
HE
RIT
AG
E Scheduled Monuments 201
English Heritage and Historic Environment Record
Conservation Areas 16 Grade 1 Listed Buildings 20 Grade II* Listed Buildings 53
Grade II Listed Buildings 668
Historic Parks & Gardens 2
LE
ISU
RE
Public Footpaths 443.0 km
Definitive Map / GIS Public Bridleways 482.3 km Restricted Byway 59 km Byway Open to All Traffic 1.5 km Access Land 17914 ha
Visitor days\year
1.99 million (2008 STEAM data) 2.02 million (2009 STEAM data) 2.03 million (2010 STEAM data) 2.02 million (2011 STEAM data) 1.96 million (2012 STEAM data) 1.96 million (2013 STEAM data)
STEAM Report 2013
© ENPA – Dunster High Street

Annual Monitoring Report 2013/14
Support to the Community & Business 22
7 POLICY PERFORMANCE
7.1 The policies in the Exmoor National Park Local Plan 2001-2011 are saved until they are replaced by the emerging Local Plan when it is adopted.
7.2 This section of the AMR monitors the policies, of the adopted Local Plan through a range of selected indicators – set out in Chapter 1425 of the Local Plan. The Local Plan indicators aim to inform the effectiveness of the policies within each section of the Local Plan.
LANDSCAPE & NATURE CONSERVATION
7.3 This section contains policies that support the first statutory purpose of the National Park Authority, to conserve and enhance the natural beauty, wildlife and cultural heritage of the National Park. The indicators are set out in Table 7.1 below.
7.4 The indicators reveal that the LNC policies have been effective in protecting the natural beauty, wildlife and cultural heritage of the National Park. Planning decisions have been robust in ensuring that new development conserves and enhances the National Park; to a certain extent this can be achieved by attaching conditions to planning permissions in relation to:
manage external lighting in new developments
ensure archaeological heritage assets are conserved
ensure wildlife is protected.
7.5 The indicators within Table 7.1 do not reflect the cumulative impact of changes in the way the land is managed and maintained; in the majority of cases these changes are not subject to planning control. Objectives and targets set out in the Partnership Plan aim to address landscape management issues which cannot be controlled by planning policy alone. Lighting conditions to control the impact of light pollution have been attached to a number of development proposals permitted during the monitoring period. The National Park was officially designated a Dark Sky Reserve in 2011 with the policy on lighting (LNC2) helping to sustain this special quality – the policy approach in the emerging Local Plan will reinforce the Dark Sky Reserve status of the National Park.
7.6 A greater proportion of ecological surveys are now submitted with planning applications to help ensure that protected species and habitats are not harmed as a consequence of any development proposed. These surveys are particularly relevant for proposals which involve works to existing buildings where species such as bats or nesting birds may be present. Conditions are applied in such circumstances to ensure that any programme of works complies with recommendations set out in the ecological survey, require a survey to be undertaken prior to any works commencing, or to state the timing of construction.
7.7 Those indicators relating to the condition of internationally, nationally and locally designated areas for wildlife (such as Special Areas of Conservation (SACs), Special Sites of Scientific Importance (SSSIs) and Local Wildlife Sites (formerly County Wildlife Sites)) or to the management of Biodiversity Action Plan habitats as a result of development are significantly difficult to measure (see table 7.1a). The table therefore provides the area of BAP habitats or designated wildlife areas that are included within the area of the proposed development and list the type of development that has taken
25 Chapter 14 Monitoring and Review

Annual Monitoring Report 2013/14
Support to the Community & Business 23
place. However due to land management strategies, the condition of SSSIs overall has improved, with 97.2% in favourable or recovering condition – this exceeds the 2010 target of 95%. For the areas designated as SSSIs owned by the National Park Authority, all the land is within the favourable/recovering categories.
7.8 In terms of major development proposals, two applications were approved during the monitoring period (extension to the existing business premises at Shearwell Data and a new visitor hub building and recreational facilities at Dunster Forest Park at Nutcombe Bottom, Carhampton (Crown Estate)).
TABLE 7.1: LANDSCAPE AND NATURE CONSERVATION
Indicator Policy Result Comments
Area of greenfield land LNC1 LNC3 LNC6
673sqkm 97.74% of the National
Park area
Excluding buildings and their curtilage, roads, structures, water bodies etc.
Number of lighting conditions attached to permissions within the National Park
LNC2 54
Applications with lighting conditions which either do not permit external illumination without prior approval of the Authority or to effectively manage lighting to reduce light pollution impacts.
Change in area of moor and heath as a result of development
LNC3 See table 7.1a
Area of orchard created or lost as a result of development
LNC4 LNC5 See table 7.1a
Extent of marshy grassland LNC7 - Cannot be measured at present
Change in area of designated habitats as a result of development.(SACs, SSSIs, CWS)
LNC9 LNC10 LNC11 LNC13
See table 7.1a
Percentage of SACs, SSSIs in favourable condition and County Wildlife Sites in favourable management as a result of development.
LNC9 LNC10 LNC11 LNC13
97.2% of SSSIs on Exmoor For land owned by the Authority almost 100% of SSSIs
Source: Natural England SSSIs in 'favourable' or 'unfavourable recovering condition'. (Target 95% by 2010)
Change in area of BAP habitats as a result of development.
LNC12 See table 7.1a
Area of BAP habitats managed in accordance with NPA conservation objectives as a result of development.
LNC12 0
No. of developments with provision for protected /important species, and as a proportion of developments affecting protected /important species
LNC14
20 applications where conditions were imposed which either require applicants to undertake an ecological survey prior to any development; or where an ecological survey has been undertaken and a condition applied in relation to its findings.
No. and proportion of applications refused for reasons of harm to protected/important species.
LNC14 0
No. of applications for DEFRA licences.
LNC14 0

Annual Monitoring Report 2013/14
Support to the Community & Business 24
Indicator Policy Result Comments
No. of Scheduled Ancient Monuments affected by development.
LNC15 LNC16
4 applications where the permission was conditioned regarding an 'archaeological watching brief' or required a programme of archaeological work.
No. of sites on the Sites and Monuments Record affected by development. No. of the above applications refused.
LNC15 LNC16 0
No. of cases of damage to archaeological sites.
LNC15 LNC16 0 No cases of damage through development.
No. of renewable energy/energy conservation projects.
LNC17 LNC18 LNC19
17
See table no. 7.1b
No. and area of major developments approved within the National Park
LNC20 2
At Shearwell Data Ltd, Cutcombe – extension to existing business premises (8.32408 ha) At Dunster Forest Park, Nutcombe Bottom, Carhampton - Visitor hub building and recreational facilities including alterations to access ( 2.14331 ha)
7.9 During 2013/14 relatively few approved planning applications were within/partly within
the designated areas listed in table 7.1a (below). There are some limitations to the effectiveness of this monitoring, as the area of the development as specified by the planning application and measured by the Geographical Information System (GIS) is not always the exact area where development takes place. This area is sometimes smaller than the delineated area, and therefore the impact on a designated area is considered to be negligible or results in no direct impact, e.g. the proposed retention of a metal sculpture in the garden of a property in Martinhoe within the Devon County Wildlife site.
7.10 Another key consideration is that an individual application may affect several designations within one small area, where local, national and international designations may overlap to varying degrees. For example proposed deer fencing at Dunster deer park is development within an area designated as part of the Somerset County Wildlife Site, a Site of Special Scientific Interest and Section 3 Wood (Biodiversity Action Plan Habitat).
TABLE 7.1a
Designated areas Area
affected (ha)
Most relevant development
Special Area of Conservation (SAC) Exmoor Heaths
0.01ha
6/25/14/101 - variation of condition to regularise the following changes: window omitted on North elevation, porch omitted and door replaced with window on south elevation, reduced width patio doors on east elevation, additional door alongside window on west elevation, outbuildings in different location and a replacement sewage treatment plant.

Annual Monitoring Report 2013/14
Support to the Community & Business 25
Designated areas Area
affected (ha)
Most relevant development
Special Area of Conservation (SAC) Exmoor Oakwoods
3.7ha 62/43/13/006 - CLEUD for use of lodge as lodging facility
Section 3 Moor & Heath 0.34ha 62/41/13/013 and 62/41/13/044 - erection of a forestry store and maintenance of existing footpaths
Section 3 Woodland 11.26ha
62/43/13/006 - CLEUD for use of lodge as lodging facility 62/41/13/036 - replacement single storey extension 62/41/13/013 and 62/41/13/044 - erection of a forestry store and maintenance of existing footpaths (significant area) 62/41/13//043 - maintenance and reinstatement of existing footpaths (significant area) 6/5/12/101 - proposed deer fencing 6/15/14/101 - proposed manege 6/26/13/103 - replacement dwelling Listed Building consents, one subdivision of dwelling, householder apps
Section 3 Cliff & Foreshore 0.01ha 62/43/13/006 - CLEUD for use of lodge as lodging facility
Orchards 0.69ha 6/29/13/108 – erection of equipment store and retention of ground mounted solar PV panels
Blanket Bog – Biodiversity Action Plan Habitat
0
Upland Heath – Biodiversity Action Plan Habitat
0
Lowland Heath – Biodiversity Action Plan Habitat
0
Upland Oak Woods – Biodiversity Action Plan Habitat
3.33ha
62/43/13/006 - CLEUD for use of lodge as lodging facility LB consents to Lee Abbey Subdivision of dwelling 6/27/13/109 and 110 - replacement extension, garage and external works
Sites of Special Scientific Interest (SSSI)
6/5/12/101 - proposed deer fencing 6/27/12/127 Proposed creation of access tracks (retrospective) 6/42/13/101 - conversion of redundant stables into office/ workshop 6/25/12/117 - proposed outside lighting 62/43/13/006 - CLEUD for use of lodge as lodging facility 62/41/13/013 and 62/41/13/044 - erection of a forestry store and maintenance of existing footpaths Listed Building consents
Somerset County Wildlife Sites (CWS)
1.00ha
6/14/13/107 - proposed demolition and reconstruction of store building 6/14/13/105 - fire refuge ancillary to main hostel 6/42/13/101 - conversion of redundant stables into office/ workshop 6/40/13/106 - modify planning obligation 6/26/13/103 - replacement dwelling 6/41/13/102 - installation of ground mounted solar array - undergrounding of cabling 6/41/13/104 - reconstruction of cottage and provision for parking 6/5/12/101 - proposed deer fencing 6/29/13/103 - proposed improvements to access to include parking and turning circles for 2 cars 6/27/13/109 and 110 - replacement extension, garage and external works
Devon County Wildlife Sites (CWS) 62/43/13/004 retention of metal sculpture (impact negligible)

Annual Monitoring Report 2013/14
Support to the Community & Business 26
7.11 From April 2010, communities and householders have been able to benefit from the renewable energy Feed In Tariff where owners are paid for electricity produced by low-carbon and renewable electricity technology. This incentive resulted in an increased number of proposals for small-scale renewable energy systems – particularly for solar photovoltaic panels, wind turbines and some hydro-electric schemes.
7.12 Renewable Heat Incentives have also been introduced for both the commercial and domestic sectors and planning proposals for biomass/wood boilers have therefore come forward.
Table 7.1b
Application Parish Renewable Energy Type
Comments
6/12/13/101 Elworthy Solar Photo Voltaic Panels
6/13/13/104 Exford Wood chip boiler Lean-to shed to house boiler and hopper
6/13/13/105 Exford Biomass boiler Building to house boiler, woodchip store and water treatment plant
6/13/14/101 Exford Wind turbine Roof mounted – 1kw
6/29/13/108 Selworthy and Minehead Without
Ground mounted solar panels
Erection of equipment store
6/40/12/107 Winsford Solar Panels
6/41/13/102 Withycombe ground mounted photovoltaic array
8kw
6/43/14/102 Wootton Courtenay Solar Photo Voltaic Panels Roof mounted – 4kw 6/5/13/101 Carhampton Photo Voltaic Panels Roof mounted 6/8/12/105 Cutcombe Solar Panels Roof mounted – 40kw
62/11/13/005 Brendon & Countisbury Biomass boiler
Associated works including new flue and lean-to to accommodate 7 tonne pellet store
62/11/13/006 Brendon & Countisbury Biomass boiler Wood chip store
62/41/11/006 Lynton and Lynmouth Sustainability elements
Elements to ensure the building is constructed sustainably and uses renewable energy in its future operation
62/41/13/053 Lynton and Lynmouth Log boiler 60kw 62/41/13/055 Lynton and Lynmouth Biomass heating system Boiler house 62/43/13/005 Martinhoe Photovoltaic array
62/43/13/008 Martinhoe Biomass boiler 75kw – extension to car port to house wood pellet sack silo
7.13 The number of planning applications submitted and approved for renewable energy
development during this monitoring period (17 applications) has stabilised when compared with 15 applications and 1 General Development Order in 2012/13. This is a decrease from the higher levels of 2011/12 (42 approved applications) and 2010/11 (31 approved applications). Some small scale schemes serving individual houses benefit from permitted development rights – a class of development that is

Annual Monitoring Report 2013/14
Support to the Community & Business 27
automatically granted planning permission by the Government. Further advice can be found on the Authority’s website26.
7.14 The small-scale renewables technologies permitted during this monitoring period were predominantly for solar photovoltaic (PV) and biomass heating systems, and one application for a roof mounted wind turbine. Following significant uptake of solar PV, from 2012 the Feed in Tariff (FIT) for this particular technology was halved and the period the FIT is paid was also reduced from 25 to 20 years. Initially it was considered that this reduction in FIT may make the technology less attractive as the payback period was likely to increase and any profit would be reduced. However as the cost of Solar PV production has substantially reduced, PV remains an attractive option.
7.15 A Renewable Heat Incentive (RHI) has been made available for the non-domestic sector and through its 3-year Carbon Neutral Exmoor project, the Authority provided grants towards the installation of domestic wood-heat systems in areas within and adjoining Exmoor27.
7.16 During the monitoring year the Government launched the Domestic Renewable Heat Incentive (Domestic RHI) which is a financial incentive to promote the use of renewable heat as households switching to heating systems that use naturally replenished energy can help the UK reduce its carbon emissions. The eligible renewable heating system types for the Domestic RHI are:
• biomass only boilers and biomass pellet stoves • air source heat pumps • ground source heat pumps • solar thermal panels - flat plate or evacuated tube only
The heating system must have been first commissioned on or after 15 July 2009.
7.17 People who join the scheme receive quarterly payments for seven years for the amount of clean, green renewable heat their system produces. The scheme is open to anyone who can meet the joining requirements and is for households both off and on the gas grid. People off mains gas have the most potential to save on fuel bills and reduce carbon emissions.
7.18 During the previous 2012/13 monitoring period, four applications for works to enable the installation of biomass boilers, including buildings to house the boiler and/or the wood-fuel (log, chip or pellet) were approved and the number of applications for this type of development was expected to increase once the domestic RHI became available. During 2013/14, five applications for biomass boilers were approved and two applications were permitted for wood chip/log boilers. It is considered that biomass boilers may be particularly attractive as Exmoor is off-grid in terms of gas supply and some residents (particularly landowners) are able to directly access a readily available fuel supply (e.g. logs) by actively managing hedgerows and woodland.
26 http://www.exmoor-nationalpark.gov.uk/planning 27 http://www.exmoor-nationalpark.gov.uk/communities/sustainable-exmoor/carbon-neutral-programme/exmoor-woodheat

Annual Monitoring Report 2013/14
Support to the Community & Business 28
CONSERVATION OF BUILDINGS AND SETTLEMENTS
7.19 The indicators within this section monitor policies which aim to provide effective protection of the cultural landscape including farmsteads, settlements, buildings, and structures, as well as ensuring that new development is both well-designed and enhances the environment.
7.20 All of the indicators within this section, save one could be monitored. However as these quantitative indicators do not have targets or defined objectives it is difficult to measure whether the policies are having the intended effect. Developing indicators in the future for the Local Plan monitoring framework should address this issue.
7.21 The results show that there has been no change to significant cultural designations such as: conservation areas, listed buildings, historic parks and gardens, orchards and important open space (visual amenity). An ‘Orchard Review’ has been undertaken as part of the evidence base for the emerging Local Plan and updated records are shown on the Draft Local Plan Proposals Map (produced in conjunction with the emerging Local Plan).
7.22 In relation to the conversion of traditional buildings, during the monitoring period four applications were approved: the conversion of a listed barn to provide a unit of local need affordable housing accommodation; the conversion of traditional outbuildings to bunk house holiday accommodation; conversion of a barn to a self catering holiday unit; and the conversion of two redundant farm buildings to self catering holiday cottages.
7.23 A Building at Risk survey was commissioned in 2011 to establish the condition of all Listed Buildings within the National Park in a consistent and measurable way by rapid visual inspection. A contractor was engaged to produce a ‘Buildings at Risk’ report and the survey work was carried out in 2012 and in 2013. The report provides initial trend data by referencing the 2012/13 survey to that carried out in 2004/5. It includes a synthesis that considers trends and issues affecting the resource and, for those buildings deemed to be at risk, recommendations for their effective repair.
TABLE 7.2: CONSERVATION OF BUILDINGS & SETTLEMENTS Indicator Policy Result Comment
No. of traditional buildings converted to different use classes in LRC's, villages and in the Open Countryside
CBS1, CBS2, CBS3, CBS4
4
62/41/10/019 Proposed conversion of barn to 1 no. local needs affordable dwelling 62/63/13/001 Proposed conversion of outbuilding to bunk house holiday accommodation 62/41/13/026 Renewal of planning permission 62/41/10/016 (proposed conversion of barn to 1 no. holiday unit) 6/15/12/106 Proposed conversion of two redundant farm buildings into holiday cottages
No. of Conservation Areas CBS5 16
12 are substantial parts of settlements, whereas 4 are building groups such as farmsteads. Conservation Area Character Appraisals for the 12 settlements are also in the process of being reviewed.
No. of Conservation Area Enhancement Schemes undertaken
CBS5 0

Annual Monitoring Report 2013/14
Support to the Community & Business 29
Indicator Policy Result Comment
No. of Tree Preservation Orders made following Section 211 Notices within Conservation Areas
CBS6 0 TPOs served following planning applications.
No. of Listed Buildings CBS7-10 See Table 6.1
No. of Listed Buildings on "At Risk" register
CBS7-10 9
19th Century gravestone in St Thomas' Churchyard
St James' Church and Churchyard, Upton Farm
Old Frackford Bridge Manor Mills, Roadwater Chest tomb in St Martin's Churchyard,
Elworthy Milestone at West Wood Unidentified chest tomb, St Mary's
Churchyard, Luxborough Limekilns at Treborough quarry Early 19th Century milestone north of
Oaktrow Quarries Source: 2012/2013 Exmoor National Park Authority survey of Listed Buildings.
No. of Historic Parks and Gardens
CBS11 2 Dunster Castle and Nettlecombe Court
No. of renewable energy/energy conservation projects.
CBS12-15 17 See previous table 7.1 for Landscape and Nature Conservation policies.
No. of letters of complaint and support related to the character of new devt.
CBS12-15 - Cannot be monitored at present.
No. of design awards for new devt.
CBS12-15 0 Lynmouth Pavilion was nominated for the Michelmores/Western Morning News Heritage Project of the year.
Area of orchard created or lost as a result of devt.
CBS12-15 See Table 7.1a
No. of new buildings roofed in traditional materials.
CBS12-15 42 Includes all permissions where roofing materials are stated (including extensions, outbuildings, agricultural buildings etc).
Area of Important Open Space (Visual Amenity) within settlement.
CBS16 39.82ha Existing areas
7.24 Adopted Local Plan Policy CBS12 requires that all new development should reflect
and reinforce the use of traditional materials. All buildings permitted which require roofing materials, are monitored regarding traditional roofing materials – namely slate, thatch or clay tiles. During the monitoring period, there were 42 instances where planning conditions required that a new building be roofed in traditional materials. However, some outbuildings, stables or agricultural sheds are not always roofed in these materials and may use corrugated cement fibre sheets – the advised colour for these sheets is generally anthracite to minimise the visual impact of the roofing in the wider landscape. Other materials such as ‘green roofs’, lead, zinc or timber shingles may also be used in appropriate circumstances.

Annual Monitoring Report 2013/14
Support to the Community & Business 30
HOUSING
7.25 The indicators set out in Table 7.3 seek to measure the performance of housing policies within the Local Plan. These policies aim to ensure that new housing development within the National Park is compatible with the conservation and enhancement of the landscape, natural environment and built heritage of the National Park whilst providing for the housing needs of local communities and contributing to their sustainability. Adopted Local Plan policies principally aim to ensure that new housing in the National Park addresses an identified local community need for affordable housing. This approach is reinforced in the emerging Local Plan which focuses on addressing the needs of people who live and work in the National Park and ensuring that the housing stock as a whole meets the needs of all sections of the local community.
7.26 In 2012, the average house price for Exmoor was substantially higher than both regional (73.7% higher) and national averages (64.7% higher). This was based on a comparison with Land Registry contract price paid data for the regional and national averages, versus Exmoor House Price survey data based on advertised asking prices over the first two weeks in July 2012. Until this year, the advertised asking prices were the best available figures for the National Park area only.
7.27 The results from the 2013 House Price Survey demonstrate that during the monitoring period mean average house prices were 1.4% lower than in July 2011 and 2.2% higher than in 2012. The mean average 2013 house price (based on advertised prices) on Exmoor was £401,165, compared to £392,555 last year. The survey took place during the first two weeks of July 2013 using the websites of local estate agents and other property sales websites to assess the number and type of dwellings for sale within Exmoor National Park. The figures for the asking price were used to ascertain the mean and median average house price on Exmoor.
7.28 Contract price paid data is now available from the Land Registry and prices for the Exmoor National Park area were obtained for 2013, this shows that the mean average house price for Exmoor in 2013 remains substantially higher than both regional and national averages (25% higher than the average house price in the South West and 16% higher than the average house price in England & Wales)28.
7.29 The mean average house price based on the price paid for property sold in Exmoor National Park Authority in 2013 is £287,227 with a median average of £245,000. These figures are considerably lower than the calculated averages for the National Park based on ‘asking prices’ and reflects that many high value properties identified for sale may not have sold during the period July 2013 (when the survey of asking prices was conducted) to December 2013 (the Land Registry price paid data threshold). This particular trend can be identified by having both sets of data for 2013.
7.30 The National Parks economic comparison report by DEFRA Rural Statistics Unit (2010)29 demonstrated that Exmoor had the lowest mean average household income (£28,668) in comparison to other English National Parks. This is lower than the average income for Dartmoor National Park by over £4,000 and is 14.8% lower than the South West average. This is the largest difference of all the English National Parks in comparison to their region30. However, house prices in Exmoor were the third
28 Land Registry 2013 contract price data 29 The findings of this report were based on ‘Census Output area’ (COA) levels where figures for Exmoor National Park were considered to consists of all COAs within which more than 50% of the population live within the National Park boundary. 30 CACI Paycheck data, 2009-2010. National Parks: economic comparison – Defra Rural Statistics Unit (2010)

Annual Monitoring Report 2013/14
Support to the Community & Business 31
highest in comparison to other English National Parks. This figure, when compared to household income, demonstrated that Exmoor had the second highest house price relative to incomes for the English National Parks31. This highlights the significance of the issue of affordability of housing and the continuing importance of providing for houses that are affordable for those with a local connection to Exmoor National Park.
Chart 7.1 Average House Prices 1998–2013 based on advertised asking prices
7.31 Therefore the disparity between average annual household incomes and average house prices (based on asking prices) on Exmoor remains high at a ratio of 14:1, illustrating the difficulty that households with average incomes (or lower) face when purchasing suitable accommodation on the open market32. Even the ratio of the lowest average house prices33 to average household incomes remains at 6:1, illustrating that even properties at the lower end of the market are still beyond the reach of many households.
7.32 Mortgages are still difficult to obtain for those on average incomes looking to buy their first home without the backing of financial assistance from relatives – this means there is a demand for rented accommodation in many areas of the country including within the National Park34. The Government’s ‘Help to Buy’ scheme extended to the second hand market in 2014 and will cover buyers who have at least a 5% deposit and can cover the remainder with a mortgage. This scheme is not restricted to first time buyers and therefore although it may help some households in the National Park buy a home, it may not be those buying their first home.
31 Land Registry sales data (2009), CACI Paycheck data 2009- 2010. National Parks: economic comparison – Defra Rural Statistics Unit (2010) 32 Exmoor National Park House Price Survey 2013 and Land Registry prices paid data 2013 33 Based on the mean average of the lowest 25% of properties on the market 34 Housing Vision (2014) SHMA Update: Exmoor National Park in West Somerset (Published online at www.exmoor-nationalpark.gov.uk)
£
£50
£100
£150
£200
£250
£300
£350
£400
£450
1998
1999
2000
2001
2002
2003
2004
2005
2006
2007
2008
2009
2010
2011
2012
2013
Thou
sand
s
Exmoor National Park Average House Prices
Median Average Price
Mean Average Price
2 per. Mov. Avg. (Mean Average Price)

Annual Monitoring Report 2013/14
Support to the Community & Business 32
7.33 The Rural Housing Project35 has undertaken household surveys to provide evidence of housing need including for parishes wholly or partly within the National Park since the project began in 2002. The RHP works closely with the Authority, Registered Providers (housing associations), local communities, landowners and others to provide local needs affordable housing across the National Park and the rural areas of West Somerset and North Devon.
7.34 A ‘park-wide’ housing survey was undertaken across the National Park during the summer of 2008 – the analysis of the survey returns found 194 households in housing need, 130 of which would meet the local occupancy requirements of Local Plan policy H236. In reality, the level of local affordable housing need may be higher, as the Rural Housing Project has found that once a scheme for a parish has progressed to a point where a community perceives that it has a greater certainty of being delivered, more people in housing need tend to come forward.
7.35 During the monitoring year the Rural Housing Project completed parish surveys for the areas in the National Park of Dunster, Carhampton, Withycombe, Luxborough, Treborough and Old Cleeve.
7.36 The indicator referring to the number of households on the District Council’s housing register is now less meaningful for monitoring housing need, as the 2008 housing survey is a more accurate reflection of local housing need. Both North Devon and West Somerset district use a choice-based letting system to enable applicants to register a housing need and to express a preference for new or existing properties as they become available. Although these systems are not able to provide accurate levels of local affordable housing need within the National Park, it is important that people in housing need (whether for rented or shared-ownership opportunities) are registered so they have the opportunity of bidding for and being allocated housing when it becomes available.
7.37 Local affordable housing permitted since the adoption of the Local Plan must be occupied by those with a local connection. The legal Section106 agreement (the means by which occupancy is controlled) adds a further filter to the choice-based letting system outlined above and therefore potential occupants must also meet the criteria set out in policy H2 of the Local Plan. The key tests are that people are unable to afford housing on the open market (either to rent or buy), are in housing need and have a local connection.
7.38 During the monitoring year, the government consulted on proposals to restrict the use of Section 106 affordable housing contributions where sites contain 10 units or less (other than rural exception sites) and also proposed that buildings brought back into use should be excluded from section 106 requirements. Exmoor National Park Authority has objected to these proposals on the basis they would undermine the policies of the adopted Local Plan and the Lynton & Lynmouth Neighbourhood Plan and the policy approach of the emerging Local Plan to provide a framework to address the housing needs of the National Park’s local communities in a way compatible with the conservation and enhancement of Exmoor.
35 The Rural Housing Project provides independent advice on delivering affordable rural housing across the whole of North Devon and West Somerset, including Exmoor www.exmoor-nationalpark.gov.uk/rural_housing_project.htm 36 http://www.exmoor-nationalpark.gov.uk/planning/planning-policy/local-plan/local-plan-written-statement/local-plan-policies/local-plan-policy-content#H2

Annual Monitoring Report 2013/14
Support to the Community & Business 33
TABLE 7.3: HOUSING
Indicator Policy Result Comment
Proportion of new Housing Meeting Community's Need for Affordable Housing by location, devt type, and occupancy.
H1 - H15 20 local need affordable dwellings were completed during the monitoring period
15 at Villes Lane, Porlock 1 at Sparkhayes Campsite, Porlock 1 at Dulverton 1 at Winsford 1 at Withypool 1 at Brendon
Affordable Housing Provision by Type and Size of dwellings
H1 - H16
20 dwellings: 12 Affordable Rent 3 Intermediate Shared-Ownership 1 Intermediate Rent 4 Intermediate Self-build
11 two-bed properties 7 three-bed properties 2 four-bed properties
Ratio of House Prices and Rents to Household Income (CACI data) by Household Type
H1 - H17
Ratio of Average House Price to Average Household Income: 14:1 Ratio of Average Lower Quartile House Price to Average Lower Quartile Household Income: 11:1
2013 Annual House Price Survey data. Average Household Income figure is that for Exmoor National Park £28,668 (Exmoor National Park Profile – DEFRA Rural Statistics Unit 2010) Average House Price – based on asking price
Changes in House Prices Relative to national, regional and county averages
H1 - H18
In 2013 the mean average house price on Exmoor based on advertised prices was £401,165, an increase of 2.2% from 2012 (2013 Annual House Price Survey)
The mean average house price on Exmoor based on the Land Registry price paid for property sold in 2013 was £287,227. 2013 mean average house price South West: £229,129 2013 mean average house price England & Wales: £247,175
No. of second and holiday homes and empty homes at parish level
H1 - H19
Estimated number of long term empty properties: 70 Estimated number of Second/Holiday homes: 560
Information requested from the council tax records of District Councils. Parishes are either wholly within the National Park, or partly within the National Park (including the main settlement of that parish). The number is an estimate and may include properties outside the National Park.
No. of up to date parish housing need surveys.
H1 - H20
In the 2013-14 monitoring year parish surveys were completed for the areas within the National Park in Dunster, Carhampton, Withycombe, Luxborough, Treborough and Old Cleeve.
33 separate parish surveys completed for parishes wholly or partly within the National Park between 2002 and March 2013 (including some re-surveys).
A park-wide housing survey was undertaken during July/August 2008 to ascertain the level of local housing need across the whole National Park.
No. of parish surveys completed since the start of the Rural Housing Project in 2002/3. NB: RHP covers the rural areas of North Devon and West Somerset districts including Exmoor National Park.

Annual Monitoring Report 2013/14
Support to the Community & Business 34
Indicator Policy Result Comment
Nos of households on District Councils' Housing registers.
H1 - H21
Exmoor National Park Housing Survey 2008: 130 households identified as being in local affordable housing need.
October 2013: An assessment of outstanding need within the National Park was 90 households.
Percentage of Housing commitments located on Previously Developed Land (PDL)
H1 - H22 33%
Source: Housing Land Availability Monitoring: Percentage of dwellings completed on previously developed land.
7.39 The level of housing completions during 2013/14 on previously developed land
(PDL)/brownfield land has reduced from the previous monitoring year but remains significant, particularly bearing in mind the shortage of available sites recorded. Windfall sites37, such as redundant buildings are more typical examples of brownfield sites in the National Park, particularly within Lynton & Lynmouth which are more constrained in terms of the availability of greenfield sites within or adjacent to the settlements due to the topography and proximity of national and international wildlife designations.
7.40 Suitable brownfield land within a sparse rural area such as the National Park is a limited resource, therefore it is anticipated that the percentage of completions on brownfield land in the future could be lower although windfall sites are expected to continue to come forward based on previous trends.
7.41 During 2013/14 there were 26 net housing completions (30 gross) throughout the National Park (see Appendix 1 for further details and charts 7.2 and 7.3 below). This is an increase on 2012/13 and is consistent with the average of around 31 dwellings per year over the 9-year period from 2005. Of the housing completions in 2013, 20 were local needs affordable dwellings, including 15 affordable dwellings delivered by Hastoe Housing Association as part of a single scheme on land off Villes Lane in Porlock (land which had not previously been developed).
7.42 There were 9 local needs affordable homes under construction: a change of use of an existing garage in Dunster; two detached 3-bed dwellings as part of the redevelopment of the former livestock market site at Cutcombe; two 1-bed flats as part of the conversion of the former doctor’s surgery in Dulverton; and in Lynton and Lynmouth, two flats following the demolition of existing garage and erection of new building and two 2-bed flats as part of a conversion project.
7.43 The remaining 23 units under construction and 25 units which have not yet been started include 23 local needs affordable dwellings.
37 Windfall sites are previously developed sites which have unexpectedly become available for development – they can include sites resulting from the closure of a business, a residential conversion or the creation of a flat over a shop.

Annual Monitoring Report 2013/14
Support to the Community & Business 35
7.44 The Comprehensive Spending Review (October 2010) made significant changes to the level of future funding available for affordable housing, including a cut of over 50% in the social housing budget for the period 2011-15, and the way this funding is allocated. This has particularly impacted on small rural affordable housing schemes on exception sites – including those delivered in the National Park. The way the funding for affordable housing is allocated has also changed, with providers invited to submit proposals for the delivery of affordable housing to the Homes and Communities Agency (HCA) for the entire four-year period although it has been indicated that in year applications may again be accepted. Under the new programme, the only identified scheme in Exmoor National Park was Villes Lane, Porlock. Other HCA
0
10
20
30
40
50
60
70
05/06
06/07
07/08
08/09
09/10
10/11
11/12
12/13
13/14
Chart 7.2: Net Housing Completions 2005/6 - 2013/14
Completions Average
0
10
20
30
40
50
60
2005/6 2006/7* 2007/8 2008/9 2009/10 2010/11 2011/12 2012/13 2013/14
No.
of d
wel
lings
com
plet
ed
Chart 7.3: Net Housing Completions 2005/6 - 2013/14
Open Market
Affordable

Annual Monitoring Report 2013/14
Support to the Community & Business 36
funding opportunities include bringing empty properties back into use and community led projects such as community land trust schemes. The Localism Act has also introduced Community Right to Build to enable local communities to deliver small scale developments including affordable housing.
7.45 Changes by the Government to help finance new affordable homes include enabling RPs to charge ‘affordable rents’ up to 80% of market rates to generate higher incomes and greater borrowing capacity by RPs to offset cuts in national housing grants. The difference between ‘affordable rents’ and target/social rents will vary geographically across the country. Affordable rents will be applicable where grants from the HCA are used to fund affordable home provision. This variation in rents could be considerable on Exmoor, particularly for larger 3 and 4 bedroom homes, where market rents are high. Affordable rents have been applied to the new affordable housing at Chadwyck Close (Villes Lane Scheme) in Porlock. As market rents in the area are high, this has meant that the ‘affordable’ rents will be higher than in some areas of the National Park and West Somerset as a whole. This is turn has impacted on the letting process, with a number of potential applicants for the new housing discouraged because of the higher rents imposed, rather than previously when lower social rents (calculated using a Government formula) would have been applied.
7.46 In terms of delivering affordable housing on Exmoor, these changes will mean that future provision will be challenging. These issues will be considered in preparing the Local Plan.
© ENPA Affordable Housing at Villes Lane Porlock under construction 7.47 There is estimated to be around 70 vacant properties across the National Park and
560 second homes. However this is not the full picture as the figures produced by the 2011 census show that 1,111 (19.2%) dwellings in the National Park had no usual residents – this reflects a proportion of properties which are self-catering/holiday lets and registered as non-domestic premises that pay business rates rather than council tax.

Annual Monitoring Report 2013/14
Support to the Community & Business 37
EMPLOYMENT AND ECONOMIC DEVELOPMENT:
7.48 Policies within this section aim to maintain a thriving Exmoor economy; to help
underpin the conservation and enjoyment of the National Park.
7.49 The employment and economic development policies provide flexibility for small-scale business development, including new build, extensions and limited adaptations of the existing building stock, to meet the needs of businesses within the National Park. Home working is recognised as increasingly popular and viable as telecommunications technology improves. The policy allows for the use of residential property or ancillary buildings for home working.
7.50 The use classes monitored for the purposes of economic development include:
B1: offices, research and light industry B1a - offices B1b – research and development B1c – light industry
B2: general industry B8: use for storage or distribution C1: hotels or guesthouses
7.51 The indicators in Table 7.4 monitor employment development permitted within the
National Park for 2013/14. During this monitoring period there has been 33sqm of development permitted for B2 (general industry) and a total of 2,318sqm of development permitted for B1 uses (office, light industrial or research and development).
7.52 There was an overall loss of 11sqm of B2 general industrial employment land through the demolition of existing commercial units and redundant toilets to form 5 affordable dwelling units and 2 lock-up commercial units. At the time of the application the commercial units (to be demolished) were occupied by an estate agents and a veterinary practice.
7.53 Through change of use to an A1 use (retail), an area of 65sqm of B2 general industry use has been lost. Other non-B use class employment spaces such as shops, restaurants and community facilities (A and D use classes)38 are listed in Table 7.7 Community Services and Facilities.
7.54 For the purposes of monitoring and consistency, development proposals affecting hotels and guesthouses are referred to in the Recreation and Tourism section.
7.55 There has been one development of live/work or home working space with permission for the change of use of the former school in Withypool to a local needs affordable dwelling together with a light commercial kitchen and domestic store for use in connection with the dwelling.
38 Exmoor National Park Employment Land Review 2009 – Nathaniel Litchfield & Partners

Annual Monitoring Report 2013/14
Support to the Community & Business 38
TABLE 7.4: EMPLOYMENT & ECONOMIC DEVELOPMENT
Indicator
Policy
Result
Comment
Proportion of New Employment Premises by Location and Development Type
E1 - E2, E5
33sqm – B2 Light Industrial – Allerford
32sqm – B1 Light Industrial – Brompton Regis
2,153sqm – B1 Office Research and Development and Light Industry and 371sqm – B1 Light Industry – Wheddon Cross
132.99sqm – B1 Office – Dulverton
71.76sqm - Proposed demolition of existing commercial units, redundant public toilets and 1 no. one bedroom flat together with the erection of 2 no. lock up commercial units, 4 no. local affordable living accommodation units and associated parking – Lynton
Area of floorspace as Employment Use Created and Lost
E1 - E5 See figures below
No. and area of Employment Uses Re-using existing buildings
E1 - E2 5
Area of floorspace created and lost by B1, B2 and B8, C1* of Use Classes Order
E3 - E4
CREATED 33sqm – workshop/ store adjoining existing forge
32sqm – B1 textile designer’s studio and workplace
2,153sqm – B1 office and 371sqm – B1 light industrial
132.99sqm – B1 office space and archive space
LOST 11sqm – reduction in size of lock-up commercial units
65.3sqm from Use Class B2 general industry to Use Class A1 retail (art gallery)
No. and area of Live Work Units/ Home Working spaces permitted
E5
1 unit
Change of use of former school to 1 no. local needs affordable dwelling together with a light commercial kitchen and domestic store for use in connection with the dwelling - Withypool
*Creation and loss of C1 hotels/guest houses – see table 7.6 below

Annual Monitoring Report 2013/14
Support to the Community & Business 39
AGRICULTURE AND FORESTRY
7.56 The indicators within Table 7.4 monitor the types of agricultural and forestry development permitted and completed within the AMR period. The policies seek to support agricultural diversification measures and developments that are compatible with National Park objectives.
7.57 There were several applications approved during 2013/14 for the creation and improvement of forestry tracks to enable access for modern timber extraction machinery, with just over 6km of track creation and 5km of track improvement permitted. The length of such tracks fluctuates from year to year and this result is lower than the previous monitoring year (20km track created, 10km track improvements).
7.58 There were 33 planning applications permitting the development of agricultural buildings (including replacement buildings and extensions) and General Development Orders (GDOs) where prior approval was not required or prior approval was approved, during 2013/14. The buildings applied for and approved during this period ranged from a forestry store of 18sqm to a feed and machinery store of 540sqm. There were five applications approved for agricultural buildings that represented a partial or complete replacement of existing agricultural buildings and seven approved applications for the extension of existing agricultural buildings. The total floor space permitted was 8,368sqm – a slight increase on the average total floorspace permitted during previous monitoring years (8,291sqm). See chart 7.5 below for comparison with previous years.
7.59 Two planning applications for agricultural buildings were refused; one on the basis that the proposed size, nature, materials and appearance as isolated development would have an overall detrimental impact on the landscape; and the other as the proposal was considered to be undesirable sporadic development and as the functional need for the building had not been established.
7.60 Following the closure of the Environmental Sensitive Area agri-environment scheme and the classic Entry Level Stewardship, Uplands Entry Level Stewardship and, Organic Entry Level Stewardship schemes, environmental management funding has been limited to specific scheme conditions in the transition year of 2014. Latest Natural England figures indicate that of the 80 Environmentally Service Area schemes on Exmoor which have ended, 56 have now entered into either Higher Level Stewardship (14) or Entry Level Stewardship (42), with new schemes starting in this 1-year transition period.
7.61 From 2015, and implementation of the new Common Agricultural Policy reforms, new land environmental land management schemes (known as Countryside Stewardship) will become available and the new Basic Payment scheme will replace the current Single Payment Scheme. Advice on the agricultural subsidies and programmes available under the new CAP schemes is available from the Government website39.
39 https://www.gov.uk/government/collections/common-agricultural-policy-reform

Annual Monitoring Report 2013/14
Support to the Community & Business 40
TABLE 7.4: AGRICULTURE AND FORESTRY
5960 7570 7142 15336 6242 7497 83680
5
10
15
20
25
30
35
40
0
2000
4000
6000
8000
10000
12000
14000
16000
2007/08 2008/09 2009/10 2010/11 2011/12 2012/13 2013/14
No.
of f
arm
bui
ldin
gs
Squa
re M
etre
s
Chart 7.5 Agricultural Buildings
area sqm number of buildings
Indicator Policy Result Comment
No. and area of agricultural and forestry buildings
A1 33 agricultural buildings and extensions permitted Total area – 8368.21m2
Includes new and replacement agricultural buildings which were permitted during 2013/14 plus General Development Orders for prior notification or prior approval
Length of Agricultural and Forestry tracks permitted
A1
6.125km of new forestry/agricultural track approved 4.979km track repaired/upgraded
Permitted during 2013/14 plus General Development Orders for prior notification or prior approval
No. and proportion of applications for agricultural buildings refused
A2 2 Reasons for refusal: See para 7.59.
No. of farming businesses in agri-environment schemes
A3
Source: Natural England - including both ESA agreements and Environmental Stewardship (ES) schemes.
No. of farm diversification proposals and floor area requiring the conversion of modern farm buildings
A3 1
Formation of an equestrian exercise/training area together with conversion of part of an existing agricultural building to provide four stables and a tack room.
No and proportion of fish farm applications approved.
A4 0

Annual Monitoring Report 2013/14
Support to the Community & Business 41
RECREATION AND TOURISM:
7.62 The Recreation and Tourism policies of the Local Plan seek to ensure that tourist-
related development is consistent with National Park purposes and to facilitate extending the tourist season on Exmoor.
7.63 The indicators within Table 7.6 show the number of applications which relate to tourism development – specifically visitor accommodation. Self-catering accommodation continues to be a popular form of visitor accommodation particularly in relation to farm-diversification, with six self-catering units permitted during the monitoring period. Local Plan policy also provides for this form of accommodation to change occupancy to provide local need affordable housing. Under the emerging Exmoor National Park Local Plan where non-serviced holiday accommodation is no longer needed or viable, proposals to replace the holiday occupancy condition with an agreement limiting occupancy to meet local need for housing or housing for extended families will be considered.
7.64 Planning permission was also granted for the conversion of outbuildings to bunk house holiday accommodation.
7.65 In terms of planning applications permitted for serviced accommodation:
Alterations to outbuilding together with internal and external alterations to public house including full redecoration (overall reduction in number of bedrooms from 10 to 6).
Refurbishment of groom’s accommodation and change of use of hotel storage loft both to form hotel accommodation, together with change of use of stables and associated space to form swimming pool and gym.
7.66 One application for change of use from restaurant/guest house to private principal residence was permitted. The Exmoor National Park Local Plan 2001-2011 allows the loss of serviced accommodation where it can be shown that an employment use cannot be continued or made viable in the longer term however it requires that properties which meet this criterion to be converted to local needs affordable dwellings. However the emerging draft Exmoor National Park Local Plan intends to have a more flexible approach by providing for the change of use of serviced accommodation to a principal residence (i.e. a form of market housing controlled by a mechanism which ensures it can be lived in by anyone but only as their principal residence). This applies in circumstances where the use was formally a single residential dwelling on 1 July 1948 or built subsequently as a single residential dwelling; there has been no excessive alteration or extension; and the existing use does not provide additional community service or function.
7.67 Development permitted in relation to camping and caravanning was again limited with one application for change of use of land from agricultural to a campsite for six tents with ancillary parking being permitted, and one application permitted for the construction of five new all weather pitches and minor adjustments to eleven existing pitches at a Caravan Club site.
7.68 Occupancy evidence from 2009 indicates a slightly higher take-up in self-catering (non-serviced) accommodation, with an average occupancy rate of 53% - an increase from 47% in 2008, whereas the occupancy rate for serviced accommodation remained the same (34%). However, it should be noted that these occupancy rates were based on a relatively small sample size of accommodation providers within the National Park. The 2013 STEAM data for the National Park shows that the tourist numbers generated

Annual Monitoring Report 2013/14
Support to the Community & Business 42
by serviced accommodation were 0.2% lower than 2012 and 1.6% higher for non-serviced accommodation (all forms of self-catering including camping, caravanning and hostels). These figures represent a continuing downward trend for visitors to serviced accommodation and upward trend for self-catering accommodation.
7.69 Serviced accommodation provided 34.5% (2,584) of all bed spaces in 2013 which is consistent with 2012 (2,580), with the total number of serviced accommodation providers remaining stable. The total number of non-serviced bed spaces increased slightly from 4,861 (2012) to 4,912 (2013). The total number of non-serviced accommodation providers increased by 14, from 251 to 265 and continues the upward trend identified in the previous monitoring year.
7.70 A total of 467 accommodation establishments (both serviced and non-serviced) provided a maximum of 7,496 bed spaces for use by visitors during 2013. The largest number of bed spaces was provided by touring caravans/camping establishments (2,754 bed spaces).
7.71 The number of people staying with friends and relatives decreased by 0.2% during 2013.
7.72 There was one application approved for the change of use of barn and the formation of a commercial horse-riding establishment during this monitoring period. There were also a small number of equestrian developments permitted for domestic use including a replacement stable block, an exercise manège, an extension to a manège and exercise facilities (gallops).
7.73 In terms of recreation, development permitted included for a visitor hub building and recreational facilities at Dunster Forest Park (Crown Estate) and to permit retention on site of the miniature railway and covered rolling stock storage shed at Woody Bay Station until 1 June 2023.
7.74 During the monitoring year the new National Park Centre at the Lynmouth Pavilion was opened, rebuilding a former derelict building at a key location on the seafront in Lynmouth. Part of the annual Exmoor Tourism Partnership Conference 2013 was held at the Pavilion and was attended by 70 Exmoor businesses.
© ENPA – Lynmouth Pavilion (National Park Centre)

Annual Monitoring Report 2013/14
Support to the Community & Business 43
TABLE 7.6: RECREATION & TOURISM
Indicator Policy Result Comment
No. and proportion of applications for tourism related devt refused
RT1 - RT2
0
No. and floor area of serviced accommodation created
RT3 1 change of use
Refurbishment and enlargement of groom’s accommodation forming hotel accommodation, change of use of hotel storage loft forming hotel accommodation.
No. and floor area of serviced accommodation lost
RT3 1 Change of use of guest house to private residence
No. and floor area of self catering accommodation created
RT3
6 self catering holiday units permitted 1 conversion to bunk house accommodation
No. and floor area of self catering accommodation lost
RT3 0
Occupancy rates of self catering accommodation and serviced accommodation.
RT3
No. of visitor days (2013): 1.96 million (2012): 1.96 million Occupancy Rates (2009): Serviced:34% Non-serviced: 53%
STEAM Reports for 2013, 2012 (Global Tourism Solutions Ltd)
No. of camping barns within the National Park
RT3 Operational: 3
2 registered with the Youth Hostel Association, 1 registered with the Independent Hostels Group
No. of small backpackers and tented campsites
RT5, RT7
1 Change of use of land from agricultural to a campsite for six tents and ancillary parking.
No. and proportion of applications for conversion of static caravan sites to chalet devts / certificated caravan sites refused
RT6, RT8
0
No and area of devts for shooting purposes.
RT9 0
No. of commercial equestrian devts
RT10 - RT11
1 Change of use of barn and formation of horse riding establishment
No. and proportion of applications for golf courses refused
RT12 0
No and area of sports areas/facilities
RT13 - RT14
40.38ha – This is the Area of Important Open Space (Recreation) defined on the Proposals Map, plus the extension to Dunster Sports Field approved in 2008.

Annual Monitoring Report 2013/14
Support to the Community & Business 44
COMMUNITY SERVICES AND FACILITIES
7.75 The indicators in Table 7.7 seek to measure the changes in services and facilities within the National Park. The Local Plan policies aim to ensure there is a range of accessible services and facilities retained in communities across Exmoor.
7.76 Several small-scale community services and facilities were permitted during 2013/14. These include an extension to the Bowling Club Pavilion in Lynton, change of use of existing toilet block to workspace for personal training and fitness, change of use of B2 general industrial area to art gallery; change of use from ground floor shop to café/restaurant; demolition and reconstruction of fire damaged school building; and retention of temporary classroom buildings at two schools.
TABLE 7.7: COMMUNITY SERVICES & FACILITIES
7.77 The Index of Multiple Deprivation (IMD) combines a number of indicators to cover a
range of issues, into a single deprivation score or rank for each small area in England. There are seven domains of deprivation, and each domain contains a number of component indicators. The criteria for inclusion of these indicators are that they should be specific, appropriate, capable of being updated on a regular basis, and available for the whole of England at a small area level. The Department for Communities and Local Government is updating the indices of deprivation, including the Index of Multiple Deprivation (IMD), for publication in summer 2015.
Indicators Policy Result Comment
No. of meeting places CSF1
26
Settlement Audit 2009
Distance of households from key services
CSF2 - CSF6
See table 6.7a. Data will include areas which are not within the National Park boundary. Index of Multiple Deprivation 2010
Creation and loss of community services and facilities
CSF2 - CSF3
Community services and facilities permitted: Extension to the Bowling Club Pavilion in Lynton to provide a
changing room, WC and additional space Part demolition of fire damaged school building and
reconstruction to revised layout Retention of two temporary buildings as classroom space for a
further 10 years – Dulverton Middle & Community School Retention of a classroom at Parracombe CofE Primary School Change: Change of use of ground floor shop with shop manager's flat
above to a ground floor café/restaurant Change of use of rear area of existing toilet block into
workspace for personal training and fitness Change of use of first floor of Pavilion to café/restaurant Change of use of B2 general industrial employment land to art
gallery.

Annual Monitoring Report 2013/14
Support to the Community & Business 45
South West Lower Super Output Areas by IMD Quintile40
7.78 Barriers to Housing and Services Domain41 – this domain measures the physical and financial accessibility of housing and key local services. The indicators fall into two sub-domains: ‘geographical barriers’, which relate to the physical proximity of local services, and ‘wider barriers’ which includes issues relating to access to housing such as affordability.
7.79 Wider barriers:
Household overcrowding – the proportion of households within a Lower Super Output Areas (LSOA) which are judged to have insufficient space to meet the household’s needs
Homelessness – the rate of acceptances for housing assistance under the homelessness provisions of the 1996 Housing Act (at local authority district level)
Difficulty of access to owner-occupation (local authority district level) – proportion of households aged under 35 whose income means they are unable to afford to enter owner occupation.
7.80 Geographical barriers:
Road distance to a GP surgery Road distance to a supermarket or convenience store Road distance to a primary school Road distance to a Post Office.
7.81 Table 7.7a sets out the distance of households from key services – this is based on LSOAs and the 2010 Index of Multiple Deprivation (IMD). The data clearly shows that LSOA Exmoor & Quarme, which covers parishes such as Exford, Simonsbath, Withypool, Winsford, Cutcombe and Brompton Regis, continues to be the furthest LSOA from the key services listed.
40 http://www.swo.org.uk/local-profiles/indices-of-multiple-deprivation/ 41 Communities and Local Government – The English Indices of Multiple Deprivation 2010: Neighbourhoods Statistical Release 24 March 2011

Annual Monitoring Report 2013/14
Support to the Community & Business 46
TABLE 7.7a Road Distance to nearest km
Lower Super Output
Area Post Office Food Shop GP Primary School IMD Ranking
201042
Dulverton and Brushford E01029328
1.79 1.79 2.12 2.44 11093
Old Cleeve E01029335 2.89 7.16 4.62 5.43 11291
Exmoor & Quarme E01029338
2.19 8.51 11.23 5.82 12410
Porlock & District E01029336
1.48 1.92 2.02 2.61 12609
Parracombe / Trentishoe/Martinhoe/ pt. Combe Martin E01020100
2.19 5.15 11.59 2.47 12796
Aville Vale & Dunster E01029325
0.43 3.50 4.37 0.88 14562
Lynton and Lynmouth E01020126
1.05 1.68 1.64 1.43 17506
NOTES
Population weighted average road distance to a specific service
IMD Ranking: 1 = most deprived area 32482 = least deprived area
16241 = mid-point
7.82 In terms of the ‘Barriers to Housing and Services Domain’ the Exmoor & Quarme area is one of the lowest in England, ranked only 3 out of 32482 (the lowest 10 ranked in this domain are LSOAs within the South West or within London). However, many of the other LSOAs in the National Park also are within the lowest 20% ranking in this domain as this is the most widespread type of deprivation in the South West given the sparse rural areas across Cornwall, Dorset and Somerset43. Other domains for the LSOAs within the National Park score highly, such as crime, health, employment and education and skills; causing the overall IMD ranking to be higher.
7.83 There has generally been very little change for most of the areas listed in Table 7.7a between 2007 and 2010. However, Old Cleeve LSOA has dropped by over 2000 in the IMD ranking and the Parracombe/Combe Martin area has increased by nearly 1400. Lynton & Lynmouth LSOA continues to have the highest ranking in the National Park, and is the only area above the mid-point IMD ranking (16241).
7.84 Problems concerning the loss of services such as shops, post offices and petrol stations and low levels of public transport provision within rural communities are well documented. Local Plan policies seek to protect local services and facilities such as shops, Post Offices and schools from change of use in rural settlements to help address the issue of accessibility over mobility to benefit both visitor and residents. The loss of such community services and facilities would mean that those with private transport would have to travel further to access services and facilities.
42 Department for Communities and Local Government, Indices of Deprivation 2010 43 South West Observatory – Index of Multiple Deprivation 2010 – Key Facts from IMD 2010 http://www.swo.org.uk/local-profiles/indices-of-multiple-deprivation/?assetdet1006773=47637
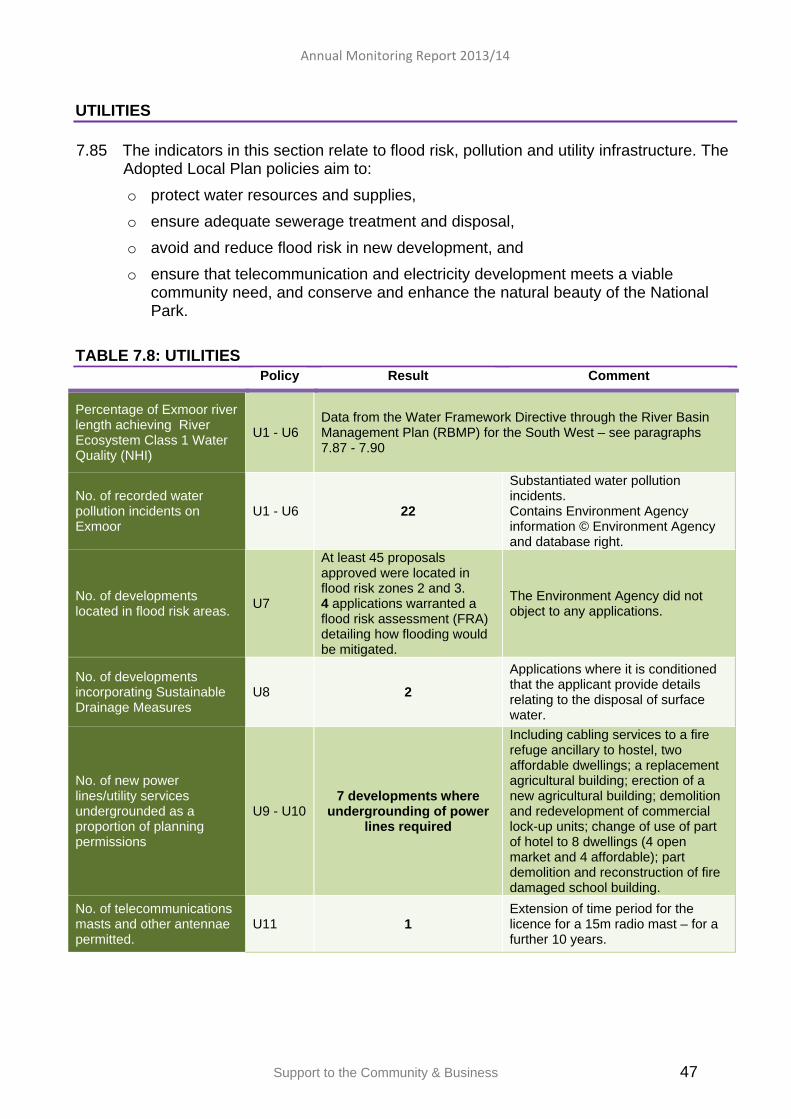
Annual Monitoring Report 2013/14
Support to the Community & Business 47
UTILITIES
7.85 The indicators in this section relate to flood risk, pollution and utility infrastructure. The
Adopted Local Plan policies aim to:
o protect water resources and supplies,
o ensure adequate sewerage treatment and disposal,
o avoid and reduce flood risk in new development, and
o ensure that telecommunication and electricity development meets a viable community need, and conserve and enhance the natural beauty of the National Park.
TABLE 7.8: UTILITIES
Indicators Policy Result Comment
Percentage of Exmoor river length achieving River Ecosystem Class 1 Water Quality (NHI)
U1 - U6 Data from the Water Framework Directive through the River Basin Management Plan (RBMP) for the South West – see paragraphs 7.87 - 7.90
No. of recorded water pollution incidents on Exmoor
U1 - U6 22
Substantiated water pollution incidents. Contains Environment Agency information © Environment Agency and database right.
No. of developments located in flood risk areas.
U7
At least 45 proposals approved were located in flood risk zones 2 and 3. 4 applications warranted a flood risk assessment (FRA) detailing how flooding would be mitigated.
The Environment Agency did not object to any applications.
No. of developments incorporating Sustainable Drainage Measures
U8 2
Applications where it is conditioned that the applicant provide details relating to the disposal of surface water.
No. of new power lines/utility services undergrounded as a proportion of planning permissions
U9 - U10 7 developments where
undergrounding of power lines required
Including cabling services to a fire refuge ancillary to hostel, two affordable dwellings; a replacement agricultural building; erection of a new agricultural building; demolition and redevelopment of commercial lock-up units; change of use of part of hotel to 8 dwellings (4 open market and 4 affordable); part demolition and reconstruction of fire damaged school building.
No. of telecommunications masts and other antennae permitted.
U11 1 Extension of time period for the licence for a 15m radio mast – for a further 10 years.

Annual Monitoring Report 2013/14
Support to the Community & Business 48
7.86 The River Basin Management Plan (RBMP) for the South West delivers the Water
Framework Directive and has a number of classifications to report on the overall status of water bodies. For surface waters these include ecological and chemical status. For a water body to be in overall ‘good’ status both ecological and chemical status must be at least ‘good’44.
7.87 The ecological status of the majority of river length, including the Barle, Exe, West Lyn and Badgworthy Water, in the National Park area is good – with the Heddon, Haddeo, Quarme, Washford and Avill rivers all classified as moderate. However, part of the East Lyn, the Pulham River and Horner Water were identified as poor from Environment Agency data in 201445. The failing biological element for each of these water bodies was ‘fish’ for a variety of reasons. The part of the East Lyn classified as poor is a priority water body with priority to attain an ecological status of ‘good’ by 2015). For Horner Water, the physical factors of the catchment including topography and impermeable geology have an important role in the river flows and abstraction during dry periods. This watercourse also supplies Nutscale Reservoir46. See Appendix 2 for a table outlining the status of Exmoor’s rivers taken from Environment Agency data in 2014.
7.88 None of Exmoor’s rivers require assessment for their chemical status – because the chemical pollutants assessed through the RBMP are not discharged into these water bodies in significant quantities.
7.89 There were 22 pollution (notification) events within the National Park during the monitoring period. The Environment Agency’s National Incident Recording System logs all notifications including pollution and flood alerts. This is an increase of 10 notifications from the previous monitoring year, possibly connected to the exceptionally wet winter weather. For the winter 2013/14, the persistent heavy rainfall through the season resulted in the wettest winter for the UK, England and Wales in series from 1910. It was also the wettest winter in the long running England and Wales Precipitation series from 176647.
7.90 The Environment Agency (EA) did not object to any applications during 2013/14.
7.91 Four applications approved included a Flood Risk Assessment explaining the likelihood of flooding, and the mitigation which would be undertaken to address flooding issues, or plans were amended to address these issues. These related to the major development at Shearwell Data Ltd, Cutcombe, construction of a car port and alterations to a dwelling in Winsford, the installation of a commercial kitchen and associates works at Lynmouth Pavilion and the retention of a classroom at Parracombe CofE Primary School. These applications had regard to Environment Agency (EA) standing advice which applies to certain types of application within flood zones 2 and 348.
44 Environment Agency River Basin Management Plan, South West River Basin District Annex A: Current state of our waters (December 2009) 45 Note: classification of ecological status includes categories – high, good, moderate, poor, and bad. 46 Contains Environment Agency information © Environment Agency and database right 47 Met Office data: http://www.metoffice.gov.uk/climate/uk/summaries/2014/winter 48 Flood Zone 2: This zone comprises land assessed as having between a 1 in 100 and 1 in 1000 annual probability of river flooding (1% – 0.1%) Flood Zone 3: This zone comprises land assessed as having a 1 in 100 or greater annual probability of river flooding (>1%)– PPS25 Table D.1
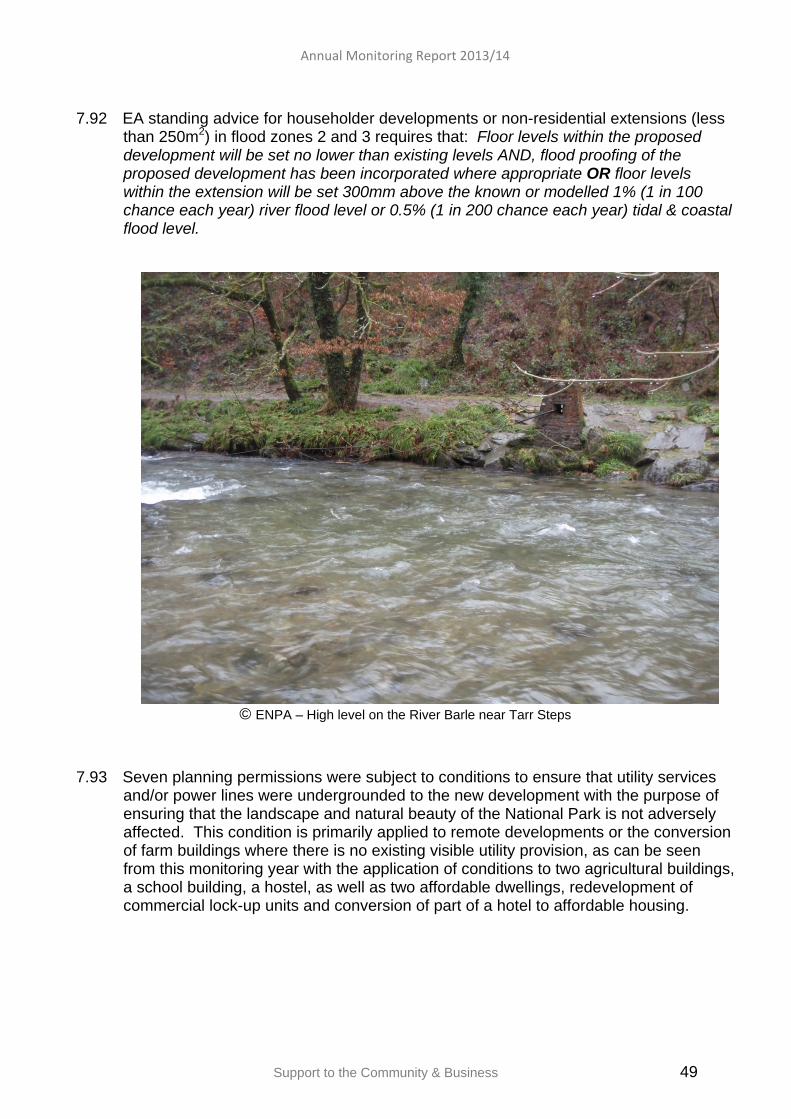
Annual Monitoring Report 2013/14
Support to the Community & Business 49
7.92 EA standing advice for householder developments or non-residential extensions (less than 250m2) in flood zones 2 and 3 requires that: Floor levels within the proposed development will be set no lower than existing levels AND, flood proofing of the proposed development has been incorporated where appropriate OR floor levels within the extension will be set 300mm above the known or modelled 1% (1 in 100 chance each year) river flood level or 0.5% (1 in 200 chance each year) tidal & coastal flood level.
© ENPA – High level on the River Barle near Tarr Steps
7.93 Seven planning permissions were subject to conditions to ensure that utility services and/or power lines were undergrounded to the new development with the purpose of ensuring that the landscape and natural beauty of the National Park is not adversely affected. This condition is primarily applied to remote developments or the conversion of farm buildings where there is no existing visible utility provision, as can be seen from this monitoring year with the application of conditions to two agricultural buildings, a school building, a hostel, as well as two affordable dwellings, redevelopment of commercial lock-up units and conversion of part of a hotel to affordable housing.

Annual Monitoring Report 2013/14
Support to the Community & Business 50
TRAFFIC AND TRANSPORT
7.94 The successful management of roads and traffic underlines the strategies for conservation, public enjoyment and community well-being, as well as contributing to sustainability.
7.95 The indicators within Table 7.9 aim to monitor the policies within this section, and report on various aspects of traffic and transport within the National Park. The responsibility for roads and traffic management lies with Devon and Somerset County Councils (as Highway Authorities); therefore the implementation of the policies within this section relies on a close working relationship with both these authorities.
TABLE 7.9: TRAFFIC & TRANSPORT Indicator Policy Result Comment
Volume of traffic - volume of HGV traffic
TR1 - TR9 See table 7.9a below
Car & cycle parking provision in new development
TR10
7 applications directly specified parking arrangements including to ensure adequate parking arrangements for re-development of the business site at Shearwell Data and also at the conversion of a barn to bunk house accommodation. However applicants do have to specify existing and additional parking requirements if application to their proposal.
Proportion of new businesses, houses, and facilities accessible by public transport.
TR11 73%
Within 400m of a bus stop with a daily service running Mon-Sat throughout the year and providing five return journeys per day.
No. of settlements with daily bus service.
TR11 10
Based on Exmoor National Park bus timetable (Explore Moor) and applies to a Mon-Sat service serving a settlement at least 5 times a day.
Length of public right of way (PROW) adversely affected by development.
TR12 0
TABLE 7.9a AVERAGE ANNUAL DAILY HGV TRAFFIC Road Location 2008 2009 2010 2011 2012 2013 A39 Culbone Stables 20 20 20 20 20 20
A39 East of Headon Cross 40 40 40 40 50 70
A396 Avill Farm 40 40 40 40 40 50
A396 North of Dunster 40 40 40 40 40 40
B3190 Raleghs Cross 40 60 60 60 50 50
B3223 Red Deer Farm 20 20 20 30 40 50
B3223 North of Simonsbath 10 10 10 10 10 10
B3224 Goosemoor 30 30 30 50 50 70
B3224 West of Wheddon Cross 20 20 20 20 20 20
B3358 West of Simonsbath 20 20 20 20 20 20

Annual Monitoring Report 2013/14
Support to the Community & Business 51
7.96 Charts 7.5 and 7.6 below illustrate the average daily traffic flows on the main transport routes within the National Park. Annual average daily traffic counts within the National Park show relatively stable traffic numbers compared to previous years (chart 7.6). Some locations show an increase on the levels for 2012; however this may be linked to the lower number of tourist days during that year (probably due to poor summer weather and the major international event of the 2012 Olympics). The roads with the highest average daily traffic in the National Park are the principal routes which include the A396 and A39. August traffic flows continue to be substantially higher than average annual daily flows, particularly on the A39, resulting in some congestion experienced in settlements during these peak periods including within Dunster and Porlock where these main highway routes are particularly narrow.
7.97 Heavy Goods Vehicles (>7.5 tonnes) traffic levels recorded at specific points across the West Somerset area of the National Park remain stable at the majority of locations. However, this monitoring year saw the average per day east of Headon Cross rise from 50 to 70, and the level at Goosemoor rose similarly from 50 to 70 (compared to 30 in 2011). HGV traffic is directed for local access via Machine Cross, Heathpoult Cross, Raleghs Cross and Sticklepath to avoid restrictions at Dunster and difficult turning at Wheddon Cross (Table 7.9a).
7.98 The National Park aims to encourage the use of sustainable forms of transport wherever possible, although it is recognised that there is a high dependency upon private cars for the majority of journeys to work (Census 2001) due to the limited public transport network. In terms of housing completed during 2013/14, 22 out of 30 completed dwellings (gross housing completions – see Appendix 1 for further information) were accessible by a regular daily public transport service.
7.99 There are no hourly bus services that serve the National Park directly (the Minehead to Taunton service does serve Dunster but the bus stop is outside the National Park boundary). Bus services such as the 398/399, 309/310, 10 and 25 do serve a number of settlements on Exmoor on a regular daily (Monday to Saturday) basis throughout the year, allowing residents to access services and facilities at larger centres outside the National Park.
7.100 There are 10 settlements served by a regular daily bus service on Exmoor (with at least 5 or more return journeys), which leaves a number of smaller villages which may only receive a weekly bus service or no service at all. The cuts to local government budgets have meant that some subsidised bus journeys are no longer funded and the service in some cases has stopped completely or the number of services has been reduced. Villages such as Withypool, Roadwater and Monksilver no longer have a regular bus service. There are some forms of community transport and demand responsive transport which help to meet some transport needs, but do not necessarily always fulfill the community’s need for transport where people do not or no longer have access to their own transport or regular public transport.

Annual Monitoring Report 2013/14
Support to the Community & Business 52
0
1000
2000
3000
4000
5000
6000
Chart 7.5 2013 Average Daily Traffic Figures
Average Annual Daily Traffic Average Daily August Traffic
0
500
1000
1500
2000
2500
3000
3500
4000
4500
5000Chart 7.6 Average Annual Daily Traffic Flows 2009-2013
2009
2010
2011
2012
2013

Annual Monitoring Report 2013/14
Support to the Community & Business 53
MINERALS AND WASTE
7.101 The National Park Authority is the Minerals and Waste Planning Authority within the
National Park and is responsible for determining applications for minerals and waste related development.
7.102 Minerals: The general policy of the National Park Authority is to resist proposals for mineral workings within the National Park, owing to the unacceptable adverse impact the workings and operation of such development would have on the National Park’s special qualities and local amenity.
7.103 However, there is provision for small-scale mineral workings in order to ensure a resource of local building stone to help maintain the character and local distinctiveness of new buildings on Exmoor. During this AMR period there have been no applications for mineral workings within the National Park.
7.104 Waste: The Local Plan policies for waste seek to provide small scale waste recycling facilities with the aim of increasing the level of recycling and associated environmental benefits, within the National Park.
7.105 Both District Councils for West Somerset and North Devon operate fortnightly kerb-side collections for recyclable materials, but some recycling collection points are also located within settlements on Exmoor to encourage the recycling of waste materials such as paper, cardboard, glass and steel/aluminum cans.
TABLE 7.10: MINERALS & WASTE
Indicator Policy Result Comment No. and proportion of mineral applications permitted
M1 -M3 0 No applications received
No. of quarries for local building stone.
M4 0 1 extant permission - not active
No. of recycling facilities WD1 - WD2
1 in the North Devon area of the National Park 5 in the West Somerset area of the National Park.
WSDC and NDDC both operate kerbside collections for recyclable materials.

Annual Monitoring Report 2013/14
Support to the Community & Business 54
8 EVALUATION OF PLANNING APPLICATIONS 2013/14 PLANNING STATISTICS 8.1 During the AMR period the Development Management Team received 296 planning
applications and determined 293 applications.
8.2 Fee income has decreased which is partly due to the planning application fee for the two major applications determined during the monitoring period being received in the previous monitoring year.
TABLE 8.1 - PLANNING FEE INCOME
Year £ No. of applications received 2004/05 £52,130 349 2005/06 £61,588 311 2006/07 £57,262 350 2007/08 £55,478 385 2008/09 £58,747 250 2009/10 £73,078 282 2010/11 £75,903 317 2011/12 £71,898 329 2012/13 £74,625 306 2013/14 £61,785 352
8.3 The majority of planning applications received by the Authority are classified as:
o small-scale major - e.g. 10 or more dwellings or non-residential development of 1000sqm or greater,
o minor - e.g. small numbers of dwellings or business development, or o other - e.g. householder development, change of use, and listed building
consent.
8.4 The highest proportion of applications determined during 2013/14 is for either minor or ‘other’ (see Table 8.2 below). The percentage of delegated decisions for applications i.e. determined by officers continues to be high at 94.88%. Of those remaining applications decided at Planning Committee, there were some instances where the decision made by the Committee was contrary to the Officers recommendation. These decisions were made for a variety of reasons including where Members felt the balance of the evidence presented supported their final decision.
TABLE 8.2: APPLICATIONS DETERMINED DURING 2013/14
Application Type Number %
Major 2 0.68% Minor 123 41.98% Other 168 57.34%

Annual Monitoring Report 2013/14
Support to the Community & Business 55
8.5 The proportion of applications approved during 2013/14 continued to be high (84%),
reflecting time spent by Officers in pre-application discussions with potential applicants, including weekly planning surgeries held at Lynton and Porlock. Two major applications were approved during the monitoring period. Determination of major, minor and other applications exceeded targets (see Table 8.3).
TABLE 8.3 – DEVELOPMENT CONTROL NATIONAL TARGETS
% Major Applications within 13 weeks (target 60%) 50%
% Minor applications within 8 weeks (target 70%) 72%
% Other Applications within 8 weeks (target 80%) 85%
APPEALS 8.6 Eight appeals were determined by the Planning Inspectorate during the 2013/14, three
of which were appeals against enforcement notices and one was an appeal against refusal of a Certificate of Lawful Use or Development (see Table 8.4 below for further details). Of the eight appeals, on four occasions the Inspector upheld the decisions of the Authority, and on four occasions the Inspector allowed the appeal.
TABLE 8.4: APPEAL DECISIONS DURING 2013/14
Application No.
Appeal No.
Parish & Appeal Details
Proposal /
Breach
Appeal Type
Inspector's
Decision
Application No. 6/26/13/101 APP/F9498/D/13/2196157
Roadwater: Proposed rear extension
Against refusal of permission
Written Representation
Dismissed 28/5/2013
Application No. 6/35/12/102 APP/F9498/A/13/2191046
Treborough: Proposed change of use of storage facilities into ancillary guest accommodation associated to an existing equestrian enterprise
Against refusal of permission
Written Representation
Allowed 18/6/2013
Application No. 6/15/12/107 APP/F9498/C/12/2189820
Exton: Breach of planning control by unauthorised development involving engineering works, ground works and construction of a building
Against enforcement notice
Written Representation
Allowed 24/6/13 and enforcement notice varied and upheld
Enforcement Notice ENF/0112/11 APP/F9498/C/12/2179697
Minehead: Breach of planning control by erection of timber clad and sheeted roof outbuilding on a concrete base
Against enforcement notice
Written Representation
Dismissed 5/8/2013

Annual Monitoring Report 2013/14
Support to the Community & Business 56
Application No.
Appeal No.
Parish & Appeal Details
Proposal /
Breach
Appeal Type
Inspector's
Decision
Application No. 6/26/12/108 APP/F9498/X/13/2193091
Roadwater:Proposed lawful use as a dwelling house
Against refusal of grant of Certificate of Lawful Use or Development
Written Representation
Dismissed 20/8/13
Application No. 6/15/12/107 APP/F9498/A/13/2198136
Exton: Proposed erection of cattle shed to house 90 cattle
Against refusal of permission
Written representation
Allowed 17/9/13
Application No. 6/34/12/102 APP/F9498/C/13/2196745 APP/F9498/C/13/2198308
Timberscombe: Breach of planning control by construction and use of a building for residential purposes
Against enforcement notice
Hearing Allowed 16/12/13
Application No. 62/41/13/006 APP/F9498/A/13/2201116
Lynton Proposed 3-bed dwelling for local needs
Against refusal of permission
Written Representation
Dismissed 6/2/14
CHANGES TO THE PLANNING SYSTEM
8.7 The Planning Guarantee: In 2012 the Government consulted on ‘Planning performance and the planning guarantee’. This consultation was based on the Growth & Infrastructure Bill which made provisions for planning applications to be submitted directly to the Secretary of State if a local planning authority was designated to be poorly performing. It was considered by the Government that the speed and quality of decisions were important indicators of the planning service being delivered. The introduction of the Planning Performance Guarantee and ‘special measures designation’ came into force on 1 October 201349. The effect of the new regulations is that:
- for any application submitted after 1 October 2013, if a decision is not made within 6 months of submission, the planning fee is repayable unless an extension of time is agreed with the applicant.
- where any Authority fails to determine at least 40% of major applications within the statutory 13 week period, the Secretary of State may designate that authority as poorly performing, require an improvement plan to be put in place and allow applicants to make major applications direct to the Planning Inspectorate. Performance is assessed over a rolling 2-year period. As reported to the Planning Committee in October 2014, based on the most recent Government statistics Exmoor National Park Authority had determined 83% of major applications within the statutory period and was placed 37th out of the 340 planning authorities assessed.
8.8 The government has also introduced measures to speed up the process for determining appeals relating to applications for planning permission and applications for listed building and conservation area consent. The new rules require appellants to submit their full case up front with the aim of reducing the time taken to determine the
49 The Town and Country Planning (Fees for Applications Deemed Applications, Requests and Site Visits) (England) (Amendment) Regulations 2013

Annual Monitoring Report 2013/14
Support to the Community & Business 57
appeal, introduce statements of common ground in hearings, and expand the scope of the written representations procedure.
8.9 Other alterations to the General Permitted Development Order: Following consultation, a number of changes have been made to the GPDO during the monitoring period. Those which are likely to be most relevant to the National Park Authority include:
Changes to simplify the change of use system and promote the provision of new homes, nurseries and schools50. Part 3 of Schedule 2 to the General Permitted Development Order is amended to create a number of new permitted development rights for change of use, some of which also permit associated operational development:
• Class CA: shops (A1) may become banks, building societies, friendly societies or credit unions;
• Class K: business premises (B1), hotels (C1), residential institutions (C2), secure residential institutions (C2A) and premises used for assembly and leisure (D2) may become registered nurseries;
• Class MA: agricultural buildings may become registered nurseries or state-funded schools.
Abolition of provisions on conservation area consent and introducing into planning control enforcement mechanisms, in particular immediate criminal liability that applied to conservation area consent; and removing permitted development rights for demolition of unlisted buildings in conservation areas. The abolition of conservation area consent came into force on 1 October 201351. It is then an offence for a person to carry out or cause or permit demolition of an unlisted building in a conservation area without the required planning permission.
Limit to the circumstances in which compensation is payable in the event that the new permitted development rights are withdrawn. The effect of these Regulations52 is to add new classes of development53 to the list of permitted development rights for which compensation on withdrawal of the right is limited in various ways. When the permitted development rights are withdrawn, compensation is only payable in respect of planning applications made within 12 months beginning on the date the directions took effect.
8.10 National Parks and other designated protected landscapes were excluded from new permitted development rights to allow existing freestanding electronic communications masts to be altered or replaced to become masts up to 20 metres high and up to a third wider than the existing mast54.
50 The Town and Country Planning (General Permitted Development)(Amendment and Consequential Provisions) (England) Order 2014 51 The Town and Country Planning (General Permitted Development) (Amendment) (England) (No. 3) Order 2013 52 The Town and Country Planning (Compensation) (England) (Amendment) Regulations 2014 53 Classes CA, I, IA, J, K, L, M, MA and MB of Part 3 (changes of use and associated operational development) are added to Regulation 2 54 The Town and Country Planning (General Permitted Development) (Amendment) (No. 2) (England) Order 2013

Annual Monitoring Report 2013/14
Support to the Community & Business 58
9 APPENDIX 1: HOUSING COMPLETIONS 2013/14 9.1 Each year a survey of housing permissions is carried out. It updates information on the
construction or completion of dwelling units with extant planning permission during the previous financial year within the National Park. Its purpose is to ascertain the unit status of extant permissions for full planning permission and reserved matters. Key findings from the survey are as follows:
9.2 Completions: Table 9.1 provides the number of housing completions for each relevant parish within the National Park. The key results from the data are set out below.
30 Completions (Gross) 26 Completions (Net) 33% were on previously developed land (PDL) In terms of dwelling density as the number of dwellings per hectare (dph):
o 71.43% of the sites had a density of less than 30dph o 7.14% had a density of 30-50dph o 21.43% had a density of over 50dph
9.3 In terms of housing completions, the net figure is the overall increase in the number of dwelling units. The gross figure relates to the number of dwelling units recorded as ‘completed’ during the monitoring year. For example, this year a house was subdivided into 2 dwellings this was recorded as 2 units completed (the gross figure), but only a net gain of 1 unit, as one dwelling unit (the original house) already existed. Similarly building a replacement dwelling produces no net gain in the total dwelling stock.
9.4 For some monitoring years, the gross and net dwelling figures may be the same – where no existing dwelling units are lost or altered through demolition, change of use, or subdivision.
9.5 The majority of dwellings completed during the monitoring year were located within the Local Rural Centres with 15 affordable homes delivered at Villes Lane, Porlock. The development was made possible following a policy departure to allow open market housing to subsidise the cost of the access road in order to release this affordable housing site. A further affordable dwelling was completed at Sparkhayes campsite in Porlock. Four dwellings were completed in Dulverton through two conversions and the replacement of an existing dwelling with two semi detached bungalows (one being a local needs affordable home) – see Chart 9.1 below.
9.6 Almost half of completed dwellings were 2-bedroom homes and a third were 3-bedroom homes. There were two homes with four bedrooms which were part of the development of local needs affordable dwellings in Porlock. Four one-bedroom homes were completed through three applications for change of use and one for the conversion of attic space to a flat. Chart 9.2 illustrates the size of dwellings completed according to the number of bedrooms.
9.7 Dwellings under construction: At the end of the reporting period there were 31 dwellings under construction to give an eventual net gain (when complete) of 26 dwellings. In Lynton and Lynmouth, these include the conversion, subdivision and alteration of a building to create 5 dwellings, 2 of which would be local needs affordable and the demolition of a garage to create 2 affordable homes. In Dulverton,
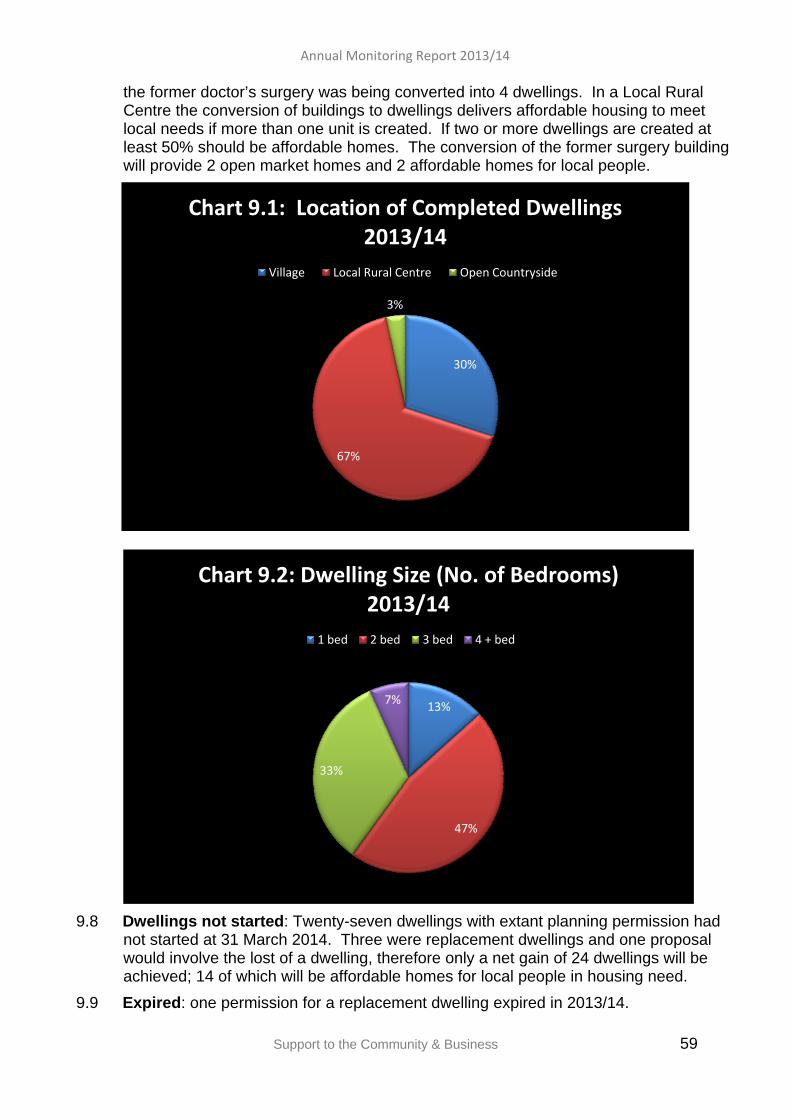
Annual Monitoring Report 2013/14
Support to the Community & Business 59
the former doctor’s surgery was being converted into 4 dwellings. In a Local Rural Centre the conversion of buildings to dwellings delivers affordable housing to meet local needs if more than one unit is created. If two or more dwellings are created at least 50% should be affordable homes. The conversion of the former surgery building will provide 2 open market homes and 2 affordable homes for local people.
9.8 Dwellings not started: Twenty-seven dwellings with extant planning permission had not started at 31 March 2014. Three were replacement dwellings and one proposal would involve the lost of a dwelling, therefore only a net gain of 24 dwellings will be achieved; 14 of which will be affordable homes for local people in housing need.
9.9 Expired: one permission for a replacement dwelling expired in 2013/14.
30%
67%
3%
Chart 9.1: Location of Completed Dwellings 2013/14
Village Local Rural Centre Open Countryside
13%
47%
33%
7%
Chart 9.2: Dwelling Size (No. of Bedrooms) 2013/14
1 bed 2 bed 3 bed 4 + bed

Annual Monitoring Report 2013/14
Support to the Community & Business 60
Table 9.1 Dwelling Completions 2013/14
Parish Change of Use Subdivision New Build
CLEUD LNAH PDL Bedrooms
P.S R.P Losses P.S R.P Losses P.S R.P. Losses 1 2 3 4
Luxborough 1 1 1
Old Cleeve 2 1 2 2
Porlock 1 15 16 8 6 2
Timberscombe 1 1 1 2 1 1
Treborough 1 1 1
Winsford 1 1 1 1
Withypool & Hawkridge 1 1 1 1
Dulverton 2 2 1 1 2 1 3
Brendon& Countisbury 1 1 1
Challacombe 1 1 1
TOTAL 6 0 0 2 0 1 4 17 3 1 20 10 4 14 10 2
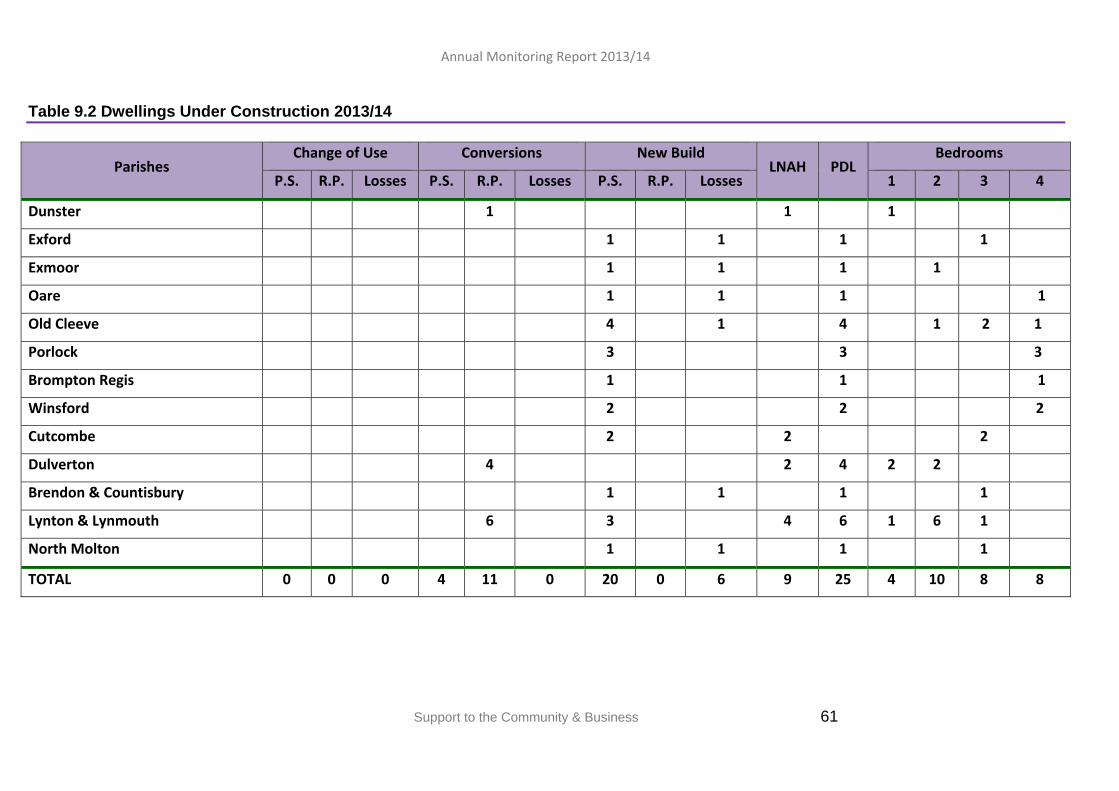
Annual Monitoring Report 2013/14
Support to the Community & Business 61
Table 9.2 Dwellings Under Construction 2013/14
Parishes Change of Use Conversions New Build
LNAH PDL Bedrooms
P.S. R.P. Losses P.S. R.P. Losses P.S. R.P. Losses 1 2 3 4
Dunster 1 1 1
Exford 1 1 1 1
Exmoor 1 1 1 1
Oare 1 1 1 1
Old Cleeve 4 1 4 1 2 1
Porlock 3 3 3
Brompton Regis 1 1 1
Winsford 2 2 2
Cutcombe 2 2 2
Dulverton 4 2 4 2 2
Brendon & Countisbury 1 1 1 1
Lynton & Lynmouth 6 3 4 6 1 6 1
North Molton 1 1 1 1
TOTAL 0 0 0 4 11 0 20 0 6 9 25 4 10 8 8
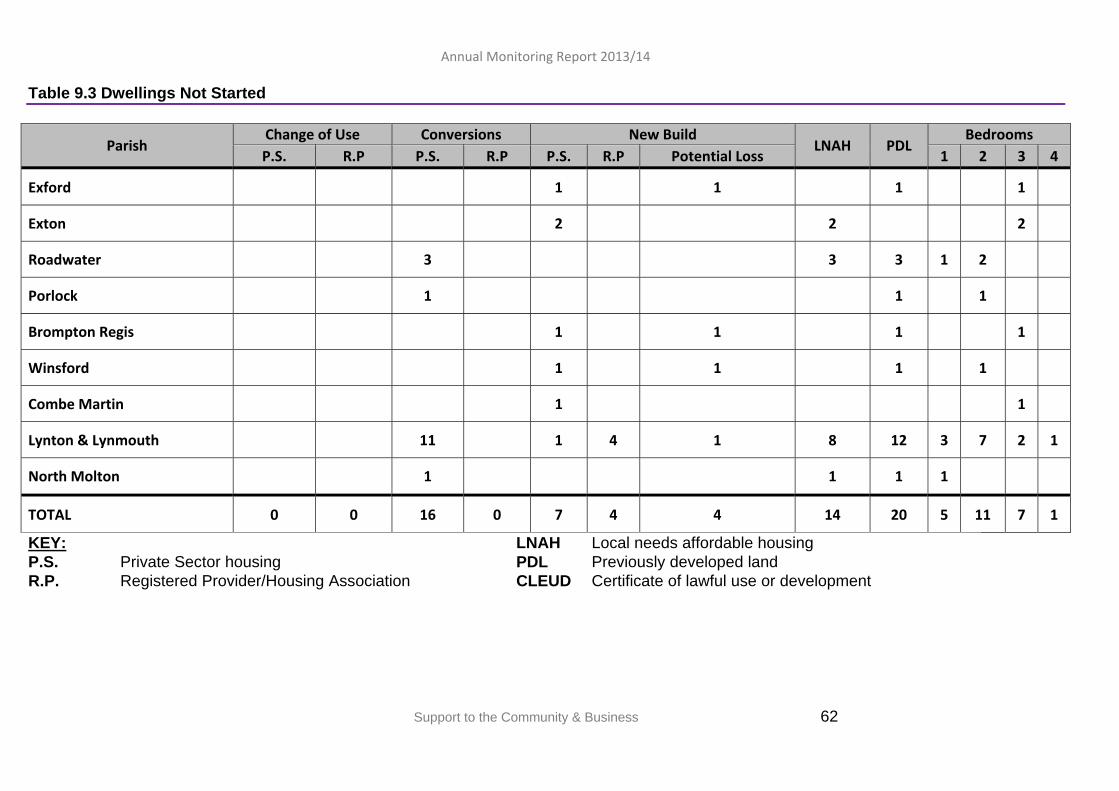
Annual Monitoring Report 2013/14
Support to the Community & Business 62
Table 9.3 Dwellings Not Started
Parish Change of Use Conversions New Build
LNAH PDL Bedrooms
P.S. R.P P.S. R.P P.S. R.P Potential Loss 1 2 3 4
Exford 1 1 1 1
Exton 2 2 2
Roadwater 3 3 3 1 2
Porlock 1 1 1
Brompton Regis 1 1 1 1
Winsford 1 1 1 1
Combe Martin 1 1
Lynton & Lynmouth 11 1 4 1 8 12 3 7 2 1
North Molton 1 1 1 1
TOTAL 0 0 16 0 7 4 4 14 20 5 11 7 1
KEY: LNAH Local needs affordable housing P.S. Private Sector housing PDL Previously developed land R.P. Registered Provider/Housing Association
CLEUD Certificate of lawful use or development

Annual Monitoring Report 2013/14
Support to the Community & Business 63
10 APPENDIX 2 – STATUS OF EXMOOR’S RIVERS AND STREAMS
River Overall
Risks
Current ecological
quality
2015 Predicted ecological quality
Hydro-morphological
status Typology Description
Overall Biological
Quality Fish
Macro-
invertebrates
Barle At Risk Good Good Not designated Mid, small, siliceous Good High High Danesbrook Probably at Risk Good Good Not designated Mid, small, siliceous Good Good High Sherdon Water Probably at Risk Good Good Not designated Mid, small, siliceous Good Good - Exe At Risk Good Good Not designated Mid, small, siliceous Good Good High Badgworthy Water
Probably at Risk Good Good Not designated Mid, small, siliceous High - High
East Lyn W. of Watersmeet
Probably Not at Risk Good Good Not designated Mid, small, siliceous High - High
West Lyn Probably at Risk Good Good Not designated Mid, small, siliceous High - High Aller Probably Not at Risk Good Good Not designated Low, Small, Calcareous High - High Hawkcombe Stream
At Risk Good Good Not designated Mid, small, siliceous High - High
East Lyn (Brendon)
Probably Not At Risk
Good Good Not designated Mid, small, siliceous Good Good -
Haddeo At Risk Moderate Potential
Moderate Potential Heavily modified Mid, small, siliceous Good Good High
Avill At Risk Moderate Potential
Moderate Potential Heavily modified Low, small, siliceous Poor Poor High
Quarme At Risk Moderate Good Not designated Mid, small, siliceous Moderate Moderate High Heddon Probably at Risk Moderate Moderate Not designated Mid, small, siliceous Moderate Moderate -
Washford River At Risk Moderate Potential
Moderate Potential Heavily modified Mid, small, siliceous Moderate Moderate -
East Lyn River (Robbers Bridge)
Probably at Risk Poor Good Not designated Mid, small, siliceous Poor Poor -
Pulham At Risk Poor Poor Not designated Mid, small, siliceous Poor Poor Good Horner Water At Risk Poor Moderate Not designated Mid, small, siliceous Poor Poor High Contains Environment Agency information © Environment Agency.
Annual Monitoring Report 2013/14
Support to the Community & Business 64
11 GLOSSARY AMR: Annual Monitoring Report CWS: County Wildlife Site – now more commonly referred to as Local Wildlife
Sites CLG/DCLG: Department for Communities and Local Government EA: Environment Agency LDD: Local Development Document LDS: Local Development Scheme NPPF: National Planning Policy Framework ONS: Office for National Statistics SA: Sustainability Appraisal SAC: Special Area of Conservation SCI: Statement of Community Involvement SEA: Strategic Environmental Assessment SFRA: Strategic Flood Risk Assessment SHLAA: Strategic Housing Land Availability Assessment SHMAA: Strategic Housing Market Area Assessment SPD: Supplementary Planning Document SSSI: Site of Special Scientific Interest