Energy Industry Leader Exmar Chooses Cisco HyperFlex and ...

EXMARANNUAL REPORT 2010
COVER EXMAR A4 ENG.indd 1 28/04/11 16:01

Mission statement p. 1
Activities p. 2
Chairman’s note p. 3
Highlights 2010 p. 4
EXMAR in the world p. 6
Lpg, nH3 & petchem p. 8
Lng / LngRv p. 16
Offshore p. 22
Services p. 28
personnel p. 32
Environment p. 34
Safety and quality p. 36
EXMAR share p. 38
Contents
COVER EXMAR A4 ENG.indd 2 28/04/11 16:51

Key fIgures per dIvIsIon
according to IFRS (in million USD) 2010 2009
Income statement
Turnover 186.2 193.5
EBITDA 53.7 50.6
Depreciations -48.2 -43.4
Operating result (EBIT) 5.5 7.2
Net financial result -17.5 -4.1
Share in the result of equity accounted investees
0.0 0.0
Result before tax -12.0 3.1
Tax -0.9 -5.7
Consolidated result after tax -12.9 -2.6
of which group share -12.9 -2.6
Cashflow 38.3 29.9
Balance sheet
Property plant and equipment 608.4 612.2
Financial debts 422.6 433.3
Personnel 614 647
of which seegoing 579 618
L p g
according to IFRS (in million USD) 2010 2009
Income statement
Turnover 111.6 103.1
EBITDA 120.1 67.9
Depreciations -27.1 -24.9
Operating result (EBIT) 93.0 43.0
Net financial result -38.0 7.9
Share in the result of equity accounted investees
0.0 0.0
Result before tax 55.0 50.9
Tax 0.0 0.0
Consolidated result after tax 55.0 50.9
of which group share 55.0 50.9
Cashflow 92.4 38.5
Balance sheet
Property plant and equipment 526.2 809.4
Financial debts 539.0 814.9
Personnel 310 380
of which seegoing 297 350
L n g
according to IFRS (in million USD) 2010 2009
Income statement
Turnover 61.8 59.8
EBITDA 1.8 2.2
Depreciations -12.1 -4.3
Operating result (EBIT) -10.3 -2.1
Net financial result -10.6 1.4
Share in the result of equity accounted investees
-1.1 -0.7
Result before tax -22.0 -1.4
Tax -0.3 -0.1
Consolidated result after tax -22.3 -1.5
of which group share -22.3 -1.5
Cashflow -7.6 -2.9
Balance sheet
Property plant and equipment 38.8 345.8
Financial debts 177.0 189.0
Personnel 151 150
of which seegoing 75 67
o f f s H o r e
according to IFRS (in million USD) 2010 2009
Income statement
Turnover 68.8 62.0
EBITDA 1.3 -1.1
Depreciations -2.1 -2.6
Operating result (EBIT) -0.8 -3.7
Net financial result -4.0 1.1
Share in the result of equity accounted investees
0.0 0.0
Result before tax -4.8 -2.6
Tax -0.6 -0.8
Consolidated result after tax -5.4 -3.4
of which group share -5.4 -3.4
Cashflow 3.9 -14.3
Balance sheet
Property plant and equipment 7.1 9.8
Financial debts 20.3 9.8
Personnel 499 246
of which seegoing 358 109
s e r v I C e s & H o L d I n g
3
COVER EXMAR A4 ENG.indd 3 28/04/11 16:01
ConsoLIdated Key fIgures
2010 2009
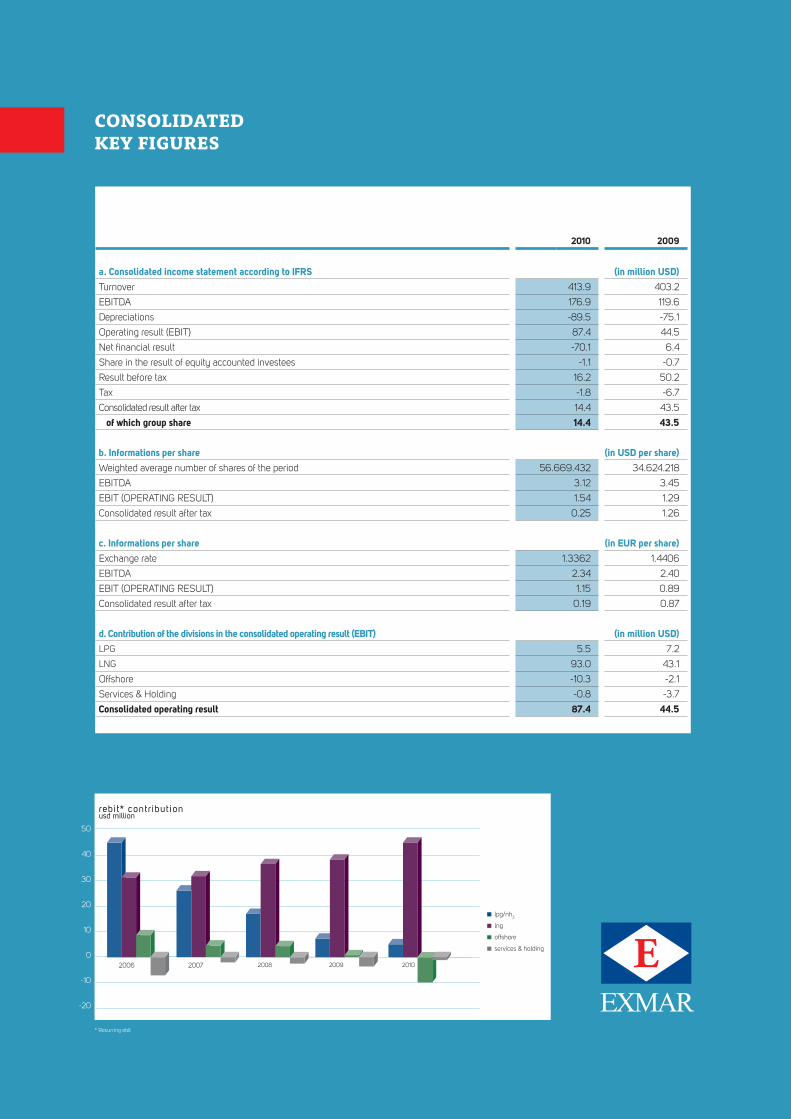
a. Consolidated income statement according to IFRS (in million USD)
Turnover 413.9 403.2
EBITDA 176.9 119.6
Depreciations -89.5 -75.1
Operating result (EBIT) 87.4 44.5
Net financial result -70.1 6.4
Share in the result of equity accounted investees -1.1 -0.7
Result before tax 16.2 50.2
Tax -1.8 -6.7
Consolidated result after tax 14.4 43.5
of which group share 14.4 43.5
b. Informations per share (in USD per share)
Weighted average number of shares of the period 56.669.432 34.624.218
EBITDA 3.12 3.45
EBIT (OPERATINg RESULT) 1.54 1.29
Consolidated result after tax 0.25 1.26
c. Informations per share (in EUR per share)
Exchange rate 1.3362 1.4406
EBITDA 2.34 2.40
EBIT (OPERATINg RESULT) 1.15 0.89
Consolidated result after tax 0.19 0.87
d. Contribution of the divisions in the consolidated operating result (EBIT) (in million USD)LPg 5.5 7.2
LNg 93.0 43.1
Offshore -10.3 -2.1
Services & Holding -0.8 -3.7
Consolidated operating result 87.4 44.5
50
40
30
20
10
0
-10
-20
rebit* contribut ionusd million
2009 2010 2006 2007 2008
lpg/nh3
lng
offshore
services & holding
* Recurring ebit
COVER EXMAR A4 ENG.indd 4 28/04/11 16:01

1mission statement
EXMAR, headquartered in Antwerp, is a diversified and independent industrial shipping group that serves the international oil and gas industry. This is achieved by providing ships for the transport of products and by performing studies or undertaking the management of commercial, technical or administrative activities.EXMAR strives to create Shareholder value over the long-term by balancing long and short-term agreements to counteract volatility in the freight market, combined with providing services that are tailored to the customer’s needs.EXMAR endeavours to support sustainable growth by attaching the greatest importance to the quality of its fleet, the safety of its personnel and equipment and the protection of the environment.
Mission statement
1
110381 EXMAR JAARVERSLAG BW ENG.indd 1 28/04/11 14:59

EXMAR Group: activitiesEXMAR is specialised in activities relating to the transport of gas, and in particular, the transport of
liquefied gases, such as LNG (Liquefied Natural Gas), LPG (Liquefied Petroleum Gas) and ammonia
(NH³). EXMAR Offshore focuses on selective projects where it can bring added value, such as the
provision of goods and services to the offshore oil and gas industry.
1 LPG/NH³ The LPG/NH³ division is active in the transport of liquid petroleum gas, butane, propane,
anhydrous ammonia and chemical gases, primarily with ships of the Midsize type (24,000 - 40,000 m³), VLGC’s (>80,000 m³) and pressurised vessels (3,500 – 5,000 m³).
The LPG/ NH³ segment has been the cornerstone of EXMAR’s development for more than 30 years. The EXMAR Group is operating and managing a fleet of about 30 vessels, which makes EXMAR an important participant in the world market.
EXMAR is servicing first-class international customers active in the fertiliser, clean energy fuel and petrochemical industries.
2 LNG The LNG Activities are focused on two main activities: LNG TRANSPORTATION (conventional
LNG carriers and LNG Regasification vessels) and LNG UP- and DOWNSTREAM. EXMAR has made substantial investments in the LNG shipping sector. EXMAR has pioneered the implementation of regasification technology (LNGRV), making possible the discharge of natural gas at sea without the need to call at a port or terminal. EXMAR aims to become an integrated service provider by expanding the scope of activities along the LNG value claim, both upstream and downstream
3 OffsHOre EXMAR has been active in the offshore industry for 25 years and as such has a high level
of knowledge and experience in the ownership, management and operation of floating systems. To date, the EXMAR group owns two accommodation barges and recently designed and constructed a semi-submersible production platform (OPTI-EX®) that will be sold mid 2011 over a five year transaction with seller’s credit.
EXMAR offshore also provides offshore services to third parties:• Design,engineeringandconsultancyserviceswithofficeslocatedinParisandHouston.• ManagementserviceswithanofficelocatedinAntwerpdedicatedtoprovidingMarineand
Integrated Risk Management services to offshore installations.
4 serVICes Apart from shipping and offshore activities, EXMAR provides specialised services. EXMAR shipmanagement is committed to providing high-quality ship management and
ancillary services to owners of gas carriers, oil tankers, bulk carriers, chemical carriers as well as floating units (storage & accommodation). EXMAR supports these clients in achieving the highest possible reliability for their vessels.
Other services offered by EXMAR include insurance brokerage (managed by its subsidiary Belgibo) and an in-house travel agency (Travel Plus).
2 activities
1 2 3 4
110381 EXMAR JAARVERSLAG BW ENG.indd 2 28/04/11 14:59

3chairman’s note
It is 2011, the financial crisis is behind us and EXMAR is back on course. The crisis naturally affected our sector badly, just like the entire economy. Nevertheless this did not stop us from looking ahead and continuing to invest in the future. After all, from experience we know how to brave the choppy waters, without risking great damage. Helmsmanship, we call it. In the past year we have delivered solid work and improved the financial basis of EXMAR.
The sale in October 2010 of a 50-50 participation in two LNG tanker vessels to Teekay (Excelsior and Excalibur) and the signing of a sale agreement of the OPTI-EX® semi-submersible platform to LLOG ensured a positive note. But even more important is that even when things were difficult, we remained true to one of our strongest values: ‘Leadership through innovation’. Innovation is the driving force behind our enterprise. It is a solid basis for us. It governs our thought and actions, and is reflected in a proactive market approach. We keep our finger on the pulse and always anticipate new developments. For instance in recent months we took the initiative amongst other things to further develop our LPG and LNGRV fleet. And we have created the leeway to research various projects and if possible to put them into practice. In the offshore market, for instance, thanks to the OPTI-EX® we have a unique expertise and a strong reputation.
We now want to realise them by developing innovative concepts in the same line. Innovation also means that we continually have to adapt to changing circumstances. In doing so EXMAR accepts its responsibility and is increasingly establishing itself as an ecologically and socially responsible partner. For our staff, who can rely worldwide on a healthy and safe work environment. For the environment, which we approach respectfully and considerately with an optimally-equipped fleet and strict observance of applicable standards. And for our shareholders, who see their trust in the course taken by EXMAR translated into definite added value. In other words, we are on the right track and remain, in spite of everything, trendsetting in innovation.
Baron Philippe BodsonChairman of the Board of Directors
Trendsetting in innovation
4
110381 EXMAR JAARVERSLAG BW ENG.indd 3 28/04/11 14:59

4 nog in te vullen
Highlights 2010
4
1
2
3
4
5
6
JANUARY 2010 1 Delivery of aNGeLa (LPG-3,500 m3)
FEBRUARY 2010 2 Delivery of aNNe (LPG-3,500 m3)
MARCH 2010 3 Transfer of the share of EXMAR (50% stake) in LNGRV eXPeDIeNT 4 and LNGRV eXeMPLar to Excelerate Energy L.P.
APRIL 2010 5 LNGRV eXPeDIeNT (151.015m³) delivered from DSME with EXMAR Shipmanagement retaining the management 6 LNGRV eXPLOrer commenced 2nd season at Mina Al Ahmadi Gasport™ in Kuwait
highlights
110381 EXMAR JAARVERSLAG BW ENG.indd 4 28/04/11 14:59
5nog in te vullen
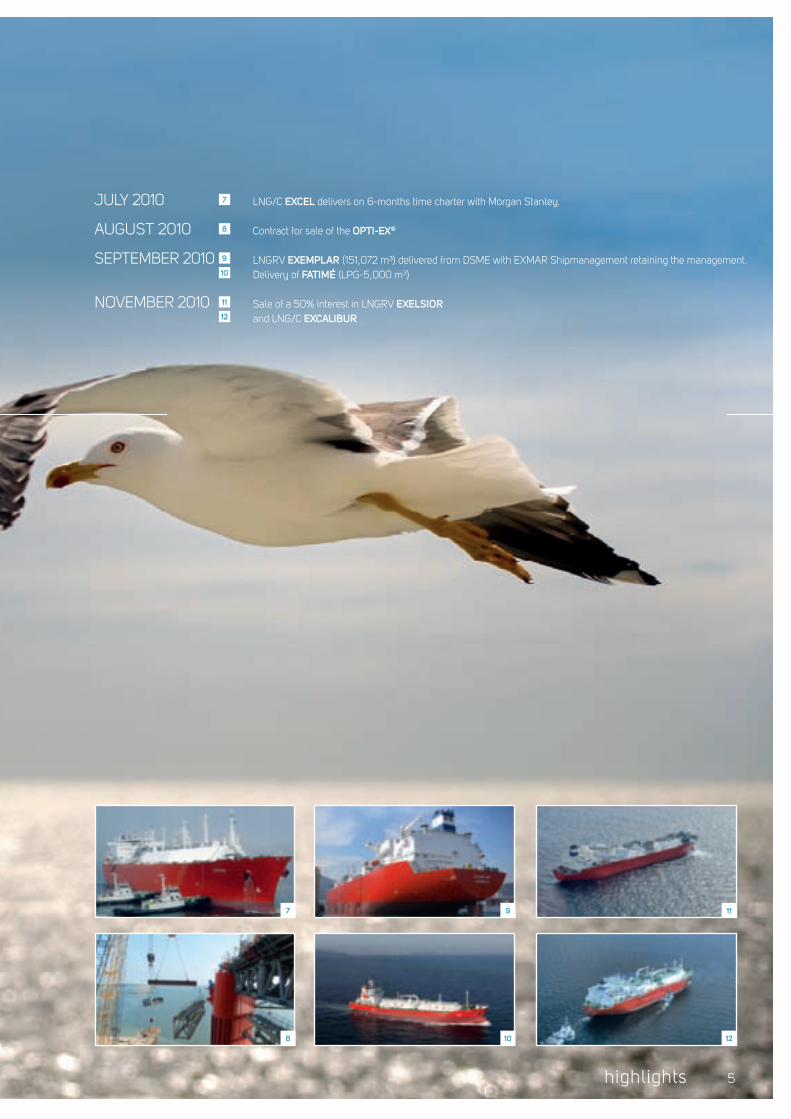
JULY 2010 7 LNG/C eXCeL delivers on 6-months time charter with Morgan Stanley.
AUGUST 2010 8 Contract for sale of the OPTI-eX®
SEPTEMBER 2010 9 LNGRV eXeMPLar (151,072 m³) delivered from DSME with EXMAR Shipmanagement retaining the management. 10 Delivery of faTIMÉ (LPG-5,000 m3)
NOVEMBER 2010 11 Sale of a 50% interest in LNGRV eXeLsIOr 12 and LNG/C eXCaLIBur
5
7
8
9
10
11
12
highlights
110381 EXMAR JAARVERSLAG BW ENG.indd 5 28/04/11 14:59

6 EXMAR in the world
EXMAR in the world
5
3
11
68
4 1
12
110381 EXMAR JAARVERSLAG BW ENG.indd 6 28/04/11 14:59

7EXMAR in the world
7
9
2
10
1 Antwerp headquarter
2 Hong Kong Offshore
3 Houston Design and Engineering
4 London LNG
5 Limassol Shipmanagement/offshore services
6 Luxembourg Operations and Maintenance offshore
units
7 Mumbai Crewing
8 Paris Offshore Design and Engineering
9 Singapore Marine Services
Branches: 10 Shanghai Business Development and Yard
Supervision
11 Luanda Offshore Marine Operations and Business
Development
12 Tripoli Offshore Marine Operations and Business
Development
110381 EXMAR JAARVERSLAG BW ENG.indd 7 28/04/11 14:59

8 nog in te vullen
LPG, NH³ & Petchem
Focus on long term value creation
The safe transportation of liquid petroleum gas, ammonia and other
petro-chemical gases is EXMAR’s core business. Despite the rise in
other segments, we remain firmly focused on the development of
new LPG initiatives which will deliver added value to the Group in the
long term.
8
110381 EXMAR JAARVERSLAG BW ENG.indd 8 28/04/11 15:00
9nog in te vullen 9
LPG, NH³ & Petchem
Focus on long term value creation
110381 EXMAR JAARVERSLAG BW ENG.indd 9 28/04/11 15:00

10
vessel type m3 year built class flag status
VLGC
Flanders Harmony fr 85,826 1993 LR Belgium owned
Flanders Loyalty fr 84,601 2008 BV Belgium owned
Flanders Liberty fr 84,529 2007 BV Belgium owned
Flanders Tenacity fr 84,270 1996 DNV Hong Kong owned
Total 339,226
TOTaL VLGC 4 339,226
MIDsIZe (LPG / ammonia / Petrochemical Gases)
Touraine fr 39,270 1996 BV Hong Kong joint venture
Eupen fr 38,961 1999 LR Belgium owned
Libramont fr 38,455 2006 DNV Belgium owned
Bw Sombeke fr 38,447 2006 DNV Bahamas joint venture
Elversele fr 37,511 1996 DNV Belgium owned
Eeklo fr 37,450 1995 DNV Belgium owned
Brussels fr 35,454 1997 LR Belgium owned
Berlian Ekuator fr 35,437 2004 NKK Panama time chartered
Brugge Venture fr 35,418 1997 LR Hong Kong joint venture
Antwerpen fr 35,223 2005 LR Hong Kong time chartered
Donau sr 30,207 1985 BV Belgium owned
Chaconia fr 28,070 1990 LR Belgium owned
Courcheville fr 28,006 1989 LR Belgium owned
Henley Bridge fr 27,980 1989 LR Bahamas time chartered
Gent fr 25,005 1985 LR Belgium owned
Total 510,894
Total Owned 9 299,119
Total Joint venture 3 113,135
Total Time Chartered 3 98,640
Total Midsize 15 510,894
semi-refrigerated (LPG / ammonia / Petrochemical Gases)
Kemira Gas sr 12,030 1995 DNV Belgium owned
Total semi-refrigerated 1 12,030
Pressurised (LPG / Petrochemical Gases)
Sabrina pr 5,019 2009 NK Hong Kong joint venture
Helane pr 5,018 2009 NK Hong Kong joint venture
Fatimé pr 5,018 2010 NK Hong Kong joint venture
Elisabeth pr 3,542 2009 NK Hong Kong joint venture
Magdalena pr 3,541 2008 BV Hong Kong joint venture
Anne pr 3,541 2010 NK Hong Kong joint venture
Angela pr 3,540 2010 NK Hong Kong joint venture
Joan pr 3,540 2009 NK Hong Kong joint venture
Marianne pr 3,539 2009 NK Hong Kong joint venture
Debbie pr 3,518 2009 NK Hong Kong joint venture
Total 10 39,816
FLEETLIST 201131 March 2011
10
110381 EXMAR JAARVERSLAG BW ENG.indd 10 28/04/11 15:00
11
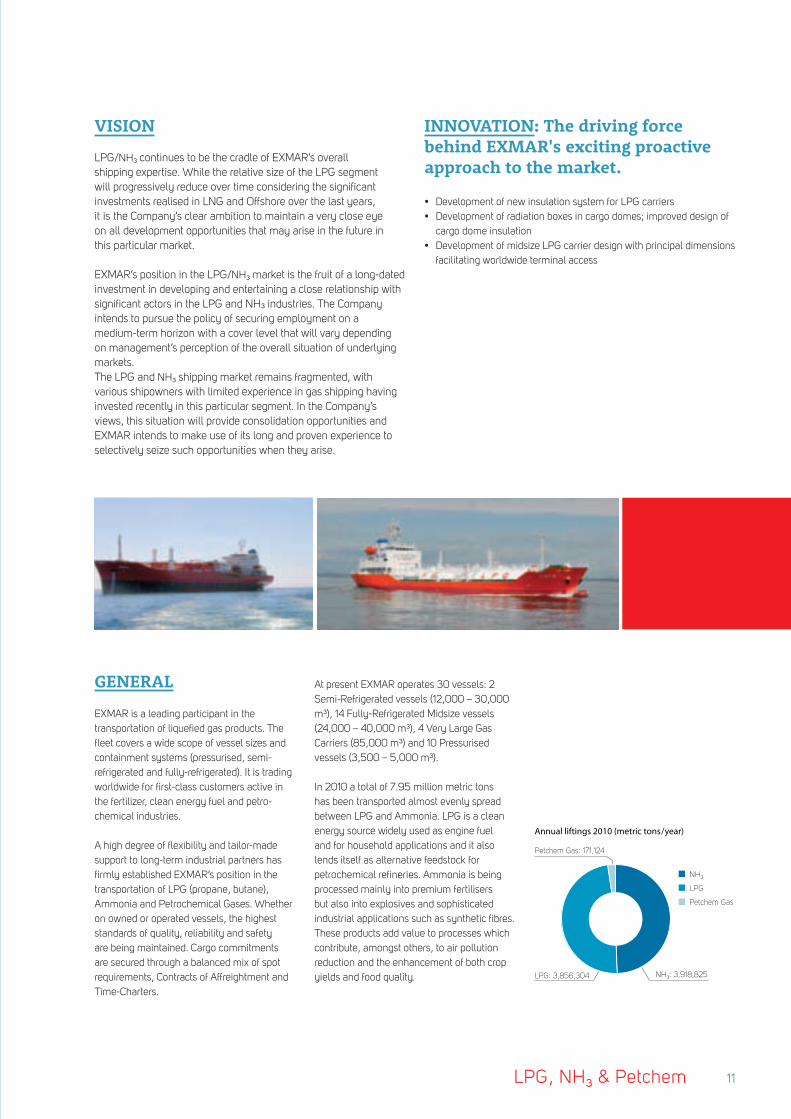
GENERAL
EXMAR is a leading participant in the transportation of liquefied gas products. The fleet covers a wide scope of vessel sizes and containment systems (pressurised, semi-refrigerated and fully-refrigerated). It is trading worldwide for first-class customers active in the fertilizer, clean energy fuel and petro-chemical industries.
A high degree of flexibility and tailor-made support to long-term industrial partners has firmly established EXMAR’s position in the transportation of LPG (propane, butane), Ammonia and Petrochemical Gases. Whether on owned or operated vessels, the highest standards of quality, reliability and safety are being maintained. Cargo commitments are secured through a balanced mix of spot requirements, Contracts of Affreightment and Time-Charters.
At present EXMAR operates 30 vessels: 2 Semi-Refrigerated vessels (12,000 – 30,000 m³), 14 Fully-Refrigerated Midsize vessels (24,000 – 40,000 m³), 4 Very Large Gas Carriers (85,000 m³) and 10 Pressurised vessels (3,500 – 5,000 m³).
In 2010 a total of 7.95 million metric tons has been transported almost evenly spread between LPG and Ammonia. LPG is a clean energy source widely used as engine fuel and for household applications and it also lends itself as alternative feedstock for petrochemical refineries. Ammonia is being processed mainly into premium fertilisers but also into explosives and sophisticated industrial applications such as synthetic fibres. These products add value to processes which contribute, amongst others, to air pollution reduction and the enhancement of both crop yields and food quality.
Annual liftings 2010 (metric tons/year)
NH³LPG
Petchem Gas
NH³: 3,918,825
Petchem Gas: 171,124
LPG: 3,856,304
VISION
LPG/NH³ continues to be the cradle of EXMAR’s overall shipping expertise. While the relative size of the LPG segment will progressively reduce over time considering the significant investments realised in LNG and Offshore over the last years, it is the Company’s clear ambition to maintain a very close eye on all development opportunities that may arise in the future in this particular market.
EXMAR’s position in the LPG/NH³ market is the fruit of a long-dated investment in developing and entertaining a close relationship with significant actors in the LPG and NH³ industries. The Company intends to pursue the policy of securing employment on a medium-term horizon with a cover level that will vary depending on management’s perception of the overall situation of underlying markets.The LPG and NH³ shipping market remains fragmented, with various shipowners with limited experience in gas shipping having invested recently in this particular segment. In the Company’s views, this situation will provide consolidation opportunities and EXMAR intends to make use of its long and proven experience to selectively seize such opportunities when they arise.
INNOVATION: The driving force behind EXMAR's exciting proactive approach to the market.
• DevelopmentofnewinsulationsystemforLPGcarriers• Developmentofradiationboxesincargodomes;improveddesignof
cargo dome insulation• DevelopmentofmidsizeLPGcarrierdesignwithprincipaldimensions
facilitating worldwide terminal access
LPG, NH³ & Petchem
110381 EXMAR JAARVERSLAG BW ENG.indd 11 28/04/11 15:00

Cargo commitments are secured through a balanced mix of spot requirements, Contracts of Affreightment and Time-Charters.EXMAR has been able to secure an appreciable contract portfolio with first-class customers (Itochu, Koch Industries, Petronas, StatoilHydro, Mitsubishi Corporation,…).
LPG/NH³-vessels: Overview of the contractual commitments
vessel 1H 10 2H 10 1H 11 2H 11 1H 12 2H 12 --- 2H 15 1H 16 2H 16 1H 17 2H 17
MID
sIZ
e
Touraine
Eupen
Libramont
BW Sombeke
Elversele
Eeklo
Brussels
Berlian Ekuator COA
Brugge Venture
Antwerpen
Donau
Chaconia
Courcheville
Gent
Henley Bridge
seMI-refr Kemira Gas
VLG
C Flanders Loyalty
Flanders Liberty
Flanders Harmony
Flanders Tenacity
Pr
ess
ur
IseD
Magdalena / 3,500 m3
Sabrina / 5,000 m3
Elisabeth / 3,500 m3
Debbie / 3,500 m3
Joan / 3,500 m3
Helane / 5,000 m3
Marianne / 3,500 m3
Angela / 3,500 m3
Anne / 3,500 m3
Fatimé / 5,000 m3
= fixed = committed to COA = open / spot = option
12
110381 EXMAR JAARVERSLAG BW ENG.indd 12 28/04/11 15:00
13
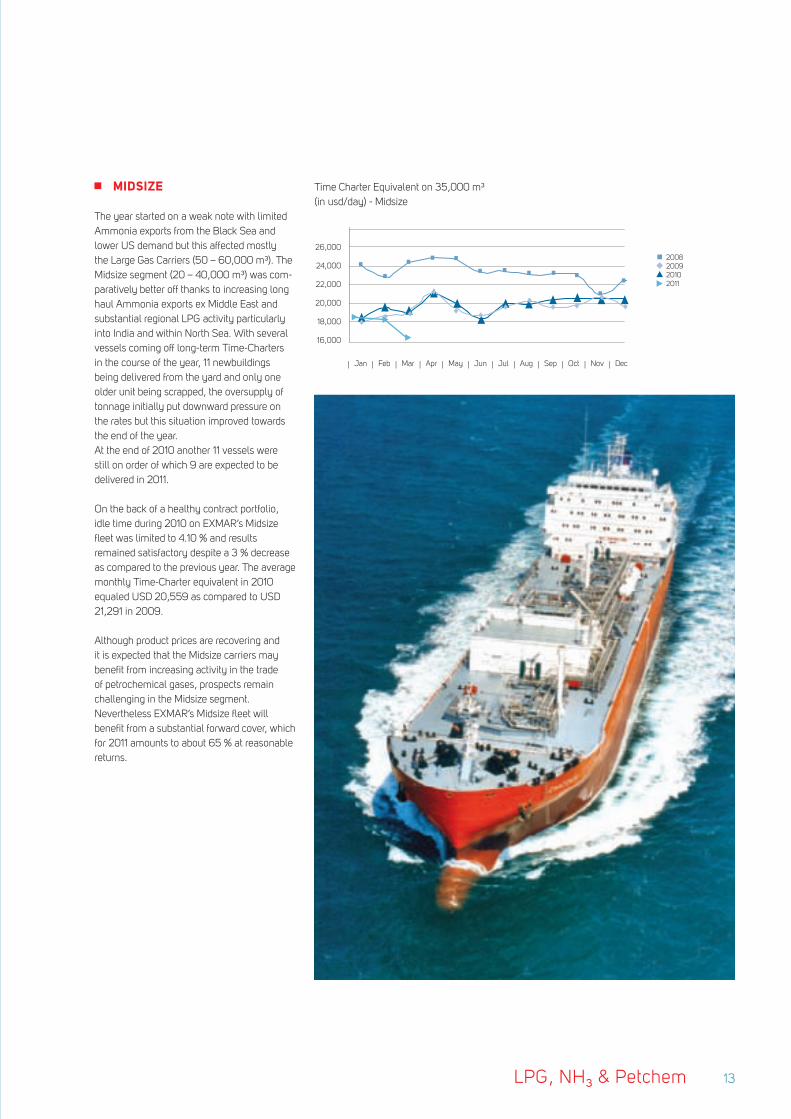
MIDSIZE
The year started on a weak note with limited Ammonia exports from the Black Sea and lower US demand but this affected mostly the Large Gas Carriers (50 – 60,000 m³). The Midsize segment (20 – 40,000 m³) was com-paratively better off thanks to increasing long haul Ammonia exports ex Middle East and substantial regional LPG activity particularly into India and within North Sea. With several vessels coming off long-term Time-Charters in the course of the year, 11 newbuildings being delivered from the yard and only one older unit being scrapped, the oversupply of tonnage initially put downward pressure on the rates but this situation improved towards the end of the year. At the end of 2010 another 11 vessels were still on order of which 9 are expected to be delivered in 2011.
On the back of a healthy contract portfolio, idle time during 2010 on EXMAR’s Midsize fleet was limited to 4.10 % and results remained satisfactory despite a 3 % decrease as compared to the previous year. The average monthly Time-Charter equivalent in 2010 equaled USD 20,559 as compared to USD 21,291 in 2009.
Although product prices are recovering and it is expected that the Midsize carriers may benefit from increasing activity in the trade of petrochemical gases, prospects remain challenging in the Midsize segment. Nevertheless EXMAR’s Midsize fleet will benefit from a substantial forward cover, which for 2011 amounts to about 65 % at reasonable returns.
Time Charter Equivalent on 35,000 m³ (in usd/day) - Midsize
2008200920102011
26,000
24,000
22,000
20,000
18,000
16,000
| Jan | Feb | Mar | Apr | May | Jun | Jul | Aug | Sep | Oct | Nov | Dec
LPG, NH³ & Petchem
110381 EXMAR JAARVERSLAG BW ENG.indd 13 28/04/11 15:00

14
VLGC
The market remained at low levels for the first two months of the year, then increased thereafter to soften again in the summer months. Thanks to new Middle East export tonnes, a second run in rates started after the summer but the latter still proved to be fragile as the year ended with somewhat lower rates.The average Baltic Freight Index (benchmark for a standard VLGC voyage ex-AG to Japan) increased by about 40 % as compared to the year before. As related bunker expenses only went up by about 4 %, it resulted in overall improved spot freight earnings on a modern vessel.
The growth in LPG trade remained insufficient to employ the fleet which still suffered from a capacity overhang (9 newbuildings were delivered against only 6 VLGC that were scrapped). The latter even caused 4 vessels to be put in lay up for most of the year awaiting market improvement. At the end of the year 10 VGLC ships were still on order of which 3 are expected to enter the market in 2011.
EXMAR’s efforts to allocate part of its fleet to project related Time-Charter employment proved beneficial and resulted in a slight improvement of revenues compared to the year before. Prospects are positive as the present ton-nage surplus is likely to be absorbed by the anticipated growth in Middle East LPG export volumes during 2011.About 47 % cover has been secured for EXMAR’s VLGC fleet during 2011 at satisfacto-rily fixed levels.
PRESSURISED
During 2010 EXMAR took delivery of the final 3 pressurised vessels out of a series of 10 vessels ordered in Joint Venture with Wah Kwong. I.e.: aNGeLa – 3,500 m³, aNNe – 3,500 m³ and faTIMÉ– 5,000 m³. After having successfully traded petrochemical spot cargoes these vessels gradually entered into Time-Charters with first class charterers such as Mitsui, Statoil and Vitol.
By so doing EXMAR’s entire fleet was benefit-ting from steady Time-Charter revenues prior to year-end. For 2011 about 78% cover has been secured and further efforts are being made to develop dedicated Time-Charter op-portunities. Trading patterns range from LPG in South East Asia and North West Europe as well as Petrochemical Gases in Asia.
LPG, NH³ & Petchem
Time Charter Equivalent on 3,000 – 5,000 m³ (in usd/day) - PressurIseD TCe
9,000
8,000
7,000
6,000
5,000
4,000
3,000
| Jan | Feb | Mar | Apr | May | Jun | Jul | Aug | Sep | Oct | Nov | Dec | Jan | Feb | Mar
3500 cbm5000 cbm
20,000
17,500
15,000
12,500
10,000
| Jan | Feb | Mar | Apr | May | Jun | Jul | Aug | Sep | Oct | Nov | Dec
200920102 0 1 1
Time Charter Equivalent on 85,000 m³ (in usd/day) - VLGC
110381 EXMAR JAARVERSLAG BW ENG.indd 14 28/04/11 15:00

15
110381 EXMAR JAARVERSLAG BW ENG.indd 15 28/04/11 15:00

16 nog in te vullen
LNG, LNGRV
Our fleet meets the highest standards
The transport of liquid natural gas performs well in the market. As
one of the pioneers in this sector EXMAR invests widely in the
expansion of a modern fleet which meets the highest
requirements. With new gasification and storage technologies and
a customer-oriented approach, we are more than ever able to
deliver a one-stop solution.
16
110381 EXMAR JAARVERSLAG BW ENG.indd 16 28/04/11 15:00

17nog in te vullen 17
LNG, LNGRV
Our fleet meets the highest standards
110381 EXMAR JAARVERSLAG BW ENG.indd 17 28/04/11 15:00

nog in te vullen
vessel type m3 year built class flag status
LNG
Express lngrv 151.116 2009 BV Belgium joint venture
Explorer lngrv 150.981 2008 BV Belgium joint venture
Excel lng 138.107 2003 BV Belgium joint venture
Excelsior lngrv 138.087 2005 BV Belgium joint venture
Excelerate lngrv 138.074 2006 BV Belgium joint venture
Excalibur lng 138.034 2002 BV Belgium joint venture
Total 854.399
under Management
Exquisite lngrv 151.017 2009 BV Belgium managed
Expedient lngrv 151.015 2010 BV Belgium managed
Exemplar lngrv 151.072 2010 BV Belgium managed
Excellence lngrv 138.120 2005 BV Belgium managed
Methania lng 131.235 1978 LR Belgium managed
Total 722.459
Total Joint venture 6 854.399
Total under Management 5 722.459
Total LNG 11 1.576.858
LNG-vessels: Overview of the contractual commitments
vessel type capacity
(m3)
ownership charter expiry 2011 2012 2032 2033 2034 2035(+ options)
Excalibur lng/c 138,000 50% Mar-22 -
Excel lng/c 138,000 50% Mar-12 (+3m) -
Excelsior lngrv 138,000 50% Jan-25 (+5j, +5j) -
Excelerate lngrv 138,000 50% Oct-26 (+5j, +5j) -
Explorer lngrv 150,900 50% Apr-33 (+5j) -
Express lngrv 150,900 50% May-34 (+5j) -
Chartered Minimum revenue undertaking from third party Extension (optional)
18
FLEETLIST 201131 March 2011
110381 EXMAR JAARVERSLAG BW ENG.indd 18 28/04/11 15:00

19LNG, LNGRV
GENERAL
LNG TRANSPORTATION
EXMAR is one of the world’s leading indepen-dent owner and operator of LNG regasification vessel. Over the last 35 years EXMAR has been active and improving the LNG industry and has made substantial technological ad-vances in shortening the traditional LNG value chain to bring Natural Gas in a flexible way to rapidly developing parts of the world. EXMAR
was the first company to order and build a LNG Regasification Vessel (LNGRV) with delivery in 2005 – the eXCeLsIOr – and has consequently build up significant knowledge and experience in the ownership, manage-ment and operations of regasification vessels around the world. EXMAR subsequently developed Ship-to-Ship transfer technology via flexible hoses in order to transfer LNG from one vessel to another.The current fleet consists of 11 LNG carriers out of which eight are currently fitted with EXMAR’s regasification installation.
One LNG tanker, MeTHaNIa is owned by Distrigas, and four LNGRV vessels, eXCeLLeNCe, eXQuIsITe, eXPeDIeNT and eXeMPLar are owned by Excelerate Energy L.P., but all five vessels are managed by the EXMAR Group on their behalf.At the end of March 2011, all our vessels were employed on time-charters. Most of them being on long – term charters to Excelerate Energy L.P. The LNG/C eXCeL was successfully renewed on a time-Charter to Morgan Stanley for a period of one year, until March 2012.
VISION
EXMAR continues to focus on the additional transportation needs of the LNG industry worldwide. Our vision is to continue to grow our business at competitive returns while remaining committed to deliver prime operational services to the LNG Industry as well as entering into additional medium or long-term, fixed-rate LNG carrier or FSRU time charters. The process of obtaining new long-term time charters is highly competitive and generally involves an inten-sive screening and bidding process which often extends for several months. LNG carrier time charters contracts are awarded based upon a variety of factors relating to the vessel operator, including:
• Shippingindustryrelationshipsandreputationforcustomerserviceandsafety;
• LNGshippingandFSRUexperienceandqualityofoperations(includingcosteffectiveness);
• Qualityandexperienceofseafaringcrew;• AbilitytodelivertheLNGcarrierorFSRUwithinthetimeandcostframerequired;
• Willingnesstoacceptoperationalriskspursuanttothecharter;and• Competitivenessofthebidintermsofoverallprice.
In our shipping operations we intend to expand our relationship with existing customers and continue to develop new relationships. We aim to higher margins through maintaining strong service based relationship combined with flexible and innovative LNG shipping solutions. We also seek long-term employment for new LNG / FSRU carriers within integrated projects we might be involved in and will look to participate in LNG / FSRU shipping opportunities to maximize the utilisation and returns of our fleet.
INNOVATION: The driving force behind EXMAR's exciting proactive approach to the market.
• DevelopmentofmarineregasificationplantonboardLNGcarrier• DevelopmentofreinforcedLNGcargocontainmentsystemfor
offshore unloading operations• DevelopmentofLNGcarrierbuoymooringsystemforhighpressure
natural gas offloading• DeliveryofthefirstLNGregasificationvesselExcelsiorin2005by
DSME, South-Korea • DevelopmentandintroductionofLNGShip–to–Shipcargotransfer
operations, from concept design to industry acceptance• AdditionofexhaustgasNOxreductionsystemonboardLNG
regasification vessels• FirstapplicationofnewsLNGc® cargo containment system with
increasedcargotankpressurerating;facilitatingregasificationandSTS operations
• DevelopmentofLNGliquefactionshipsinthereclamationofnewgassources, concept and design
110381 EXMAR JAARVERSLAG BW ENG.indd 19 28/04/11 15:00

20 LNG, LNGRV
LNG HIGHLIGHTS
In March eXCeLsIOr carried out the first of scheduled drydock of the LNGRV’s lasting 3 weeks. This was followed by eXCeLeraTe in April for a similar period.
LNG/C eXCeL redelivered from a short-term time charter with Statoil of Norway. At that time the market was very weak and idle time was incurred until a further 6-month’s time charter was obtained until early 2011 however at a low rate. This was extended in November for a further period of one year with effect from March 2011 at an increased rate.
Following drydock, eXCeLsIOr was positioned again in Bahia Blanca, Argentine, relieving eXCeLLeNCe, to commence the 3rd season as a Gasport. Operations continued throughout the balance of the year owing to increased demand.
The fourth of a series of five 150,900m³ LNGRV’s, eXPeDIeNT, was delivered in April from DSME. Although the ownership structure was changed the management of the ship remains with EXMAR Shipmanagement.
In May eXPLOrer commenced the second season at Mina Al Ahmadi Gasport™ in Kuwait and continued working at full capacity to assist with high demand for power ashore owing to extreme summer temperatures until October.
The fifth and final of the series of 150,900m³ LNGRV’s, eXeMPLar, was delivered to Excelerate Energy from DSME in September. The management of the ship remains with EXMAR Shipmanagement.
With all LNGRV’s plus eXCaLIBur in full operation during 2011 results will be as predicted, affected by the exposure of eXCeL to a continuing weak spot market.
LIQUEFACTION AND REGASIFICATION
EXMAR has the ambition to become a one-stop tailor made shop for floating liquefaction, LNG transport and floating regasification.
UPSTREAMEXMAR is further developing the floating liquefaction technology in order to monetise more difficult, smaller and remote gas fields. EXMAR offers the potential to unlock offshore gas reserves by means of easily deployable floating liquefaction units which eliminate the need to invest in capital-intensive pipeline infrastructure to bring the gas to fixed onshore facilities.
To advance its efforts in the development of floating liquefaction, EXMAR formalised a strategic alliance in November 2008 with its long-time LNG partner, Excelerate Energy, and Black & Veatch (USA), a proven provider of natural gas processing and liquefaction technology. This partnership forms a solid basis for the further successful development of floating liquefaction storage and offloading solutions. EXMAR is actively looking for partnerships with natural gas companies interested in smaller scale floating liquefaction projects.
EXMAR is mainly focusing on small scale projects with benign weather conditions, certified gas reserves and a lean gas quality. EXMAR is currently conducting a Front-End Engineering & Design (FEED) study with a natural gas producer for such a floating liquefaction project. The partners are targeting a Final Investment Decision (FID) in 2011.
DOWNSTREAMIn June 2010 EXMAR and its Consortium was selected as Preferred Bidder by the Petroleum Corporation of Jamaica (PCJ).
The Government of Jamaica (GOJ) began investigating the possibility of introducing natural gas as an alternative fuel in 2001. The objectives of the project are to decrease the dependence on imported oil and oil derivatives, lower energy costs and utilise a more environmentally friendly fuel option.
In April 2007, the PCJ issued a worldwide InvitationtoPre-Qualifyfortheprovisionofan LNG Floating Storage and Regasification Unit (FSRU) for Jamaica. On 12 November 2009 PCJ issued a Request For Proposal (RFP) for the financing, development, ownership and operation of an FSRU LNG Regasification Terminal and Natural Gas Transportation System to nine international companies. In response to the RFP, EXMAR and its consortium submitted a proposal on 15 February 2010. EXMAR formed a consortium with Promigas, the Colombian pipeline operator to answer the RFP and with a Jamaican company called CLNG for local assistance. Within the terms of the collaboration, EXMAR will be responsible for the financing, development, ownership and operation of the FSRU LNG Regasification terminal and Promigas will be responsible for the Natural Gas Transportation System.
After review by an Evaluation Committee, established by the Jamaican LNG steering committee, the EXMAR Consortium was selected as Preferred Bidder. The negotiations between the Preferred Bidder and PCJ are still continuing.
In addition, EXMAR is currently conducting several LNG regasification feasibility studies in different parts of the world. Furthermore EXMAR is also participating in specific FSRU tenders on a case by case basis.
110381 EXMAR JAARVERSLAG BW ENG.indd 20 28/04/11 15:00

21
110381 EXMAR JAARVERSLAG BW ENG.indd 21 28/04/11 15:00

22 nog in te vullen
OFFSHORE
We keep exploring new horizons
Over a twenty-five period, EXMAR has acquired a wealth of
experience in the design and development of offshore projects.
We have earned an excellent reputation with the semi-submersible
production platform OPTI-EX®. We are now using this offshore
expertise to explore new horizons.
22
110381 EXMAR JAARVERSLAG BW ENG.indd 22 28/04/11 15:00

23nog in te vullen 23
OFFSHORE
We keep exploring new horizons
110381 EXMAR JAARVERSLAG BW ENG.indd 23 28/04/11 15:00

unit type year built class flag status
OffsHOre
aCCOMMODaTION / WOrK BarGes
KISSAMAAccommodation
Barge 300 2003/2010 BV Liberian owned
NUNCEAccommodation
Barge 450 2009 ABS Liberian joint venture
Total 750 POB
Total Owned 1 300 POB
Total Joint Venture 1 450 POB
Total BarGes 2 750 POB
seMIsuBMersIBLes
OPTI-EX® (Samsung-Kiewit) Semi-SubmersibleProduction platform
60.000 BOPD 2009 ABS Liberian owned50 MMscfd
Total semisubmersibles 160.000 BOPD
50 MMscfd
NaMe CLIeNT TYPe Of serVICe
Girassol FPSO Total Angola Marine Operations and maintenance, Pilotage
Dalia FPSO Total Angola Marine Operations and maintenance, Pilotage
Farwah FPSO Mabruk Marine Operations and maintenance, Pilotage
Kissama Open Marine Operations and maintenance
Nunce Sonangol Marine Operations and maintenance
OPTI-EX® Exmar / LLOG Final Outffitings for operations
Remora Hi-Load Remora Consultancy and Ad-Hoc support for DP system
FSRU OLT Familiarisation and training for future Marine Operations and
maintenance
Current operation + maintenance contracts are:
24
FLEETLIST 201131 March 2011
110381 EXMAR JAARVERSLAG BW ENG.indd 24 28/04/11 15:01

25offshore
INNOVATION: The driving force behind EXMAR's exciting proactive approach to the market.
• DeploymentofOPTI-eX® semi-submersible production platform with optimized hull design providing reduced motions in challenging offshore environments. This represents the first deployment of this new hull design.
• Capitalisingonthisoutstandingachievement,EXMAROffshoreiscurrently developing new concepts starting from its proprietary ring pontoon design. New designs based on the OPTI® hull series include larger units and a dry-tree application.
• Utilisingexistingdrillingsemisubmersibledesignsasplatformsfordeepwater well service and intervention, and as tender assist.
• Additionofawellserviceandintervention(WSIV)semisubmersibleto the design portfolio.
• NewinnovativesoftwarecomprisingtheEXMARDesignSuitecontinues to be developed, saving time without loss of accuracy.
VISION
EXMAR continues to focus on selective projects where it can bring added value, by the provision of goods and services to the offshore oil and gas industry. Assets include floating production and floating accommodations units. While EXMAR provides services to an extensive list of clients worldwide, EXMAR has offices serving regional offshore customers in the Gulf of Mexico and West & North Africa.
To maintain this particular goal, EXMAR is focusing on the following strategy:
• Ownassetsthatareofhighspecificationandoperatethemaccording to sound management principles and priorities such as safety, efficiency and minimal environmental impact.
• Acquireassetswithalong-termviewofemploymentandrede-ployment which means assets that are not only well-designed and well-constructed but are technically generic and flexible.
• Utilisetheexperienceandexpertiseofastrongengineeringandtechnical group to develop innovative and commercially viable floating solutions for the offshore market.
• FocusonprojectswheretheexpertiseinLNG/LPGshipping,drilling, gas handling, project management and newbuild construction provides a competitive edge.
New initiatives and projects requiring a strong technical capability combined with decades of offshore experience in exploration and production will continue to define EXMAR’s offshore group.
OPTI-EX®
WSIV
110381 EXMAR JAARVERSLAG BW ENG.indd 25 28/04/11 15:01
26 offshore
GENERAL
With the support of strong engineering teams in Antwerp, Houston and Paris, EXMAR has been able to deliver assets and services to its customers that are creative, innovative and practical. Regional offices in Houston, Luanda and Tripoli continue to provide direct service to EXMAR’s customers and are instrumental in identifying new opportunities in these regions.
ASSET AND PROJECT MANAGEMENT
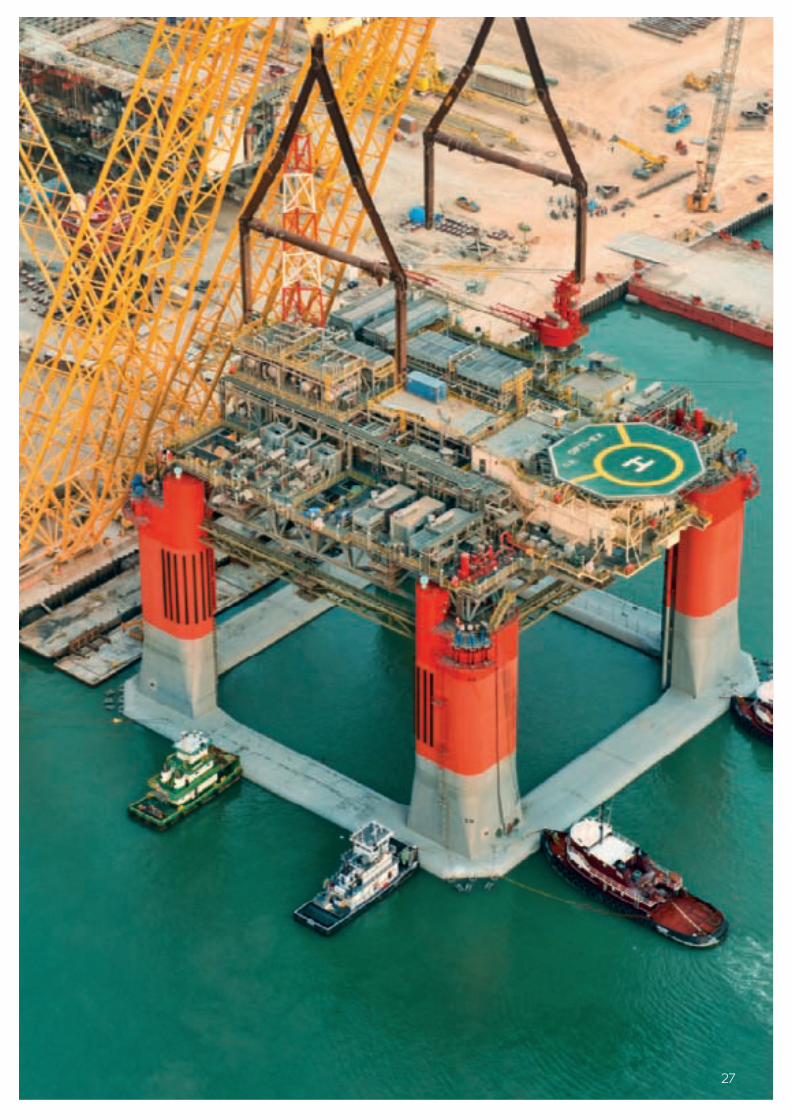
OPTI-EX®
The contract for the sale of the OPTI-eX® to LLOG of Covington, Louisiana, was signed on 31 August 2010.
This contract requires EXMAR to perform engineering, modifications and operations services to the unit in order to prepare for deployment in 3,200 ft water depth to the Who Dat! field in Mississippi Canyon 547 in the Gulf of Mexico. While the modifications were not extensive the schedule to deployment requires the unit to be ready for sail-away by the end of May 2011 in advance of the 2011 Gulf of Mexico hurricane season.
The broad scope of services required by LLOG is provided by EXMAR Offshore Company in Houston which has been responsible for design and project management of the OPTI-EX® project.
A critical milestone to ensure prompt delivery planned at the end of May is to obtain Regulatory Approval status from various regulatory bodies. So far, all applications and reviews are progressing as anticipated and there is no reason to believe that delivery of the platform could be delayed due to regulatory approval reasons.
BARGES
KissamaThe KISSAMA (300 persons on board (pob) capacity) has undergone a major refurbishment and dry-dock end 2009 and beginning 2010 and was then chartered to ENI Oil in Congo for a short term contract that terminated in March 2011. Longer-term employment opportunities are currently analysed, mainly in West Africa where the unit is located.
NunceA 450 pob accommodation barge built in 2009, owned in joint venture with an Angolan partner, and in service to Sonangol under the terms of a ten-year contract.
BEXCOEXMAR has a 26% stake in Bexco, a Belgian company specialised in the development, fabrication and marketing of ropes for marine and offshore applications.
DESIGN, ENGINEERING AND CONSULTANCY
EOC & DVOEXMAR Offshore Company (EOC – Houston) provides engineering, design, construction supervision, project management and consul-tancy for operators, contractors and shipyards. EOC is responsible for the customization and modification work and operations performed on the OPTI-eX® for the Who Dat! field. EOC will be responsible for obtaining the regulatory approvals for the unit and is scheduled to deliver the OPTI-eX® to LLOG at a location one mile from the production site by May 2011. While the EXMAR group projects account for a large share of the work performed by EOC, the majority of EOC work completed on an annual basis is done for drilling contractors. In 2010, work performed by EOC for third parties included companies such as LLOG Exploration, Noble Drilling, Japan Drilling Company, Worley Parsons, Helix Offshore Services, ATP Oil and Gas, Pacific Drilling, Excelerate Energy, etc.
DVO consultancy work focuses mainly on naval architecture and marine engineering on the one hand and construction management for oil tanker terminals on the other. In addition, DVO is involved in studies for FSO's and accommodation barge projects for the EXMAR group. Over the years, DVO has developed and maintained a very close relationship with TOTAL.
OPERATION AND MAINTENANCE
Franship Offshore (FSO) and EXMAR Offshore Services (EOS) are the entities within the EXMAR Group which offer operations and maintenance services for offshore installations, both within the EXMAR Group and to third parties. These services are provided out of local offices in Luanda, Livorno and Tripoli. The policy is to ensure a maximum of sustainable local content and at the same time providing to customers the assurance of the EXMAR management systems. The implementation of strategic alliances with local stakeholders is recognised as of increasing importance for future development. The EOS focus is on integrated Offshore Terminal management, capitalising on the marine expertise of the EXMAR Group. Core competencies include all aspects of offshore mooring and cargo transfer, oil as well as gas (LPG/LNG). A local consortium with EOS as majority shareholder has been retained in 2010 by Owners OLT for the management of the offshore terminal FSRU Toscana to be installed off the Italian coast.
110381 EXMAR JAARVERSLAG BW ENG.indd 26 28/04/11 15:01
27
110381 EXMAR JAARVERSLAG BW ENG.indd 27 28/04/11 15:01

28 nog in te vullen
SERVICES & HOLDING
We have a global view on our business
28
EXMAR is at home in many markets. Our shipping and offshore
activities are accompanied by a full package of supporting services.
Customers entrust us with the technical management of ships and the
assembly of a professional crew. We act as insurance brokers, and
even have our own travel agency. This makes EXMAR a global
service partner for all players in the mineral oil and gas industry.
110381 EXMAR JAARVERSLAG BW ENG.indd 28 28/04/11 15:01

29nog in te vullen 29
SERVICES & HOLDING
We have a global view on our business
110381 EXMAR JAARVERSLAG BW ENG.indd 29 28/04/11 15:01

30 services
EXMAR SHIPMANAGEMENT
eXMar shipmanagement provides high quality ship management and related services to owners of high tech carriers and floating units (storage & accommodation). EXMAR Shipmanagement is the world leader in managing Ship-to-Ship Transfer (STS), Regasification vessels as well as Floating Storage and Regasification Units (FSRU’s – OLT Livorno). EXMAR Shipmanagement provides these services for over 30 high tech vessels and the company continues to develop its business.
These services aim at continuous enhan-cement of the quality, safety and security of daily operations, care for the well being of the crews and protection of the marine environment.
This is achieved by:• involvingshipandshorestaffactivelyinthe
dailyimprovementofHSEQprocesses;• focusingoncompanyloyaltybyrecruit-
ment of young officers through co-operation withseveralmaritimeacademies;
• enhancedtrainingprogramsatrecognizedtop-level institutes supplemented by in-housetraining;
• ensuringafleetwidecostefficientmaintenanceanddefectreportingsystem;
• supplyingreliablehard-andsoftwaretoolsto support the daily operations
The current developments in the management of the oil and gas supply chain result in a growing need for specialized maritime, technicalandHSEQexpertise.
By providing both Shipmanagement and mari-ne expert services, EXMAR Shipmanagement is well geared to be a worldwide global service provider for operators in this industry. With a company experience rate of 89% (more than 2 years in a staff rank), we can rely on a loyal team of seafarers to manage our vessels. Through conferences and extensive trainings in which the human interaction and leadership skills are embraced, we succeed in managing our vessels with strong multicultural teams. In 2010 the fleet of EXMAR Shipmanagement had a Lost Time Injury Frequency (LTIF) of 1.08. Although this is slightly higher than in 2009 (0.88), the difference is not significant. Four vessels are sailing for 5 years now without LTI. Nevertheless, we continuously strive to reduce the number of accident further. For more than five years in a row, EXMAR has had no incident which resulted in oil pollution to the sea. In the course of the year, EXMAR Shipmanagement has been preparing its office and seagoing staff for ISO-14001 certification which was obtained early 2011. In 2010, EXMAR Shipmanagement also started providing technical and crew management for commercial cruise vessels and currently has 4 of these vessels in management.
EXMAR Shipmanagement has offices in Antwerp, Singapore, Mumbai and Limassol.
110381 EXMAR JAARVERSLAG BW ENG.indd 30 28/04/11 15:01

31services
INSURANCE BROKERAGE
Belgibo is an independent insurance broker based in Antwerp with a specific focus on marine industry. It ranks amongst the top 10 insurance brokers in Belgium and Luxemburg. In addition to all types of industrial insurances, Belgibo offers a number of specialised products, including cargo transport insurance, hull insurance and aviation insurance to national and international clients.Belgibo had a very slight decrease of revenues in 2010 due to the loss of one major account.
1. Inland BargesThe turnover has slightly decreased in 2010. Despite the better worldwide economic pros-pects, inland navigation remained burdened by the crisis. General and liquid cargo freight levels remained low. As a result the financial pressure on the inland craft owners increases further whereas their financial reserves keep on diminishing. The second half of 2010 shows an increase of owners having solvability issues. This evolution had a negative impact on the 2010 Belgibo turnover and it is expected that 2011 will remain troublesome mainly due to the fact that the prospects for the liquid cargo market do not appear favorable.Belgibo succeeded in maintaining their position as Belgian market leader in the inland barge market and still manages to attract new clients on a regular basis to compensate for the loss resulting from vessels being laid up or sold.
2. IndustryThe Industry Department was successful in acquiring new selected clients which contributed to a better spread of revenues. The revenues of some major projects will enhance the stability of the overall department income for the upcoming 2 years.
3. MarineHull and P&I revenues continued to grow to above market rates due to the financial strength of our clients who continued to invest despite suffering markets.Only the cargo revenues suffered from important competition and continuous erosion of the premium levels.The credit Risk division went through challenging times but nevertheless managed to achieve good results on the “long term” products.Due to the increased workload in claims handling our short term development plans had to be postponed for one year.
TRAVEL PLUS
Following a slight decline owing to the worldwide financial-economic crisis, which was tangible throughout the entire travel sector, we have returned to being very busy since 2010. On our twentieth anniversary on 1 February 2011 we were therefore able to present figures that exceeded the record results of 2008. We are happy to ascribe the good performance to our consistent policy: we have always remained focused on our core activities. For two decades, Travel Plus has specialised in business travel and in organising made-to-measure leisure travel. In doing so we have built up great expertise and now enjoy an outstanding reputation. And that is now translating into a positive balance sheet and allows us to face the future with confidence.
110381 EXMAR JAARVERSLAG BW ENG.indd 31 28/04/11 15:01
32 personnel
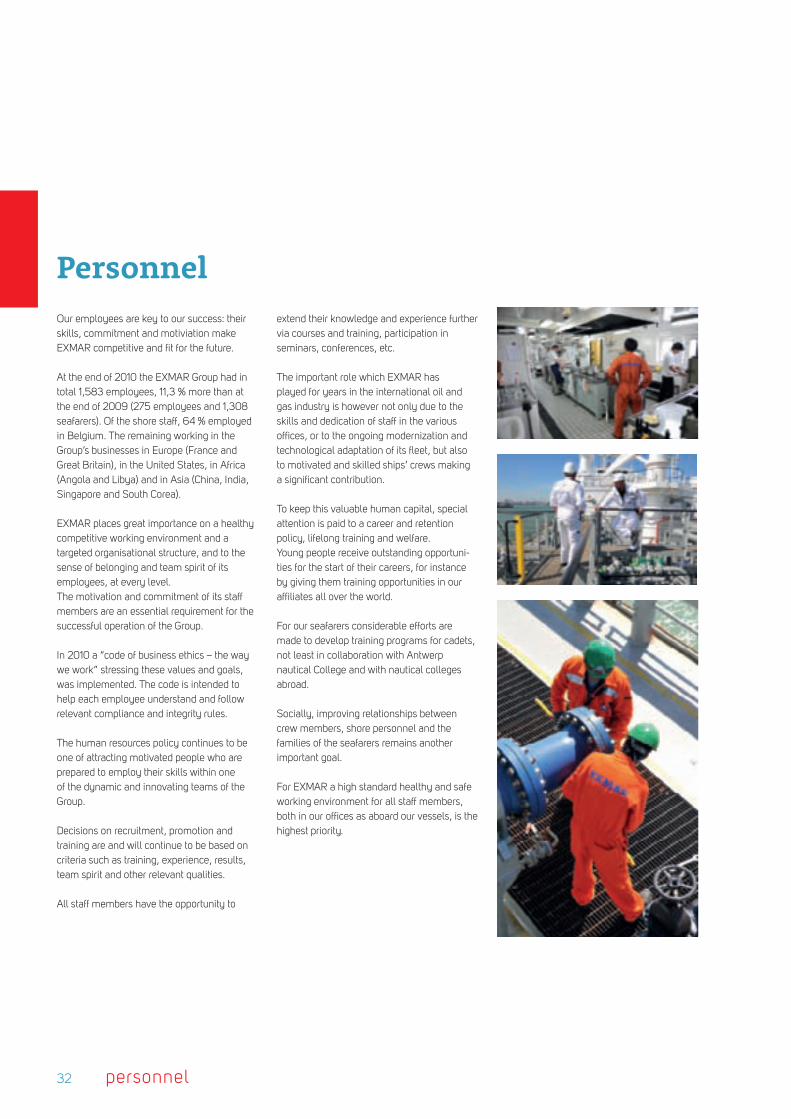
PersonnelOur employees are key to our success: their skills, commitment and motiviation make EXMAR competitive and fit for the future.
At the end of 2010 the EXMAR Group had in total 1,583 employees, 11,3 % more than at the end of 2009 (275 employees and 1,308 seafarers). Of the shore staff, 64 % employed in Belgium. The remaining working in the Group’s businesses in Europe (France and Great Britain), in the United States, in Africa (Angola and Libya) and in Asia (China, India, Singapore and South Corea).
EXMAR places great importance on a healthy competitive working environment and a targeted organisational structure, and to the sense of belonging and team spirit of its employees, at every level.The motivation and commitment of its staff members are an essential requirement for the successful operation of the Group.
In 2010 a “code of business ethics – the way we work” stressing these values and goals, was implemented. The code is intended to help each employee understand and follow relevant compliance and integrity rules.
The human resources policy continues to be one of attracting motivated people who are prepared to employ their skills within one of the dynamic and innovating teams of the Group.
Decisions on recruitment, promotion and training are and will continue to be based on criteria such as training, experience, results, team spirit and other relevant qualities.
All staff members have the opportunity to
extend their knowledge and experience further via courses and training, participation in seminars, conferences, etc.
The important role which EXMAR has played for years in the international oil and gas industry is however not only due to the skills and dedication of staff in the various offices, or to the ongoing modernization and technological adaptation of its fleet, but also to motivated and skilled ships’ crews making a significant contribution.
To keep this valuable human capital, special attention is paid to a career and retention policy, lifelong training and welfare.Young people receive outstanding opportuni-ties for the start of their careers, for instance by giving them training opportunities in our affiliates all over the world.
For our seafarers considerable efforts are made to develop training programs for cadets, not least in collaboration with Antwerp nautical College and with nautical colleges abroad.
Socially, improving relationships between crew members, shore personnel and the families of the seafarers remains another important goal.
For EXMAR a high standard healthy and safe working environment for all staff members, both in our offices as aboard our vessels, is the highest priority.
110381 EXMAR JAARVERSLAG BW ENG.indd 32 28/04/11 15:01

Evolution personnel 2009-2010
Shore
Seafarers
1.600
1,400
1,200
1,000
800
600
400
200
0
2007 2008 20102009
Africa2
Belgium177
Europe20
US56
Asia20
LNG5%
Offshore28%
Services54%
LPG13%
LNG23%
Off6%
LPG44%
Services27%
LNG20%
Services32%
OFF9%
LPG39%
Total personnel
Seafarers Shore staff
Composition shore staff / region
33personnel
110381 EXMAR JAARVERSLAG BW ENG.indd 33 28/04/11 15:01
34 environment
Environment LESS ENVIRONMENTAL
IMPACT FOR A SUSTAINABLE FUTURE
EXMAR Shipmanagement fully complies with the applicable international legislation regarding Environmental aspects of the shipping industry. EXMAR Shipmanagement concluded 2010, just as the previous years, without any oil pollution to the sea.EXMAR Shipmanagement obtained early 2011 the ISO 14001 Environmental certifica-tion. This will reinforce the frame work for monitoring environmental compliance and continuing projects to realize environmental impact reduction beyond compliance. In par-ticular also the Lean Six Sigma methodology is been used for green improvement projects such as energy consumption reduction and boil off gas management related to regas cargo operations on board of the LNGRV fleet.
The existing EXMAR fleet adopted advanced new technological developments in shipping to reduce the environmental impact of its operations, in particular:• Withtheobjectiveofimportantsavingson
lubricating oil consumption and corres-ponding important environmental impact reduction, Electronic Cylinder Lubrification is retrofitted on board of EXMAR LPG-motor ships according dry dock scheme. Recent ships in the EXMAR fleet are standard equipped with a similar system.
• Inviewofassuringzeromarinepollutionwith oily waters, centrifuges for efficient separation of oily bilge waters are being installed on board of the existing EXMAR LPG-motor ships. This complementary to the original mandatory equipment.10 EXMAR LPG ships were equipped with this centrifuge system.
• FurthermoreEXMARimplementsleadingedge environmental technology on the LNGRV-vessels which are planned for regasification operations: Advanced energy recovery systems for closed loop mode regasification.
Selective Catalytic Reduction Units for the reduction of the Nitrogen Oxides (NOx) in exhaust gas are installed on board.
• ForoperationsatNortheastGatewaydeepwater port a specific training program is implemented in view of the Marine Mammals Detection, Monitoring and Response Plan. The program is effectively implemented and involves all crew with navigational and lookout duties: i.e. Master, deck officers and ratings.
GREEN INNOVATIONSAlthough shipping is still the most energy efficient way to transport commoditiesacross the world, EXMAR is continuously striving to develop a more efficient andecological way of transportation by ship.Different innovative concepts considering all aspects of ‘green' ship design are being explored through research and development by EXMAR's engineering departments in close cooperation with shipyards and equipment manufacturers.
experience and knowhowIn its highly sophisticated fleet of LNG regasification vessels (LNGRV's), EXMARincorporated already several green technolo-gies in order to reduce emissions.When operating, the LNGRV's have the capability of using the natural evaporation of the cargo as a fuel. During the onboard regasification process the vessels have the ability to operate only on natural gas by means of modified boilers and a dual fuel diesel generator.
Compared to consuming heavy fuel oil, the use of natural gas reduces the CO²emissions with 25%, the sulphur oxide emis-sions (SOx) with 100%, the nitrogenoxide emissions (NOx) with up to 90% and in addition no soot is produced whenrunning on gas.These NOx emissions can even be further reduced with 90% by an onboard Selective Catalytic Reduction (SCR) system which is placed in the exhaust gas stream. In this system the NOx molecules react with the additional reagent urea and and in this way chemically reduces the NOx into harmless water and nitrogen. This SCR system onboard the EXMAR LNGRV's was the first ever application of such system on board an LNG carrier.
Furthermore all LNGC's and LNGRV's in the fleet are being equipped with greenpassports to ensure decommissioning will be performed in a proper way.To further reduce the gas consumption during regas operation, EXMAR has developed a heat recovery system which reduces the consumption, and thus the emissions with more than 10% in closed loop mode.
Since the delivery of the first EXMAR LNGRV in 2005, EXMAR gained extensive experience in the mentioned green technologies and therefore it was decided to expand this knowledge towards the LPG fleet by the development of a Green LPG carrier design.
eXMar Green LPG carrier designThe EXMAR Green LPG carrier design mainly focuses on the reduction of airpollution, the treatment of ballast water against alien species and the application of non biocidal foul release coating systems for a smoother underwater hull.In order to meet the upcoming air pollution
110381 EXMAR JAARVERSLAG BW ENG.indd 34 28/04/11 15:01

35environment
regulations, many alternatives were studied but the use of LNG as a fuel is presently seen as the most efficient solution.The use of alternative after-treatment systems are to be less favorable.To reduce the energy consumption and thus CO² emissions further down, mainly solutions were investigated to optimise the propulsion and to reduce the ship's resistance.Various innovations recently introduced in the market were broadly studied.
LNG as a fuelEXMAR is not only doing research to apply its broad LNG knowledge in its own fleet, but is also looking at a various range of ship types to use LNG as a fuel. LNG as a fuel requires some critical ship design changes:•Thestorageandhandlingoffuelat-163°C.•LackofinfrastructureforLNGsupplytoships. Presently Norway is the only country where a bunker system for ships exists.
EXMAR believes the introduction of LNG as a marine fuel is a step towards a cleaner and more sustainable industry.
CONCLUSIONThe research and development of green ship technologies is an important step inEXMAR's ambition to create more sustainable shipping. Concerns for the environment, in combination with extremely competitive transport economy and a maximum of safety, are seen as an opportunity to enter new markets. This can perfectly go together with a reduced environmental impact on the marine environment and on human health.
110381 EXMAR JAARVERSLAG BW ENG.indd 35 28/04/11 15:01

36 safety and quality
Safety and qualityEXMAR is continually investing in new technologies and management systems.By doing so, EXMAR keeps its finger on the pulse so that the quality of EXMAR activities is maintained in the forthcoming years. At EXMAR, safety and quality go hand in hand. A safe working environment, both onshore and offshore, is the prerequisite for cost-efficient service provision and sustainable business.
ThemainSafety&Qualityresultsachievedbythe EXMAR Shipmanagement for 2010:• LostTimeIncidentFrequencyend2010was
1.08 (basis one million working hours).• ISO9001-2008certificationaswellas
International Safety Management (ISM) Document of Compliance (DOC) were
successfully continued.
EXMAR Shipmanagement applies Tanker Management Self Assessment as per OCIMF guidelines.
ThemainSafety&QualityresultsforEXMAR Offshore Services for 2010:• LostTimeIncidentFrequencywaszeroend
2010 This result was achieved for the fifth year in
a row.• ISO9001-2008certificationbyBVfor Management of General Services for
Offshore Operations was successfully continued now including as well technical management.
Traditional safety based on seafarers competence, complemented with enhanced risk management enables innovation in a safe and responsible way at EXMAR. Management of change proves to be a key tool to implement adequate risk assessment in shipmanagement operations. Indeed risk
assessment and risk management are imple-mented from conceptual feasibility stages for new projects until and including the respective innovative operations. In particular the success of both LNGRV regasification operations and multiple LNG ship to ship transfer operations at different gasports worldwide prove the sound approach of EXMAR and EXMAR Shipmanagement to operate their new LNG technologies safely. EXMAR Shipmanagement is determined to remain the leader in LNG STS and Regasification and has adopted Lean Six Sigma as improvement methodology.Lean Six Sigma is an advanced business performance improvement tool that helps enhance customer's experience, increases reliability of EXMAR ships and operations, lowers costs and improves sustained compliance.
110381 EXMAR JAARVERSLAG BW ENG.indd 36 28/04/11 15:01

37
110381 EXMAR JAARVERSLAG BW ENG.indd 37 28/04/11 15:01

w
38 EXMAR share
EXMAR share The EXMAR share is listed on the NYSE Euronext Brussels and has formed part of the Bel Mid index (Euronext: EXM) since 23 June 2003. As of 10 December 2009 the VVPR strips were listed on the NYSE Euronext Brussels. EXMAR's capital amounts to USD 88,811,667 and is represented by 59,500,000 shares without nominal value
* Paid as an interim dividend
evolution of the consolidated equity (usD)
2006 2007 2008 20102009
400,000
350,000
300,000
250,000
200,000
150,000
100,000
50,000
0
2003 2004 2005
evolution of the dividend(eur)
2005 2006 2007 2009 201020102008
0.80
0.70
0.60
0.50
0.40
0.30
0.20
0.10
0
2002 2003 2004
*
110381 EXMAR JAARVERSLAG BW ENG.indd 38 28/04/11 15:01
w
39
Dateshare capital
usDshare premium
usDNumber of shares
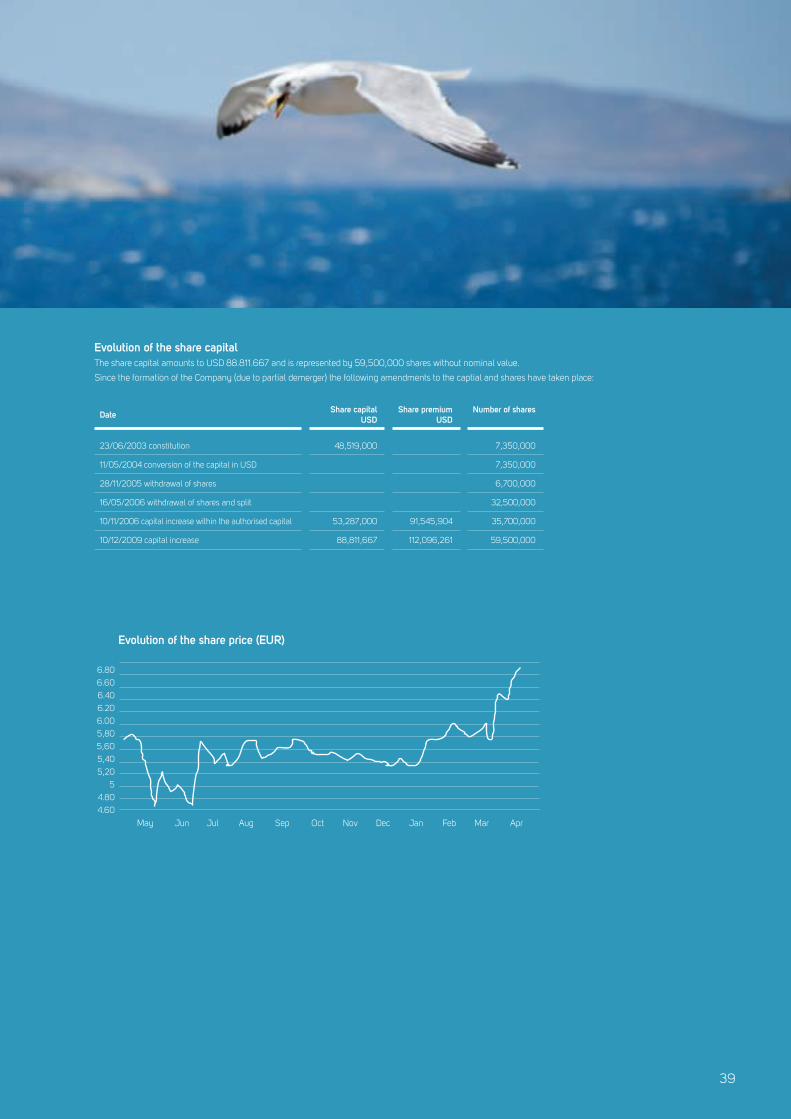
23/06/2003 constitution 48,519,000 7,350,000
11/05/2004 conversion of the capital in USD 7,350,000
28/11/2005 withdrawal of shares 6,700,000
16/05/2006 withdrawal of shares and split 32,500,000
10/11/2006 capital increase within the authorised capital 53,287,000 91,545,904 35,700,000
10/12/2009 capital increase 88,811,667 112,096,261 59,500,000
evolution of the share capitalThe share capital amounts to USD 88.811.667 and is represented by 59,500,000 shares without nominal value.
Since the formation of the Company (due to partial demerger) the following amendments to the captial and shares have taken place:
evolution of the share price (eur)
6.80
6.60
6.40
6.20
6.00
5,80
5,60
5,40
5,20
5
4.80
4.60
DecAug Jan Feb MarMay SepJun Jul Oct Nov Apr
110381 EXMAR JAARVERSLAG BW ENG.indd 39 28/04/11 15:01
40 colophon
eXMar NV
De Gerlachekaai 20
2000 Antwerp
Tel.: +32(0)3 247 56 11
Fax: +32(0)3 247 56 01
Business registration number:
0860 409 202 RPR Antwerp
Website: www.exmar.be
E-mail: [email protected]
Contact
• AllEXMARpressreleasescanbeconsultedon
the website: www.exmar.be
• Questionscanbeaskedbytelephoneat
+32(0)3 247 56 11 or by e-mail to corporate@
EXMAR.be, for the attention of Patrick De
Brabandere (COO), Didier Ryelandt (CFO) or
Karel Stes (Secretary).
• Incaseyouwishtoreceiveourannualor
halfyear report please mail : corporate@
EXMAR.be
The Dutch version of this year report must be
considered to be the official version.
Design and production: www.dms.be
Cert no. CU-COC-809718-BV
Colophon
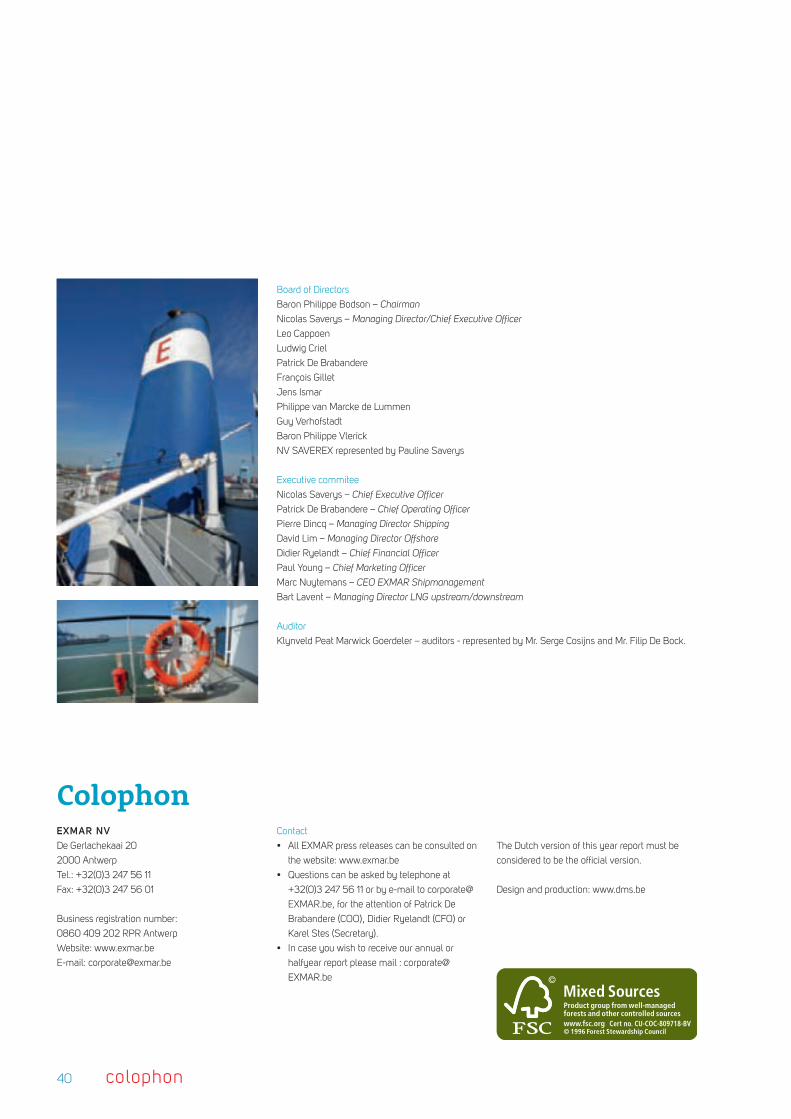
Board of Directors
Baron Philippe Bodson – Chairman
Nicolas Saverys – Managing Director/Chief Executive Officer
Leo Cappoen
Ludwig Criel
Patrick De Brabandere
François Gillet
Jens Ismar
Philippe van Marcke de Lummen
Guy Verhofstadt
Baron Philippe Vlerick
NV SAVEREX represented by Pauline Saverys
Executive commitee
Nicolas Saverys – Chief Executive Officer
Patrick De Brabandere – Chief Operating Officer
Pierre Dincq – Managing Director Shipping
David Lim – Managing Director Offshore
Didier Ryelandt – Chief Financial Officer
Paul Young – Chief Marketing Officer
Marc Nuytemans – CEO EXMAR Shipmanagement
Bart Lavent – Managing Director LNG upstream/downstream
Auditor
Klynveld Peat Marwick Goerdeler – auditors - represented by Mr. Serge Cosijns and Mr. Filip De Bock.
110381 EXMAR JAARVERSLAG BW ENG.indd 40 28/04/11 15:01

1
EXMAR annual report 2010
110381 EXMAR JAARVERSLAG FINANCIEEL ENG.indd 1 28/04/11 14:23

2
EXMAR annual report 2010
110381 EXMAR JAARVERSLAG FINANCIEEL ENG.indd 2 28/04/11 14:23

3
Contents
RepoRt of the BoaRd of diRectoRs
coRpoRate goveRnance statement
financial RepoRt
110381 EXMAR JAARVERSLAG FINANCIEEL ENG.indd 3 28/04/11 14:23

4
MAIN ACCOMPLISHMENTS IN 2010
Following the capital increase that was successfully concluded at
the end of 2009, resulting in a strengthened balance sheet and
corresponding new fi nancial scope to pursue business opportunities,
several LNG-related projects were considered.
Developments on LPG and offshore markets, too, were watched
closely so that any opportunity for further consolidation of the fl eet
could be seized.
On 15 February 2010, EXMAR and its consortium (Promigas and
CLNG) submitted a proposal to the Petroleum Corporation of Jamaica
for the fi nancing, development, ownership and management of an
FRSU LNG regasifi cation terminal and a natural gas transport system.
The EXMAR consortium was selected as preferred bidder.
Negotiations between the EXMAR consortium and PCJ began in June
2010. The outcome is not yet known.
In March 2010, EXMAR and Excelerate Energy L.P. reached an
agreement on the restructuring of their stake (50/50) in LNGRV
EXPEDIENT and LNGRV EXEMPLAR, whereby EXMAR transferred
Dear Shareholder,
We have the honour to report to you on the activities during the past financial year and to present the consolidated and statutory financial statements for the year ended 31 December 2010. The annual reports on the consolidated and statutory financial statements have been joined in accordance with Article 119 of the Companies Code.
In accordance with Article 34 of the Royal Decree of 14 November 2007 (on the obligations of issuers of financial instruments admitted to trading on a regulated market), listed companies are required to include relevant information in their annual report that may have an impact in the event of a public takeover bid.
The elements referred to in the aforementioned regulations and in the Companies Code that apply to the Company are dealt with in the present annual report, as well as in the Corporate Governance Statement which forms part of the annual brochure, referring if need be to the provisions of the Corporate Governance Charter, the articles of association and the Company's website. The present report should therefore be read in conjunction with the annual brochure. No reference is made to the elements mentioned in said Article 34 which do not apply to EXMAR NV.
Report of the Board of Directors to the general meeting of shareholders
110381 EXMAR JAARVERSLAG FINANCIEEL ENG.indd 4 28/04/11 14:23

5
MAIN ACCOMPLISHMENTS IN 2010
Following the capital increase that was successfully concluded at
the end of 2009, resulting in a strengthened balance sheet and
corresponding new fi nancial scope to pursue business opportunities,
several LNG-related projects were considered.
Developments on LPG and offshore markets, too, were watched
closely so that any opportunity for further consolidation of the fl eet
could be seized.
On 15 February 2010, EXMAR and its consortium (Promigas and
CLNG) submitted a proposal to the Petroleum Corporation of Jamaica
for the fi nancing, development, ownership and management of an
FRSU LNG regasifi cation terminal and a natural gas transport system.
The EXMAR consortium was selected as preferred bidder.
Negotiations between the EXMAR consortium and PCJ began in June
2010. The outcome is not yet known.
In March 2010, EXMAR and Excelerate Energy L.P. reached an
agreement on the restructuring of their stake (50/50) in LNGRV
EXPEDIENT and LNGRV EXEMPLAR, whereby EXMAR transferred
its interest in the two vessels to Excelerate Energy L.P. EXMAR will
continue to assume the management and maintenance of the vessels.
The transfer of these stakes is part of a wider commercial agreement
between EXMAR and Excelerate Energy in connection with their LNG
operations.
In June 2010, an agreement in principle was concluded with the
American group LLOG Development Company LLC for the fl oating
production platform OPTI-EX®. The sale agreement was signed the
following August. The American fi rm wants to deploy the platform in
the Mississippi delta in the Gulf of Mexico, where LLOG wants to start
production around mid-2011.
The sale of the production platform involves a sum of more than 430
million dollars. Payment will be staggered over a period of at least fi ve
years following the installation.
Towards the end of the year, in October, EXMAR and Teekay LNG
Partners L.P. reached an agreement whereby Teekay acquired a 50%
stake in two EXMAR LNG vessels, EXCELSIOR and EXCALIBUR.
Both vessels are employed under long-term charters with Excelerate
Energy. EXMAR continues to assume the management and operation
of the vessels.
110381 EXMAR JAARVERSLAG FINANCIEEL ENG.indd 5 28/04/11 14:23

6
NOTES TO THE STATUTORY FINANCIAL STATEMENTS
Financial situation The statutory accounts were drawn up according to Belgian GAAP .
The statutory result for the financial year 2010 amounts to USD
17.3 million (USD 18.6 million in 2009). The result is positively
impacted by the extra-ordinary profit on the sale of 50% of the
shares in Excelsior BVBA (USD 43.1 million) and by the change in
the fair value of the interest rate swaps for a negative amount of
USD -27.6 million (in 2009 USD 31.4 million positive change).
The total assets amount to USD 906.8 million (USD 914.4 million
end 2009) as per 31 December 2010, of which USD 612.1 million
financial fixed assets (USD 597.6 million in 2009).
The equity as per year-end amounts to USD 439.8 million (USD
454.9 million for year-end 2009) and the decrease of USD 15.1
million compared to 2009 is caused by, on the one hand the
distribution of dividend of USD -32.4 million and on the other hand
the result of the year (USD 17.3 million).
The company’s debts amount to USD 462.8 million at the end of
2010 (in 2009: USD 454.8 million), of which USD 348.0 million
long-term debts and USD 114.8 million short-term debts (in 2009
respectively USD 358.2 million and USD 96.6 million).
Appropriation of the ResultThe Board of Directors proposes to appropriate the result as follows:
• Profit brought forward: USD 67,392,839.87
• Profit for the period: USD 17,293,729.86
• Dividend: USD -32,424,525.00
• Transfer to the unavailable reserves: USD -3,272,207.89
• Transfer to legal reserves: USD -864,686.49
• Result to be carried forward: USD 48,125,150.35
The Board of Directors proposes to the general meeting of share-
holders to pay out a gross dividend of EUR 0.40 per share, of which
a gross interim dividend of EUR 0.30 per share was paid out as an
interim dividend on 12 November 2010.
If the general meeting of shareholders approves the proposal a
final dividend of EUR 0.10 per share ( EUR 0.075 net per share or
EUR 0.085 net per share together with a VVPR strip coupon after
deducting withholding tax).
The dividend will be paid out at the counters of a financial institution
on presentation of coupon 11 from 25th May 2011. (ex-date : 20 May
– record date : 24 May).
The dividend for holders of registered shares or dematerialised
shares will be paid into their account.
NOTES TO THE CONSOLIDATED FINANCIAL STATEMENTS
The consolidated figures were drawn up in accordance with IFRS.
Notwithstanding the provisions of Article 125 of the Companies Code,
the capital and accounts are expressed in US dollars. This exception
was granted by the Ministry of Economic Affairs and was confirmed to
us in writing on 2 July 2003.
The Board of Directors believes that the reasons why this exception
was requested still apply to the financial statements for this period.
TurnoverEXMAR Group realised a turnover of USD 413.9 million in 2010,
compared with USD 403.2 million in 2009.
ResultsThe consolidated operating results amounted to USD 87.4 million in
2010 and were positively influenced by the capital gain on the sale
of 50% of the stake in the vessels EXCELSIOR and EXCALIBUR (for
USD 46.9 million). Nevertheless, the operating results continue to be
adversely affected by disappointing tariffs on the LPG spot market.
In 2009, the operating results of USD 44.5 million were negatively
affected by disappointing freight tariffs for the LPG fleet and the failure
of the KISSAMA and the OPTI-EX® to contribute to the results.
The net financial results for 2010 were negative to the amount of
USD -70.1 million (USD 6.4 million in 2009). The negative trend
in the net financial results is mainly accounted for by non-cash,
unrealised results following the change in the fair value of the
interest rate swaps covering the interest rate risk on the long-term
financing of the fleet (USD -15.4 million in 2010 compared with
USD 54.6 million in 2009) and the change in the fair value of
forward exchange contracts (EUR/USD) (USD 0.3 million in 2010
compared with USD 13 million in 2009).
EXMAR Group realised a consolidated result after tax of USD 14.4 mil-
lion in 2010 (USD 43.5 million in 2009). If no account were taken of
the change in fair value (Mark-to-Market) of the financial instruments,
the consolidated after-tax result would be USD 28.8 million (USD -11.1
million in 2009).
Fixed assetsThe net book value of the vessels decreased by 33% or USD 593.9
million to USD 1,166.6 million.
The net book value of the LPG fleet (USD 602.1 million) is similar to
that in the previous year since the increase as a result of investments
(mainly further instalments on the last three pressurised LPG tankers)
is offset by the depreciation cost in 2010. The value of the LNG fleet as
at 31 December 2010 stood at USD 526.1 million, a reduction by USD
283.0 million compared with 2009. This decrease is explained by
the sale of the stake in EXEMPLAR and EXPEDIENT (LNGRVs under
construction) to Excelerate Energy LP and the disposal of 50% of the
stake in the vessels EXCELSIOR and EXCALIBUR. The value of the
offshore fleet, too, is marked by a fall in the net book value: USD 38.4
million as at 31 December 2010 compared with USD 345.3 million in
2009. In view of the agreement to sell the OPTI-EX®, the net book
value of this offshore unit was presented as fixed assets held for sale.
Current assetsThe current assets increased in 2010 by USD 320.4 million to USD
557.0 million. This development is essentially accounted for by
OPTI-EX® being shown as assets held for sale as at 31 December 2010.
The net cash position (cash and cash equivalents less bank overdraft)
as at 31 December 2010 amounted to USD 120.2 million, of which
USD 52.1 million free cash flow.
EquityEquity amounted to USD 402.6 million as at 31 December 2010,
and was positively influenced by the result for 2010 (USD 14.4
million) and at the same time negatively affected by the dividend
payment (USD 30.7 million) and the acquisition of own shares
(USD 6.1 million).
LiabilitiesThe net financial debt (financial liabilities less liquid assets) totaled
1,028.7 million as at 31 December 2010. The net financial debt
decreased by USD 254.1 million, mainly as a result of the elimination
of the debt in the context of the sale of the stake in EXEMPLAR and
EXPEDIENT, and the sale of 50% of the stake in EXCELSIOR and
EXCALIBUR (USD 250.0 million).
The debt in respect of the negative market value of financial
instruments was USD 90.6 million as at 31 December 2010, which is
an increase compared with 2009 (USD 71.4 million).
Discussion of the financial statements
110381 EXMAR JAARVERSLAG FINANCIEEL ENG.indd 6 28/04/11 14:23

7
NOTES TO THE STATUTORY FINANCIAL STATEMENTS
Financial situation The statutory accounts were drawn up according to Belgian GAAP .
The statutory result for the financial year 2010 amounts to USD
17.3 million (USD 18.6 million in 2009). The result is positively
impacted by the extra-ordinary profit on the sale of 50% of the
shares in Excelsior BVBA (USD 43.1 million) and by the change in
the fair value of the interest rate swaps for a negative amount of
USD -27.6 million (in 2009 USD 31.4 million positive change).
The total assets amount to USD 906.8 million (USD 914.4 million
end 2009) as per 31 December 2010, of which USD 612.1 million
financial fixed assets (USD 597.6 million in 2009).
The equity as per year-end amounts to USD 439.8 million (USD
454.9 million for year-end 2009) and the decrease of USD 15.1
million compared to 2009 is caused by, on the one hand the
distribution of dividend of USD -32.4 million and on the other hand
the result of the year (USD 17.3 million).
The company’s debts amount to USD 462.8 million at the end of
2010 (in 2009: USD 454.8 million), of which USD 348.0 million
long-term debts and USD 114.8 million short-term debts (in 2009
respectively USD 358.2 million and USD 96.6 million).
Appropriation of the ResultThe Board of Directors proposes to appropriate the result as follows:
• Profit brought forward: USD 67,392,839.87
• Profit for the period: USD 17,293,729.86
• Dividend: USD -32,424,525.00
• Transfer to the unavailable reserves: USD -3,272,207.89
• Transfer to legal reserves: USD -864,686.49
• Result to be carried forward: USD 48,125,150.35
The Board of Directors proposes to the general meeting of share-
holders to pay out a gross dividend of EUR 0.40 per share, of which
a gross interim dividend of EUR 0.30 per share was paid out as an
interim dividend on 12 November 2010.
If the general meeting of shareholders approves the proposal a
final dividend of EUR 0.10 per share ( EUR 0.075 net per share or
EUR 0.085 net per share together with a VVPR strip coupon after
deducting withholding tax).
The dividend will be paid out at the counters of a financial institution
on presentation of coupon 11 from 25th May 2011. (ex-date : 20 May
– record date : 24 May).
The dividend for holders of registered shares or dematerialised
shares will be paid into their account.
After this appropriation, the equity of USD USD 439,812,262.38 will
be made up as follows:
• Capital: USD 88,811,667.00
• Share premium: USD 209,901,923.77
• Reserves: USD 92,973,521.26
• Result carried forward: USD 48,125,150.35
RISK FACTORS
In pursuance of the Companies Code, the Board of Directors informs
the shareholders about the main risk factors for the EXMAR Group as
described in the Corporate Governance Statement under “Internal Risk
and Management Systems”.
NOTIFICATIONS
Notification of Conflict of Interest: Application of Article 523 and Article 524(2) of the Companies CodeA conflict of interest arose in connection with the approval of
the stock option plan on 1 December 2010. The provisions and
require ments of Article 523 of the Companies Code were observed.
The minutes relating to this agenda item read as follows:
“Before proceeding with the deliberation on this agenda item,
Nicolas Saverys and Patrick De Brabandere informed the
other members of the Board, pursuant to Article 523 of the
Companies Code, that as beneficiaries of the remuneration
proposals they have a proprietary interest which conflicts with
that of the company.
Nicolas Saverys and Patrick De Brabandere did not take part
in the deliberations or the vote on the recommendations of the
Remuneration Committee.
Both gentlemen shall notify the statutory auditors of this in
writing pursuant to Article 523 of the Companies Code.”
Karel Stes, secretary of the meeting and also a beneficiary of the
option plans, was informed by the Chairman that he should restrict
himself to taking the minutes with regard to this agenda item.
The statutory auditor of the Company was notified of this conflict of
interest in accordance with Article 523 of the Companies Code.
There were no conflicts of interest as far as the Executive Committee
is concerned.
110381 EXMAR JAARVERSLAG FINANCIEEL ENG.indd 7 28/04/11 14:23

8
Stock Option PlanOn 1 December 2010 the Board of Directors decided for the seventh
time to offer options on existing shares to a number of employees of
the EXMAR Group. The number of options granted is shown below:
date of offeR
nUmBeR of oUtstanding options
eXeRise peRiod eXeRcise pRice in eURo
15.12.2004 156,068 Between 01.04.2008 and 15.10.2017 (*)
7.04 (°)
09.12.2005 334,849 Between 01.01.2009 and 15.10.2018 (*)
12.33 (°)
15.12.2006 433,966 Between 01.01.2010 and 15.10.2019 (*)
18.33 (°)
04.12.2007 241,870 Between 01.01.2011 and 15.10.2020 (*)
16.81 (°)
19.12.2008 336,329 Between 01.01.2012 and 18.12.2016
6.80 (°)
29.12.2009 555,400 Between 01.01.2013 and 28.12.2017
5.57
09.12.2010 437,650 Between 01.01.2014 and 28.12.2018
5.41
(*) The Board of Directors meeting of 23 March 2009 decided to extend the original exercise period for all option plans by five years, by virtue of the decision by the Belgian Govern-ment to extend the Act of 26 March 1999, in particular regarding stock option plans.
(°) As a result of the capital increase and the dilution protection, the number and exercise price of the stock options was modified with effect from 19 November 2009.
OUTLOOK FOR 2011
In the coming year, the LPG division can rely upon an attractive
portfolio consisting of a balanced combination of spot cargoes,
voyage charter and time charter contracts. The prospects for the
VLGC charter rates on the spot market appear to be better than in
the previous quarters. One must continue to pay close attention
to the evolution of the market value of the vessels, especially for
the VLGC segment.
Due to the full employment of the LNG fleet in 2011, with no
scheduled dry dock periods, except the offhire of EXCALIBUR for
15 days in January for a planned technical stop, the results of the
division will be in line with expectations. As far as the Jamaican
LNG project is concerned, we are awaiting the final decision of the
Jamaican government which is due around mid-2011.
In the offshore division, the alterations to the OPTI-EX® are on
schedule, and completion is due by mid-2011.
Employment is guaranteed for the other platforms, and all
opportunities are being investigated.
BOARD OF DIRECTORS AND COMMITTEES
We will request the General Meeting of Shareholders to grant us
discharge for the exercise of our mandate.
The Board of Directors notes that the mandates of Messrs Philippe
Vlerick (independent director) and Ludwig Criel (non-executive
director) will expire immediately after the next general meeting.
Messrs Vlerick and Criel are seeking re-election.
The General Meeting is requested to deliberate on their reappoint-
ment as directors for a new term of three years.
The Appointment Committee delivered an opinion on the proposed
reappointments at its meeting of 31 March 2011.
According to the provisions of the Corporate Governance Code, Mr
Vlerick can no longer be regarded as an independent director as from
the next general meeting, since in accordance with Annex A 2.4/1(2)
he has served three consecutive terms of office as an independent
director. Mr Vlerick has notified the Board of Directors of this.
The Board of Directors
Antwerp, 31 March 2011
110381 EXMAR JAARVERSLAG FINANCIEEL ENG.indd 8 28/04/11 14:23

9
110381 EXMAR JAARVERSLAG FINANCIEEL ENG.indd 9 28/04/11 14:24
10
This Corporate Governance statement has been drawn up in
accordance with the Corporate Governance Code 2009, which the
company uses as a reference code.
Transparency is achieved by means of two different documents:
• The Corporate Governance Charter that can be viewed on the
company’s website (www.exmar.be)
• The Corporate Governance Statement included in the present
annual report and which contains more factual information about
the Corporate Governance policy within EXMAR and which
explains, as the case may be, why certain provisions in the Code
are departed from.
The Corporate Governance Charter deals with the following subjects:
• Part I: EXMAR – the company
• Part II: The shares and shareholders
• Part III : The Board of Directors, committees, control
• PART IV: transactions between related parties and conflicts of
interest
• Part V: Remuneration report
• Part VI: Internal risks
• Part VII: Market abuse
EXMAR NV - THE COMPANY
Registered officeDe Gerlachekaai 20, 2000 Antwerpen.
VAT BE 0860 409 202 RPR Antwerpen.
Establishment date and modification of articles of associationThe company was established by notarial deed on 20 June 2003,
published in the appendix to the Belgian Official Gazette of 30 June
2003, under reference 03072972, and of 4 July 2003, under
reference 03076338.
The articles of association were amended for the last time by deed of
the civil law notary Patrick Van Ooteghem in Temse on 18 May 2010,
published in the appendix to the Belgian Official Gazette (Moniteur
Belge) under number 10085888 dated 15 June 2010.
Issued capitalThe issued share capital amounts to USD 88,811,667, and is repre-
sented by 59,500,000 shares without nominal value. The capital
is paid up in full. In order to comply with the Belgian Company Law,
the reference value is established a EUR 72,777,924.85.
Authorised capitalBy decision of the general shareholders' meeting held on 20 May
2008 the Board of Directors has been authorised to increase the
share capital of the company in one or several times by a total
maximum amount of USD twelve million (reference value EUR
7.703.665,66) during a period of five years as from the date of
publication of such decision.
The special report of the Board of Directors was drawn up in accordance
with the provisions of article 604 of the Belgian Company Code.
Articles of association, general shareholders’ meetings, admission and exercise of the voting rightsAccording to the articles of association, the annual shareholders’
meeting takes place on the third Tuesday of May at 2.30 p.m.
The rules governing the convening, admission to meetings, their
workings and the exercise of voting rights, modification of the arti-
cles of association, the nomination of the members of the Board of
Directors and its committees can be found in the coordinated articles
of association, the corporate governance charter of the company,
which are available on the company’s website.
http://www.exmar.be/INVESTORS4SHA.html
THE SHARES and the SHAREHOLDERS
The sharesEXMAR shares are quoted on NYSE Euronext Brussels included in
the Bel Mid index . (Euronext: EXM).
As from 10 December 2009 the VVPR strips are quoted on NYSE
Euronext Brussels.
ShareholdingIt appears from a notification to the company and to the Banking,
Finance and Insurance Commission dated 9 February 2010 that
Ecofin Limited/The Astro 2004 Trust (a parent company or a control-
ling party) has fallen below the lowest threshold for its shareholding.
Ecofin owns 2,871,768 shares. (4.83%)
It appears from the notification to the company and the Banking,
Finance and Insurance Commission dated 6 August 2010 (Law of
2 May 2007):
• that Saverex NV owns 32,599,492 shares, which represents a
participation in the capital of EXMAR of 54.79%.
• that Saverex NV has granted SA Sofina call options to purchase
5,750,126 shares held by NV Saverex during an exercise period
of four years (ending on 11 December 2013). The exercise of the
entirety of the call options might lead to dilution of Saverex’s
Corporate governance statement
110381 EXMAR JAARVERSLAG FINANCIEEL ENG.indd 10 28/04/11 14:24

11
Authorised capitalBy decision of the general shareholders' meeting held on 20 May
2008 the Board of Directors has been authorised to increase the
share capital of the company in one or several times by a total
maximum amount of USD twelve million (reference value EUR
7.703.665,66) during a period of five years as from the date of
publication of such decision.
The special report of the Board of Directors was drawn up in accordance
with the provisions of article 604 of the Belgian Company Code.
Articles of association, general shareholders’ meetings, admission and exercise of the voting rightsAccording to the articles of association, the annual shareholders’
meeting takes place on the third Tuesday of May at 2.30 p.m.
The rules governing the convening, admission to meetings, their
workings and the exercise of voting rights, modification of the arti-
cles of association, the nomination of the members of the Board of
Directors and its committees can be found in the coordinated articles
of association, the corporate governance charter of the company,
which are available on the company’s website.
http://www.exmar.be/INVESTORS4SHA.html
THE SHARES and the SHAREHOLDERS
The sharesEXMAR shares are quoted on NYSE Euronext Brussels included in
the Bel Mid index . (Euronext: EXM).
As from 10 December 2009 the VVPR strips are quoted on NYSE
Euronext Brussels.
ShareholdingIt appears from a notification to the company and to the Banking,
Finance and Insurance Commission dated 9 February 2010 that
Ecofin Limited/The Astro 2004 Trust (a parent company or a control-
ling party) has fallen below the lowest threshold for its shareholding.
Ecofin owns 2,871,768 shares. (4.83%)
It appears from the notification to the company and the Banking,
Finance and Insurance Commission dated 6 August 2010 (Law of
2 May 2007):
• that Saverex NV owns 32,599,492 shares, which represents a
participation in the capital of EXMAR of 54.79%.
• that Saverex NV has granted SA Sofina call options to purchase
5,750,126 shares held by NV Saverex during an exercise period
of four years (ending on 11 December 2013). The exercise of the
entirety of the call options might lead to dilution of Saverex’s
shareholding below 50% of the capital of EXMAR NV. According
to the notification SA Sofina holds 1.34% of the shares in EXMAR NV.
• that EXMAR NV holds 5.11% of the shares, that is 3,037,642
shares.
Acquisition of own shares: On 19 May 2009, the extraordinary
general meeting of shareholders authorised the Board of Directors of
EXMAR NV to acquire own shares within a well-defined price range
during a period of five years.
The press release dated 1 September 2010, drawn up in conformity
with Article 207.2 of the Royal Decree of 30 January 2001 amended
by the Royal Decree of 26 April 2009, states that EXMAR NV
purchased additional shares so that EXMAR NV owned 3,332,642
shares on the date of the press release, which is equivalent to
5.60%.
Shareholding as per 31 March 2011
Saverex = 54.49%
Exmar = 5.60 %
Sofina = 1.30%
Third parties = 38.61%
The act on takeover bids (Act of 1 April 2007)
In accordance with Article 74.6 Saverex NV notified the CBFA on 15
October 2007 (update on 23 August 2010) that it holds more than
30% of the securities with voting rights in EXMAR, a stock exchange
listed company.
The statutory information was announced on the website (www.
exmar.be) in accordance with the Transparency Act of 2 May 2007.
Shareholders agreementsThe company has no knowledge of any agreements made between
shareholders.
There are no statutory restrictions for transfer of shares.
110381 EXMAR JAARVERSLAG FINANCIEEL ENG.indd 11 28/04/11 14:24

12
Mr Vlerick will no longer be considered an independent director
starting from the annual shareholders meeting of 17 May 2011, given
that he has fulfilled three successive mandates as an independent
director.
Provided that his reappointment as a director of the company is
approved at the next annual shareholders meeting, Mr Vlerick
will remain a member of the Audit Committee as a non-executive
director.
All members of the Audit Committee are experienced in financial re-
porting, accountancy standards and risk on the basis of their careers
and current professional activities. Because of their degrees and
careers in various multinational groups all members are considered
to possess the necessary expertise with regard to accounting and
auditing.
Functioning of the Audit CommitteeThe specific responsibilities are set out in an audit charter. This audit
charter is updated by the Audit Committee.
There were four meetings in 2010, each one attended by all the
members, except for Mr Ludwig Criel, who was absent from one
meeting (1 December 2010). The statutory auditor was present at two
meetings. The internal auditors were present at two meetings.
The quarterly, half-yearly and annual figures were analysed and
discussed at these meetings before they were presented to the Board
of Directors.
The Audit Committee furthermore looked closely at specific financial
matters and recommendations to the Board of Directors.
Other points on the agenda included the internal audit, valuation
rules and cash flow projections.
Nomination and remuneration committeeThe Nomination and remuneration committee of EXMAR NV is
composed of three members, of whom at least half are independent
directors.
Composition Baron Philippe Bodson Chairman (independent director) 2012
Ludwig Criel Non-executive director 2011
Baron Philippe Vlerick Independent director 2011
Mr Vlerick will no longer be considered an independent director star-
ting from the general shareholders meeting on 17 May 2011, given
that he has fulfilled three successive mandates as an independent
director.
Mr. Jens Ismar was appointed to the Nomination and remuneration
committee to replace Mr Vlerick by a decision of the Board of
Directors on 31 March 2011.
BOARD OF DIRECTORS AND COMMITTEES
Board of DirectorsThe Board of Directors of NV EXMAR is composed of 11 members.
Composition Baron Philippe Bodson Chairman (independent director) 2012
Nicolas Saverys CEO (executive director) 2012
Leo Cappoen Non-executive director 2013
Ludwig Criel Non-executive director 2011
Patrick De Brabandere COO (executive director) 2012
François Gillet Independent director 2013
Jens Ismar Independent director 2013
Philippe van Marcke de Lummen
Independent director 2012
Guy Verhofstadt Independent director 2013
Baron Philippe Vlerick Independent director 2011
NV Saverex represented by Mw Pauline Saverys
Non-executive director 2012
The Board of Directors is composed of members from diverse profes-
sional backgrounds who have a wide range of experience.
The Nomination and remuneration committee will follow up
recommendations for greater gender diversity as regards future
appointments within the Board of Directors.
The Board of Directors investigates and evaluates its own perfor-
mance as described in the Corporate Governance Charter. The Board
of Directors formulates and evaluates the requirements regarding
independence, skills and qualifications at regular intervals with the
help of the Nomination and Remuneration Committee.
Functioning of the Board of DirectorsIn principle the Board of Directors holds five planned meetings every
year. Additional meetings are held if specifically required. Additional
meetings are convened in due time and the directors receive a work
file as preparation on every occasion.
There were six meetings in 2010; each presided over by Mr Bodson.
There was a total of three apologies at these meetings during the
financial year, namely from Mr Philippe van Marcke de Lummen (1),
Mr Jens Ismar (1) and Mr Leo Cappoen (1).
Aside from the subjects dictated by law – closing of the accounts,
the annual and the half year report, preparing press releases or
preparing the annual general meetings – EXMAR’s board delibera-
ted, among other things, on the following items: company strategy
and structure, budgets, interim results and forecasts, survey of
the day-to-day affairs of the major subsidiaries, investments and
disinvestments in fixed assets and participating interests, portfolio
and cash flow, fleet and acquisition and sale of own shares, and the
strategy and developments per division.
One meeting specifically dealt with the Teekay transaction, whereby
50% of two LNG tankers was sold, as well as the decision to pay an
interim dividend.
All decisions of the board are taken in accordance with Article 22 of
the by-laws, which inter alia states that the chairman has a casting
vote in case of a deadlock. Until now this has not been necessary.
Evaluation processThe effectiveness of the Board of Directors is crucial for the success
of the group, and therefore the Board of Directors will carry out a
fundamental evaluation of its functioning and the functioning of the
committees as well as the interaction with the Executive Committee.
At the meeting of the Board of Directors held on 1 December 2010
it was decided from that time to organise a discussion with the
non-executive directors at every meeting of the Board of Directors,
in the absence of the CEO and other executive directors in order to
evaluate their reciprocal communication with the executive directors
and the members of the Executive Committee.
The Board of Directors instituted an evaluation process in 2011
to assess the effectiveness of the board and of the committees,
whereby the chairman of the Board of Directors will organise an
evaluation on the basis of an extensive individual questionnaire.
The questionnaire will concern the collective performance of the
board and the individual contributions of the directors.
Part of the questionnaire is intended for the evaluation of the
committees.
The questionnaire includes at least the following elements:
- the effectiveness of Board of Directors/committees
- the information provided to the Board of Directors/committees
- self-evaluation (individual)
- mutual relations with the various committees.
A report will be drawn up on the evaluation and this will be
discussed at meetings of the Board of Directors.
The purpose of the evaluation is to improve the effectiveness of the
board as a whole.
Audit CommitteeThe Audit Committee of EXMAR NV complies with Article 526bis of
the Companies Code.
The Audit Committee of EXMAR NV is composed of four members,
of whom at least one is an independent director.
Composition Ludwig Criel Chairman (non-executive director) 2011
Baron Philippe Bodson Independent director 2012
François Gillet Independent director 2013
Baron Philippe Vlerick Independent director 2011
110381 EXMAR JAARVERSLAG FINANCIEEL ENG.indd 12 28/04/11 14:24

13
Mr Vlerick will no longer be considered an independent director
starting from the annual shareholders meeting of 17 May 2011, given
that he has fulfilled three successive mandates as an independent
director.
Provided that his reappointment as a director of the company is
approved at the next annual shareholders meeting, Mr Vlerick
will remain a member of the Audit Committee as a non-executive
director.
All members of the Audit Committee are experienced in financial re-
porting, accountancy standards and risk on the basis of their careers
and current professional activities. Because of their degrees and
careers in various multinational groups all members are considered
to possess the necessary expertise with regard to accounting and
auditing.
Functioning of the Audit CommitteeThe specific responsibilities are set out in an audit charter. This audit
charter is updated by the Audit Committee.
There were four meetings in 2010, each one attended by all the
members, except for Mr Ludwig Criel, who was absent from one
meeting (1 December 2010). The statutory auditor was present at two
meetings. The internal auditors were present at two meetings.
The quarterly, half-yearly and annual figures were analysed and
discussed at these meetings before they were presented to the Board
of Directors.
The Audit Committee furthermore looked closely at specific financial
matters and recommendations to the Board of Directors.
Other points on the agenda included the internal audit, valuation
rules and cash flow projections.
Nomination and remuneration committeeThe Nomination and remuneration committee of EXMAR NV is
composed of three members, of whom at least half are independent
directors.
Composition Baron Philippe Bodson Chairman (independent director) 2012
Ludwig Criel Non-executive director 2011
Baron Philippe Vlerick Independent director 2011
Mr Vlerick will no longer be considered an independent director star-
ting from the general shareholders meeting on 17 May 2011, given
that he has fulfilled three successive mandates as an independent
director.
Mr. Jens Ismar was appointed to the Nomination and remuneration
committee to replace Mr Vlerick by a decision of the Board of
Directors on 31 March 2011.
All members of the Nomination and remuneration committee have
the necessary expertise in the domain of remuneration policy based
on their degrees and their careers.
Functioning of the Nomination and remuneration committeeThe Nomination and remuneration committee met four times during
the past year. All members were present at every meeting, except for
Mr Criel who was absent from the meeting on 1 December.
The meetings dealt with the remuneration policy and the share
option plans. Proposals were also drawn up regarding appointment
and reappointment of directors.
The committee also investigated the composition of the Board of
Directors and the various committees and the independence criteria.
The Nomination and remuneration committee set up an evaluation
system for the Board of Directors and the committees.
The committee has taken cognisance of the law for strengthening
corporate governance in listed companies and will implement this
law from the financial year starting on 1 January 2011.
Executive Committee - CEOThe Board of Directors has delegated its management powers to
an Executive Committee in accordance with article 524bis of the
provisions of the Company Code.
As on 31 December 2010 the Executive Committee had 8 members.
Mr David LIM was appointed a member of the Executive Committee
at the board meeting on 1 December 2010.
Composition Nicolas Saverys Chief Executive Officer (CEO)
Patrick De Brabandere Chief Operating Officer (COO)
Pierre Dincq Managing Director Shipping
Didier Ryelandt Chief Financial Officer (CFO)
Paul Young Chief Marketing Officer
Marc Nuytemans CEO Exmar Shipmanagement
Bart Lavent Director LNG Upstream and Downstream
David Lim Managing Director Exmar Offshore
The Executive Committee meets on a regular basis. The CEO chairs
the meetings of the Executive Committee.
Functioning of the Executive CommitteeThe role of EXMAR’s Executive Committee consists of leading
EXMAR according to the values, strategies, policies, timetables and
budgets set by the Board of Directors.
Within the framework of the exercise of their role, the day-to-day
management is responsible for compliance with all relevant
legislation and regulations.
110381 EXMAR JAARVERSLAG FINANCIEEL ENG.indd 13 28/04/11 14:24

14
Remuneration policy General principleEXMAR strives for remuneration which will attract, retain and
motivate the members of the Board of Directors and members of
the Executive Committee and which will guarantee and promote the
company’s interests in the medium and longer term.
With this policy EXMAR attempts to ensure that the members of the
Board of Directors and members of the Executive Committee do not
act in their own interests, and do not take risks that do not fit in with
the company’s strategy and risk profile.
ApplicationNon-executive directors
The remuneration of non-executive directors consists of a fixed
non performance-related annual remuneration which is linked to
the director’s position and positions on the various committees, in
accordance with the company’s remuneration policy. Non-executive
directors do not receive any variable remuneration and do not
benefit from additional pension plans or share-related incentives.
The Nomination and remuneration committee regularly checks the
remuneration of non-executive directors for compliance with market
practices.
Executive directors
The mandate of executive directors who are members of the
Executive Committee is remunerated according to the remuneration
criteria for the Executive Committee following recommendations
from the Nomination and remuneration committee.
Executive Committee
The remuneration of the members of the Executive Committee
including the CEO consists of a fixed and a variable component.
The scale of the fixed remuneration for members of the Executive
Committee, including the executive directors, depends on their
position and the responsibilities related to their position.
The variable payment depends on the company’s results, as well
as on other factors such as the performance of the individual, future
prospects, the market situation, exceptional contribution(s) and/or
special projects. (see point 4.4)
The remuneration is determined on the basis of the remunerations of
a reference group consisting of a number of comparable enterprises
in the maritime industry. The Nomination and remuneration commit-
tee can, if necessary, call on an independent external consultant.
Once a year the various compensation components for the members
of the Executive Committee (including the CEO) are evaluated by
the Nomination and remuneration committee and tested against
conditions in the market.
SupervisionSecretary/compliance officerMr Karel Stes, appointed on 1 January 2009.
External auditThe company’s statutory auditors are KPMG company auditors
CVBA, represented by Mr Filip De Bock and Mr Serge Cosijns. The
statutory auditor conducts the external audit (of both consolidated
and statutory figures) of EXMAR NV, and reports to the Board of
Directors twice a year.
The statutory auditor was reappointed at the ordinary general
meeting held on 19 May 2009 for a new period of three years,
which will end at the general meeting in 2012.
Internal auditThe company is assisted by Ernst & Young in the exercise of its
internal audit activities. These internal auditors were reappointed
by the Audit Committee meeting on 31 March 2010 for a new
period of three years, ending with the Audit Committee meeting
in March 2013.
This reappointment was confirmed by the Board of Directors on
31 March 2010.
TRANSACTIONS BETWEEN PARTIES AND CONFLICTS OF INTEREST
Transactions between related partiesEach director and each member of the Executive Committee is
encouraged to organise his personal and business interests in such
a way that there is no direct or indirect conflict of interest with the
Company. EXMAR is not aware of any potential conflict of interest
affecting members of the Board of Directors or the Executive
Committee between their duties for the Company and their private
and/or other duties. The company’s Corporate Governance Charter
requires that every transaction between the company (or any
of its subsidiaries) and any director or member of the Executive
Committee must first be approved by the Board of Directors,
regardless of whether such a transaction is or is not subject to the
applicable statutory regulations. Such a transaction is only possible
on the basis of conditions in accordance with market practices.
Conflicts of interest and directorsIn accordance with Article 523 of the Belgian Companies Code, the
Board of Directors is required to follow a special procedure if one or
more directors potentially have a conflict of interest with one or more
decisions or transactions coming under the competence of the Board
of Directors.
The provisions of the Companies Code shall apply in the event of a
conflict of interest.
A conflict of interest occurred within the Board of Directors during the
approval of the share option plan. A full description can be found in
the Board of Director’s annual report.
Transactions with related companiesArticle 524 of the Belgian Companies Code provides for a special
procedure applicable to transactions within a group or transactions
with related companies. This procedure applies to decisions and
transactions between the company and related companies that are
not subsidiaries of the company.
The provisions of the Companies Code shall apply in the event of
transactions with related companies.
As explained in the Corporate Governance Charter, Saverbel NV, a
company controlled by Nicolas Saverys CEO, provides administra-
tive services to the EXMAR group. These services are charged at cost
and are at arms' length.
REMUNERATION REPORT
GeneralThe Remuneration Report describes EXMAR’s remuneration policy
as provided for in the legislation of 6 April 2010 in relation to
Corporate Governance.
The remuneration policy and the individual scheme for members of
the Board of Directors and members of the Executive Committee will
be brought into line with the aforementioned legislation.
Description of the procedures to develop the remuneration policy as well as to determine the remuneration of individual directors and members of the Executive CommitteeThe nomination and remuneration committee is responsible for
deciding the procedure for developing a remuneration policy.
The remuneration amounts for non-executive directors were revised
and approved by the shareholders meeting most recently in 2006.
The nature and the amounts of the remuneration awarded to
executive directors and the members of the Executive Committee are
decided by the Board of Directors on the basis of recommendations
from the nomination and remuneration committee.
The Board of Directors decides on the plans for granting stock
options, on the basis of recommendations from the nomination and
remuneration committee.
110381 EXMAR JAARVERSLAG FINANCIEEL ENG.indd 14 28/04/11 14:24

15
Remuneration policy General principleEXMAR strives for remuneration which will attract, retain and
motivate the members of the Board of Directors and members of
the Executive Committee and which will guarantee and promote the
company’s interests in the medium and longer term.
With this policy EXMAR attempts to ensure that the members of the
Board of Directors and members of the Executive Committee do not
act in their own interests, and do not take risks that do not fit in with
the company’s strategy and risk profile.
ApplicationNon-executive directors
The remuneration of non-executive directors consists of a fixed
non performance-related annual remuneration which is linked to
the director’s position and positions on the various committees, in
accordance with the company’s remuneration policy. Non-executive
directors do not receive any variable remuneration and do not
benefit from additional pension plans or share-related incentives.
The Nomination and remuneration committee regularly checks the
remuneration of non-executive directors for compliance with market
practices.
Executive directors
The mandate of executive directors who are members of the
Executive Committee is remunerated according to the remuneration
criteria for the Executive Committee following recommendations
from the Nomination and remuneration committee.
Executive Committee
The remuneration of the members of the Executive Committee
including the CEO consists of a fixed and a variable component.
The scale of the fixed remuneration for members of the Executive
Committee, including the executive directors, depends on their
position and the responsibilities related to their position.
The variable payment depends on the company’s results, as well
as on other factors such as the performance of the individual, future
prospects, the market situation, exceptional contribution(s) and/or
special projects. (see point 4.4)
The remuneration is determined on the basis of the remunerations of
a reference group consisting of a number of comparable enterprises
in the maritime industry. The Nomination and remuneration commit-
tee can, if necessary, call on an independent external consultant.
Once a year the various compensation components for the members
of the Executive Committee (including the CEO) are evaluated by
the Nomination and remuneration committee and tested against
conditions in the market.
RemunerationsThe following information concerns the remuneration policy valid up
to and including 31 December 2010.
Board of Directors The directors receive a fixed annual remuneration of EUR 50,000.
Because of his role and responsibility, the chairman receives a
higher annual fixed remuneration of EUR 100,000. The directors
who were part of the Executive Committee have waived this
remuneration. Mr Leo Cappoen has also waived this remuneration
with effect from 18 May 2010.
No variable remunerations, share options, additional pension plans,
loans or advance payments were granted to the non-executive and
independent directors.
Audit CommitteeThe members of the Audit Committee receive a fixed annual
remuneration of EUR 10,000. The chairman receives a remuneration
of EUR 20,000.
Nomination and remuneration committeeThe members of the Nomination and remuneration committee
receive a fixed annual remuneration of EUR 10,000.
Executive CommitteeSix members of the Executive Committee (including the CEO) have
self-employed status. Except for Lara Consult BVBA, represented by
Mr Bart Lavent, they have no entitlement to any form of redundancy
payment in the event of termination of their appointment.
The length of the notice period for Lara Consult BVBA complies with
statutory provisions.
Mr. Paul C. Young is employed with an employment agreement
under United States law.
The remuneration package of the members of the Executive
Committee consists of:
Basic salary
The basic salary is the key component in the remuneration package
and depends on the responsibility and competencies.
It serves as a yardstick for determining the short- and long-term
remuneration.
Performance-related short-term remuneration
The short-term remuneration (annual bonus) rewards members of
the Executive Committee for achieving performance criteria and the
amount is expressed as a percentage of the fixed annual remunera-
tion. The evaluation period is the financial year.
The variable remuneration is linked for 60% to developments in
the results, where various weightings are used for the recurrent
110381 EXMAR JAARVERSLAG FINANCIEEL ENG.indd 15 28/04/11 14:24

16
and non-recurrent parts of the results. The remaining 40% is linked
to the specific evaluation and the performance of each individual.
This evaluation can result in a maximum increase of 50% in relation
to the previous year.
The Board of Directors can deviate from this and decide to award a
bonus to a member of the Executive Committee on the basis of other
objective criteria.
If the result deviates substantially from the basis on which the
variable remuneration of the members of the Executive Committee
is calculated, the Board of Directors can decide to revise the variable
part of the remuneration and if need be to reclaim that part.
The ratio between the fixed and variable part of the remuneration for
members van the Executive Committee was as follows in 2010:
Chairman of the Executive Committee (CEO)
Basic salary 58%
Variable remuneration 42%
Other members of the Executive Committee
Basic salary 68%
Variable remuneration 32%
Performance-related long-term remuneration
EXMAR works towards creation of sustainable economic value by
means of long-term remuneration. This ensures that the interests of
the members of the Executive Committee are more in line with those
of shareholders and that they remain bound to the company.
The long-term remuneration consists of a share option plan for
existing EXMAR shares.
The options can only be exercised after a period of 3 years.
In the event that a member of the Executive Committee resigns or is
dismissed for compelling reasons by EXMAR the right to exercise the
options lapses.
Insurance package
The members of the Executive Committee with self-employed
or employed status benefit from group insurance (type individual
pension benefits for the self-employed) as well as guaranteed
income insurance, accident insurance, hospitalisation insurance and
travel insurance.
Other compensation components
The members of the Executive Committee receive a company car,
a cell phone and meal cheques.
Information about the remuneration policy for the coming two financial years (2011-2012)No significant changes will be made to the remuneration policy in
2011 and 2012. The Board of Directors will submit a resolution for
approval to the next General Shareholders Meeting held in May 2011
in relation to a deviation from the projected spreading of the variable
remuneration over longer performance periods.
Overview of the remuneration of the chairman of the Executive Committee (CEO)
IN EUROS YearBasic salary
Short-term remuneration
Value of share options
Insurancepackage*
Other benefits**
Total remunerations
Nicolas Saverys 2010 660,000 400,000 9,000 53,082 tba 1,182,082
2009 660,000 - 137,400 53,082 tba 850,482
2008 600,007 100,000 28,732 51,182 tba 779,921
Overview of the remuneration of the other members of the Executive Committee
IN EUROS YearBasic salary
Short-term remuneration
Value of share options
Insurancepackage*
Other benefits**
Total remunerations
Average 6 2010 2,137,123 792,500 218,500 159,079 tba 3,307,202
# persons 5.25 2009 1,503,751 - 412,200 177,415 tba 2,093,366
6 2008 1,617,580 447,500 66,700 210,608 tba 2,342,388
* managers insurance, guaranteed income insurance, accident insurance,
hospitalisation insurance, travel insurance
** car and cell phone
No loans or advance payments were awarded to the members of the Executive Committee in 2010, other than a loan with interest granted to
Mr. Paul Young, of which the outstanding amount was USD 232,287.50 on 31 December 2010.
Shares, share options and other rights in connection with shares The members of the Executive Committee benefit from the share option plan approved by the Board of Directors on 1 December 2010.
The total number of options awarded to members of the Executive Committee since 15 December 2004 is as follows:
The share options were issued in accordance with the provisions of the Law of 26 March 1999 regarding the Belgian Employment Action
Plan for 1998 and laying down miscellaneous provisions, as amended by the Programme Law of 24 December 2002.
IN EUROSFixed remuneration
Audit CommitteeRemuneration
RemunerationCommittee Remuneration
Total
Baron Philippe Bodson Chairman 100,000 10,000 10,000 120,000
Nicolas Saverys CEO - - - 0
Patrick De Brabandere COO - - - 0
Leo Cappoen non-executive Director 16,666 16,666
Ludwig Criel non-executive Director 50,000 20,000 80,000
François Gillet non-executive Director 50,000 10,000 60,000
Jens Ismar non-executive Director 30,940 30,940
Philippe van Marcke de Lummen non-executive Director 50,000 50,000
Baron Philippe Vlerick non-executive Director 50,000 10,000 70,000
NV Saverex non-executive Director 50,000 50,000
Marc Saverys non-executive Director 19,161 19,161
Guy Verhofstadt non-executive Director 30,940 30,940
Total 447,707 50,000 30,000 527,707
Information about the remuneration per individual director on a consolidated basis
IN EUROS Outstandingas per 31/12/2009
Awardedin 2010
Exercised in 2010
Outstanding as per 31/12/2010
Nicolas Saverys 155,061 60,000 0 215,061
Patrick De Brabandere 112,397 40,000 0 152,397
Pierre Dincq 70,133 30,000 0 100,133
Paul Young 72,494 30,000 0 102,494
Didier Ryelandt 52,663 30,000 0 82,663
Marc Nuytemans 30,000 30,000 0 60,000
Bart Lavent 20,000 30,000 0 50,000
512,748 250,000 0 762,748
110381 EXMAR JAARVERSLAG FINANCIEEL ENG.indd 16 28/04/11 14:24

17
Overview of the remuneration of the chairman of the Executive Committee (CEO)
IN EUROS YearBasic salary
Short-term remuneration
Value of share options
Insurancepackage*
Other benefits**
Total remunerations
Nicolas Saverys 2010 660,000 400,000 9,000 53,082 tba 1,182,082
2009 660,000 - 137,400 53,082 tba 850,482
2008 600,007 100,000 28,732 51,182 tba 779,921
Overview of the remuneration of the other members of the Executive Committee
IN EUROS YearBasic salary
Short-term remuneration
Value of share options
Insurancepackage*
Other benefits**
Total remunerations
Average 6 2010 2,137,123 792,500 218,500 159,079 tba 3,307,202
# persons 5.25 2009 1,503,751 - 412,200 177,415 tba 2,093,366
6 2008 1,617,580 447,500 66,700 210,608 tba 2,342,388
* managers insurance, guaranteed income insurance, accident insurance,
hospitalisation insurance, travel insurance
** car and cell phone
No loans or advance payments were awarded to the members of the Executive Committee in 2010, other than a loan with interest granted to
Mr. Paul Young, of which the outstanding amount was USD 232,287.50 on 31 December 2010.
Shares, share options and other rights in connection with shares The members of the Executive Committee benefit from the share option plan approved by the Board of Directors on 1 December 2010.
The total number of options awarded to members of the Executive Committee since 15 December 2004 is as follows:
The share options were issued in accordance with the provisions of the Law of 26 March 1999 regarding the Belgian Employment Action
Plan for 1998 and laying down miscellaneous provisions, as amended by the Programme Law of 24 December 2002.
IN EUROSFixed remuneration
Audit CommitteeRemuneration
RemunerationCommittee Remuneration
Total
Baron Philippe Bodson Chairman 100,000 10,000 10,000 120,000
Nicolas Saverys CEO - - - 0
Patrick De Brabandere COO - - - 0
Leo Cappoen non-executive Director 16,666 16,666
Ludwig Criel non-executive Director 50,000 20,000 80,000
François Gillet non-executive Director 50,000 10,000 60,000
Jens Ismar non-executive Director 30,940 30,940
Philippe van Marcke de Lummen non-executive Director 50,000 50,000
Baron Philippe Vlerick non-executive Director 50,000 10,000 70,000
NV Saverex non-executive Director 50,000 50,000
Marc Saverys non-executive Director 19,161 19,161
Guy Verhofstadt non-executive Director 30,940 30,940
Total 447,707 50,000 30,000 527,707
Information about the remuneration per individual director on a consolidated basis
IN EUROS Outstandingas per 31/12/2009
Awardedin 2010
Exercised in 2010
Outstanding as per 31/12/2010
Nicolas Saverys 155,061 60,000 0 215,061
Patrick De Brabandere 112,397 40,000 0 152,397
Pierre Dincq 70,133 30,000 0 100,133
Paul Young 72,494 30,000 0 102,494
Didier Ryelandt 52,663 30,000 0 82,663
Marc Nuytemans 30,000 30,000 0 60,000
Bart Lavent 20,000 30,000 0 50,000
512,748 250,000 0 762,748
110381 EXMAR JAARVERSLAG FINANCIEEL ENG.indd 17 28/04/11 14:24

18
INTERNAL CONTROL AND RISK MANAGEMENT SYSTEMS
GeneralThe responsibilities of the Board of Directors include developing a
framework for internal control and risk management systems and
to assess the implementation of this framework, while taking into
account the recommendations of the Audit Committee.
It is up to the Board of Directors to decide on the values and strategy
of the company, with the assistance of the Executive Committee,
which verifies and manages these systems. The EXMAR control and
risk management system covers policy, identification processes,
evaluation, management and follow-up of business and financial risks.
Components of the risk management and internal control systemsThe control environmentThe main features of the control and risk management systems can
be summarised as follows:
• defining business ethics and the various objectives;
• protecting the company's assets;
• ensuring the accuracy and reliability of the accounts;
• optimising the efficiency of the various operations;
• safeguarding follow-up of policy decisions;
• guaranteeing the reliability and completeness of the information
system;
• permanent monitoring of activities, operating results and financial
positions;
• following up exchange risks and interest risks;
• discussing rules to prevent market abuse and compliance with
the compliance officer;
• establishing the company’s policies and procedures for compli-
ance with applicable legislation and regulations.
The risk management process and control activitiesThe internal controls and risk management systems are constantly
updated and have been designed, among other things, to uncover,
eliminate and prevent errors and anomalies in the financial
accounts. Although risks can never be entirely excluded, the internal
control and risk management systems are meant to offer sufficient
certainty that material errors and anomalies will be detected.
The Board of Directors is assisted in this respect by:
The Compliance Officer
The Compliance Officer is appointed and charged with monitoring
and ensuring compliance with policy regarding insider trading and
market manipulation by directors and members of the Executive
Committee as well as other persons who have access to inside
information.
Audit Committee
The Audit Committee, set up within the Board of Directors,
checks on the accuracy of the financial information published
by the company. It also audits and manages the control and risk
management systems set up by the Executive Committee.
The committee ensures that the external audit reflects the needs of
the Group and guarantees compliance with the policy on indepen-
dence of external auditors.
The committee is also responsible for follow-up of questions and
recommendations emanating from the external auditors.
The committee is the point of contact for both the internal and the
external audits.
Internal audit
The internal auditors have the following objectives:
• ensuring the effectiveness and efficiency of the operational activi-
ties, for example, compliance with restrictions on authorities;
• reliability of financial reporting, both internal and external;
• compliance with statutory provisions and regulations.
An internal audit system has been developed that examines these
policies on a regular basis.
Such a system needs to be continuously managed and adjusted
where an organisation operates in an environment with variable
risk factors. The internal auditors need to flag up shortcomings and
report these to the management, so the necessary measures can
be taken. The internal auditors report to the Audit Committee, which
verifies and guarantees the effectiveness and independence of the
auditors. The EXMAR Group has appointed Ernst & Young as the
Group’s internal auditors.
External auditors
As is required by law, the external auditors verify the financial results
of the company, the annual accounts and compliance with Belgian
legislation.
The external auditors report directly to the Audit Committee and
to the Board of Directors. They are directly in contact with the
chairman of the Audit Committee and if need be the chairman of the
Board of Directors.
At least twice every year they will issue a report to the Audit
Committee in which they will present their findings on the financial
results or any irregularities.
The external auditors are invited to attend every general meeting
of shareholders, where they present their report on the annual
accounts as well as any other report required by law in the case
of certain transactions or under certain circumstances. The Audit
Committee monitors the external auditors in the performance of
their duties. They must moreover comply with Belgian company
laws and the relevant Royal Decrees, the International Audit
Standards, the rules of the Belgian Institute of Auditors and all other
applicable laws and regulations.
110381 EXMAR JAARVERSLAG FINANCIEEL ENG.indd 18 28/04/11 14:24

19
Communication and fine-tuningEXMAR operates in a dynamic environment with variable risk
factors, so the internal audit process is constantly managed and
fine-tuned.
Shortcomings that could impact on the achievement of the
company’s objectives are flagged up and reported to the Executive
Committee, to ensure the right measures can be taken.
The Audit Committee has important responsibilities in relation to
assessing the effectiveness of the internal risk and control system,
the findings of internal investigations and the findings of the
Executive Committee when weaknesses are identified.
The effectiveness of the control system set up by the Executive
Committee is assessed at least once a year.
The Audit Committee investigates whether the necessary policy
measures have been implemented to ensure that risks affecting the
company are identified.
To be able to perform this responsibility correctly, the Audit
Committee receives the necessary information from the Executive
Committee in relation to the risks, policy measures, procedures and
checks concerning the integrity of the financial reporting
The Audit Committee has a good understanding of the control
system so it can make recommendations to the Board of Directors in
relation to weaknesses in controls.
All important aspects and improvements are discussed and reported
to the Board of Directors. Moreover the Audit Committee regularly
reports to the Board of Directors.
Financial reportingThe main features of the intern control and risk management in
relation to financial reporting are as follows:
• Periodic closing and the existing reporting checklist, which
guarantees the following items:
- Communication of timelines
- Clear distribution and assignment of tasks and responsibilities
• The existence of financial and accounting instructions for the
various accounting sections;
• An accounting team that is responsible for compiling figures
(closing entries, reconciliations, etc.) while the management
checks the figures for their values, based on:
- Consistency tests by means of comparisons with historical and
budget figures
- Random samples of transactions depending on their material
relevance
• Monthly reporting and dashboard to the Executive Committee
and the Board of Directors;
• Periodic reporting to the Audit Committee on all material
areas in the financial statements concerning critical accounting
assessments and accounting uncertainties.
Main risks for EXMAR Group The main risk factors for the EXMAR Group can be described as
follows:
Strategic risks
Risks concerning market dynamics
The worldwide transportation of gas (either LNG or LPG) or of any
other products that are carried on board the EXMAR fleet entails a
certain risk, either due to the nature of the goods being transported
or the potential implications of the overall political environment in
foreign countries.
EXMAR’s activities are situated in a worldwide context. The LPG and
LNG loads are transported from and to politically unstable regions.
Changing economic, legal and political circumstances in some
countries, including political, civil and military conflicts from time
to time result in attacks on ships, and disruption to waterways and
shipping due to mines, piracy, terrorism and other activities. Terrorist
acts, regional hostilities or other political instability may disrupt LPG
and LNG trading patterns resulting in reduced income or increased
costs. EXMAR may also be obliged to incur additional or unexpected
expenses to comply with changed laws or regulations in countries
where our ships are active.
Market risks
EXMAR’s operating results depend on whether or not profitable time
charters and journey charters can be concluded and/or renewed.
Notwithstanding significant cargo coverage, EXMAR is exposed to
the volatility of the markets for the transportation of LPG and am-
monia as well as underlying freight tariffs. Moreover, these markets
affect the value of the fleet, which is a key element supporting some
of EXMAR's financings through Asset Protection clauses. As per 31
December 2010, EXMAR is in compliance with these clauses. The
carrying values of our vessels may not represent their fair market
value since the market prices of second-hand vessels tend to
fluctuate with changes in charter rates and the cost of new buildings.
Historically, both charter rates and vessel values tend to be cyclical.
While the LPG rates (mainly for VLGC’s) in the recent past have not
been satisfactory, the company is of the opinion that the cash flows
generated from the continuing use of the fleet, calculated using
internal models and assumptions, continue to support the carrying
values as at the date of this report. Although management believes
that these calculations provide a reliable basis for their current
assessment, there are many factors that are outside the control of
the company which may influence future profitability if the market
conditions would deteriorate.
The company will continue to closely monitor the market evolution
in the different segments in which it operates in order to assess
whether a deterioration of the market conditions would impact the
book value of its fleet.
110381 EXMAR JAARVERSLAG FINANCIEEL ENG.indd 19 28/04/11 14:24
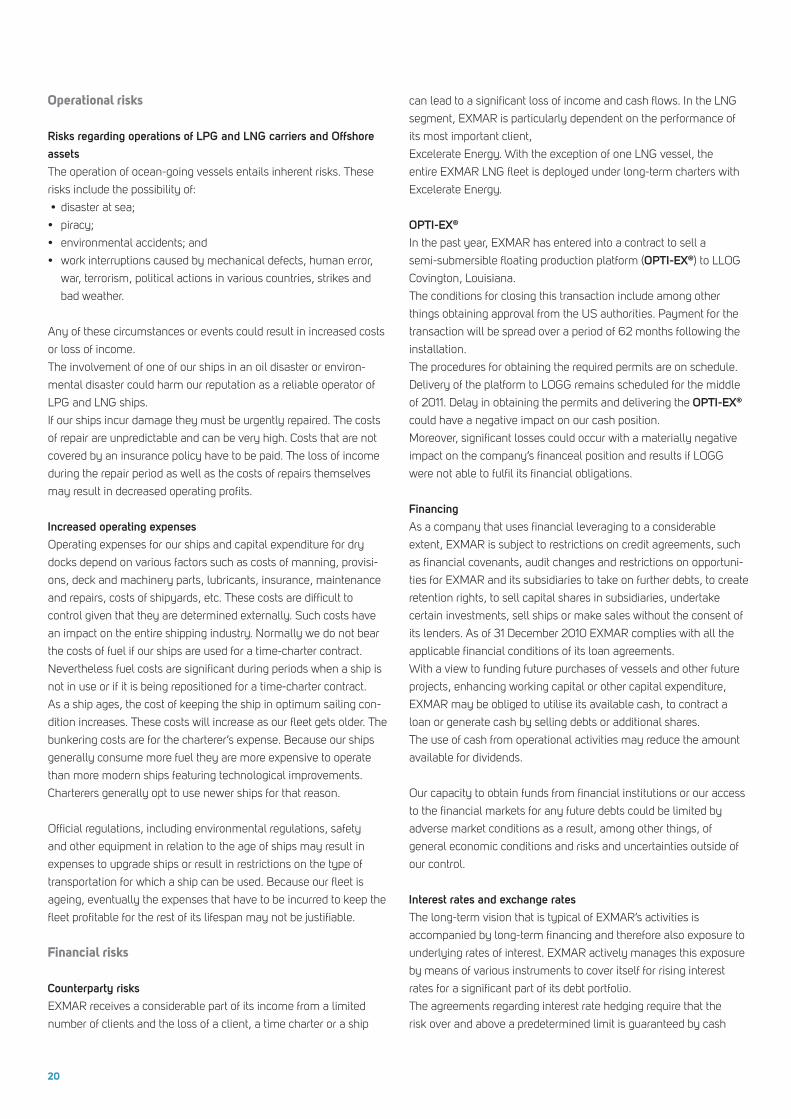
20
Operational risks
Risks regarding operations of LPG and LNG carriers and Offshore
assets
The operation of ocean-going vessels entails inherent risks. These
risks include the possibility of:
• disaster at sea;
• piracy;
• environmental accidents; and
• work interruptions caused by mechanical defects, human error,
war, terrorism, political actions in various countries, strikes and
bad weather.
Any of these circumstances or events could result in increased costs
or loss of income.
The involvement of one of our ships in an oil disaster or environ-
mental disaster could harm our reputation as a reliable operator of
LPG and LNG ships.
If our ships incur damage they must be urgently repaired. The costs
of repair are unpredictable and can be very high. Costs that are not
covered by an insurance policy have to be paid. The loss of income
during the repair period as well as the costs of repairs themselves
may result in decreased operating profits.
Increased operating expenses
Operating expenses for our ships and capital expenditure for dry
docks depend on various factors such as costs of manning, provisi-
ons, deck and machinery parts, lubricants, insurance, maintenance
and repairs, costs of shipyards, etc. These costs are difficult to
control given that they are determined externally. Such costs have
an impact on the entire shipping industry. Normally we do not bear
the costs of fuel if our ships are used for a time-charter contract.
Nevertheless fuel costs are significant during periods when a ship is
not in use or if it is being repositioned for a time-charter contract.
As a ship ages, the cost of keeping the ship in optimum sailing con-
dition increases. These costs will increase as our fleet gets older. The
bunkering costs are for the charterer’s expense. Because our ships
generally consume more fuel they are more expensive to operate
than more modern ships featuring technological improvements.
Charterers generally opt to use newer ships for that reason.
Official regulations, including environmental regulations, safety
and other equipment in relation to the age of ships may result in
expenses to upgrade ships or result in restrictions on the type of
transportation for which a ship can be used. Because our fleet is
ageing, eventually the expenses that have to be incurred to keep the
fleet profitable for the rest of its lifespan may not be justifiable.
Financial risks
Counterparty risks
EXMAR receives a considerable part of its income from a limited
number of clients and the loss of a client, a time charter or a ship
can lead to a significant loss of income and cash flows. In the LNG
segment, EXMAR is particularly dependent on the performance of
its most important client,
Excelerate Energy. With the exception of one LNG vessel, the
entire EXMAR LNG fleet is deployed under long-term charters with
Excelerate Energy.
OPTI-EX®
In the past year, EXMAR has entered into a contract to sell a
semi-submersible floating production platform (OPTI-EX®) to LLOG
Covington, Louisiana.
The conditions for closing this transaction include among other
things obtaining approval from the US authorities. Payment for the
transaction will be spread over a period of 62 months following the
installation.
The procedures for obtaining the required permits are on schedule.
Delivery of the platform to LOGG remains scheduled for the middle
of 2011. Delay in obtaining the permits and delivering the OPTI-EX®
could have a negative impact on our cash position.
Moreover, significant losses could occur with a materially negative
impact on the company’s financeal position and results if LOGG
were not able to fulfil its financial obligations.
Financing
As a company that uses financial leveraging to a considerable
extent, EXMAR is subject to restrictions on credit agreements, such
as financial covenants, audit changes and restrictions on opportuni-
ties for EXMAR and its subsidiaries to take on further debts, to create
retention rights, to sell capital shares in subsidiaries, undertake
certain investments, sell ships or make sales without the consent of
its lenders. As of 31 December 2010 EXMAR complies with all the
applicable financial conditions of its loan agreements.
With a view to funding future purchases of vessels and other future
projects, enhancing working capital or other capital expenditure,
EXMAR may be obliged to utilise its available cash, to contract a
loan or generate cash by selling debts or additional shares.
The use of cash from operational activities may reduce the amount
available for dividends.
Our capacity to obtain funds from financial institutions or our access
to the financial markets for any future debts could be limited by
adverse market conditions as a result, among other things, of
general economic conditions and risks and uncertainties outside of
our control.
Interest rates and exchange rates
The long-term vision that is typical of EXMAR’s activities is
accompanied by long-term financing and therefore also exposure to
underlying rates of interest. EXMAR actively manages this exposure
by means of various instruments to cover itself for rising interest
rates for a significant part of its debt portfolio.
The agreements regarding interest rate hedging require that the
risk over and above a predetermined limit is guaranteed by cash
collateral on an escrow account with the counterparty. This cash
collateral amounted to USD 39.3 million on 31 December 2010. A
fall in long-term USD interest rates will require additional guarantees.
EXMAR operates in USD but has to settle certain annual costs in
Euros. The exposure to EUR/USD is managed by means of hedging
instruments, which at the moment provide cover of approximately
20% at a fixed rate for 2011.
MARKET ABUSE
A dealing code was included in the Corporate Governance Charter
(annex 3) with a view to preventing insider trading and market
manipulation.
The purpose of this dealing code is to remind the directors of the
company and its managers, employees and other service providers
of the principal elements of the regulations on sensitive information,
insider trading, and to inform them of the orders which EXMAR
considers it necessary to draw up in this connection.
Every person involved must inform the Compliance Officer before
carrying out any transaction relating to financial instruments of
EXMAR or of any of its listed participations.
The Compliance Officer will inform that person at the time about the
existence or absence of a restricted period or prohibited period.
All persons with supervisory responsibilities (members of the Board
of Directors and of the Executive Committee),
as well as persons connected to them, must inform the CBFA of
transactions for their own account in EXMAR shares,
derivatives and all financial instruments related to these.
All transactions will be supervised by the Compliance Officer.
110381 EXMAR JAARVERSLAG FINANCIEEL ENG.indd 20 28/04/11 14:24

21
collateral on an escrow account with the counterparty. This cash
collateral amounted to USD 39.3 million on 31 December 2010. A
fall in long-term USD interest rates will require additional guarantees.
EXMAR operates in USD but has to settle certain annual costs in
Euros. The exposure to EUR/USD is managed by means of hedging
instruments, which at the moment provide cover of approximately
20% at a fixed rate for 2011.
MARKET ABUSE
A dealing code was included in the Corporate Governance Charter
(annex 3) with a view to preventing insider trading and market
manipulation.
The purpose of this dealing code is to remind the directors of the
company and its managers, employees and other service providers
of the principal elements of the regulations on sensitive information,
insider trading, and to inform them of the orders which EXMAR
considers it necessary to draw up in this connection.
Every person involved must inform the Compliance Officer before
carrying out any transaction relating to financial instruments of
EXMAR or of any of its listed participations.
The Compliance Officer will inform that person at the time about the
existence or absence of a restricted period or prohibited period.
All persons with supervisory responsibilities (members of the Board
of Directors and of the Executive Committee),
as well as persons connected to them, must inform the CBFA of
transactions for their own account in EXMAR shares,
derivatives and all financial instruments related to these.
All transactions will be supervised by the Compliance Officer.
110381 EXMAR JAARVERSLAG FINANCIEEL ENG.indd 21 28/04/11 14:24

22
EXMAR fi nancial report
22
110381 EXMAR JAARVERSLAG FINANCIEEL ENG.indd 22 28/04/11 14:24
23
1. Consolidated financial statements
Consolidated statement of financial position
Consolidated income statement
Consolidated statement of cash flows
Consolidated statement of changes in equity
Notes
1 Accounting policies
2 Segment reporting
3 Other operating income
4 Other operating expenses
5 Personnel expenses
6 Finance income/expenses
7 Income taxes
8 Vessels
9 Other property, plant and equipment
10 Intangible assets
11 Investment property
12 Equity accounted investees
13 Associated companies
14 Other investments
15 Non-current other receivables
16 Assets classifi ed as held for sale
17 Available-for-sale fi nancial assets
18 Trade and other receivables
19 Current tax assets and liabilities
20 Deferred tax assets and liabilities
21 Cash and cash equivalents
22 Share capital and reserves
23 Earnings per share
24 Borrowings
25 Share based payments
26 Employee benefi ts - defi ned benefi t plan
27 Provisions
28 Trade and other payables
29 Financial risks and fi nancial instruments
30 Operating leases
31 Capital commitments
32 Contingencies
33 Related parties
34 Group entities
35 Interest in joint ventures
36 Major exchange rates used
37 Fees statutory auditor
38 Subsequent events
Statement on the true and fair view
Report of the statutory auditor
2. Statutory accounts
23
110381 EXMAR JAARVERSLAG FINANCIEEL ENG.indd 23 28/04/11 14:25

2424
CONSOLIDATED STATEMENT OF FINANCIAL POSITION( in thousands of USD)
1 Consolidated financial statements
Note 31/12/2010 31/12/2009
ASSETS
non-cURRent assets 1,204,497 1,804,844
Vessels 8 1,166,597 1,760,537
LPG 602,118 606,160
Operational 602,118 597,709
Under construction 0 8,451
LNG 526,100 809,080
Operational 526,100 666,450
Under construction 0 142,630
Offshore 38,379 345,297
Operational 38,379 338,037
Under construction 0 7,260
Other property, plant and equipment 9 13,866 16,636
Intangible assets 10 3,260 3,708
Investment property 11 13,599 15,105
Investments in equity accounted investees 12 4,258 5,674
Other investments 14 2,417 2,423
Financial instruments 29 0 261
Other receivables 15 500 500
cURRent assets 557,046 236,647
Assets classified as held for sale 16 298,651 0
Available-for-sale financial assets 17 43,004 2,189
Financial instruments 29 341 92
Trade and other receivables 18 80,646 67,013
Current tax assets 19 4,215 2,987
Cash and cash equivalents 21 130,189 164,366
total assets 1,761,543 2,041,491
110381 EXMAR JAARVERSLAG FINANCIEEL ENG.indd 24 28/04/11 14:25

2525
Note 31/12/2010 31/12/2009
EQUITY AND LIABILITIES
total eQUitY 402,622 419,843
Equity attributable to owners of the Company 402,474 419,710
Share capital 88,812 88,812
Share premium 209,902 209,902
Reserves 89,402 77,536
Profit/loss for the period 14,358 43,460
Non-controlling interest 148 133
non-cURRent liaBilities 1,164,594 1,449,795
Borrowings 1,067,279 1,370,706
Banks 24 931,652 1,086,387
Finance leases 24 128,223 139,669
Other loans 24 7,404 144,650
Employee benefits 26 2,939 3,321
Provisions 27 3,815 4,323
Financial instruments 29 90,561 71,445
cURRent liaBilities 194,327 171,853
Borrowings 91,561 76,431
Banks 24 73,320 68,503
Finance leases 24 8,241 7,928
Bank overdrafts 21/24 10,000 0
Trade and other payables 28 102,177 94,070
Current tax liability 19 589 1,352
total eQUitY and liaBilities 1,761,543 2,041,491
CONSOLIDATED STATEMENT OF FINANCIAL POSITION( in thousands of USD)
Note 31/12/2010 31/12/2009
ASSETS
non-cURRent assets 1,204,497 1,804,844
Vessels 8 1,166,597 1,760,537
LPG 602,118 606,160
Operational 602,118 597,709
Under construction 0 8,451
LNG 526,100 809,080
Operational 526,100 666,450
Under construction 0 142,630
Offshore 38,379 345,297
Operational 38,379 338,037
Under construction 0 7,260
Other property, plant and equipment 9 13,866 16,636
Intangible assets 10 3,260 3,708
Investment property 11 13,599 15,105
Investments in equity accounted investees 12 4,258 5,674
Other investments 14 2,417 2,423
Financial instruments 29 0 261
Other receivables 15 500 500
cURRent assets 557,046 236,647
Assets classified as held for sale 16 298,651 0
Available-for-sale financial assets 17 43,004 2,189
Financial instruments 29 341 92
Trade and other receivables 18 80,646 67,013
Current tax assets 19 4,215 2,987
Cash and cash equivalents 21 130,189 164,366
total assets 1,761,543 2,041,491
The notes are an integral part of these consolidated financial statements
110381 EXMAR JAARVERSLAG FINANCIEEL ENG.indd 25 28/04/11 14:25

26
Note01/01/2010 31/12/2010
01/01/2009 31/12/2009
CONSOLIDATED INCOME STATEMENT
Revenue 413,885 403,160
Capital gain on sale of assets 3 46,902 65
Other operating income 3 3,037 7,749
Operating income 463,824 410,974
Goods and services -246,165 -250,730
Personnel expenses 5 -39,389 -38,784
Depreciations & amortisations 8/9/10/11 -89,487 -75,117
Provisions 27 508 521
Capital loss on disposal of assets -7 -1
Other operating expenses 4 -1,856 -2,374
Result from operating activities 87,428 44,489
Interest income 6 1,078 5,286
Interest expenses 6 -47,138 -51,041
Other finance income 6 6,024 71,308
Other finance expenses 6 -30,058 -19,202
Result before income tax and share of result of equity accounted investees 17,334 50,840
Share of result of equity accounted investees 12 -1,135 -699
Result before income tax 16,199 50,141
Income tax expense 7 -1,825 -6,691
Result for the period 14,374 43,450
Attributable to:
Non-controlling interest 16 -10
Owners of the Company 14,358 43,460
ResUlt foR the peRiod 14,374 43,450
Basic earnings per share (in USD) 23 0.25 1.26
Diluted earnings per share (in USD) 23 0.25 1.26
CONSOLIDATED STATEMENT OF COMPREHENSIVE INCOME
Result for the period 14,374 43,450
Other comprehensive result
Foreign currency translation differences for foreign operations -1,807 1,095
Net change in fair value of cash flow hedges transferred to profit and loss 629 629
Net change in fair value of cash flow hedges - hedge accounting -862 186
Net change in fair value of available-for-sale financial assets 6,022 919
Other comprehensive result for the period 3,982 2,829
Total comprehensive result for the period 18,356 46,279
Attributable to:
Non-controlling interest 15 -5
Owners of the Company 18,341 46,284
total compRehensive ResUlt foR the peRiod 18,356 46,279
Note01/01/2010 31/12/2010
01/01/2009 31/12/2009
OPERATING ACTIVITIES
Result for the period 14,375 43,450
Share of result of equity accounted investees 12 1,135 699
Depreciations and amortisations 8/9/10/11 89,489 75,117
Changes in the fair value of derivative financial instruments 15,756 -66,953
Unrealised exchange gains/losses and amortisation on convertible bond 24 0 8,313
Net interest income/expenses 46,060 45,755
Income tax expense 7 1,825 6,691
Net gain on sale of assets -46,895 -64
Dividend income 12 -48 0
Equity settled share-based payment expenses (option plan) 25 1,217 2,164
Gross cash flow from operating activities 122,914 115,172
Decrease/increase of trade and other receivables -24,230 12,049
Increase/decrease of trade and other payables 17,394 -10,262
Increase/decrease in provisions and employee benefits -839 -420
Cash generated from operating activities 115,239 116,539
Interest paid -48,572 -57,394
Interest received 1,214 5,434
Income taxes paid/received -3,811 -4,328
Net cash from operating activities 64,070 60,251
INVESTING ACTIVITIES
Acquisition of intangible assets 10 -121 -219
Acquisition of vessels and other property, plant and equipment 8/9/11 -51,368 -216,774
Proceeds from the sale of intangible assets 4 10
Proceeds from the sale of vessels and other property, plant and equipment 169 427
Acquisition of available-for-sale financial assets (*) 3 -35,172 0
Proceeds from available-for-sale financial assets - capital decrease 218 54
Proceeds from the sale of 50% shares in 3 LNG subsidiaries - net of cash (*) 3 60,026 0
Acquisition of / proceeds from the sale of subsidiaries, associates and other investments 3 -5,847
Net cash used in investing activities -26,241 -222,349
FINANCING ACTIVITIES
Dividends paid 22 -30,691 -4,406
Dividends received 12 48 0
Capital increase 0 142,471
Acquisition of treasury shares 22 -6,103 0
Proceeds from the sale of preferential rights 0 2,538
Proceeds from new borrowings 24 32,719 205,164
Repayment of borrowings 24 -77,090 -171,548
Net cash (used in) from financing activities -81,117 174,219
net (decRease) incRease in cash and cash eQUivalents -43,288 12,121
RECONCILIATION OF NET INCREASE/DECREASE IN CASH AND CASH EQUIVALENTS
Net cash and cash equivalents at 1 January 164,366 151,821
Net increase/decrease in cash and cash equivalents -43,288 12,121
Exchange rate fluctuations on cash and cash equivalents -889 424
net cash and cash eQUivalents at 31 decemBeR 21 120,189 164,366
CONSOLIDATED INCOME STATEMENT( in thousands of USD)
The notes are an integral part of these consolidated financial statements
110381 EXMAR JAARVERSLAG FINANCIEEL ENG.indd 26 28/04/11 14:25
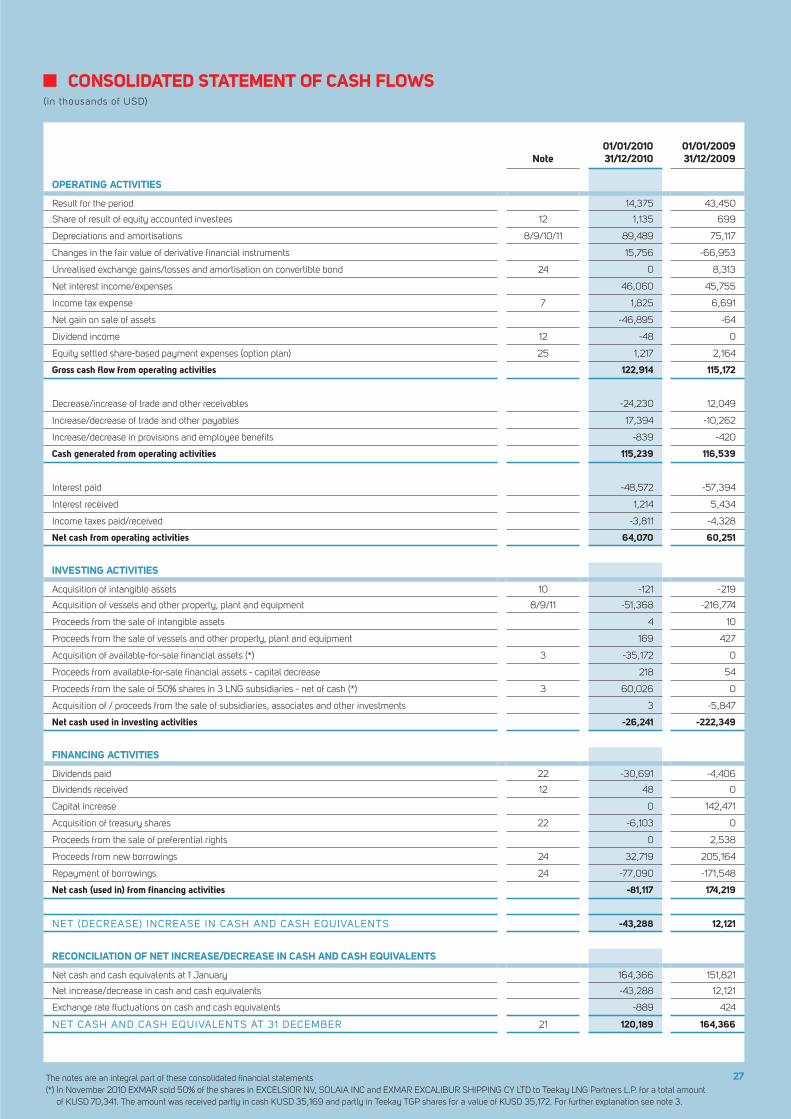
27
Note01/01/2010 31/12/2010
01/01/2009 31/12/2009
OPERATING ACTIVITIES
Result for the period 14,375 43,450
Share of result of equity accounted investees 12 1,135 699
Depreciations and amortisations 8/9/10/11 89,489 75,117
Changes in the fair value of derivative financial instruments 15,756 -66,953
Unrealised exchange gains/losses and amortisation on convertible bond 24 0 8,313
Net interest income/expenses 46,060 45,755
Income tax expense 7 1,825 6,691
Net gain on sale of assets -46,895 -64
Dividend income 12 -48 0
Equity settled share-based payment expenses (option plan) 25 1,217 2,164
Gross cash flow from operating activities 122,914 115,172
Decrease/increase of trade and other receivables -24,230 12,049
Increase/decrease of trade and other payables 17,394 -10,262
Increase/decrease in provisions and employee benefits -839 -420
Cash generated from operating activities 115,239 116,539
Interest paid -48,572 -57,394
Interest received 1,214 5,434
Income taxes paid/received -3,811 -4,328
Net cash from operating activities 64,070 60,251
INVESTING ACTIVITIES
Acquisition of intangible assets 10 -121 -219
Acquisition of vessels and other property, plant and equipment 8/9/11 -51,368 -216,774
Proceeds from the sale of intangible assets 4 10
Proceeds from the sale of vessels and other property, plant and equipment 169 427
Acquisition of available-for-sale financial assets (*) 3 -35,172 0
Proceeds from available-for-sale financial assets - capital decrease 218 54
Proceeds from the sale of 50% shares in 3 LNG subsidiaries - net of cash (*) 3 60,026 0
Acquisition of / proceeds from the sale of subsidiaries, associates and other investments 3 -5,847
Net cash used in investing activities -26,241 -222,349
FINANCING ACTIVITIES
Dividends paid 22 -30,691 -4,406
Dividends received 12 48 0
Capital increase 0 142,471
Acquisition of treasury shares 22 -6,103 0
Proceeds from the sale of preferential rights 0 2,538
Proceeds from new borrowings 24 32,719 205,164
Repayment of borrowings 24 -77,090 -171,548
Net cash (used in) from financing activities -81,117 174,219
net (decRease) incRease in cash and cash eQUivalents -43,288 12,121
RECONCILIATION OF NET INCREASE/DECREASE IN CASH AND CASH EQUIVALENTS
Net cash and cash equivalents at 1 January 164,366 151,821
Net increase/decrease in cash and cash equivalents -43,288 12,121
Exchange rate fluctuations on cash and cash equivalents -889 424
net cash and cash eQUivalents at 31 decemBeR 21 120,189 164,366
CONSOLIDATED INCOME STATEMENT( in thousands of USD)
CONSOLIDATED STATEMENT OF CASH FLOWS( in thousands of USD)
The notes are an integral part of these consolidated financial statements The notes are an integral part of these consolidated financial statements (*) In November 2010 EXMAR sold 50% of the shares in EXCELSIOR NV, SOLAIA INC and EXMAR EXCALIBUR SHIPPING CY LTD to Teekay LNG Partners L.P. for a total amount
of KUSD 70,341. The amount was received partly in cash KUSD 35,169 and partly in Teekay TGP shares for a value of KUSD 35,172. For further explanation see note 3.
110381 EXMAR JAARVERSLAG FINANCIEEL ENG.indd 27 28/04/11 14:25

2828
Note Share capitalShare
premiumRetained earnings
Reserve for treasury
sharesTranslation
reserveFair value
reserveHedging reserve
Share-based payments
reserve TotalNon-control-ling interest Total equity
CONSOLIDATED STATEMENT OF CHANGES IN EQUITY AS PER 31 DECEMBER 2009
1 January 2009 53,287 97,806 155,899 -68,669 -5,114 -20 -8,101 5,572 230,659 138 230,797
Comprehensive result for the period
Result for the period 43,460 43,460 -10 43,450
Foreign currency translation differences 6 1,091 1,091 4 1,095
Net change in fair value of cash flow hedges transferred to profit and loss 6 629 629 629
Net change in fair value of cash flow hedges - hedge accounting 6 186 186 186
Net change in fair value of available-for-sale financial assets 6 919 919 919
Total other comprehensive result 0 0 0 0 1,091 919 815 0 2,825 4 2,829
Total comprehensive result for the period 0 0 43,460 0 1,091 919 815 0 46,285 -6 46,279
Transactions with owners of the Company
Dividends paid 22 -4,406 -4,406 -4,406
Capital increase 35,525 112,096 -5,150 142,471 142,471
Treasury shares/preferential rights sold 2,538 2,538 2,538
Share-based payments 2,163 2,163 2,163
Total transactions with owners of the Company 35,525 112,096 -9,556 2,538 0 0 0 2,163 142,766 0 142,766
31 decemBeR 2009 88,812 209,902 189,803 -66,131 -4,023 899 -7,286 7,735 419,710 133 419,843
CONSOLIDATED STATEMENT OF CHANGES IN EQUITY AS PER 31 DECEMBER 2010
1 January 2010 88,812 209,902 189,803 -66,131 -4,023 899 -7,286 7,735 419,710 133 419,843
Comprehensive result for the period
Result for the period 14,358 14,358 16 14,374
Foreign currency translation differences 6 -1,806 -1,806 -1 -1,807
Net change in fair value of cash flow hedges transferred to profit and loss 6 629 629 629
Net change in fair value of cash flow hedges - hedge accounting 6 -862 -862 -862
Net change in fair value of available-for-sale financial assets 6 6,022 6,022 6,022
Total other comprehensive result 0 0 0 0 -1,806 6,022 -233 0 3,983 -1 3,982
Total comprehensive result for the period 0 0 14,358 0 -1,806 6,022 -233 0 18,341 15 18,356
Transactions with owners of the Company
Dividends paid 22 -30,691 -30,691 -30,691
Treasury shares acquired 22 -6,103 -6,103 -6,103
Share-based payments 25 1,217 1,217 1,217
Total transactions with owners of the Company 0 0 -30,691 -6,103 0 0 0 1,217 -35,577 0 -35,577
31 decemBeR 2010 88,812 209,902 173,470 -72,234 -5,829 6,921 -7,519 8,952 402,474 148 402,622
CONSOLIDATED STATEMENT OF CHANGES IN EQUITY( in thousands of USD)
The notes are an integral part of these consolidated financial statements.
110381 EXMAR JAARVERSLAG FINANCIEEL ENG.indd 28 28/04/11 14:25

2929
Note Share capitalShare
premiumRetained earnings
Reserve for treasury
sharesTranslation
reserveFair value
reserveHedging reserve
Share-based payments
reserve TotalNon-control-ling interest Total equity
CONSOLIDATED STATEMENT OF CHANGES IN EQUITY AS PER 31 DECEMBER 2009
1 January 2009 53,287 97,806 155,899 -68,669 -5,114 -20 -8,101 5,572 230,659 138 230,797
Comprehensive result for the period
Result for the period 43,460 43,460 -10 43,450
Foreign currency translation differences 6 1,091 1,091 4 1,095
Net change in fair value of cash flow hedges transferred to profit and loss 6 629 629 629
Net change in fair value of cash flow hedges - hedge accounting 6 186 186 186
Net change in fair value of available-for-sale financial assets 6 919 919 919
Total other comprehensive result 0 0 0 0 1,091 919 815 0 2,825 4 2,829
Total comprehensive result for the period 0 0 43,460 0 1,091 919 815 0 46,285 -6 46,279
Transactions with owners of the Company
Dividends paid 22 -4,406 -4,406 -4,406
Capital increase 35,525 112,096 -5,150 142,471 142,471
Treasury shares/preferential rights sold 2,538 2,538 2,538
Share-based payments 2,163 2,163 2,163
Total transactions with owners of the Company 35,525 112,096 -9,556 2,538 0 0 0 2,163 142,766 0 142,766
31 decemBeR 2009 88,812 209,902 189,803 -66,131 -4,023 899 -7,286 7,735 419,710 133 419,843
CONSOLIDATED STATEMENT OF CHANGES IN EQUITY AS PER 31 DECEMBER 2010
1 January 2010 88,812 209,902 189,803 -66,131 -4,023 899 -7,286 7,735 419,710 133 419,843
Comprehensive result for the period
Result for the period 14,358 14,358 16 14,374
Foreign currency translation differences 6 -1,806 -1,806 -1 -1,807
Net change in fair value of cash flow hedges transferred to profit and loss 6 629 629 629
Net change in fair value of cash flow hedges - hedge accounting 6 -862 -862 -862
Net change in fair value of available-for-sale financial assets 6 6,022 6,022 6,022
Total other comprehensive result 0 0 0 0 -1,806 6,022 -233 0 3,983 -1 3,982
Total comprehensive result for the period 0 0 14,358 0 -1,806 6,022 -233 0 18,341 15 18,356
Transactions with owners of the Company
Dividends paid 22 -30,691 -30,691 -30,691
Treasury shares acquired 22 -6,103 -6,103 -6,103
Share-based payments 25 1,217 1,217 1,217
Total transactions with owners of the Company 0 0 -30,691 -6,103 0 0 0 1,217 -35,577 0 -35,577
31 decemBeR 2010 88,812 209,902 173,470 -72,234 -5,829 6,921 -7,519 8,952 402,474 148 402,622
CONSOLIDATED STATEMENT OF CHANGES IN EQUITY( in thousands of USD)
The notes are an integral part of these consolidated financial statements.
110381 EXMAR JAARVERSLAG FINANCIEEL ENG.indd 29 28/04/11 14:25

30
• the application of IFRS 3 “Business Combinations” and revised
IAS 27 “Consolidated and Separate Financial Statements”
both effective for periods beginning on or after 1 July 2009. All
business combinations are accounted for by applying the acqui-
sition method as at the acquisition date, changes in ownership
interest of a subsidiary (that do not result in loss of control) will
be accounted for as an equity transaction, losses incurred by
the subsidiary will be allocated between the controlling and
non-controlling interests and on loss of control of a subsidiary any
retained interest will be remeasured to fair value. The change in
accounting policy is applied retrospectively and had no impact on
the financial statements
• the application of IAS 39 ‘Financial Instruments’ – Eligible hedged
amendment effective for the periods beginning on or after 1 July
2009. A portion of fair value changes or cash flow variability of a
financial instrument can be designed as a hedged item.
The changes have been applied retrospectively and have no
material impact on the financial statements.
(C) Basis of consolidationSubsidiariesSubsidiaries are those entities controlled by the Group. Control exists
when the Group has the power, directly or indirectly, to govern the
financial and operating policies of an entity so as to obtain benefits
from its activities. In assessing control, potential voting rights that
presently are exercisable or convertible are taken into account.
The financial statements of subsidiaries are fully consolidated from
the date that control commences until the date that control ceases.
The accounting policies of the subsidiaries have been changed when
necessary to align them with the policies adopted by the Group. All
intra-Group balances, income and expenses, unrealised gains and
losses and dividends resulting from intra-Group transactions are
eliminated in full.
Loss of controlUpon the loss of control, the Group derecognises the assets and
liabilities of the subsidiary, and non-controlling interests and the
other components of equity related to the subsidiary. Any surplus
or deficit arising on the loss of control is recognised in profit and
loss. If the Group retains any interest in the previous subsidiary, then
such interest is measured at fair value at the date the control is lost.
Subsequently it is accounted for as an equity-accounted investee
or as an available-for-sale financial asset depending on the level of
influence retained.
AssociatesAssociates are those entities in which the Group has significant
influence, but not control, over the financial and operating policies.
Significant influence is presumed to exist when the Group holds
between 20 and 50% of the voting power.
Investments in associates are accounted for using the equity method
NOTES
1. Accounting policies
EXMAR NV ("the Company") is a company domiciled in Belgium
whose shares are publicly traded. The consolidated financial
statements of the Group comprise the Company, its subsi diaries,
and the Group's interest in associates and jointly controlled entities
(referred to as "The Group"). The Group is active in the industrial
shipping business.
(A) Statement of complianceThe consolidated financial statements have been prepared in
accordance with International Financial Reporting Standards (IFRS)
issued by the International Accounting Standards Board (IASB).
A number of new standards, amendments to standards and
interpretations that have been issued but are not yet effective for the
year ended December 31, 2010 have not been applied in preparing
these consolidated financial statements:
• IFRS 9 Financial Instruments is intended to replace IAS 39
Financial Instruments: Recognition and Measurement. IFRS 9
deals with classification and measurement of financial assets
and financial liabilities. This standard is the first phase in the
replacement of IAS 39 and will become mandatory for the
Group’s 2013 consolidated financial statements, with retrospective
application. The Group does not plan to adopt this standard early
and the extent of the impact has not yet been determined.
• IAS 24 Related Party Disclosures (revised 2009) amends the
definition of a related party and modifies certain related party
disclosure requirements for government related entities. The
amendments which become mandatory for the Group’s 2011
consolidated financial statements are not expected to have a
significant impact on the consolidated financial statements.
• Amendments to IFRIC 14 IAS 19 – The Limit on a Defined Benefit
Assets, Minimum Funding Requirements and their Interaction
remove unintended consequences arising from the treatment of
prepayments where there is a minimum funding requirement.
These amendments result in prepayments of contributions in
certain circumstances being recognised as an asset rather than
an expense. The amendments which become mandatory for the
Group’s 2011 consolidated financial statements are not expected to
have a significant impact on the consolidated financial statements.
• Improvements to IFRSs 2010 is a collection of minor improve-
ments to existing standards. This collection, which becomes
mandatory for the Group’s 2011 consolidated financial statements,
is not expected to have a material impact on the Group’s
consolidated financial statements.
The consolidated financial statements were approved and were
authorised for issue by the Board of Directors on March 31, 2011.
(B) Basis of preparationThe consolidated accounts are presented in USD in accordance
with the deviation granted by the “Banking, Finance and Insurance
Commission” by letter of 2 July 2003, and all values are rounded
to the nearest thousand. They are prepared on the historical cost
basis except for the following material assets and liabilities that
have been measured at fair value: derivative financial instruments,
financial assets at fair value through profit and loss and available-for-
sale financial assets. Assets held for sale are stated at the lower of
carrying amount and fair value less cost to sell.
The preparation of the consolidated financial statements in accordance
with IFRS requires management to make judgements, estimates and
assumptions that affect the application of the accounting policies and
the reported amounts of assets and liabilities, income and expenses.
The estimates and related assumptions are based on historical
experience and various other factors that are believed to be reasonable
under the circumstances. Actual results may differ from these estimates.
The estimates and the underlying assumptions are reviewed on an
ongoing basis. Revisions to accounting estimates are recognised in
the period in which the estimate is revised if the revision only affects
that period, or in the period of the revision and future periods, if the
revision affects both current and future periods.
Preparing the consolidated financial statements, the Group has made
estimates and assumptions for the definition of the fair value for the
share options, the employee benefit plans, provisions and contingen-
cies and the classification of new lease commitments. On a yearly basis
the residual value and the economic life of the vessels is reviewed.
The carrying values of the vessels may not represent the fair market
value at any point in time since the market prices of second-hand
vessels tend to fluctuate with changes in charter rates and the cost
of newbuildings. Historically, both charter rates and vessel values
tend to be cyclical. The carrying amounts of each specific fleet are
reviewed for potential impairment whenever events or changes in
circumstances indicate that the carrying amount of a specific fleet
may not be fully recoverable. In such instances, an impairment charge
would be recognized if the estimate of the future cash flows expected
to result from the use of the fleet or its eventual disposition is less than
the fleet's carrying amount. In developing estimates of future cash
flows, we must make assumptions about future charter rates, ship
operating expenses, the estimated remaining useful lives of the fleet
and the WACC. These assumptions are based on historical trends as
well as future expectations. Although management believes that the
assumptions used to evaluate potential impairment are reasonable
and appropriate, such assumptions are highly subjective.
The accounting policies have been applied consistently to all periods
presented in these consolidated financial statements and they have
been applied consistently by Group entities, except for following
changes in accounting policy:
110381 EXMAR JAARVERSLAG FINANCIEEL ENG.indd 30 28/04/11 14:25
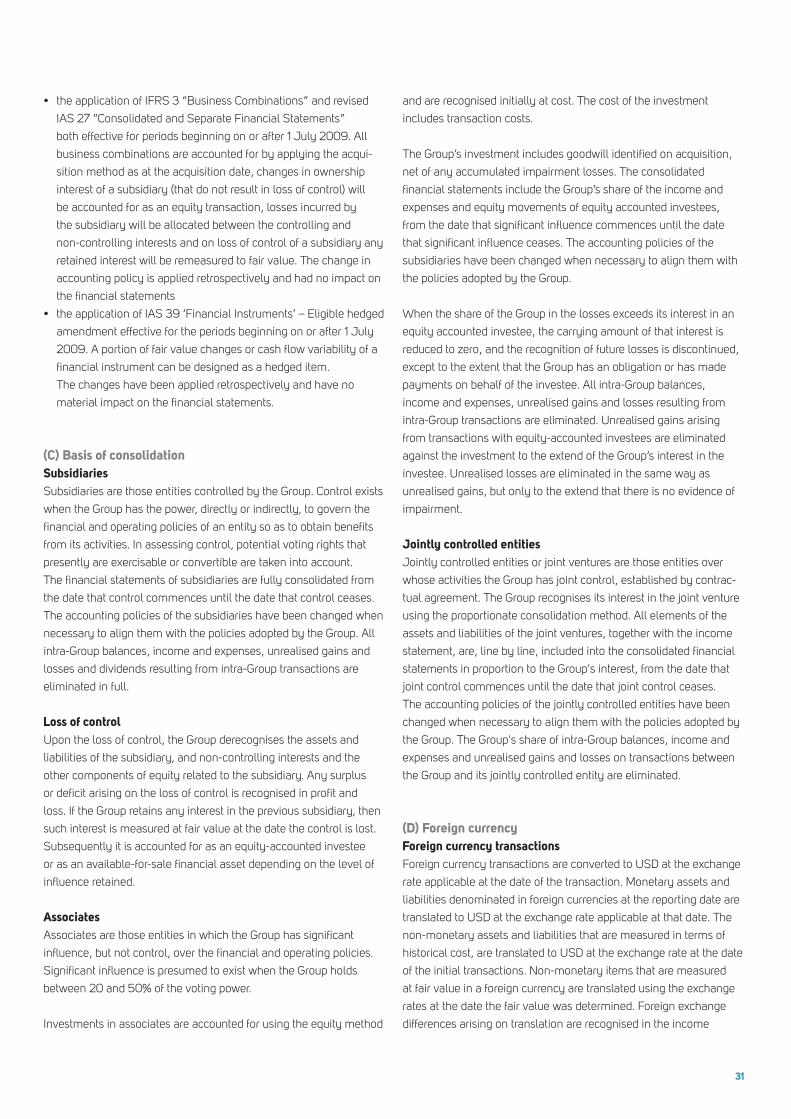
31
• the application of IFRS 3 “Business Combinations” and revised
IAS 27 “Consolidated and Separate Financial Statements”
both effective for periods beginning on or after 1 July 2009. All
business combinations are accounted for by applying the acqui-
sition method as at the acquisition date, changes in ownership
interest of a subsidiary (that do not result in loss of control) will
be accounted for as an equity transaction, losses incurred by
the subsidiary will be allocated between the controlling and
non-controlling interests and on loss of control of a subsidiary any
retained interest will be remeasured to fair value. The change in
accounting policy is applied retrospectively and had no impact on
the financial statements
• the application of IAS 39 ‘Financial Instruments’ – Eligible hedged
amendment effective for the periods beginning on or after 1 July
2009. A portion of fair value changes or cash flow variability of a
financial instrument can be designed as a hedged item.
The changes have been applied retrospectively and have no
material impact on the financial statements.
(C) Basis of consolidationSubsidiariesSubsidiaries are those entities controlled by the Group. Control exists
when the Group has the power, directly or indirectly, to govern the
financial and operating policies of an entity so as to obtain benefits
from its activities. In assessing control, potential voting rights that
presently are exercisable or convertible are taken into account.
The financial statements of subsidiaries are fully consolidated from
the date that control commences until the date that control ceases.
The accounting policies of the subsidiaries have been changed when
necessary to align them with the policies adopted by the Group. All
intra-Group balances, income and expenses, unrealised gains and
losses and dividends resulting from intra-Group transactions are
eliminated in full.
Loss of controlUpon the loss of control, the Group derecognises the assets and
liabilities of the subsidiary, and non-controlling interests and the
other components of equity related to the subsidiary. Any surplus
or deficit arising on the loss of control is recognised in profit and
loss. If the Group retains any interest in the previous subsidiary, then
such interest is measured at fair value at the date the control is lost.
Subsequently it is accounted for as an equity-accounted investee
or as an available-for-sale financial asset depending on the level of
influence retained.
AssociatesAssociates are those entities in which the Group has significant
influence, but not control, over the financial and operating policies.
Significant influence is presumed to exist when the Group holds
between 20 and 50% of the voting power.
Investments in associates are accounted for using the equity method
and are recognised initially at cost. The cost of the investment
includes transaction costs.
The Group’s investment includes goodwill identified on acquisition,
net of any accumulated impairment losses. The consolidated
financial statements include the Group’s share of the income and
expenses and equity movements of equity accounted investees,
from the date that significant influence commences until the date
that significant influence ceases. The accounting policies of the
subsidiaries have been changed when necessary to align them with
the policies adopted by the Group.
When the share of the Group in the losses exceeds its interest in an
equity accounted investee, the carrying amount of that interest is
reduced to zero, and the recognition of future losses is discontinued,
except to the extent that the Group has an obligation or has made
payments on behalf of the investee. All intra-Group balances,
income and expenses, unrealised gains and losses resulting from
intra-Group transactions are eliminated. Unrealised gains arising
from transactions with equity-accounted investees are eliminated
against the investment to the extend of the Group’s interest in the
investee. Unrealised losses are eliminated in the same way as
unrealised gains, but only to the extend that there is no evidence of
impairment.
Jointly controlled entitiesJointly controlled entities or joint ventures are those entities over
whose activities the Group has joint control, established by contrac-
tual agreement. The Group recognises its interest in the joint venture
using the proportionate consolidation method. All elements of the
assets and liabilities of the joint ventures, together with the income
statement, are, line by line, included into the consolidated financial
statements in proportion to the Group's interest, from the date that
joint control commences until the date that joint control ceases.
The accounting policies of the jointly controlled entities have been
changed when necessary to align them with the policies adopted by
the Group. The Group's share of intra-Group balances, income and
expenses and unrealised gains and losses on transactions between
the Group and its jointly controlled entity are eliminated.
(D) Foreign currencyForeign currency transactionsForeign currency transactions are converted to USD at the exchange
rate applicable at the date of the transaction. Monetary assets and
liabilities denominated in foreign currencies at the reporting date are
translated to USD at the exchange rate applicable at that date. The
non-monetary assets and liabilities that are measured in terms of
historical cost, are translated to USD at the exchange rate at the date
of the initial transactions. Non-monetary items that are measured
at fair value in a foreign currency are translated using the exchange
rates at the date the fair value was determined. Foreign exchange
differences arising on translation are recognised in the income
110381 EXMAR JAARVERSLAG FINANCIEEL ENG.indd 31 28/04/11 14:25

32
statement, except for differences arising on the retranslation of
available-for-sale equity instruments or qualified cash flow hedges,
which are recognised in other comprehensive income.
Financial statements of foreign operationsAssets and liabilities of foreign operations, including goodwill and
fair value adjustments arising on acquisition, are translated to USD
using the closing rate at reporting date.
The income and expenses of the foreign operations are converted to
USD at the exchange rate at the date of the transaction (the average
exchange rate during the relevant period is used in case the date of
transaction approximates this average rate).
Foreign currency differences are recognised directly in other
comprehensive income. These foreign currency differences are
presented within the translation reserve. However, if the operation
is a non-wholly-owned subsidiary, then the relevant portion
proportionate share of the translation difference is allocated to the
non-controlling interests. When a foreign operation is disposed of
such that control, significant influence or joint control is lost, the
cumulative amount in the translation reserve related to that foreign
operation is reclassified to profit and loss as part of the gain or loss
on disposal. When the Group disposes of only part of its interest in a
subsidiary that includes a foreign operation while retaining control,
the relevant proportion of the cumulative amount is reattributed to
non-controlling interests. When the Group disposes of only part of
its investment in an associate or joint venture that includes a foreign
operation while retaining significant influence or joint control, the
relevant proportion of the cumulative amount is reclassified to profit
and loss.
(E) Financial instrumentsNon-derivative financial assetsLoans and receivables and deposits are initially recognised on the
date that they are originated. All other financial assets are recognised
initially on the trade date. The Group derecognises a financial asset
when the contractual rights to the cash flow from the assets expire,
or it transfers the rights to receive the contractual cash flows on the
financial asset in a transaction in which substancially all risks and
rewards of ownership are transferred.
Financial assets and liabilities are offset when and only when, the
Group has a legal right to offset the amounts and intends either to
settle on a net basis or to realise the asset and settle the liability
simultaneously.
Financial assets at fair value through profit and lossA financial asset is classified at fair value through profit and loss if it
is classified as held for trading. Upon initial recognition attributable
transaction costs are recognised in the income statement as
incurred. Financial assets at fair value through profit and loss are
measured at fair value and changes therein are recognised in the
income statement.
Held-to maturity financial assets/other investmentsIf the Group has the positive intent and ability to hold debt securities
to maturity, then such financial assets are classified as held-to-
maturity. Held-to-maturity financial assets are recognised initially at
fair value plus any directly attributable transaction costs. Subsequent
to initial recognition held-to-maturity financial assets are measured
at amortised cost, using the effective interest method, less any
impairment losses.
Loans and receivablesLoans and receivables are financial assets with fixed or determinable
payments that are not quoted in an active market. Such assets are
recognised initially at fair value (normally equals transaction price)
plus any directly attributable transaction costs. Subsequent to initial
recognition loans and receivables are measured at amortised cost,
using the effective interest method, less any impairment losses.
Available-for-sale financial assetsAvailable-for-sale financial assets include equity securities, which
are not classified as held for trading, designated at fair value through
profit and loss or held to maturity. Available-for-sale financial
assets are measured at fair value and changes therein, other than
impairment losses, are recognised in other comprehensive income
and presented within the fair value reserve. When an investment is
derecognised, the cumulative gain or loss in other comprehensive
income is transferred to the income statement.
Cash and cash equivalentsCash and cash equivalents comprise cash balances and call
deposits. Bank overdrafts that are repayable on demand and form
an integral part of the Group's cash management are included as
a component of cash and cash equivalents for the purpose of the
statement of the cash flows.
Non-derivative financial liabilitiesThe Group initially recognises debt securities issued and subordina-
ted liabilities on the date that they are originated. All other financial
liabilities are recognised initially at trade date at which the Group
becomes a party to the contractual provisions of the instrument.
The Group derecognises a financial liability when its contractual
obligations are discharged or cancelled or expire.
The Group has the following non-derivative financial liabilities: loans
and borrowings, bank overdrafts and trade and other payables. Such
financial liabilities are recognised initially at fair value (normally
equals the transaction price for trade and other payables) plus any
directly attributable transaction costs for loans and borrowings.
Subsequent to initial recognition these financial liabilities are
measured at amortised cost using the effective interest method.
Ordinary shares are classified as equity. Incremental costs directly
attributable to the issue of ordinary shares and share options are
recognised as a deduction from equity, net of tax effects. When
share capital recognised as equity is repurchased, the amount of the
consideration paid, including directly attributable costs, is recognised
as a deduction from equity. When treasury shares are sold, the
amount received is recognised as an increase in equity and the
resulting surplus or deficit on the transaction is transferred to/from
retained earnings.
Derivative financial instruments & hedge accountingThe Group holds derivative financial instruments to hedge its foreign
currency and interest rate risk exposures.
Embedded derivatives are separated from the host contract and
accounted for separately if the economic characteristics and risks
of the host contract and the embedded derivative are not closely
related, a separate instrument with the same terms as the embed-
ded derivative would meet the definition of a derivative and the
combined instrument is not measured at fair value through profit and
loss.
On initial designation of the hedge, the Group formally documents
the relationship between the hedging instrument(s) and the hedged
item(s), including the risk management objectives and strategy in
undertaking the hedge transaction, together with the methods that
will be used to assess the effectiveness of the hedging relationship.
The Group makes an assessment, both at the inception of the hedge
relationship as well as on an ongoing basis, whether the hedging
instruments are expected to be "highly effective" in offsetting the
changes in the fair value or cash flows of the respective hedged
items during the period for which the hedge is designated, and
whether the actual results of each hedge are within the range of
80-125 %.
Derivatives are recognised initially at fair value; attributable trans-
action costs are recognised in the income statement as incurred.
Subsequently they are measured at fair value. Changes in fair value
are accounted for as follows:
When a derivative is designated as the hedging instrument in a
hedge of the variability in cash flows attributable to a particular risk
associated with a recognised asset or liability, the effective portion
of changes in the fair value of the derivative is recognised in other
comprehensive income and presented in the hedging reserve in
equity. The amount recognised in other comprehensive income
is removed and included in the income statement in the same
period as the hedged cash flows affect the income statement under
the same line item as the hedged item. Any ineffective portion of
changes in fair value of the derivative is recognised immediately in
the income statement. If the hedging instrument no longer meets
the criteria for hedge accounting, expires or is sold, terminated,
exercised, or the designation is revoked, then the hedge accounting
is discontinued prospectively. The cumulative gain or loss previously
recognised in other comprehensive income remains there until the
forecast transaction affects the income statement.
110381 EXMAR JAARVERSLAG FINANCIEEL ENG.indd 32 28/04/11 14:25
33
Held-to maturity financial assets/other investmentsIf the Group has the positive intent and ability to hold debt securities
to maturity, then such financial assets are classified as held-to-
maturity. Held-to-maturity financial assets are recognised initially at
fair value plus any directly attributable transaction costs. Subsequent
to initial recognition held-to-maturity financial assets are measured
at amortised cost, using the effective interest method, less any
impairment losses.
Loans and receivablesLoans and receivables are financial assets with fixed or determinable
payments that are not quoted in an active market. Such assets are
recognised initially at fair value (normally equals transaction price)
plus any directly attributable transaction costs. Subsequent to initial
recognition loans and receivables are measured at amortised cost,
using the effective interest method, less any impairment losses.
Available-for-sale financial assetsAvailable-for-sale financial assets include equity securities, which
are not classified as held for trading, designated at fair value through
profit and loss or held to maturity. Available-for-sale financial
assets are measured at fair value and changes therein, other than
impairment losses, are recognised in other comprehensive income
and presented within the fair value reserve. When an investment is
derecognised, the cumulative gain or loss in other comprehensive
income is transferred to the income statement.
Cash and cash equivalentsCash and cash equivalents comprise cash balances and call
deposits. Bank overdrafts that are repayable on demand and form
an integral part of the Group's cash management are included as
a component of cash and cash equivalents for the purpose of the
statement of the cash flows.
Non-derivative financial liabilitiesThe Group initially recognises debt securities issued and subordina-
ted liabilities on the date that they are originated. All other financial
liabilities are recognised initially at trade date at which the Group
becomes a party to the contractual provisions of the instrument.
The Group derecognises a financial liability when its contractual
obligations are discharged or cancelled or expire.
The Group has the following non-derivative financial liabilities: loans
and borrowings, bank overdrafts and trade and other payables. Such
financial liabilities are recognised initially at fair value (normally
equals the transaction price for trade and other payables) plus any
directly attributable transaction costs for loans and borrowings.
Subsequent to initial recognition these financial liabilities are
measured at amortised cost using the effective interest method.
Ordinary shares are classified as equity. Incremental costs directly
attributable to the issue of ordinary shares and share options are
recognised as a deduction from equity, net of tax effects. When
share capital recognised as equity is repurchased, the amount of the
consideration paid, including directly attributable costs, is recognised
as a deduction from equity. When treasury shares are sold, the
amount received is recognised as an increase in equity and the
resulting surplus or deficit on the transaction is transferred to/from
retained earnings.
Derivative financial instruments & hedge accountingThe Group holds derivative financial instruments to hedge its foreign
currency and interest rate risk exposures.
Embedded derivatives are separated from the host contract and
accounted for separately if the economic characteristics and risks
of the host contract and the embedded derivative are not closely
related, a separate instrument with the same terms as the embed-
ded derivative would meet the definition of a derivative and the
combined instrument is not measured at fair value through profit and
loss.
On initial designation of the hedge, the Group formally documents
the relationship between the hedging instrument(s) and the hedged
item(s), including the risk management objectives and strategy in
undertaking the hedge transaction, together with the methods that
will be used to assess the effectiveness of the hedging relationship.
The Group makes an assessment, both at the inception of the hedge
relationship as well as on an ongoing basis, whether the hedging
instruments are expected to be "highly effective" in offsetting the
changes in the fair value or cash flows of the respective hedged
items during the period for which the hedge is designated, and
whether the actual results of each hedge are within the range of
80-125 %.
Derivatives are recognised initially at fair value; attributable trans-
action costs are recognised in the income statement as incurred.
Subsequently they are measured at fair value. Changes in fair value
are accounted for as follows:
When a derivative is designated as the hedging instrument in a
hedge of the variability in cash flows attributable to a particular risk
associated with a recognised asset or liability, the effective portion
of changes in the fair value of the derivative is recognised in other
comprehensive income and presented in the hedging reserve in
equity. The amount recognised in other comprehensive income
is removed and included in the income statement in the same
period as the hedged cash flows affect the income statement under
the same line item as the hedged item. Any ineffective portion of
changes in fair value of the derivative is recognised immediately in
the income statement. If the hedging instrument no longer meets
the criteria for hedge accounting, expires or is sold, terminated,
exercised, or the designation is revoked, then the hedge accounting
is discontinued prospectively. The cumulative gain or loss previously
recognised in other comprehensive income remains there until the
forecast transaction affects the income statement.
(F) Intangible assetsGoodwillGoodwill arising upon the acquisition of subsidiaries is included in
intangible assets.
For acquisitions on or after 1 January 2010, the Company measures
goodwill at the acquisition date as: the fair value of the consideration
transferred; plus the recognised amount of any non-controlling
interests in the acquiree; plus if the business combination is
achieved in stages, the fair value of the existing equity interest in the
acquiree; less the net recognised amount (generally fair value) of the
identifiable assets acquired and liabilities assumed. When the excess
is negative, a bargain purchase gain is recognised immediately in the
statement of comprehensive income. The consideration transferred
does not include amounts related to the settlement of preexisting re-
lationships. Such amounts are generally recognised in the statement
of comprehensive income. Costs related to the acquisition, other
than those associated with the issue of debt or equity securities,
that the Company incurs in connection with a business combination
are expensed as incurred. Any contingent consideration payable is
recognised at fair value at the acquisition date. If the contingent con-
sideration is classified as equity, it is not remeasured and settlement
is accounted for within equity. Otherwise, subsequent changes to
the fair value of the contingent consideration are recognised in the
statement of comprehensive income.
For acquisitions prior to 1 January 2010, goodwill represents the ex-
cess of the cost of the acquisition over the Company’s interest in the
recognised amount (generally fair value) of the identifiable assets,
liabilities and contingent liabilities of the acquiree. When the excess
was negative, a bargain purchase gain was recognised immediately
in the statement of comprehensive income. Transaction costs, other
than those associated with the issue of debt or equity securities, that
the Company incurred in connection with business combinations
were capitalised as part of the cost of the acquisition.
Research and developmentExpenditure on research activities, undertaken with the prospect of
gaining new scientific or technical knowledge and understanding, is
recognised in profit or loss as incurred.
Development activities involve a plan or design for the production
of new or substantially new improved products and processes.
Development cost is capitalised only if development costs can
be measured reliably, the product or process is technically and
commercially feasible, future economic benefits are probable
and the Group intends to and has sufficient resources to complete
development and to use or sell the asset. Capitalised development
expenditure is measured at cost less accumulated amortisation and
accumulated impairment losses.
Other intangible assetsOther intangible assets (e.g. software, …) acquired by the Group
that have finite useful lives are measured at cost less accumulated
amortisations and accumulated impairment losses. The amortisation
110381 EXMAR JAARVERSLAG FINANCIEEL ENG.indd 33 28/04/11 14:25

34
is recognised in the income statement, and is spread over the useful
life of the relevant intangible assets following the straight-line
depreciation method. The depreciation starts from the date that they
are available for use. The estimated useful lives for the current and
comparative periods is 5 years. Amortisation methods, useful lives
and residual values are reviewed at each financial year-end and
adjusted if appropriate.
(G) Property, plant and equipmentOwned assetsItems of property, plant and equipment are stated at cost less
accumulated depreciation and impairment losses. Cost includes
expenditure that is directly attributable to the acquisition of the asset.
The cost of self-constructed assets includes the cost of materials
and direct labour, any other costs directly attributable to bringing
the asset to a working condition for its intended use and capitalised
borrowing costs.
Subsequent expenses associated with items of property, plant and
equipment are capitalised only if a future economic advantage will
result from this expenditure and its cost can be measured reliably.
If a part of an item of property, plant and equipment is replaced,
the replacement cost is capitalised and the carrying amount of the
replaced part is derecognised. The costs of the day-to-day servicing
of property, plant and equipment are recognised in the income
statement as incurred.
When parts of an item of property, plant and equipment have
different useful lives, they are accounted for as separate items (major
components) of property, plant and equipment.
Depreciation is calculated over the depreciable amount, which is the
cost of an asset, less its residual value.
The vessels are presented on a separate line in the statement of
financial position given their importance.
The vessels are depreciated on a straight-line basis to their residual
value over their expected economic life in the Group.
Gas vessels LPG: 30 years
Gas vessels LNG: 30 years
Accommodation platform, second hand: 10 years
Accommodation platform, newbuild;
Hull, machinery & deck outfitting 20 years
Accommodation 10 years
Dry-docking expenses are capitalised when they occur and
depreciated over a period until the next dry-dock.
Other property, plant and equipment are depreciated over their
estimated useful life using the straight-line depreciation method.
Land is not depreciated.
The estimated depreciation percentages of the various types of
assets are as follows:
Buildings: 3 %
Leased real estate: 3 %
Plant and equipment: 20 %
Furniture: 10 %
Cars: 20 %
Airplane: 10 %
IT equipment: 33 %
The method of depreciation, the residual value, and the useful
life values are reviewed at each financial year-end and adjusted if
appropriate.
Leased assetsLease agreements substantially assigning all risks and rewards
inherent to ownership to the Group, are classified as finance leases.
Upon recognition, the leased assets measured at an amount equal
to the lower of its fair value and the present value of the minimum
lease payments at inception of the lease, reduced by the accumula-
ted depreciation and possible impairment losses. The depreciation
period matches the useful life or the lease term. If there is uncer-
tainty with respect to the transfer of ownership to the Group at the
end of the contract, the asset is fully depreciated over the shorter of
the lease term and its useful life.
The Group entered into long-term time charter agreements for
certain LNG vessels. In respect of lease classification, it was judged
that substantially all risks and rewards remain with the Group. Based
on qualitative factors it was concluded that these agreements qualify
for operating leases.
(H) Investment propertyInvestments property is measured at the historical cost less ac-
cumulated depreciation and accumulated impairment losses.
The depreciation is recognised in the income statement on a
straight-line basis over the estimated useful lives of the investment
properties.
(I) Impairment of assetsFinancial assetsA financial asset not carried at fair value through profit and loss
is assessed each reporting date to determine whether there is
objective evidence that it is impaired. A financial asset is impaired
if objective evidence indicates that a loss event has occurred after
initial recognition of the asset and that the loss event had a negative
effect on the estimated future cash flows of that asset that can be
estimated reliably.
110381 EXMAR JAARVERSLAG FINANCIEEL ENG.indd 34 28/04/11 14:25
35
Land is not depreciated.
The estimated depreciation percentages of the various types of
assets are as follows:
Buildings: 3 %
Leased real estate: 3 %
Plant and equipment: 20 %
Furniture: 10 %
Cars: 20 %
Airplane: 10 %
IT equipment: 33 %
The method of depreciation, the residual value, and the useful
life values are reviewed at each financial year-end and adjusted if
appropriate.
Leased assetsLease agreements substantially assigning all risks and rewards
inherent to ownership to the Group, are classified as finance leases.
Upon recognition, the leased assets measured at an amount equal
to the lower of its fair value and the present value of the minimum
lease payments at inception of the lease, reduced by the accumula-
ted depreciation and possible impairment losses. The depreciation
period matches the useful life or the lease term. If there is uncer-
tainty with respect to the transfer of ownership to the Group at the
end of the contract, the asset is fully depreciated over the shorter of
the lease term and its useful life.
The Group entered into long-term time charter agreements for
certain LNG vessels. In respect of lease classification, it was judged
that substantially all risks and rewards remain with the Group. Based
on qualitative factors it was concluded that these agreements qualify
for operating leases.
(H) Investment propertyInvestments property is measured at the historical cost less ac-
cumulated depreciation and accumulated impairment losses.
The depreciation is recognised in the income statement on a
straight-line basis over the estimated useful lives of the investment
properties.
(I) Impairment of assetsFinancial assetsA financial asset not carried at fair value through profit and loss
is assessed each reporting date to determine whether there is
objective evidence that it is impaired. A financial asset is impaired
if objective evidence indicates that a loss event has occurred after
initial recognition of the asset and that the loss event had a negative
effect on the estimated future cash flows of that asset that can be
estimated reliably.
An impairment loss in respect of a financial asset measured at amor-
tised cost is calculated as the difference between its carrying amount
and the present value of the estimated future cash flows discounted
at the asset's original effective interest rate. Losses are recognised in
the income statement. When a subsequent event causes the amount
of impairment loss to decrease, the decrease in impairment loss is
reversed through profit and loss.
Impairment losses on available-for-sale investment securities
are recognised by transferring the cumulative loss that has been
recognised in other comprehensive income and presented in the fair
value reserve in equity to profit and loss.
Non-financial assetsThe carrying value of non-financial assets, other than deferred tax
assets and inventories, are reviewed at each balance sheet date to
determine whether there is an indication of impairment. If any such
indication exists, the asset’s recoverable amount is estimated.
For goodwill and intangible assets that have indefinite lives or that
are not yet available for use the recoverable amount is estimated on
each balance sheet date.
The recoverable amount of an asset or cash-generating unit is the
greater of its value in use and its fair value less costs to sell. In as-
sessing value in use, the estimated future cash flows are discounted
to their present value using a pre-tax discount rate that reflects
current market assessments of the time value of money and the risks
specific to the asset. For the purpose of impairment testing, assets
that cannot be tested individually are grouped together into the
smallest group of assets that generates cash inflows from continuing
use that are largely independent of the cash inflows of other assets
or groups of assets (the “cash-generating unit”).
The goodwill acquired in a business combination, for the purpose
of impairment testing, is allocated to cash-generating units that are
expected to benefit from the synergies of the combination.
An impairment loss is recognised if the carrying amount of an
asset or its cash-generating unit exceeds its estimated recoverable
amount. All impairment losses are recognised in the income
statement.
Impairment losses recognised in respect of cash-generating units
are allocated first to reduce the carrying amount of any goodwill
allocated to the units and then to reduce the carrying amount of the
other assets in the unit (group of units) on a pro rata basis.
An impairment loss in respect of goodwill is not reversed. In respect
of other assets, impairment losses in prior periods are assessed at
each reporting date for indications that the loss has decreased or
no longer exists. An impairment loss is reversed if there has been a
change in the estimates used to determine the recoverable amount.
An impairment loss is reversed only to the extent that the asset’s
carrying amount does not exceed the carrying amount that would
have been determined, net of depreciation or amortisation, if no
impairment loss had been recognised.
(J) Assets held for saleNon-current assets, or disposal groups comprising assets and
liabilities, that are expected to be recovered primarily through sale
rather than through continuing use, are classified as held for sale.
Immediately before classification as held for sale, the assets (or
components of a disposal group) are remeasured in accordance with
the Group’s accounting policies. Thereafter the assets (or disposal
group) are measured at the lower of their carrying amount and
fair value less cost to sell. Intangible assets and property, plant
and equipment once classified as held for sale or distribution are
not amortised or depreciated. In addition, equity accounting of
equity-accounted investees ceases once classified as held for sale or
distribution.
(K) Employee benefitsDefined contribution plansObligations for contributions to defined contribution pension plans are
recognised as an expense in the income statement as incurred.
Defined benefit plansThe Group’s net obligation in respect of defined benefit pension plans
is calculated separately for each plan by estimating the amount
of future benefit that employees have earned in return for their
service in the current and prior periods; that benefit is discounted to
determine the present value. Any unrecognised past service costs
and the fair value of any plan assets are deducted. This discount rate
is the yield at balance sheet date on AAA credit rate bonds that have
maturity dates approximating the terms of the Group’s obligations.
The calculation is performed by a qualified actuary using the
projected unit credit method.
Actuarial gains and losses are immediately recognised in the income
statement. When the benefits of a plan are improved, the portion
of the increased benefit relating to past service by employees is
recognised in profit or loss on a straight-line basis over the average
period until the benefits become vested. To the extent that the
benefits vest immediately, the expense is recognised immediately in
profit or loss.
Share-based payment transactionsThe grant date fair value of options granted to employees is
recognised as an employee expense, with a corresponding increase
in equity, over the period that the employees unconditionally
become entitled to the options. The amounts recognised as an
expense is adjusted to reflect the actual number of options for which
the related service and non-market vesting conditions are met, such
110381 EXMAR JAARVERSLAG FINANCIEEL ENG.indd 35 28/04/11 14:25

36
that the amount ultimately recognised as an expense is based on the
number of awards that do meet the related service and non-market
performance conditions at vesting date.
(L) ProvisionsA provision is recognised in the balance sheet when the Group has a
legal or constructive obligation as result of a past event, that can be
estimated reliably and it is probable that an outflow of benefits will
be required to settle the obligation. If the effect is material, provisions
are determined by discounting the expected future cash flows at
a pre-tax rate that reflects current market assessments of the time
value of money and, where appropriate, the risks specific to the
liability.
Restructuring provisionsProvisions for restructuring are recognised when the Group has ap-
proved a detailed and formal restructuring plan, and the restructuring
has either commenced or has been announced publicly. Future
operating costs are not provided for.
Onerous contractsA provision from onerous contracts is recognised when the expected
benefits to be derived by the Group from a contract are lower than
the unavoidable cost of meeting its obligations under the contract.
The provision is measured at the present value of the lower of the
expected cost of terminating the contract and the expected net cost
of continuing with the contract.
(M) RevenuesGoods sold and services renderedRevenue from the sale of goods is recognised in the income
statement when the significant risks and rewards of ownership
have been transferred to the buyer, recovery of the consideration is
probable, the associated costs and possible return of goods can be
estimated reliably, there is no continuing management involvement
with the goods, and the amount of revenue can be measured
reliably. Revenue from services rendered is recognised in the income
statement in proportion to the stage of completion of the transaction
at the balance sheet date. The stage of completion is assessed by
reference to surveys of work performed.
Rental income from investment property is recognised in the
income statement on a straight-line basis over the term of the lease
term.
Finance income consists of interests received, dividend income,
gains on the disposal of available-for-sale financial assets, changes
in the fair value of financial assets at fair value through profit or loss,
and gains on hedging instruments that are recognised in profit or loss
and exchange rate gains. Interest income is recognised in the income
statement as it accrues, taking into account the effective yield on the
asset. Dividend income is recognised in the income statement on the
date that the dividend is declared.
Government grants are recognised initially as deferred income at
fair value when there is a reasonable assurance that they will be
received and the Group will comply with the conditions associated
with the grant and are then recognised in profit and loss as other
income on a systematic basis over the useful live of the asset. Grants
that compensate for costs that have already been made are entered
consistently in the income statement (other income) for the period in
which the expenses were recognised.
(N) ExpensesOperating lease paymentsPayments made under operating leases are recognised in the
income statement on a straight-line basis over the term of the lease.
Finance leaseMinimum lease payments made under finance leases are ap-
portioned between the finance expense and the reduction of the
outstanding liability. The finance expense is allocated to each period
during the lease term so as to produce a constant periodic rate of
interest on the remaining balance of the liability.
Contingent lease payments are accounted for by revising the
minimum lease payments over the remaining term of the lease
when the lease adjustment is confirmed.
Finance expenses consist of interest expense on borrowings,
unwinding of the discount on provisions, changes in the fair value of
financial assets at fair value through profit or loss, impairment losses
recognised on financial assets, and losses on hedging instruments
that are recognised in profit or loss.
Borrowing costs that are not directly attributable to the acquisition,
construction or production of a qualifying asset are recognised in
profit or loss using the effective interest method.
(O) TaxesIncome tax expense consist of current and deferred taxes. Current
and deferred tax are recognised in the income statement, except
when they relate to items that are recognised directly in equity.
Current tax is the expected tax payable of receivable on the taxable
income or loss of the year, using tax rates enacted or substantively
enacted at the reporting date, and any adjustment to tax payable in
respect of previous years.
Deferred tax is recognised on all temporary differences between the
carrying amounts of assets and liabilities for reporting purposes and
the amounts used for taxation purposes. Deferred tax is measured at
110381 EXMAR JAARVERSLAG FINANCIEEL ENG.indd 36 28/04/11 14:25

37
asset. Dividend income is recognised in the income statement on the
date that the dividend is declared.
Government grants are recognised initially as deferred income at
fair value when there is a reasonable assurance that they will be
received and the Group will comply with the conditions associated
with the grant and are then recognised in profit and loss as other
income on a systematic basis over the useful live of the asset. Grants
that compensate for costs that have already been made are entered
consistently in the income statement (other income) for the period in
which the expenses were recognised.
(N) ExpensesOperating lease paymentsPayments made under operating leases are recognised in the
income statement on a straight-line basis over the term of the lease.
Finance leaseMinimum lease payments made under finance leases are ap-
portioned between the finance expense and the reduction of the
outstanding liability. The finance expense is allocated to each period
during the lease term so as to produce a constant periodic rate of
interest on the remaining balance of the liability.
Contingent lease payments are accounted for by revising the
minimum lease payments over the remaining term of the lease
when the lease adjustment is confirmed.
Finance expenses consist of interest expense on borrowings,
unwinding of the discount on provisions, changes in the fair value of
financial assets at fair value through profit or loss, impairment losses
recognised on financial assets, and losses on hedging instruments
that are recognised in profit or loss.
Borrowing costs that are not directly attributable to the acquisition,
construction or production of a qualifying asset are recognised in
profit or loss using the effective interest method.
(O) TaxesIncome tax expense consist of current and deferred taxes. Current
and deferred tax are recognised in the income statement, except
when they relate to items that are recognised directly in equity.
Current tax is the expected tax payable of receivable on the taxable
income or loss of the year, using tax rates enacted or substantively
enacted at the reporting date, and any adjustment to tax payable in
respect of previous years.
Deferred tax is recognised on all temporary differences between the
carrying amounts of assets and liabilities for reporting purposes and
the amounts used for taxation purposes. Deferred tax is measured at
the tax rates that are expected to be applied to temporary differences
when they reverse, based on the laws that have been enacted or
substantively enacted by the reporting date. Deferred tax liabilities
related to the results of subsidiaries that the Group will not distribute
in the foreseeable future are not recognised. Deferred tax assets are
recognised for unused tax losses, tax credits and deductible tempo-
rary differences, to the extent that it is probable that future taxable
profits will be available against which the temporary difference can
be utilised.
Deferred tax assets are reduced in value when it is no longer
probable that the related tax benefits will be realised.
(P) Segment reportingAn operating segment is a compound of the Group that engages
the business activities from which it may earn revenues and incur
expenses, including revenues and expenses that relate to transacti-
ons with any of the Group’s other segments. All operating segments’
operating results are reviewed regularly by management to make
decisions about resources to be allocated to the segment and assess
its performance.
The result for each segment includes all income and expenses
generated directly by this segment, as well as part of the income
and expenses that can reasonably be allocated to this segment. The
assets and liabilities of a segment include the assets and liabilities
that belong directly to the segment, and the assets and liabilities that
can reasonably be allocated to this segment.
Segment capital expenditure is the total cost incurred during the
period to acquire property, plant and equipment and intangible
assets other than goodwill.
All intersegment transactions are supplied on an arm’s length basis.
(Q) Earnings per shareThe Group presents basic and diluted earnings per share for its ordi-
nary shares. Basic earnings per share is calculated by dividing the
profit or loss attributable to ordinary shareholders of the Company by
the weighted average number of ordinary shares outstanding during
the period, adjusted for treasury shares held. Diluted earnings per
share is determined by adjusting the profit and loss attributable to
ordinary shareholders and the weighted average of ordinary shares
outstanding, adjusted for treasury shares held, for the effects of all
dilutive potential ordinary shares, which comprise convertible notes
and share options granted to employees.
(R) Discontinued operationsA discontinued operation is a component of the Group's business
that represents a separate major line of business of geographical
area of operations that has been disposed of or is held for sale.
Classification of a discontinued operation occurs upon disposal or
when the operation meets the criteria to be classified as held for
sale, if earlier. When an operation is classified as a discontinued
operation, the comparative income statement is re-persented as if
the operation had been discontinued from the start of the compara-
tive period.
110381 EXMAR JAARVERSLAG FINANCIEEL ENG.indd 37 28/04/11 14:25

38
SEGMENT REPORTING 2010 LPG LNG Offshore Services Elimi nations Total
INCOME STATEMENT
Revenue third party 184,590 111,594 61,333 54,951 412,468Revenue intra-segment 1,669 40 488 12,340 -14,537 0
Total revenue 186,259 111,634 61,821 67,291 -14,537 412,468
Revenue on property rental third party 1,417 1,417
Revenue on property rental intra-segment 165 -165 0
Total revenue on property rental 0 0 0 1,582 -165 1,417
Capital gain on sale of assets 46,891 1 10 46,902
Other operating income 507 1,927 58 545 3,037
Operating income 186,766 160,452 61,880 69,428 -14,702 463,824
Operating result before depreciation and amortisation charges (EBITDA) 53,693 120,078 1,753 4,547 0 180,071
Depreciations and amortisations -48,179 -27,106 -12,045 -2,041 -89,371
Operating result (EBIT) 5,514 92,972 -10,292 2,506 0 90,700
Interest income/expenses (net) -13,871 -26,765 -7,862 -374 9 -48,863
Other finance income/expenses (net) -3,633 -11,157 -2,698 -675 -9 -18,172
Share of result of equity accounted investees -1,176 41 -1,135
Income tax expense -879 -20 -296 -630 -1,825
Segment result for the period -12,869 55,030 -22,324 868 0 20,705
Unallocated overhead expenses and finance result -6,331
ResUlt foR the peRiod 14,374
Non-controlling interest 16
Attributable to owners of the Company 14,358
The Group has 4 reportable segments. These segments offer
different products and services and are managed separately. The
LPG segment includes transportation of Liquid Petroleum Gas,
ammonia and other petrochemical gases through the Midsize, VLGC
and pressurised fleet. Transportation of Liquefied Natural Gas is
comprised in the LNG segment. The activities in the offshore industry
through the supply of services and the lease of equipment are al-
located to the Offshore segment. The segment Services includes the
specialised supporting services to the oil and gas industry such as
shipmanagement services, insurance brokerage and travel agency.
As EXMAR is operating on a global scale, income is generated all
over the world and the main assets (vessels) move continuously
from one location to another over the world. A geographical spread
of revenues and assets is therefor not available.
Major LNG client Excelerate Energy Llc represents 78% of the
revenue of the LNG segment revenue and 21% of the EXMAR Group
revenue in 2010.
To be continued on page 40
2. Segment reporting( in thousands of USD)
SEGMENT REPORTING 2009 LPG LNG Offshore Services Elimi nations Total
INCOME STATEMENT
Revenue third party 190,998 103,059 59,339 48,257 401,653Revenue intra-segment 2,486 20 463 11,639 -14,608 0
Total revenue 193,484 103,079 59,802 59,896 -14,608 401,653
Revenue on property rental third party 1,507 1,507
Revenue on property rental intra-segment 173 -173 0
Total revenue on property rental 0 0 0 1,680 -173 1,507
Capital gain on sale of assets 65 65
Other operating income 252 6,501 251 704 -26 7,682
Operating income 193,736 109,580 60,053 62,345 -14,807 410,907
Operating result before depreciation and amortisation charges (EBITDA) 50,583 67,919 2,233 3,963 0 124,698
Depreciations, impairment losses/reversals -43,373 -24,850 -4,332 -2,463 -75,018
Operating result (EBIT) 7,210 43,069 -2,099 1,500 0 49,680
Interest income/expenses (net) -14,250 -28,738 -4,306 -444 -47,738
Other finance income/expenses (net) 10,205 36,605 5,735 -87 52,458
Share of result of equity accounted investees -699 0 -699
Income tax expense -5,731 -40 -169 -751 -6,691
Segment result for the period -2,566 50,896 -1,538 218 0 47,010
Unallocated overhead expenses and finance result -3,560
ResUlt foR the peRiod 43,450
Non-controlling interest -10
Attributable to owners of the Company 43,460
110381 EXMAR JAARVERSLAG FINANCIEEL ENG.indd 38 28/04/11 14:25

39
To be continued on page 41
2. Segment reporting( in thousands of USD)
39
SEGMENT REPORTING 2009 LPG LNG Offshore Services Elimi nations Total
INCOME STATEMENT
Revenue third party 190,998 103,059 59,339 48,257 401,653Revenue intra-segment 2,486 20 463 11,639 -14,608 0
Total revenue 193,484 103,079 59,802 59,896 -14,608 401,653
Revenue on property rental third party 1,507 1,507
Revenue on property rental intra-segment 173 -173 0
Total revenue on property rental 0 0 0 1,680 -173 1,507
Capital gain on sale of assets 65 65
Other operating income 252 6,501 251 704 -26 7,682
Operating income 193,736 109,580 60,053 62,345 -14,807 410,907
Operating result before depreciation and amortisation charges (EBITDA) 50,583 67,919 2,233 3,963 0 124,698
Depreciations, impairment losses/reversals -43,373 -24,850 -4,332 -2,463 -75,018
Operating result (EBIT) 7,210 43,069 -2,099 1,500 0 49,680
Interest income/expenses (net) -14,250 -28,738 -4,306 -444 -47,738
Other finance income/expenses (net) 10,205 36,605 5,735 -87 52,458
Share of result of equity accounted investees -699 0 -699
Income tax expense -5,731 -40 -169 -751 -6,691
Segment result for the period -2,566 50,896 -1,538 218 0 47,010
Unallocated overhead expenses and finance result -3,560
ResUlt foR the peRiod 43,450
Non-controlling interest -10
Attributable to owners of the Company 43,460
110381 EXMAR JAARVERSLAG FINANCIEEL ENG.indd 39 28/04/11 14:25

40
SEGMENT REPORTING 2010 (continued) LPG LNG Offshore Services Elimi nations Total
STATEMENT OF FINANCIAL POSITION
ASSETSVessels 602,118 526,100 38,379 1,166,597
Other property, plant and equipment 6,308 161 380 6,694 13,543
Intangible assets 3,009 251 3,260
Investment property 13,599 13,599
Assets classified as held for sale 298,651 298,651
Cash and cash equivalents 8,945 46,261 9,332 12,252 76,790
TOTAL SEGMENT ASSETS 617,371 572,522 349,751 32,796 0 1,572,440
Unallocated other property plant and equipment 323
Unallocated available-for-sale financial assets 43,004
Unallocated trade and other receivables 80,646
Unallocated cash 53,399
Other unallocated assets 11,731
total assets 1,761,543
EQUITY AND LIABILITIES Non-current borrowings 378,294 514,737 165,000 9,248 1,067,279
Current borrowings 44,255 24,269 12,000 1,037 81,561
Financial instruments 23,838 58,661 7,923 139 90,561
TOTAL SEGMENT LIABILITIES 446,387 597,667 184,923 10,424 0 1,239,401
Unallocated equity 402,622
Unallocated bank overdrafts 10,000
Unallocated trade and other payables 102,177
Unallocated other liabilities 7,343
total eQUitY and liaBilities 1,761,543
CASH FLOW STATEMENT
Cash (used in) from operating activities 40,227 28,695 -9,478 4,626 64,070Cash (used in) from investing activities -42,997 20,640 -3,296 -588 -26,241
Cash (used in) from financing activities -10,792 -22,718 -12,000 1,139 -44,371
Dividends paid/received -30,643
Acquisition on treasury shares -6,103
-13,562 26,617 -24,774 5,177 0 -43,288
ADDITIONAL INFORMATION
Capital expenditures -42,997 -4,214 -3,296 -588 -51,095Proceeds from disposals 24,854 24,854
SEGMENT REPORTING 2009 (continued) LPG LNG Offshore Services Elimi nations Total
STATEMENT OF FINANCIAL POSITION
ASSETSVessels 606,160 809,080 345,297 1,760,537
Other property, plant and equipment 6,048 278 465 9,534 16,325
Intangible assets 3,411 297 3,708
Investment property 15,105 15,105
Cash and cash equivalents 9,406 56,677 6,139 11,518 83,740
TOTAL SEGMENT ASSETS 621,614 866,035 355,312 36,454 0 1,879,415
Unallocated other property plant and equipment 311
Unallocated available-for-sale financial assets 2,189
Unallocated trade and other receivables 67,013
Unallocated cash 80,626
Other unallocated assets 11,937
total assets 0 2,041,491
EQUITY AND LIABILITIES
Non-current borrowings 402,806 782,335 177,000 8,565 1,370,706
Current borrowings 30,535 32,614 12,000 1,282 76,431
Financial instruments 20,699 45,876 4,828 42 71,445
TOTAL SEGMENT LIABILITIES 454,040 860,825 193,828 9,889 0 1,518,582
Unallocated equity 419,843
Unallocated trade and other payables 94,070
Unallocated other liabilities 8,996
total eQUitY and liaBilities 2,041,491
CASH FLOW STATEMENT
Cash (used in) from operating activities 49,648 24,452 -3,699 -10,150 60,251Cash (used in) from investing activities -105,181 -62,489 -47,186 -7,493 -222,349
Cash (used in) from financing activities 62,466 23,261 24,000 -966 108,731
Repayment of convertible bond -75,115
Dividends paid -4,406
Capital increase 142,471
Proceeds from the sale of preferential rights 2,538
6,933 -14,776 -26,885 -18,639 0 12,121
ADDITIONAL INFORMATION
Capital expenditures 105,123 62,487 47,184 2,199 216,993Proceeds from disposals -66 0 0 -361 -427
110381 EXMAR JAARVERSLAG FINANCIEEL ENG.indd 40 28/04/11 14:25

4141
SEGMENT REPORTING 2009 (continued) LPG LNG Offshore Services Elimi nations Total
STATEMENT OF FINANCIAL POSITION
ASSETSVessels 606,160 809,080 345,297 1,760,537
Other property, plant and equipment 6,048 278 465 9,534 16,325
Intangible assets 3,411 297 3,708
Investment property 15,105 15,105
Cash and cash equivalents 9,406 56,677 6,139 11,518 83,740
TOTAL SEGMENT ASSETS 621,614 866,035 355,312 36,454 0 1,879,415
Unallocated other property plant and equipment 311
Unallocated available-for-sale financial assets 2,189
Unallocated trade and other receivables 67,013
Unallocated cash 80,626
Other unallocated assets 11,937
total assets 0 2,041,491
EQUITY AND LIABILITIES
Non-current borrowings 402,806 782,335 177,000 8,565 1,370,706
Current borrowings 30,535 32,614 12,000 1,282 76,431
Financial instruments 20,699 45,876 4,828 42 71,445
TOTAL SEGMENT LIABILITIES 454,040 860,825 193,828 9,889 0 1,518,582
Unallocated equity 419,843
Unallocated trade and other payables 94,070
Unallocated other liabilities 8,996
total eQUitY and liaBilities 2,041,491
CASH FLOW STATEMENT
Cash (used in) from operating activities 49,648 24,452 -3,699 -10,150 60,251Cash (used in) from investing activities -105,181 -62,489 -47,186 -7,493 -222,349
Cash (used in) from financing activities 62,466 23,261 24,000 -966 108,731
Repayment of convertible bond -75,115
Dividends paid -4,406
Capital increase 142,471
Proceeds from the sale of preferential rights 2,538
6,933 -14,776 -26,885 -18,639 0 12,121
ADDITIONAL INFORMATION
Capital expenditures 105,123 62,487 47,184 2,199 216,993Proceeds from disposals -66 0 0 -361 -427
110381 EXMAR JAARVERSLAG FINANCIEEL ENG.indd 41 28/04/11 14:25

42
2010 2009
CAPITAL GAIN ON THE DISPOSAL OF ASSETS
Profit on the sale of 50% of the shares in 3 LNG subsidiaries (*) 46,885 0
Other 17 65
46,902 65
EFFECT ON THE SALE OF 50% OF SHARES ON THE FINANCIAL POSITION Note NOV 2010
Vessels - cost 8 -153,643
Vessels - deprecation 8 36,085
Vessels - net book value -117,558
Trade and other receivables -3,187
Cash and cash equivalents -10,315
Borrowings 24 103,130
Trade and other payables 4,474
Net assets and liabilities -23,456
Consideration received in cash 35,169
Consideration received in available-for-sale Teekay shares 35,172
Total consideration received 70,341
Cash and cash equivalents disposed of -10,315
Net cash inflowstatement of cash flows
60,026
RESULT ON SALE
Net assets and liabilities -23,456
Total consideration received 70,341
Result on sale allocated to the LNG segment 46,885
2010 2009
OTHER
Contribution of third parties in the results realised on the vessel EXCEL 1,927 5,157
Other 1,110 2,592
3,037 7,749
2010 2009
OTHER
Non-income based taxes -908 -1,485
Other -948 -889
-1,856 -2,374
3. Other operating income( in thousands of USD)
4. Other operating expenses( in thousands of USD)
2010 2009
PERSONNEL EXPENSES
Salaries and wages -31,514 -29,272
Social security charges -5,713 -5,918
Defined benefit plan -945 -1,430
Share option plan -1,217 -2,164
-39,389 -38,784
5. Personnel expenses ( in thousands of USD)
(*) The personnel expenses for the seagoing personnel are included in the 'services and other goods'.(*) In November 2010 EXMAR sold 50% of the shares in EXCELSIOR NV, SOLAIA INC and EXMAR EXCALIBUR SHIPPING
CY LTD to Teekay LNG Partners L.P. The effect on the financial position and the result on the sale is shown below:
110381 EXMAR JAARVERSLAG FINANCIEEL ENG.indd 42 28/04/11 14:25
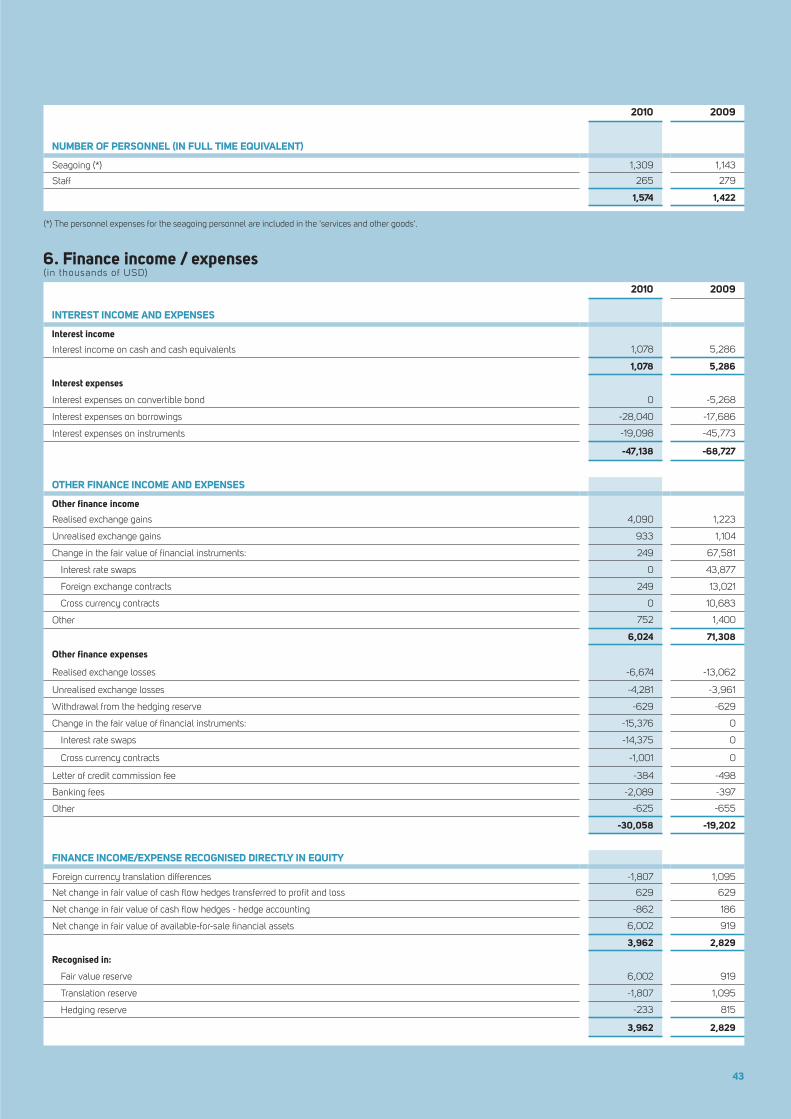
43
2010 2009
CAPITAL GAIN ON THE DISPOSAL OF ASSETS
Profit on the sale of 50% of the shares in 3 LNG subsidiaries (*) 46,885 0
Other 17 65
46,902 65
2010 2009
INTEREST INCOME AND EXPENSES
Interest income
Interest income on cash and cash equivalents 1,078 5,286
1,078 5,286
Interest expenses
Interest expenses on convertible bond 0 -5,268
Interest expenses on borrowings -28,040 -17,686
Interest expenses on instruments -19,098 -45,773
-47,138 -68,727
OTHER FINANCE INCOME AND EXPENSES
Other finance income
Realised exchange gains 4,090 1,223
Unrealised exchange gains 933 1,104
Change in the fair value of financial instruments: 249 67,581
Interest rate swaps 0 43,877
Foreign exchange contracts 249 13,021
Cross currency contracts 0 10,683
Other 752 1,400
6,024 71,308
Other finance expenses
Realised exchange losses -6,674 -13,062
Unrealised exchange losses -4,281 -3,961
Withdrawal from the hedging reserve -629 -629
Change in the fair value of financial instruments: -15,376 0
Interest rate swaps -14,375 0
Cross currency contracts -1,001 0
Letter of credit commission fee -384 -498
Banking fees -2,089 -397
Other -625 -655
-30,058 -19,202
FINANCE INCOME/EXPENSE RECOGNISED DIRECTLY IN EQUITY
Foreign currency translation differences -1,807 1,095
Net change in fair value of cash flow hedges transferred to profit and loss 629 629
Net change in fair value of cash flow hedges - hedge accounting -862 186
Net change in fair value of available-for-sale financial assets 6,002 919
3,962 2,829
Recognised in:
Fair value reserve 6,002 919
Translation reserve -1,807 1,095
Hedging reserve -233 815
3,962 2,829
2010 2009
OTHER
Non-income based taxes -908 -1,485
Other -948 -889
-1,856 -2,374
6. Finance income / expenses ( in thousands of USD)
2010 2009
NUMBER OF PERSONNEL (IN FULL TIME EQUIVALENT)
Seagoing (*) 1,309 1,143
Staff 265 279
1,574 1,422
(*) The personnel expenses for the seagoing personnel are included in the 'services and other goods'.
110381 EXMAR JAARVERSLAG FINANCIEEL ENG.indd 43 28/04/11 14:25
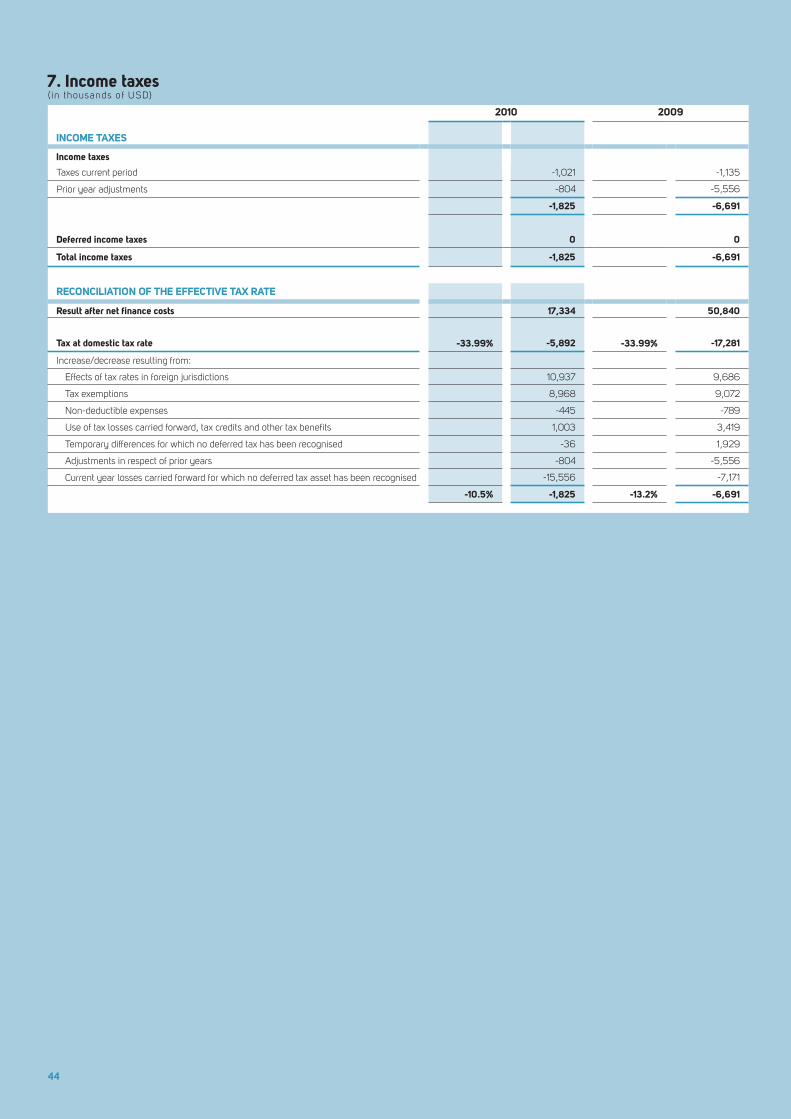
44
7. Income taxes( in thousands of USD)
2010 2009
INCOME TAXES
Income taxes
Taxes current period -1,021 -1,135
Prior year adjustments -804 -5,556
-1,825 -6,691
Deferred income taxes 0 0
Total income taxes -1,825 -6,691
RECONCILIATION OF THE EFFECTIVE TAX RATE
Result after net finance costs 17,334 50,840
Tax at domestic tax rate -33.99% -5,892 -33.99% -17,281
Increase/decrease resulting from:
Effects of tax rates in foreign jurisdictions 10,937 9,686
Tax exemptions 8,968 9,072
Non-deductible expenses -445 -789
Use of tax losses carried forward, tax credits and other tax benefits 1,003 3,419
Temporary differences for which no deferred tax has been recognised -36 1,929
Adjustments in respect of prior years -804 -5,556
Current year losses carried forward for which no deferred tax asset has been recognised -15,556 -7,171
-10.5% -1,825 -13.2% -6,691
110381 EXMAR JAARVERSLAG FINANCIEEL ENG.indd 44 28/04/11 14:25

2010 2009
INCOME TAXES
Income taxes
Taxes current period -1,021 -1,135
Prior year adjustments -804 -5,556
-1,825 -6,691
Deferred income taxes 0 0
Total income taxes -1,825 -6,691
RECONCILIATION OF THE EFFECTIVE TAX RATE
Result after net finance costs 17,334 50,840
Tax at domestic tax rate -33.99% -5,892 -33.99% -17,281
Increase/decrease resulting from:
Effects of tax rates in foreign jurisdictions 10,937 9,686
Tax exemptions 8,968 9,072
Non-deductible expenses -445 -789
Use of tax losses carried forward, tax credits and other tax benefits 1,003 3,419
Temporary differences for which no deferred tax has been recognised -36 1,929
Adjustments in respect of prior years -804 -5,556
Current year losses carried forward for which no deferred tax asset has been recognised -15,556 -7,171
-10.5% -1,825 -13.2% -6,691
45
110381 EXMAR JAARVERSLAG FINANCIEEL ENG.indd 45 28/04/11 14:25

46
LPG LNG OFFSHORE
OperationalUnder
construction Total LPG OperationalUnder
construction Total LNG OperationalUnder
construction Total Offshore Total
COST 2009
Balance as per 1 January 2009 783,932 15,533 799,465 626,911 293,532 920,443 30,079 288,447 318,526 2,038,434
Changes during the financial year
Vessel acquisition 40,880 52,930 93,810 29 62,428 62,457 162 46,881 47,043 203,310
Component acquisition (drydock) 10,496 10,496 0 0 10,496
Component disposal (drydock) -4,893 -4,893 0 0 -4,893
Transfers 60,012 -60,012 0 142,206 -142,206 0 328,068 -328,068 0 0
Change in consolidation scope 0 -71,124 -71,124 0 -71,124
Balance as per 31 December 2009 890,427 8,451 898,878 769,146 142,630 911,776 358,309 7,260 365,569 2,176,223
COST 2010
Balance as per 1 January 2010 890,427 8,451 898,878 769,146 142,630 911,776 358,309 7,260 365,569 2,176,223
Changes during the financial year
Vessel acquisition 24,021 24,021 0 83 3,121 3,204 27,225
Component acquisition (drydock) 18,806 18,806 4,189 4,189 0 22,995
Component disposal (drydock) -7,922 -7,922 -1,520 -1,520 0 -9,442
Transfers 32,472 -32,472 0 0 10,381 -10,381 0 0
Transfer to assets classified as held for sale (*) 0 0 -304,628 -304,628 -304,628
Change in consolidation scope (**) 0 -153,643 -142,630 -296,273 0 -296,273
Balance as per 31 December 2010 933,783 0 933,783 618,172 0 618,172 64,145 0 64,145 1,616,100
DEPRECIATIONS AND IMPAIRMENT LOSSES 2009
Balance as per 1 January 2009 255,371 0 255,371 77,955 0 77,955 16,440 0 16,440 349,766
Changes during the financial year
Depreciations 42,240 42,240 24,741 24,741 3,832 3,832 70,813
Component disposal (drydock) -4,893 -4,893 0 0 -4,893
Balance as per 31 December 2009 292,718 0 292,718 102,696 0 102,696 20,272 0 20,272 415,686
DEPRECIATIONS AND IMPAIRMENT LOSSES 2010
Balance as per 1 January 2010 292,718 0 292,718 102,696 0 102,696 20,272 0 20,272 415,686
Changes during the financial year
Depreciations 46,869 46,869 26,981 26,981 11,471 11,471 85,321
Component disposal (drydock) -7,922 -7,922 -1,520 -1,520 0 -9,442
Transfer to assets classified as held for sale (*) 0 0 -5,977 -5,977 -5,977
Change in consolidation scope (**) 0 -36,085 -36,085 0 -36,085
Balance as per 31 December 2010 331,665 0 331,665 92,072 0 92,072 25,766 0 25,766 449,503
NET BOOK VALUE
Net book value as per 31 December 2009 597,709 8,451 606,160 666,450 142,630 809,080 338,037 7,260 345,297 1,760,537
Net book value as per 31 December 2010 602,118 0 602,118 526,100 0 526,100 38,379 0 38,379 1,166,597
8. Vessels( in thousands of USD)
(*) The offshore unit OPTI-EX was transferred to assets classified as held for sale in view of the sales agreement with LLOG Development Company LLC. The sale is subject to closing conditions which are expected to be fulfilled in 2011 in order to realise the sale.
(**) The change in consolidation scope relates to the sale of the shares in EXPEDIENT NV and EXEMPLAR NV (vessels under construction) and the sale of 50% of the shares in EXCELSIOR NV and SOLAIA INC (operational vessels); see note 3.
110381 EXMAR JAARVERSLAG FINANCIEEL ENG.indd 46 28/04/11 14:25

4747
LPG LNG OFFSHORE
OperationalUnder
construction Total LPG OperationalUnder
construction Total LNG OperationalUnder
construction Total Offshore Total
COST 2009
Balance as per 1 January 2009 783,932 15,533 799,465 626,911 293,532 920,443 30,079 288,447 318,526 2,038,434
Changes during the financial year
Vessel acquisition 40,880 52,930 93,810 29 62,428 62,457 162 46,881 47,043 203,310
Component acquisition (drydock) 10,496 10,496 0 0 10,496
Component disposal (drydock) -4,893 -4,893 0 0 -4,893
Transfers 60,012 -60,012 0 142,206 -142,206 0 328,068 -328,068 0 0
Change in consolidation scope 0 -71,124 -71,124 0 -71,124
Balance as per 31 December 2009 890,427 8,451 898,878 769,146 142,630 911,776 358,309 7,260 365,569 2,176,223
COST 2010
Balance as per 1 January 2010 890,427 8,451 898,878 769,146 142,630 911,776 358,309 7,260 365,569 2,176,223
Changes during the financial year
Vessel acquisition 24,021 24,021 0 83 3,121 3,204 27,225
Component acquisition (drydock) 18,806 18,806 4,189 4,189 0 22,995
Component disposal (drydock) -7,922 -7,922 -1,520 -1,520 0 -9,442
Transfers 32,472 -32,472 0 0 10,381 -10,381 0 0
Transfer to assets classified as held for sale (*) 0 0 -304,628 -304,628 -304,628
Change in consolidation scope (**) 0 -153,643 -142,630 -296,273 0 -296,273
Balance as per 31 December 2010 933,783 0 933,783 618,172 0 618,172 64,145 0 64,145 1,616,100
DEPRECIATIONS AND IMPAIRMENT LOSSES 2009
Balance as per 1 January 2009 255,371 0 255,371 77,955 0 77,955 16,440 0 16,440 349,766
Changes during the financial year
Depreciations 42,240 42,240 24,741 24,741 3,832 3,832 70,813
Component disposal (drydock) -4,893 -4,893 0 0 -4,893
Balance as per 31 December 2009 292,718 0 292,718 102,696 0 102,696 20,272 0 20,272 415,686
DEPRECIATIONS AND IMPAIRMENT LOSSES 2010
Balance as per 1 January 2010 292,718 0 292,718 102,696 0 102,696 20,272 0 20,272 415,686
Changes during the financial year
Depreciations 46,869 46,869 26,981 26,981 11,471 11,471 85,321
Component disposal (drydock) -7,922 -7,922 -1,520 -1,520 0 -9,442
Transfer to assets classified as held for sale (*) 0 0 -5,977 -5,977 -5,977
Change in consolidation scope (**) 0 -36,085 -36,085 0 -36,085
Balance as per 31 December 2010 331,665 0 331,665 92,072 0 92,072 25,766 0 25,766 449,503
NET BOOK VALUE
Net book value as per 31 December 2009 597,709 8,451 606,160 666,450 142,630 809,080 338,037 7,260 345,297 1,760,537
Net book value as per 31 December 2010 602,118 0 602,118 526,100 0 526,100 38,379 0 38,379 1,166,597
8. Vessels( in thousands of USD)
110381 EXMAR JAARVERSLAG FINANCIEEL ENG.indd 47 28/04/11 14:25
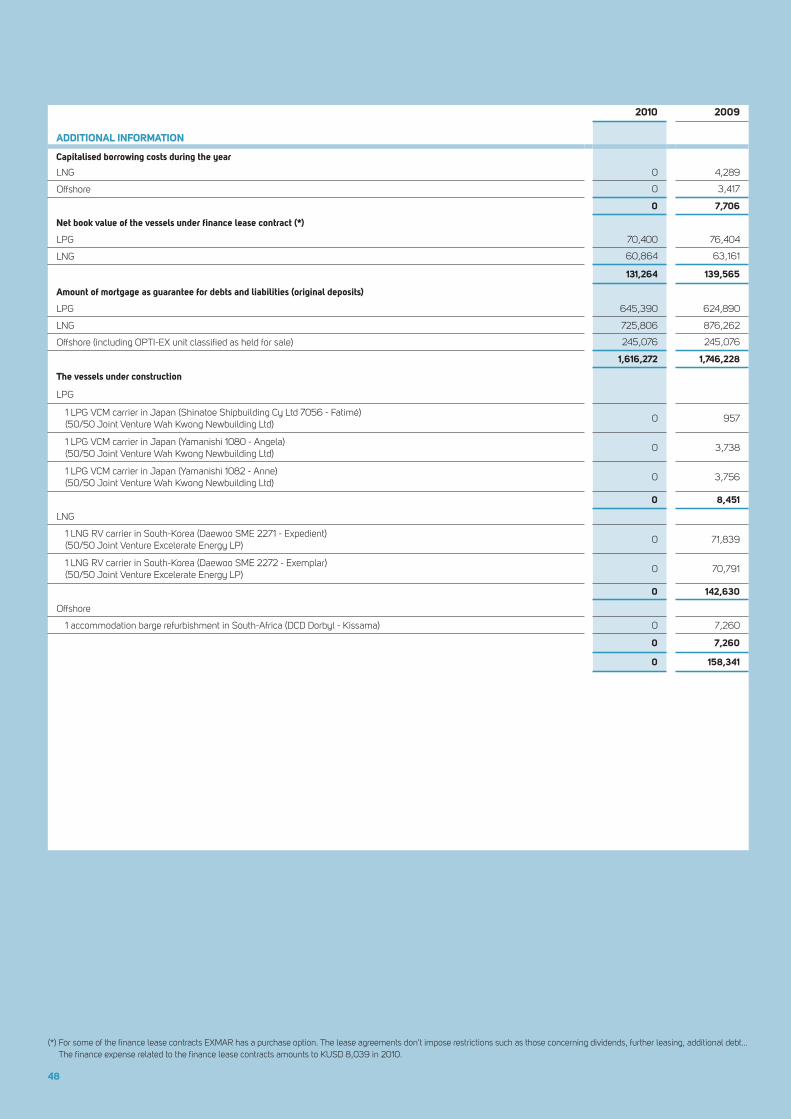
48
2010 2009
ADDITIONAL INFORMATION
Capitalised borrowing costs during the year
LNG 0 4,289
Offshore 0 3,417
0 7,706
Net book value of the vessels under finance lease contract (*)
LPG 70,400 76,404
LNG 60,864 63,161
131,264 139,565
Amount of mortgage as guarantee for debts and liabilities (original deposits)
LPG 645,390 624,890
LNG 725,806 876,262
Offshore (including OPTI-EX unit classified as held for sale) 245,076 245,076
1,616,272 1,746,228
The vessels under construction
LPG
1 LPG VCM carrier in Japan (Shinatoe Shipbuilding Cy Ltd 7056 - Fatimé)(50/50 Joint Venture Wah Kwong Newbuilding Ltd)
0 957
1 LPG VCM carrier in Japan (Yamanishi 1080 - Angela)(50/50 Joint Venture Wah Kwong Newbuilding Ltd)
0 3,738
1 LPG VCM carrier in Japan (Yamanishi 1082 - Anne)(50/50 Joint Venture Wah Kwong Newbuilding Ltd)
0 3,756
0 8,451
LNG
1 LNG RV carrier in South-Korea (Daewoo SME 2271 - Expedient)(50/50 Joint Venture Excelerate Energy LP)
0 71,839
1 LNG RV carrier in South-Korea (Daewoo SME 2272 - Exemplar)(50/50 Joint Venture Excelerate Energy LP)
0 70,791
0 142,630
Offshore
1 accommodation barge refurbishment in South-Africa (DCD Dorbyl - Kissama) 0 7,260
0 7,260
0 158,341
SEGMENT REPORTING 2009 Land and buildings
Machinery and
equipment
Furniture and
movables OtherAssets under construction Total
COST 2009
Balance as per 1 January 2009 3,312 1,456 8,436 13,820 812 27,836
Changes during the financial year
Acquisitions 557 1,256 670 169 2,652
Disposals -49 -1,709 -1 -1,759
Transfer from assets classified as held for sale 1,661 1,661
Transfer to investment property -31 -31
Translation differences 109 58 161 253 34 615
Balance as per 31 December 2009 5,082 2,022 8,144 14,742 984 30,974
COST 2010
Balance as per 1 January 2010 5,082 2,022 8,144 14,742 984 30,974
Changes during the financial year
Acquisitions 64 145 754 185 1,148
Disposals -34 -699 -733
Transfer 1,093 -1,093 0
Translation differences -226 -118 -315 -560 -76 -1,295
Balance as per 31 December 2010 6,013 2,015 7,884 14,182 0 30,094
DEPRECIATIONS AND IMPAIRMENT LOSSES 2009
Balance as per 1 January 2009 931 1,177 4,843 5,192 0 12,143
Changes during the financial year
Depreciations 284 193 1,218 1,384 3,079
Disposals -31 -1,364 -1 -1,396
Transfer from assets classified as held for sale 227 227
Translation differences 34 43 95 113 285
Balance as per 31 December 2009 1,476 1,382 4,792 6,688 0 14,338
DEPRECIATIONS AND IMPAIRMENT LOSSES 2010
Balance as per 1 January 2010 1,476 1,382 4,792 6,688 0 14,338
Changes during the financial year
Depreciations 231 237 1,206 1,398 3,072
Disposals -585 -585
Translation differences -74 -91 -187 -245 -597
Balance as per 31 December 2010 1,633 1,528 5,226 7,841 0 16,228
NET BOOK VALUE
Net book value as per 31 December 2009 3,606 640 3,352 8,054 984 16,636
Net book value as per 31 December 2010 4,380 487 2,658 6,341 0 13,866
(*) For some of the finance lease contracts EXMAR has a purchase option. The lease agreements don't impose restrictions such as those concerning dividends, further leasing, additional debt… The finance expense related to the finance lease contracts amounts to KUSD 8,039 in 2010.
110381 EXMAR JAARVERSLAG FINANCIEEL ENG.indd 48 28/04/11 14:25

49
2010 2009
ADDITIONAL INFORMATION
Capitalised borrowing costs during the year
LNG 0 4,289
Offshore 0 3,417
0 7,706
Net book value of the vessels under finance lease contract (*)
LPG 70,400 76,404
LNG 60,864 63,161
131,264 139,565
Amount of mortgage as guarantee for debts and liabilities (original deposits)
LPG 645,390 624,890
LNG 725,806 876,262
Offshore (including OPTI-EX unit classified as held for sale) 245,076 245,076
1,616,272 1,746,228
The vessels under construction
LPG
1 LPG VCM carrier in Japan (Shinatoe Shipbuilding Cy Ltd 7056 - Fatimé)(50/50 Joint Venture Wah Kwong Newbuilding Ltd)
0 957
1 LPG VCM carrier in Japan (Yamanishi 1080 - Angela)(50/50 Joint Venture Wah Kwong Newbuilding Ltd)
0 3,738
1 LPG VCM carrier in Japan (Yamanishi 1082 - Anne)(50/50 Joint Venture Wah Kwong Newbuilding Ltd)
0 3,756
0 8,451
LNG
1 LNG RV carrier in South-Korea (Daewoo SME 2271 - Expedient)(50/50 Joint Venture Excelerate Energy LP)
0 71,839
1 LNG RV carrier in South-Korea (Daewoo SME 2272 - Exemplar)(50/50 Joint Venture Excelerate Energy LP)
0 70,791
0 142,630
Offshore
1 accommodation barge refurbishment in South-Africa (DCD Dorbyl - Kissama) 0 7,260
0 7,260
0 158,341
SEGMENT REPORTING 2009 Land and buildings
Machinery and
equipment
Furniture and
movables OtherAssets under construction Total
COST 2009
Balance as per 1 January 2009 3,312 1,456 8,436 13,820 812 27,836
Changes during the financial year
Acquisitions 557 1,256 670 169 2,652
Disposals -49 -1,709 -1 -1,759
Transfer from assets classified as held for sale 1,661 1,661
Transfer to investment property -31 -31
Translation differences 109 58 161 253 34 615
Balance as per 31 December 2009 5,082 2,022 8,144 14,742 984 30,974
COST 2010
Balance as per 1 January 2010 5,082 2,022 8,144 14,742 984 30,974
Changes during the financial year
Acquisitions 64 145 754 185 1,148
Disposals -34 -699 -733
Transfer 1,093 -1,093 0
Translation differences -226 -118 -315 -560 -76 -1,295
Balance as per 31 December 2010 6,013 2,015 7,884 14,182 0 30,094
DEPRECIATIONS AND IMPAIRMENT LOSSES 2009
Balance as per 1 January 2009 931 1,177 4,843 5,192 0 12,143
Changes during the financial year
Depreciations 284 193 1,218 1,384 3,079
Disposals -31 -1,364 -1 -1,396
Transfer from assets classified as held for sale 227 227
Translation differences 34 43 95 113 285
Balance as per 31 December 2009 1,476 1,382 4,792 6,688 0 14,338
DEPRECIATIONS AND IMPAIRMENT LOSSES 2010
Balance as per 1 January 2010 1,476 1,382 4,792 6,688 0 14,338
Changes during the financial year
Depreciations 231 237 1,206 1,398 3,072
Disposals -585 -585
Translation differences -74 -91 -187 -245 -597
Balance as per 31 December 2010 1,633 1,528 5,226 7,841 0 16,228
NET BOOK VALUE
Net book value as per 31 December 2009 3,606 640 3,352 8,054 984 16,636
Net book value as per 31 December 2010 4,380 487 2,658 6,341 0 13,866
9. Other property, plant and equipment( in thousands of USD)
110381 EXMAR JAARVERSLAG FINANCIEEL ENG.indd 49 28/04/11 14:25

50
Concessions, patents, licences
Client portfolio Other Total
COST 2009
Balance as per 1 January 2009 1,949 4,387 3,500 9,836
Changes during the financial year
Acquisitions 219 0 219
Translation differences 70 70
Balance as per 31 December 2009 2,238 4,387 3,500 10,125
COST 2010
Balance as per 1 January 2010 2,238 4,387 3,500 10,125
Changes during the financial year
Acquisitions 121 121
Disposals -6 -6
Translation differences -157 -157
Balance as per 31 December 2010 2,196 4,387 3,500 10,083
AMORTISATIONS AND IMPAIRMENTS LOSSES 2009
Balance as per 1 January 2009 1,529 4,240 0 5,769
Changes during the financial year
Depreciations 248 147 193 588
Translation differences 60 60
Balance as per 31 December 2009 1,837 4,387 193 6,417
AMORTISATIONS AND IMPAIRMENTS LOSSES 2010
Balance as per 1 January 2010 1,837 4,387 193 6,417
Changes during the financial year
Depreciations 190 350 540
Disposals -2 -2
Translation differences -132 -132
Balance as per 31 December 2010 1,893 4,387 543 6,823
NET BOOK VALUE
Net book value as per 31 December 2009 401 0 3,307 3,708
Net book value as per 31 December 2010 303 0 2,957 3,260
Investment property
COST 2009
Balance as per 1 January 2009 18,845
Changes during the financial year
Acquisitions 316
Transfer from assets under construction 31
Translation differences 572
Balance as per 31 December 2009 19,764
COST 2010
Balance as per 1 January 2010 19,764
Changes during the financial year
Translation differences -1,222
Balance as per 31 December 2010 18,542
DEPRECIATIONS AND IMPAIRMENT LOSSES 2009
Balance as per 1 January 2009 3,958
Changes during the financial year
Depreciations 573
Translation differences 128
Balance as per 31 December 2009 4,659
DEPRECIATIONS AND IMPAIRMENT LOSSES 2010
Balance as per 1 January 2010 4,659
Changes during the financial year
Depreciations 556
Translation differences -272
Balance as per 31 December 2010 4,943
NET BOOK VALUE
Net book value as per 31 December 2009 15,105
Net book value as per 31 December 2010 13,599
FAIR VALUE (*)
Fair value as per 31 December 2009 32,240
Fair value as per 31 December 2010 29,177
10. Intangible assets( in thousands of USD)
(*) The fair value is based upon a valuation made by a qualified broker.
110381 EXMAR JAARVERSLAG FINANCIEEL ENG.indd 50 28/04/11 14:25

51
Investment property
COST 2009
Balance as per 1 January 2009 18,845
Changes during the financial year
Acquisitions 316
Transfer from assets under construction 31
Translation differences 572
Balance as per 31 December 2009 19,764
COST 2010
Balance as per 1 January 2010 19,764
Changes during the financial year
Translation differences -1,222
Balance as per 31 December 2010 18,542
DEPRECIATIONS AND IMPAIRMENT LOSSES 2009
Balance as per 1 January 2009 3,958
Changes during the financial year
Depreciations 573
Translation differences 128
Balance as per 31 December 2009 4,659
DEPRECIATIONS AND IMPAIRMENT LOSSES 2010
Balance as per 1 January 2010 4,659
Changes during the financial year
Depreciations 556
Translation differences -272
Balance as per 31 December 2010 4,943
NET BOOK VALUE
Net book value as per 31 December 2009 15,105
Net book value as per 31 December 2010 13,599
FAIR VALUE (*)
Fair value as per 31 December 2009 32,240
Fair value as per 31 December 2010 29,177
11. Investment property( in thousands of USD)
(*) The fair value is based upon a valuation made by a qualified broker.
110381 EXMAR JAARVERSLAG FINANCIEEL ENG.indd 51 28/04/11 14:25

52
Equity accounted investees
EQUITY ACCOUNTED INVESTEES
Balance as per 1 January 2009 402
Gross amount 402
Accumulated impairment losses(-) 0
Changes during the financial year
Share in the profit/loss(-) -699
Acquisition 5,627
Translation differences 344
Balance as per 31 December 2009 5,674
Gross amount 5,674
Accumulated impairment losses(-) 0
Changes during the financial year
Share in the profit/loss(-) -1,135
Share in dividend -48
Translation differences -233
Balance as per 31 December 2010 4,258
Gross amount 4,258
Accumulated impairment losses(-) 0
Other investments Other loans Total
OTHER INVESTMENTS
Balance as per 1 January 2009 1,040 1,258 2,298
Gross amount 1,280 1,258 2,538
Accumulated impairment losses(-) -240 0 -240
Changes during the financial year
Investments 124 124
Translation differences 1 1
Balance as per 31 December 2009 1,041 1,382 2,423
Gross amount 1,281 1,382 2,663
Accumulated impairment losses(-) -240 0 -240
Changes during the financial year
Investments 1 1
Disposals -5 -5
Translation differences -2 -2
Balance as per 31 December 2010 1,034 1,383 2,417
Gross amount 1,272 1,383 2,655
Accumulated impairment losses(-) -238 0 -238
Share
Country 2010 2009
SHARE IN EQUITY ACCOUNTED INVESTEES
Marpos nv Belgium 45 % 45%
Bexco nv Belgium 27 % 27%
12. Equity accounted investees( in thousands of USD)
13. Associated companies( in thousands of USD)
Assets Liabilities Equity Revenue Profit / Loss(-)
FINANCIAL INFORMATION - 100 %
2010
Marpos nv 1,381 559 822 1,538 92
Bexco nv 22,197 7,593 14,604 17,017 -4,420
23,578 8,152 15,426 18,555 -4,328
2009
Marpos nv 1,283 381 902 1,439 -21
Bexco nv 31,483 11,693 19,790 17,045 -2,591
32,766 12,074 20,692 18,484 -2,612
110381 EXMAR JAARVERSLAG FINANCIEEL ENG.indd 52 28/04/11 14:25

5353
Other investments Other loans Total
OTHER INVESTMENTS
Balance as per 1 January 2009 1,040 1,258 2,298
Gross amount 1,280 1,258 2,538
Accumulated impairment losses(-) -240 0 -240
Changes during the financial year
Investments 124 124
Translation differences 1 1
Balance as per 31 December 2009 1,041 1,382 2,423
Gross amount 1,281 1,382 2,663
Accumulated impairment losses(-) -240 0 -240
Changes during the financial year
Investments 1 1
Disposals -5 -5
Translation differences -2 -2
Balance as per 31 December 2010 1,034 1,383 2,417
Gross amount 1,272 1,383 2,655
Accumulated impairment losses(-) -238 0 -238
12. Equity accounted investees( in thousands of USD)
14. Other investments( in thousands of USD)
13. Associated companies( in thousands of USD)
2010 2009
NON-CURRENT OTHER RECEIVABLES
Non-current receivable on joint venture partner 500 500
500 500
15. Non-current other receivables( in thousands of USD)
110381 EXMAR JAARVERSLAG FINANCIEEL ENG.indd 53 28/04/11 14:25

54
2010 2009
COST
Balance as per 1 January 0 1,661
Changes during the financial year
Transfer from vessels 304,628
Transfer to other property, plant and equipment -1,661
Balance as per 31 December 304,628 0
DEPRECIATIONS AND IMPAIRMENT LOSSES
Balance as per 1 January 0 227
Changes during the financial year
Transfer from vessels 5,977 0
Transfer to other property, plant and equipment -227
Balance as per 31 December 5,977 0
NET BOOK VAUE
Net book value as per 31 December 298,651 0
FAIR VALUE
Fair value as per 31 December 348,277 0
2010 2009
TRADE AND OTHER RECEIVABLES
Trade receivables 51,804 39,239
Cash guarantees 926 883
Other receivables 10,349 6,463
Deferred charges (*) 14,050 16,770
Accrued income (*) 3,517 3,658
80,646 67,013
Of which financial assets (note 29) 60,554 44,628
2010 2009
CURRENT TAX ASSETS AND LIABILITIES
Current tax assets 4,215 2,987
Current tax liabilities 589 1,352
2010 2009
SHARES AVAILABLE FOR SALE
Quoted shares (*) 43,004 2,189
Unquoted shares 0 0
43,004 2,189
16. Assets classified as held for sale( in thousands of USD)
18. Trade and other receivables( in thousands of USD)
17. Available-for-sale financial assets( in thousands of USD)
The Group's exposure to credit and currency risks and impairment losses related to trade and other receivables is disclosed in note 29.
(*) ‘Deferred charges' comprise expenses already invoiced relating to the next accounting year, e.g. hire, insurances, commissions, bunkers, ... ‘Accrued income' comprises uninvoiced revenue related to the current accounting period, e.g. interests, ...
The assets classified as held for sale represent the net book value of the OPTI-EX offshore unit. The OPTI-EX is transferred to assets classified as held for sale in view of the sales agreement with LLOG Development Company LLC in 2010, which is subject to conditions to be fulfilled in 2011. The fair value of the OPTI-EX is calculated based on the discounted cash flows to be received based on the sales agreement.
(*) EXMAR sold 50% of the shares in EXCELSIOR NV, SOLAIA INC and EXMAR EXCALIBUR SHIPPING CY LTD to Teekay LNG Partners L.P. The sale was partly settled in Teekay TGP shares for a value of KUSD 35,172 being 33,41 USD per share. See note 3 for further explanation on the sales transaction. The Teekay TGP shares are measured at fair value at year-end based on a rate of 37,99 USD per share.
Assets Liabilities Assets Liabilities
31 December 2010 31 December 2009
DEFERRED TAX ASSETS AND LIABILITIES IN DETAIL
Property, plant and equipment 649 654
Intangible assets 6 10
Provisions 1,597 1,548
Employee benefits 3,000 2,718
Other 132 105
Investments in subsidiaries -380 -501
Tax assets / liabilities (-) 5,384 -380 5,035 -501
Set off of tax assets / liabilities -380 380 -501 501
Tax assets not recognised (*) -5,004 0 -4,534 0
Net tax asset / liability (-) 0 0 0 0
DEFERRED TAX ASSETS AND LIABILITIES NOT RECOGNISED
Deductible temporary differences (33,99 %) 5,004 4,534
Unused tax losses and investment tax credits (**) 124,174 128,427
129,178 0 132,961 0
Set off of tax assets / liabilities 0 0
Net deferred tax assets / liabilities not recognised (*) 129,178 0 132,961 0
110381 EXMAR JAARVERSLAG FINANCIEEL ENG.indd 54 28/04/11 14:25

55
2010 2009
COST
Balance as per 1 January 0 1,661
Changes during the financial year
Transfer from vessels 304,628
Transfer to other property, plant and equipment -1,661
Balance as per 31 December 304,628 0
DEPRECIATIONS AND IMPAIRMENT LOSSES
Balance as per 1 January 0 227
Changes during the financial year
Transfer from vessels 5,977 0
Transfer to other property, plant and equipment -227
Balance as per 31 December 5,977 0
NET BOOK VAUE
Net book value as per 31 December 298,651 0
FAIR VALUE
Fair value as per 31 December 348,277 0
2010 2009
CURRENT TAX ASSETS AND LIABILITIES
Current tax assets 4,215 2,987
Current tax liabilities 589 1,352
2010 2009
SHARES AVAILABLE FOR SALE
Quoted shares (*) 43,004 2,189
Unquoted shares 0 0
43,004 2,189
16. Assets classified as held for sale( in thousands of USD)
19. Current tax assets and liabilities( in thousands of USD)
17. Available-for-sale financial assets( in thousands of USD)
The Group's exposure to credit and currency risks and impairment losses related to trade and other receivables is disclosed in note 29.
(*) ‘Deferred charges' comprise expenses already invoiced relating to the next accounting year, e.g. hire, insurances, commissions, bunkers, ... ‘Accrued income' comprises uninvoiced revenue related to the current accounting period, e.g. interests, ...
Assets Liabilities Assets Liabilities
31 December 2010 31 December 2009
DEFERRED TAX ASSETS AND LIABILITIES IN DETAIL
Property, plant and equipment 649 654
Intangible assets 6 10
Provisions 1,597 1,548
Employee benefits 3,000 2,718
Other 132 105
Investments in subsidiaries -380 -501
Tax assets / liabilities (-) 5,384 -380 5,035 -501
Set off of tax assets / liabilities -380 380 -501 501
Tax assets not recognised (*) -5,004 0 -4,534 0
Net tax asset / liability (-) 0 0 0 0
DEFERRED TAX ASSETS AND LIABILITIES NOT RECOGNISED
Deductible temporary differences (33,99 %) 5,004 4,534
Unused tax losses and investment tax credits (**) 124,174 128,427
129,178 0 132,961 0
Set off of tax assets / liabilities 0 0
Net deferred tax assets / liabilities not recognised (*) 129,178 0 132,961 0
20. Deferred tax assets and liabilities( in thousands of USD)
(*) These deferred tax assets have not been recognised because no taxable profits are to be expected in the coming years.
(**) The unused tax losses and the main part of the tax credits do not expire in time.
2010 2009
CASH AND CASH EQUIVALENTS
Bank 44,782 70,614
Cash in hand 205 289
Short-term deposits (*) 85,202 93,463
130,189 164,366
Less:
Bank overdrafts -10,000 0
Net cash and cash equivalents 120,189 164,366
21. Cash and cash equivalents( in thousands of USD)
(*) Includes reserved cash related to credit facilities and financial instrument agreements for an amount of KUSD 68,110 for 2010 (KUSD 61,618 for 2009).
110381 EXMAR JAARVERSLAG FINANCIEEL ENG.indd 55 28/04/11 14:25

56
2010 2009
NUMBER OF ORDINARY SHARES
Issued shares as per 1 January 59,500,000 35,700,000
Capital increase 23,800,000
Issued shares as per 31 December - paid in full 59,500,000 59,500,000
2010 2009
DIVIDEND PAID
Gross interim dividend/share (in EUR) 0.30 0.00
Rate used: 1.3711 0.00
Interim dividend payment (in thousands of USD) 23,103 0
Dividend payment (in thousands of USD) 7,588 4,406
Total distribution to owners of the Company (in thousands of USD) 30,691 4,406
22. Share capital and reserves
SHARE CAPITAL AND SHARE PREMIUM
DIVIDENDS
The issued shares do not mention a nominal value. The holders
of ordinary shares are entitled to dividends and are entitled to one
vote per share during the general shareholders' meetings of the
Company.
In October 2010 the Board of Directors approved the payment of the
following interim dividend, which was recognised as a distribution to
owners of the Company in 2010. The proposed dividend for 2009 of
0,1 EUR per share has been approved by the general shareholders'
meeting in May 2010 and was recognised as a distribution to owners
of the Company during 2010.
After the balance sheet date the Board of Directors made the fol-
lowing dividend proposal for 2010. The proposal for dividend has not
yet been approved by the general shareholders' meeting, and has
not been processed in the statement of financial position.
2010 2009
TREASURY SHARES
Number of treasury shares held as of 31 December 3,332,642 2,510,303
Bookvalue of treasury shares held (in thousands USD) 72,234 66,131
Average cost price per share (in EUR) 15,3537 18,5172
2010 2009
PROPOSED DIVIDEND
Gross dividend/share (in EUR) 0.10 0.10
Rate used: 1.3362 1.4406
Proposed dividend payment (in thousands of USD) 7,950 8,572
TREASURY SHARES
The translation reserve comprises all foreign exchange differences
arising from the translation of the financial statements of foreign
The fair value reserve includes the cumulative net change in the fair
value of available-for-sale financial assets until derecognition.
The hedging reserve comprises the effective portion of the cumula-
tive net change in the fair value of cash flow hedging instruments
The reserve for treasury shares comprises the cost of the Company's
shares held by the Group. In 2010 EXMAR bought 822,339 treasury
shares for an amount of KUSD 6,103.
HEDGING RESERVE
(*) Option plans 1 - 6 are anti-dilutive as per 31 December 2010 and they are not included in the calculation of the diluted earnings per share.
110381 EXMAR JAARVERSLAG FINANCIEEL ENG.indd 56 28/04/11 14:25

57
22. Share capital and reserves
SHARE CAPITAL AND SHARE PREMIUM
DIVIDENDS
yet been approved by the general shareholders' meeting, and has
not been processed in the statement of financial position.
2010 2009
PROPOSED DIVIDEND
Gross dividend/share (in EUR) 0.10 0.10
Rate used: 1.3362 1.4406
Proposed dividend payment (in thousands of USD) 7,950 8,572
TRANSLATION RESERVE
FAIR VALUE RESERVE
The translation reserve comprises all foreign exchange differences
arising from the translation of the financial statements of foreign
operations and financial statements not reporting in USD as
functional currency.
The fair value reserve includes the cumulative net change in the fair
value of available-for-sale financial assets until derecognition.
The hedging reserve comprises the effective portion of the cumula-
tive net change in the fair value of cash flow hedging instruments
related to the hedged transactions that have not yet occurred.
HEDGING RESERVE
2010 2009
BASIC EARNINGS PER SHARE
Result for the period (in USD) 14,357,599 43,460,314
Issued ordinary shares as per 31 December 59,500,000 59,500,000
Capital increase -22,365,479
Effect of treasury shares -2,830,568 -2,510,303
Weighted average number of ordinary shares as per 31 December 56,669,432 34,624,218
Basic earnings per share in USD 0.25 1.26
DILUTED EARNINGS PER SHARE
Result for the period (in USD) 14,357,599 43,460,314
Weighted average number of ordinary shares as per 31 December 56,669,432 34,624,218
Average closing rate of one ordinary share during the year (in EUR) (a) 5.57 7.07
Average exercise price for shares under option during the year (in EUR) (b) 7.04
Number of shares under option (c) 156,068
Number of shares that would have been issued at average market price: (c*b) / a 0 -155,406
Weighted average number of ordinary shares during the year including options 56,669,432 34,624,880
Diluted earnings per share (in USD) (*) 0.25 1.26
23. Earnings per share
(*) Option plans 1 - 6 are anti-dilutive as per 31 December 2010 and they are not included in the calculation of the diluted earnings per share.
110381 EXMAR JAARVERSLAG FINANCIEEL ENG.indd 57 28/04/11 14:25
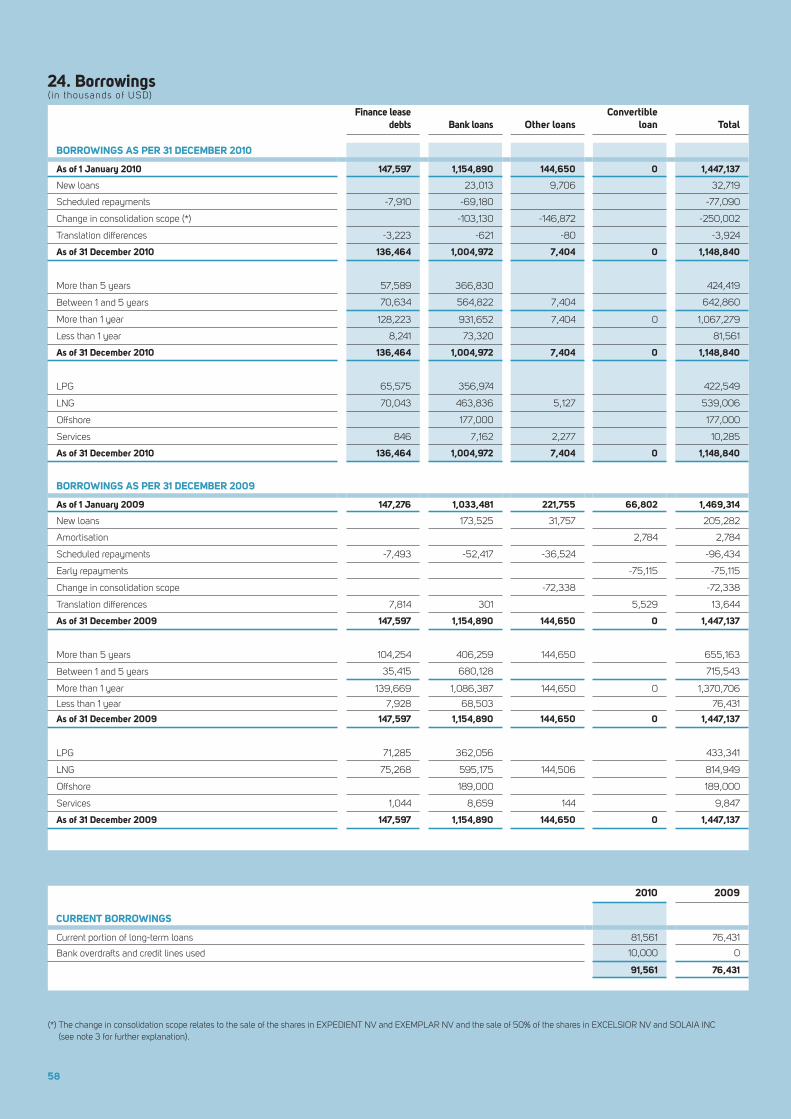
58
(*) The change in consolidation scope relates to the sale of the shares in EXPEDIENT NV and EXEMPLAR NV and the sale of 50% of the shares in EXCELSIOR NV and SOLAIA INC (see note 3 for further explanation).
Finance lease debts Bank loans Other loans
Convertible loan Total
BORROWINGS AS PER 31 DECEMBER 2010
As of 1 January 2010 147,597 1,154,890 144,650 0 1,447,137
New loans 23,013 9,706 32,719
Scheduled repayments -7,910 -69,180 -77,090
Change in consolidation scope (*) -103,130 -146,872 -250,002
Translation differences -3,223 -621 -80 -3,924
As of 31 December 2010 136,464 1,004,972 7,404 0 1,148,840
More than 5 years 57,589 366,830 424,419
Between 1 and 5 years 70,634 564,822 7,404 642,860
More than 1 year 128,223 931,652 7,404 0 1,067,279
Less than 1 year 8,241 73,320 81,561
As of 31 December 2010 136,464 1,004,972 7,404 0 1,148,840
LPG 65,575 356,974 422,549
LNG 70,043 463,836 5,127 539,006
Offshore 177,000 177,000
Services 846 7,162 2,277 10,285
As of 31 December 2010 136,464 1,004,972 7,404 0 1,148,840
BORROWINGS AS PER 31 DECEMBER 2009
As of 1 January 2009 147,276 1,033,481 221,755 66,802 1,469,314
New loans 173,525 31,757 205,282
Amortisation 2,784 2,784
Scheduled repayments -7,493 -52,417 -36,524 -96,434
Early repayments -75,115 -75,115
Change in consolidation scope -72,338 -72,338
Translation differences 7,814 301 5,529 13,644
As of 31 December 2009 147,597 1,154,890 144,650 0 1,447,137
More than 5 years 104,254 406,259 144,650 655,163
Between 1 and 5 years 35,415 680,128 715,543
More than 1 year 139,669 1,086,387 144,650 0 1,370,706
Less than 1 year 7,928 68,503 76,431
As of 31 December 2009 147,597 1,154,890 144,650 0 1,447,137
LPG 71,285 362,056 433,341
LNG 75,268 595,175 144,506 814,949
Offshore 189,000 189,000
Services 1,044 8,659 144 9,847
As of 31 December 2009 147,597 1,154,890 144,650 0 1,447,137
24. Borrowings( in thousands of USD)
2010 2009
CURRENT BORROWINGS
Current portion of long-term loans 81,561 76,431
Bank overdrafts and credit lines used 10,000 0
91,561 76,431
2010 2009
UNUSED CREDIT FACILITIES
Unused credit facilities 36,686 45,115
Unused credit revolver facilities 0 12,140
36,686 57,255
110381 EXMAR JAARVERSLAG FINANCIEEL ENG.indd 58 28/04/11 14:25
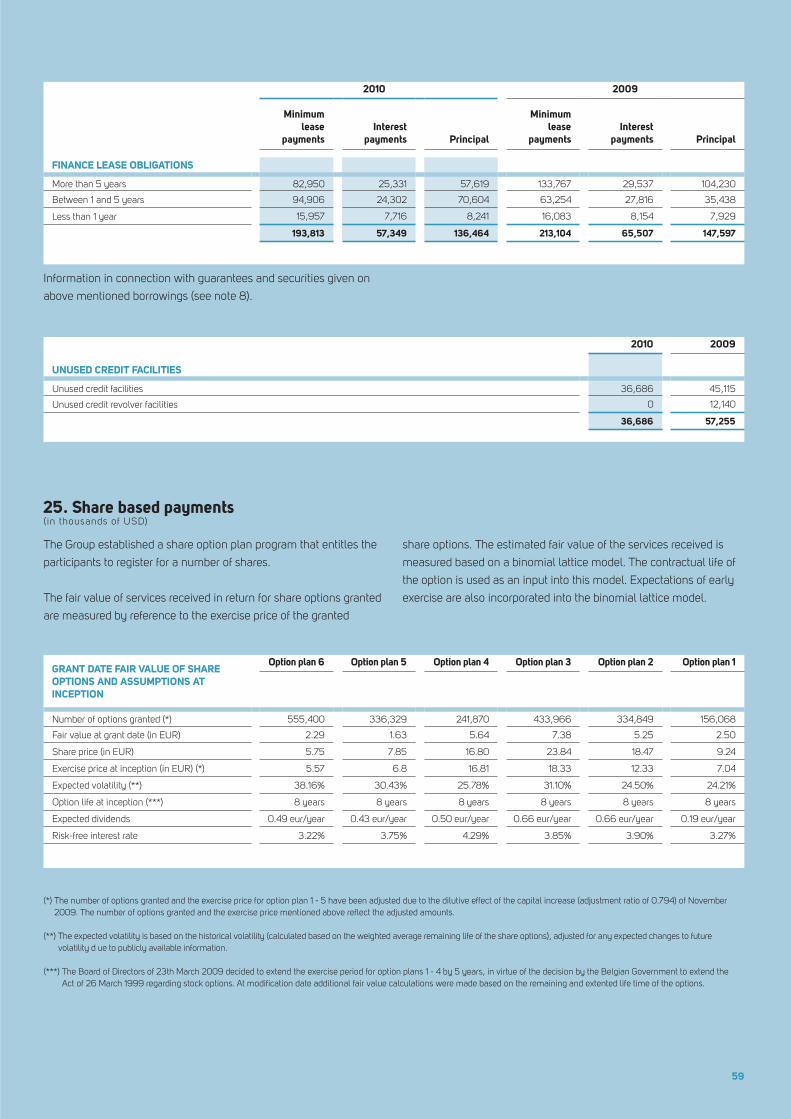
59
2010 2009
SEGMENT REPORTING 2009Minimum
lease payments
Interest payments Principal
Minimum lease
paymentsInterest
payments Principal
FINANCE LEASE OBLIGATIONS
More than 5 years 82,950 25,331 57,619 133,767 29,537 104,230
Between 1 and 5 years 94,906 24,302 70,604 63,254 27,816 35,438
Less than 1 year 15,957 7,716 8,241 16,083 8,154 7,929
193,813 57,349 136,464 213,104 65,507 147,597
2010 2009
UNUSED CREDIT FACILITIES
Unused credit facilities 36,686 45,115
Unused credit revolver facilities 0 12,140
36,686 57,255
25. Share based payments( in thousands of USD)
The Group established a share option plan program that entitles the
participants to register for a number of shares.
The fair value of services received in return for share options granted
are measured by reference to the exercise price of the granted
share options. The estimated fair value of the services received is
measured based on a binomial lattice model. The contractual life of
the option is used as an input into this model. Expectations of early
exercise are also incorporated into the binomial lattice model.
GRANT DATE FAIR VALUE OF SHARE OPTIONS AND ASSUMPTIONS AT INCEPTION
Option plan 6 Option plan 5 Option plan 4 Option plan 3 Option plan 2 Option plan 1
Number of options granted (*) 555,400 336,329 241,870 433,966 334,849 156,068
Fair value at grant date (in EUR) 2.29 1.63 5.64 7.38 5.25 2.50
Share price (in EUR) 5.75 7.85 16.80 23.84 18.47 9.24
Exercise price at inception (in EUR) (*) 5.57 6.8 16.81 18.33 12.33 7.04
Expected volatility (**) 38.16% 30.43% 25.78% 31.10% 24.50% 24.21%
Option life at inception (***) 8 years 8 years 8 years 8 years 8 years 8 years
Expected dividends 0.49 eur/year 0.43 eur/year 0.50 eur/year 0.66 eur/year 0.66 eur/year 0.19 eur/year
Risk-free interest rate 3.22% 3.75% 4.29% 3.85% 3.90% 3.27%
(*) The number of options granted and the exercise price for option plan 1 - 5 have been adjusted due to the dilutive effect of the capital increase (adjustment ratio of 0.794) of November 2009. The number of options granted and the exercise price mentioned above reflect the adjusted amounts.
(**) The expected volatility is based on the historical volatility (calculated based on the weighted average remaining life of the share options), adjusted for any expected changes to future volatility d ue to publicly available information.
(***) The Board of Directors of 23th March 2009 decided to extend the exercise period for option plans 1 - 4 by 5 years, in virtue of the decision by the Belgian Government to extend the Act of 26 March 1999 regarding stock options. At modification date additional fair value calculations were made based on the remaining and extented life time of the options.
Information in connection with guarantees and securities given on
above mentioned borrowings (see note 8).
110381 EXMAR JAARVERSLAG FINANCIEEL ENG.indd 59 28/04/11 14:25

60
2010 2009
ROLL FORWARD OF NUMBER OF OPTIONS OUTSTANDING
Options outstanding at the beginning of the period 1,522,282 955,425
Changes during the period
Options granted 555,400 267,125
Change due to capital increase 0 316,732
Options forfeited -19,200 -17,000
Options outstanding at the end of the period (*) 2,058,482 1,522,282
2010 2009
SHARE OPTIONS
Total number of share options granted 2,058,482 1,522,282
Included in personnel expenses (including costs for extension of the exercise period) option plan 1 0 68
option plan 2 0 136
option plan 3 0 1,250
option plan 4 470 508
option plan 5 184 202
option plan 6 563 0
1,217 2,164
26. Employee benefits - defined benefit plan( in thousands of USD)
LIABILITY FOR DEFINED BENEFIT PLAN AND SIMULAR LIABILITIES
The group provides pension benefits for most of its employees,
either directly or through a contribution to an independent fund. The
pension benefits for management staff employed before 1 January
2008 are provided under a defined benefit plan. For the manage-
ment staff employed as from 1 January 2008, the management
staff promoted to management as from 1 January 2008 and the
management staff who reached the age of 60, the pension benefits
are provided under a defined contribution plan. The actuarial profits
and losses related to the closed defined benefit plan pension
obligations are immediately recognised in the income statement. For
the defined contribution plan, the contributions are recognised in the
income statement (2010: KUSD 386 and 2009: KUSD 367) and no
liability is recorded.
(*) 924,883 of the 2,058,482 options outstanding are exercisable as per 31 December 2010.
2010 2009 2008 2007 2006
EMPLOYEE BENEFITS
Present value of funded obligations -12,321 -13,157 -12,098 -11,852 -11,400
Fair value of the defined plan assets 9,382 9,836 8,903 8,568 7,253
Present value of net obligations -2,939 -3,321 -3,195 -3,284 -4,147
Total employee benefits -2,939 -3,321 -3,195 -3,284 -4,147
2010 2009
CHANGES IN LIABILITY DURING THE PERIOD
Liability as per 1 January 13,157 12,098
Distributions -1,349 -1,217
Interest cost 637 750
Current service cost 746 799
DBO gain/loss 86 280
Translation differences -956 447
Liability as per 31 December 12,321 13,157
CHANGES OF FAIR VALUE OF PLAN ASSETS
Plan assets as per 1 January 9,836 8,903
Contributions 1,261 1,512
Distributions -1,349 -1,121
Return on plan assets 346 209
Translation differences -712 333
Plan assets as per 31 December (*) 9,382 9,836
EXPENSE RECOGNISED IN THE INCOME STATEMENT
Current service expenses -742 -799
Interest obligation -637 -750
Expected return on defined benefit plan 409 399
Recognition of actuarial gains and losses -150 -470
Employee contributions 175 190
Total pension cost recognised in the income statement (see note 5) -945 -1,430
MOST SIGNIFICANT ASSUMPTIONS, EXPRESSED IN WEIGHTED AVERAGES
Discount rate at 31 December 2.10% 5.25%
Expected return on assets at 31 December 4.00% 4.25%
Future salary increases (including inflation) (salary scales) (salary scales)
Mortality tables Belgian (MR/FR) Belgian (MR/FR)
Inflation 2% 2%
EXPECTED NEXT YEAR CONTRIBUTIONS
Best estimate of contributions expected to be paid during next year 1,125 1,409
DETAIL PLAN ASSETS INVESTMENTS
Bonds 60% 60%
Equity instruments 8% 8%
Loans 14% 17%
Property investments 6% 6%
Cash 12% 9%
EMPLOYEE BENEFITS
DEFINED BENEFIT PLAN
(*) The plan assets do not include any shares issued by EXMAR or property occupied by EXMAR.
110381 EXMAR JAARVERSLAG FINANCIEEL ENG.indd 60 28/04/11 14:25

61
2010 2009 2008 2007 2006
EMPLOYEE BENEFITS
Present value of funded obligations -12,321 -13,157 -12,098 -11,852 -11,400
Fair value of the defined plan assets 9,382 9,836 8,903 8,568 7,253
Present value of net obligations -2,939 -3,321 -3,195 -3,284 -4,147
Total employee benefits -2,939 -3,321 -3,195 -3,284 -4,147
2010 2009
CHANGES IN LIABILITY DURING THE PERIOD
Liability as per 1 January 13,157 12,098
Distributions -1,349 -1,217
Interest cost 637 750
Current service cost 746 799
DBO gain/loss 86 280
Translation differences -956 447
Liability as per 31 December 12,321 13,157
CHANGES OF FAIR VALUE OF PLAN ASSETS
Plan assets as per 1 January 9,836 8,903
Contributions 1,261 1,512
Distributions -1,349 -1,121
Return on plan assets 346 209
Translation differences -712 333
Plan assets as per 31 December (*) 9,382 9,836
EXPENSE RECOGNISED IN THE INCOME STATEMENT
Current service expenses -742 -799
Interest obligation -637 -750
Expected return on defined benefit plan 409 399
Recognition of actuarial gains and losses -150 -470
Employee contributions 175 190
Total pension cost recognised in the income statement (see note 5) -945 -1,430
MOST SIGNIFICANT ASSUMPTIONS, EXPRESSED IN WEIGHTED AVERAGES
Discount rate at 31 December 2.10% 5.25%
Expected return on assets at 31 December 4.00% 4.25%
Future salary increases (including inflation) (salary scales) (salary scales)
Mortality tables Belgian (MR/FR) Belgian (MR/FR)
Inflation 2% 2%
EXPECTED NEXT YEAR CONTRIBUTIONS
Best estimate of contributions expected to be paid during next year 1,125 1,409
DETAIL PLAN ASSETS INVESTMENTS
Bonds 60% 60%
Equity instruments 8% 8%
Loans 14% 17%
Property investments 6% 6%
Cash 12% 9%
EMPLOYEE BENEFITS
DEFINED BENEFIT PLAN
(*) The plan assets do not include any shares issued by EXMAR or property occupied by EXMAR.
110381 EXMAR JAARVERSLAG FINANCIEEL ENG.indd 61 28/04/11 14:25
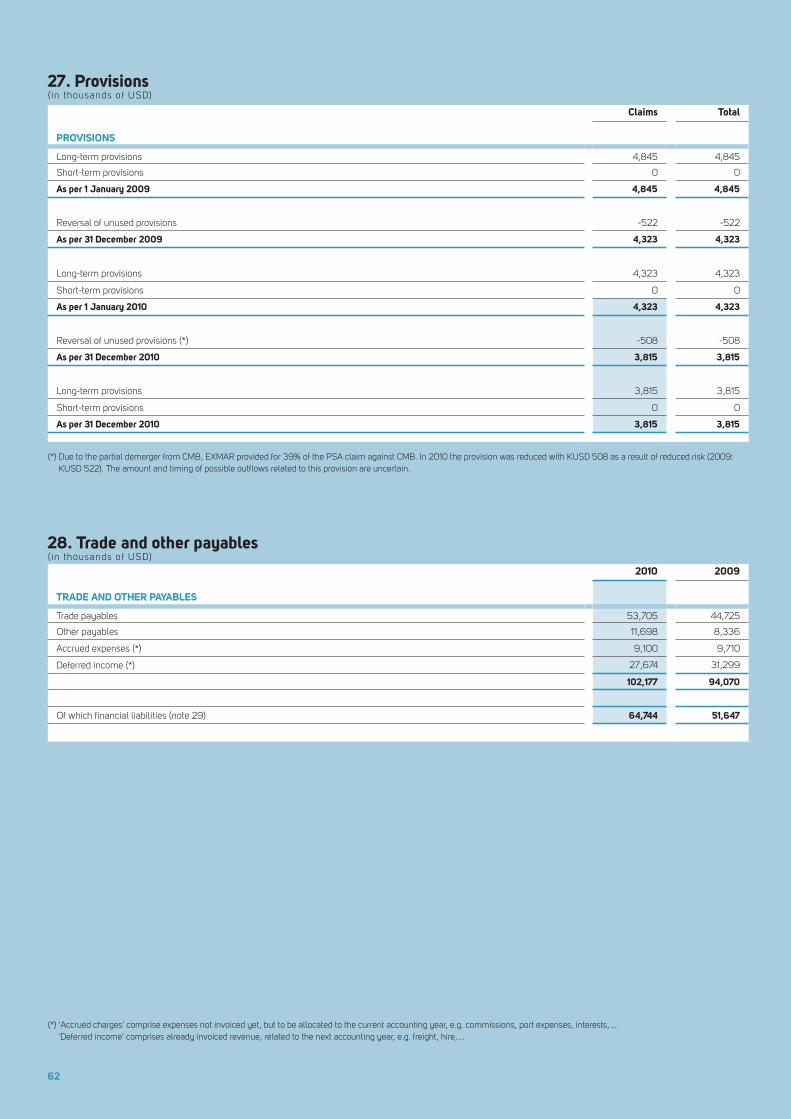
62
(*) Due to the partial demerger from CMB, EXMAR provided for 39% of the PSA claim against CMB. In 2010 the provision was reduced with KUSD 508 as a result of reduced risk (2009: KUSD 522). The amount and timing of possible outflows related to this provision are uncertain.
(*) 'Accrued charges' comprise expenses not invoiced yet, but to be allocated to the current accounting year, e.g. commissions, port expenses, interests, ... 'Deferred income' comprises already invoiced revenue, related to the next accounting year, e.g. freight, hire, ...
Claims Total
PROVISIONS
Long-term provisions 4,845 4,845
Short-term provisions 0 0
As per 1 January 2009 4,845 4,845
Reversal of unused provisions -522 -522
As per 31 December 2009 4,323 4,323
Long-term provisions 4,323 4,323
Short-term provisions 0 0
As per 1 January 2010 4,323 4,323
Reversal of unused provisions (*) -508 -508
As per 31 December 2010 3,815 3,815
Long-term provisions 3,815 3,815
Short-term provisions 0 0
As per 31 December 2010 3,815 3,815
2010 2009
TRADE AND OTHER PAYABLES
Trade payables 53,705 44,725
Other payables 11,698 8,336
Accrued expenses (*) 9,100 9,710
Deferred income (*) 27,674 31,299
102,177 94,070
Of which financial liabilities (note 29) 64,744 51,647
27. Provisions( in thousands of USD)
28. Trade and other payables ( in thousands of USD)
FINANCIAL INSTRUMENTS
CREDIT RISK
110381 EXMAR JAARVERSLAG FINANCIEEL ENG.indd 62 28/04/11 14:25

63
2010 2009
ASSETS
Non-current
Interest rate swaps 0 261
0 261
Current
Foreign exchange contracts 341 92
341 92
Total assets 341 353
LIABILITIES
Non-current
Interest rate swaps 72,341 57,366
Cross currency interest rate contract 18,220 14,079
90,561 71,445
Total liabilities 90,561 71,445
29. Financial risks and financial instruments( in thousands of USD)
During the normal course of its business, EXMAR is exposed to
market and financial risks as described in more detail in the report of
the Board of Directors. EXMAR is exposed to credit, interest, market
and currency risks and in order to hedge this exposure, EXMAR
uses various financial instruments such as bunkerhedges, exchange
rate and interest rate hedges. EXMAR applies hedge accounting
for all hedging relations which meet the conditions to apply
hedge accounting (formal documentation and high effectiveness
at inception and on an ongoing basis). Financial instruments are
recognised initially at fair value. Subsequent to initial recognition,
the effective portion of changes in fair value of the financial
instruments qualifying for hedge accounting, is recognised in other
comprehensive income. Any ineffective portion of changes in fair
value and changes in fair value of financial instuments not qualifying
for hedge accounting are recognised immediately in profit or loss.
Credit risk policy
Creditworthiness controls are carried out if deemed necessary.
At year-end no significant creditworthiness problems were noted.
FINANCIAL INSTRUMENTS
CREDIT RISK
110381 EXMAR JAARVERSLAG FINANCIEEL ENG.indd 63 28/04/11 14:25

64
Impairment losses
As past due outstanding receivable balances are immaterial, no
aging analysis is made. No impairment losses have occured and at
reporting date, no allowance for impairment has been recorded.
Exposure to risk
Interest risk policy
Most of EXMAR’s time-charter income is based on a fixed rate
component calculation, while the interest-bearing loans are mainly
negotiated with variable interest rates. In order to monitor this
interest risk, the Group uses a variety of interest hedging instruments
available on the market (i.a. IRS,CAPS, floors and collars).
The Group uses hedge accounting when the conditions to apply
hedge accounting are met. In case no hedge accounting is applied
the changes in fair value are recorded in the income statement.
The carrying amounts of the financial assets represent the
maximum credit exposure.
Exposure to risk
INTEREST RISK
2010 2009
CARRYING AMOUNTS OF FINANCIAL ASSETS
Available-for-sale financial assets 43,004 2,189
Held-to-maturity investments 2,417 2,423
Financial instruments 341 353
Trade and other receivables 60,554 44,628
Cash and cash equivalents 130,189 164,366
236,505 213,959
2010 2009
EXPOSURE TO INTEREST RATE RISK
Total borrowings 1,148,840 1,447,137
with fixed interest rate -226,938 -287,934
with variable interest rate: gross exposure 921,902 1,159,203
Neutralised through time-charter contract (*) -164,955 -164,955
Neutralised through capitalised interest expense (**) -5,705 -144,650
Interest rate swaps (nominal amount) -509,561 -516,648
Net exposure 241,681 332,950
2010 2009
INTEREST RATES SWAPS
Nominal amount of interest rate swaps 509,561 516,648
Net fair value of interest rate swaps -90,561 -71,184
Maximum maturity date 2024 2024
(*) The time-charter income calculation takes into account changes in interest rates (back-to-back) and therefore neutralises changes in interest expenses.
(**) Change in interest rate does not affect the income statement as the interest expense is capitalised for vessels under construction.
2010 2009
SEGMENT REPORTING 2009 + 50 bp - 50 bp + 50 bp - 50 bp
SENSITIVITY ANALYSIS
Interest-bearing loans (variable interest rate) -4,601 4,601 -5,796 5,796
Time-charter contract 825 -825 825 -825
Capitalised interest 29 -29 723 -723
Interest rate swaps 8,119 -10,881 9,103 -5,010
Sensitivity (net) 4,372 -7,134 4,855 -762
2010 2009
SEGMENT REPORTING 2009 EUR GBP JPY EUR GBP JPY
Receivables 15,176 360 13,587 289 497
Payables -17,043 -502 -15,057 -23,133 -128 -15,188
Interest-bearing loans -6,774 -7,465
Balance sheet exposure -8,641 -142 -15,057 -17,011 161 -14,691
In thousands of USD -11,546 -220 -185 -24,506 261 -159
Exposure to risk
Exposure to currency risk, based on notional amounts in thousands
of foreign currency:
CURRENCY RISK
110381 EXMAR JAARVERSLAG FINANCIEEL ENG.indd 64 28/04/11 14:25

65
Sensitivity analysis
In case the interest rate would increase/decrease with 50 basis
points, the financial statements would be impacted with the fol-
lowing amounts (assuming that all other variables remain constant):
2010 2009
SEGMENT REPORTING 2009 + 50 bp - 50 bp + 50 bp - 50 bp
SENSITIVITY ANALYSIS
Interest-bearing loans (variable interest rate) -4,601 4,601 -5,796 5,796
Time-charter contract 825 -825 825 -825
Capitalised interest 29 -29 723 -723
Interest rate swaps 8,119 -10,881 9,103 -5,010
Sensitivity (net) 4,372 -7,134 4,855 -762
2010 2009
SEGMENT REPORTING 2009 EUR GBP JPY EUR GBP JPY
Receivables 15,176 360 13,587 289 497
Payables -17,043 -502 -15,057 -23,133 -128 -15,188
Interest-bearing loans -6,774 -7,465
Balance sheet exposure -8,641 -142 -15,057 -17,011 161 -14,691
In thousands of USD -11,546 -220 -185 -24,506 261 -159
Currency risk policy
The Group's currency risk is mainly affected by the EUR/USD ratio
for manning its fleet, paying salaries and all other personnel-related
expenses. In order to monitor the EUR currency risk, the Group uses
a varied range of foreign currency rate hedging instruments.
As per 31 December 2010, the net fair value of the currency hedging
contracts amounted to KUSD 341 (2009: KUSD 92).
Sensitivity analysis
An increase in the year-end USD/EUR rate of 10% at 31 December
would effect the income statement with KUSD -1,154 in 2010 (KUSD
-2,451 for 2009), excluding the effect on forward exchange contracts.
A 10% decrease of the USD/EUR rate would impact the income
statement with the same amount (opposite sign).
Exposure to risk
Exposure to currency risk, based on notional amounts in thousands
of foreign currency:
CURRENCY RISK
110381 EXMAR JAARVERSLAG FINANCIEEL ENG.indd 65 28/04/11 14:25

66
Contractual cash flows
MATURITY OF FINANCIAL LIABILITIES CurrencyCarrying amount total 0-12 mths 1-2 years 2-5 years
5-10 years > 10 years
AS PER 31 DECEMBER 2010
Non-derivative financial liabilities:
Finance lease debts USD 65,574 78,326 9,452 9,368 59,506
Finance lease debts GBP 70,044 113,497 6,305 6,305 18,916 31,527 50,444
Finance lease debts EUR 846 1,182 227 229 660 66
Bank loans (*) USD 997,809 1,081,455 88,682 225,877 376,343 290,089 100,464
Bank loans EUR 7,163 7,701 1,031 1,012 2,917 2,741
Other loans USD 7,404 7,491 7,491
Trade and other payables USD 45,978 45,978 45,978
Trade and other payables EUR 18,766 18,766 18,766
1,213,584 1,354,396 177,932 242,791 458,342 324,423 150,908
Financial instruments (net):
Interest rate swaps USD 72,341 168,873 18,999 18,936 50,715 64,716 15,507
Cross currency interest rate contract USD 18,220 16,895 3,780 3,200 5,551 2,850 1,514
90,561 185,768 22,779 22,136 56,266 67,566 17,021
AS PER 31 DECEMBER 2009
Non-derivative financial liabilities:
Finance lease debts USD 71,285 87,887 9,562 9,452 27,725 41,148
Finance lease debts GBP 75,268 119,802 6,305 6,305 18,916 31,527 56,749
Finance lease debts EUR 1,044 1,479 240 235 711 293
Bank loans (*) USD 1,146,231 1,256,320 86,424 248,143 484,214 230,780 206,759
Bank loans EUR 8,659 9,284 1,102 1,083 3,147 3,952
Other loans USD 144,650 145,372 145,372
Trade and other payables USD 29,378 29,378 29,378
Trade and other payables EUR 22,269 22,269 22,269
1,498,784 1,671,791 300,652 265,218 534,713 307,700 263,508
Financial instruments (net):
Interest rate swaps USD 53,053 25,430 14,181 9,479 2,460 362 -1,052
Cross currency interest rate contract USD 18,131 13,929 3,757 2,870 3,922 2,129 1,251
71,184 39,359 17,938 12,349 6,382 2,491 199
Liquidity risk policy
The Group manages the liquidity risk in order to meet financial obli-
gations as they fall due. The risk is managed through a continuous
cash flow projection follow-up, monitoring balance sheet liquidity
ratio's against internal and regulatory requirements and maintaining
a diverse range of funding sources with adequate back-up facilities.
Maturity analysis of financial liabilities
The following are the contractual maturities of financial liabilities,
including estimated interest payments:
LIQUIDITY RISK
(*) Bank loans include a revolver credit facility for which the cash flows are included, based on the amount withdrawn at year-end. The cash flows will differ from those included in this scheme in case of additional withdrawals/repayments in the future.
Fair values versus carrying amounts
FAIR VALUES
CAPITAL MANAGEMENT
2010 2009
SEGMENT REPORTING 2009 Fair value hierarchy(*)
Carrying amount Fair value
Carrying amount Fair value
CARRYING VALUES VERSUS FAIR VALUES
Available-for-sale financial assets 1 43,004 43,004 2,189 2,189
Financial instruments assets 2 341 341 353 353
Trade and other receivables 60,554 60,554 44,628 44,628
Cash and cash equivalents 130,189 130,189 164,366 164,366
Interest-bearing loans -1,148,840 -1,280,846 -1,447,137 -1,552,923
Trade and other payables -64,744 -64,744 -51,647 -51,647
Financial instruments liabilities 2 -90,561 -90,561 -71,445 -71,445
Bank overdrafts -10,000 -10,000 0 0
-1,080,057 -1,212,063 -1,358,693 -1,464,479
Basis for determining fair values:
Available-for-sale financial assets: quoted closing bid price at reporting date
Financial instruments and derivatives: present value of future cash flows, discounted at the market rate of interest at reporting date
Loans and receivables: present value of future cash flows, discounted at the market rate of interest at reporting date
Other interest-bearing borrowings:present value of future principal and interest cash flows, discounted at the market rate of interest at reporting date
(*) The financial assets and liabilities carried at fair value are analysed and a hierarchy in valuation method has been defined: level 1 being quoted bid prices in active markets for identical assets or liabilities, level 2 being inputs in other than quoted prices included in level 1 that are observable for the assets and liabilities, either directly or indirectly, level 3 being inputs for the asset or liability that are not based on observable market data.
110381 EXMAR JAARVERSLAG FINANCIEEL ENG.indd 66 28/04/11 14:25

67
Fair values versus carrying amounts
The board's policy is to maintain a strong capital base as to maintain
investor, creditor and market confidence and to sustain future
development of the business. The balance between a higher return
that might be possible with higher levels of borrowings and the
advantages and security afforded by a sound capital position is
monitored on a continuing basis. The board monitors the return on
capital and the level of dividends to ordinary shareholders.
FAIR VALUES
CAPITAL MANAGEMENT
2010 2009
SEGMENT REPORTING 2009 Fair value hierarchy(*)
Carrying amount Fair value
Carrying amount Fair value
CARRYING VALUES VERSUS FAIR VALUES
Available-for-sale financial assets 1 43,004 43,004 2,189 2,189
Financial instruments assets 2 341 341 353 353
Trade and other receivables 60,554 60,554 44,628 44,628
Cash and cash equivalents 130,189 130,189 164,366 164,366
Interest-bearing loans -1,148,840 -1,280,846 -1,447,137 -1,552,923
Trade and other payables -64,744 -64,744 -51,647 -51,647
Financial instruments liabilities 2 -90,561 -90,561 -71,445 -71,445
Bank overdrafts -10,000 -10,000 0 0
-1,080,057 -1,212,063 -1,358,693 -1,464,479
Basis for determining fair values:
Available-for-sale financial assets: quoted closing bid price at reporting date
Financial instruments and derivatives: present value of future cash flows, discounted at the market rate of interest at reporting date
Loans and receivables: present value of future cash flows, discounted at the market rate of interest at reporting date
Other interest-bearing borrowings:present value of future principal and interest cash flows, discounted at the market rate of interest at reporting date
(*) The financial assets and liabilities carried at fair value are analysed and a hierarchy in valuation method has been defined: level 1 being quoted bid prices in active markets for identical assets or liabilities, level 2 being inputs in other than quoted prices included in level 1 that are observable for the assets and liabilities, either directly or indirectly, level 3 being inputs for the asset or liability that are not based on observable market data.
110381 EXMAR JAARVERSLAG FINANCIEEL ENG.indd 67 28/04/11 14:25
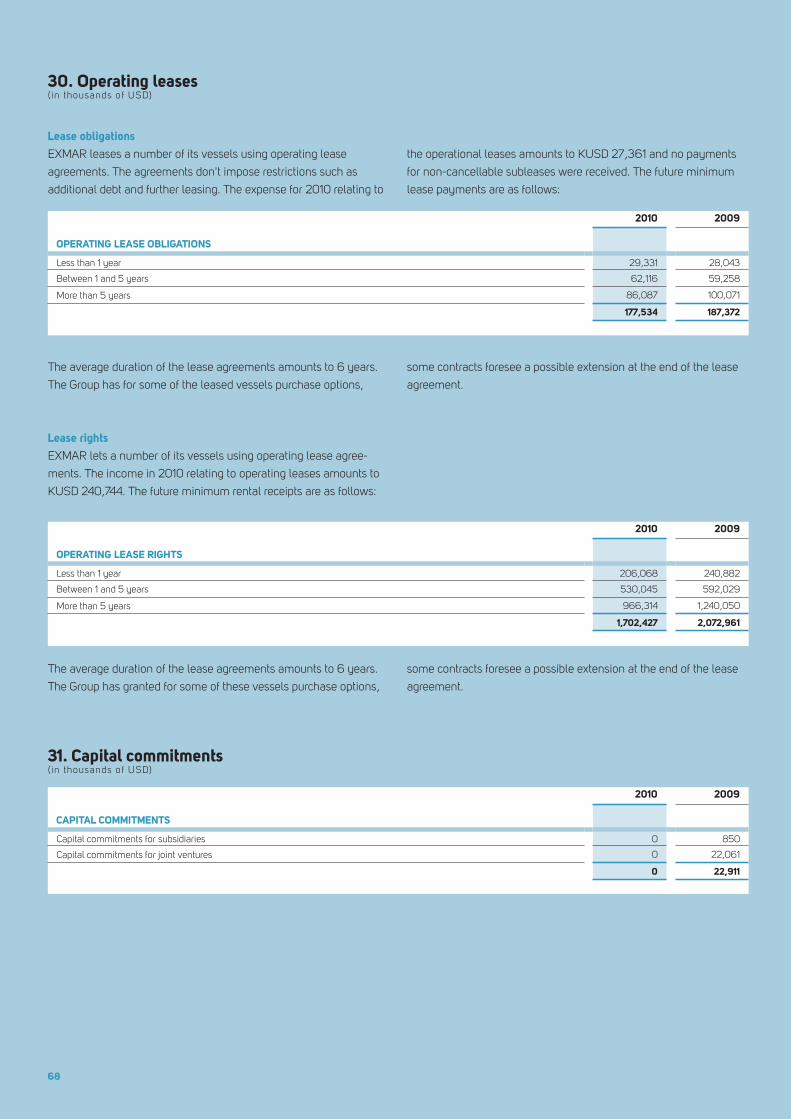
68
Lease obligations
EXMAR leases a number of its vessels using operating lease
agreements. The agreements don't impose restrictions such as
additional debt and further leasing. The expense for 2010 relating to
the operational leases amounts to KUSD 27,361 and no payments
for non-cancellable subleases were received. The future minimum
lease payments are as follows:
Lease rights
EXMAR lets a number of its vessels using operating lease agree-
ments. The income in 2010 relating to operating leases amounts to
KUSD 240,744. The future minimum rental receipts are as follows:
The average duration of the lease agreements amounts to 6 years.
The Group has granted for some of these vessels purchase options,
some contracts foresee a possible extension at the end of the lease
agreement.
The average duration of the lease agreements amounts to 6 years.
The Group has for some of the leased vessels purchase options,
some contracts foresee a possible extension at the end of the lease
agreement.
30. Operating leases( in thousands of USD)
2010 2009
OPERATING LEASE OBLIGATIONS
Less than 1 year 29,331 28,043
Between 1 and 5 years 62,116 59,258
More than 5 years 86,087 100,071
177,534 187,372
2010 2009
OPERATING LEASE RIGHTS
Less than 1 year 206,068 240,882
Between 1 and 5 years 530,045 592,029
More than 5 years 966,314 1,240,050
1,702,427 2,072,961
31. Capital commitments( in thousands of USD)
2010 2009
CAPITAL COMMITMENTS
Capital commitments for subsidiaries 0 850
Capital commitments for joint ventures 0 22,061
0 22,911
2010 2009
BOARD OF DIRECTORS (IN EUR)
Chairman 100,000 100,000
Other members 50,000 50,000
Total paid (*) 447,707 425,000
2010 2009
AUDIT COMMITTEE (IN EUR)
Chairman 20,000 20,000
Other members 10,000 10,000
Total paid 50,000 40,000
2010 2009
NOMINATION AND REMUNERATION COMMITTEE (IN EUR)
Members 10,000 10,000
Total paid 30,000 30,000
Several of the Group's companies are involved in a number of minor
legal disputes arising from their daily management. The directors do
Board of Directors
Audit Committee
(*) The total amount paid to the members of the Board of Directors represents the total payments to all non-executive and independent directors for the activities as members of the Board of Directors. The directors who are member of the executive committee and were paid accordingly, have foregone the director's payment. No share options, loans or advances were granted to them, except for the executive directors (in their capacity of members of the executive committee) who were beneficiaires of the share option plan.
110381 EXMAR JAARVERSLAG FINANCIEEL ENG.indd 68 28/04/11 14:25

69
33. Related parties( in EUR)
32. Contingencies
2010 2009
BOARD OF DIRECTORS (IN EUR)
Chairman 100,000 100,000
Other members 50,000 50,000
Total paid (*) 447,707 425,000
2010 2009
AUDIT COMMITTEE (IN EUR)
Chairman 20,000 20,000
Other members 10,000 10,000
Total paid 50,000 40,000
2010 2009
NOMINATION AND REMUNERATION COMMITTEE (IN EUR)
Members 10,000 10,000
Total paid 30,000 30,000
Several of the Group's companies are involved in a number of minor
legal disputes arising from their daily management. The directors do
not expect the outcome of these procedures to have any material
effect on the Group's financial position.
IDENTITY OF RELATED PARTIES
The Company has a related party relationship with its subsidiaries
and joint ventures (note 35) and with its directors and executive
officers.
TRANSACTIONS WITH KEY MANAGEMENT PERSONNEL
TRANSACTIONS WITH MAJORITY SHAREHOLDERS
Saverbel NV, controlled by Mr. Nicolas Saverys (CEO of EXMAR)
charged EUR 323,959 to the Group (2009: EUR 301,997) for
services provided during 2010. All services are supplied on an arm's
lenght basis.
PARENT COMPANY
Saverex NV, the major shareholder of EXMAR nv produces financial
statements available in Belgium.
Board of Directors
Audit Committee
Nomination and remuneration committee
(*) The total amount paid to the members of the Board of Directors represents the total payments to all non-executive and independent directors for the activities as members of the Board of Directors. The directors who are member of the executive committee and were paid accordingly, have foregone the director's payment. No share options, loans or advances were granted to them, except for the executive directors (in their capacity of members of the executive committee) who were beneficiaires of the share option plan.
110381 EXMAR JAARVERSLAG FINANCIEEL ENG.indd 69 28/04/11 14:25

70
2010 2009
NUMBER OF SHARES ALLOCATED
Nicolas Saverys 215,061 155,061
Patrick De Brabandere 152,397 112,397
Pierre Dincq 100,133 70,133
Paul Young 102,494 72,494
Didier Ryelandt 82,663 52,663
Marc Nuytemans 60,000 30,000
Bart Lavent 50,000 20,000
762,748 512,748
2010 2009
EXECUTIVE COMMITTEE, EXCLUDING CEO (IN EUR) (*)
Total fixed remuneration 2,296 1,681
of which for insurance and pension plan 159 177
Total variable remuneration 793 0
2010 2009
CEO (IN EUR)
Total fixed remuneration 713 713
of which for insurance and pension plan 53 53
Total variable remuneration 400 0
Executive committee
The remuneration of the members of the executive committee
(6) is determined annually by the Board of Directors on the basis
of a proposal of the nomination and remuneration committee. 5
members of the executive committee are self-employed. In the event
of termination of their appointment, they have no right to any form
of severance compensation, except for the agreement with Lara
Consult represented by Bart Lavent. Paul Young is employed through
an agreement following the United States law. The remuneration
consists of a fixed component and a variable component. The
variable component is determined in function of the financial result
of the Group.
No loans or advances were granted to the members of the executive
committee in 2010, except for the interest-bearing loan granted to
Paul Young. The outstanding amount as per 31 December 2010 of
this loan amounts to USD 232,287.50 and is reimbursable within
the next year.
The members of the executive committee are among the beneficia-
ries of the 7 share option plans approved by the Board of Directors.
Option plan 7 relates to options allocated in 2011 and is therefore not
included in the information disclosed in note 25. The accumulated
number of options (plan 1 - 7) allocated to the members of the
executive committee are as follows:
(*) In 2010 the executive committee counted 6 members on average (average number of members in 2009 was 5,25).
Ownership
Country of incorporation Company id
Consolidation method 2010 2009
CONSOLIDATED COMPANIES
Joint ventures
Best Progress International ltd Hong Kong Proportionate 50.00% 50.00%
Blackbeard Shipping Limited Hong Kong Proportionate 50.00% 50.00%
Croxford ltd Hong Kong Proportionate 50.00% 50.00%
Estrela Limited Hong Kong Proportionate 50.00% 50.00%
Excelerate nv Belgium 0870.910.441 Proportionate 50.00% 50.00%
Excelsior bvba Belgium 0866.482.687 Proportionate 50.00% 100.00%
Exemplar nv Belgium 0893.228.953 Proportionate 0.00% 50.00%
Exmar Excalibur Shipping Company Ltd Great-Britain Proportionate 50.00% 100.00%
Exmar Shipmanagement India Private limited India Proportionate 60.00% 60.00%
Expedient nv Belgium 0893.228.161 Proportionate 0.00% 50.00%
Explorer nv Belgium 0896.311.177 Proportionate 50.00% 50.00%
Express nv Belgium 0878.453.279 Proportionate 50.00% 50.00%
Farnwick Shipping ltd Liberia Proportionate 50.00% 50.00%
Fertility Development Co ltd Hong Kong Proportionate 50.00% 50.00%
Glory Transportation ltd Hong Kong Proportionate 50.00% 50.00%
Hallsworth Marine Co Liberia Proportionate 50.00% 50.00%
Laurels Carriers inc Liberia Proportionate 50.00% 50.00%
Monteriggioni Inc. Liberia Proportionate 50.00% 50.00%
Palliser Shipping Inc. Liberia Proportionate 50.00% 50.00%
Reslea nv Belgium 0435.390.141 Proportionate 50.00% 50.00%
Solaia Shipping llc Liberia Proportionate 50.00% 100.00%
Splendid Limited Hong Kong Proportionate 50.00% 50.00%
Talmadge Investments ltdBritish Virgin
IslandsProportionate 50.00% 50.00%
Universal Crown ltd Hong Kong Proportionate 50.00% 50.00%
Vine Navigation co Liberia Proportionate 50.00% 50.00%
Equity accounted investees
Bexco nv Belgium 0412.623.251 Equity method 26.62 % 26.62%
Marpos nv Belgium 0460.314.389 Equity method 45.00 % 45.00%
110381 EXMAR JAARVERSLAG FINANCIEEL ENG.indd 70 28/04/11 14:25

71
Ownership
Country of incorporation Company id
Consolidation method 2010 2009
CONSOLIDATED COMPANIES
Joint ventures
Best Progress International ltd Hong Kong Proportionate 50.00% 50.00%
Blackbeard Shipping Limited Hong Kong Proportionate 50.00% 50.00%
Croxford ltd Hong Kong Proportionate 50.00% 50.00%
Estrela Limited Hong Kong Proportionate 50.00% 50.00%
Excelerate nv Belgium 0870.910.441 Proportionate 50.00% 50.00%
Excelsior bvba Belgium 0866.482.687 Proportionate 50.00% 100.00%
Exemplar nv Belgium 0893.228.953 Proportionate 0.00% 50.00%
Exmar Excalibur Shipping Company Ltd Great-Britain Proportionate 50.00% 100.00%
Exmar Shipmanagement India Private limited India Proportionate 60.00% 60.00%
Expedient nv Belgium 0893.228.161 Proportionate 0.00% 50.00%
Explorer nv Belgium 0896.311.177 Proportionate 50.00% 50.00%
Express nv Belgium 0878.453.279 Proportionate 50.00% 50.00%
Farnwick Shipping ltd Liberia Proportionate 50.00% 50.00%
Fertility Development Co ltd Hong Kong Proportionate 50.00% 50.00%
Glory Transportation ltd Hong Kong Proportionate 50.00% 50.00%
Hallsworth Marine Co Liberia Proportionate 50.00% 50.00%
Laurels Carriers inc Liberia Proportionate 50.00% 50.00%
Monteriggioni Inc. Liberia Proportionate 50.00% 50.00%
Palliser Shipping Inc. Liberia Proportionate 50.00% 50.00%
Reslea nv Belgium 0435.390.141 Proportionate 50.00% 50.00%
Solaia Shipping llc Liberia Proportionate 50.00% 100.00%
Splendid Limited Hong Kong Proportionate 50.00% 50.00%
Talmadge Investments ltdBritish Virgin
IslandsProportionate 50.00% 50.00%
Universal Crown ltd Hong Kong Proportionate 50.00% 50.00%
Vine Navigation co Liberia Proportionate 50.00% 50.00%
Equity accounted investees
Bexco nv Belgium 0412.623.251 Equity method 26.62 % 26.62%
Marpos nv Belgium 0460.314.389 Equity method 45.00 % 45.00%
34. Group entities
110381 EXMAR JAARVERSLAG FINANCIEEL ENG.indd 71 28/04/11 14:25
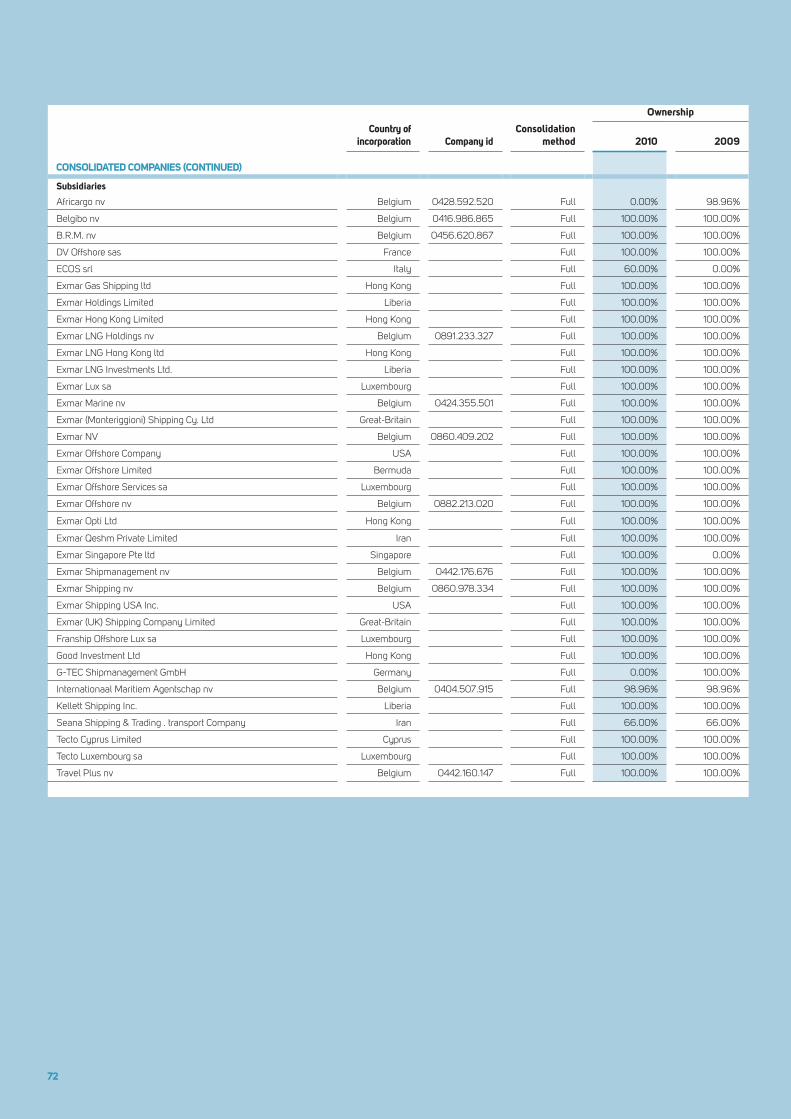
72
Ownership
Country of incorporation Company id
Consolidation method 2010 2009
CONSOLIDATED COMPANIES (CONTINUED)
Subsidiaries
Africargo nv Belgium 0428.592.520 Full 0.00% 98.96%
Belgibo nv Belgium 0416.986.865 Full 100.00% 100.00%
B.R.M. nv Belgium 0456.620.867 Full 100.00% 100.00%
DV Offshore sas France Full 100.00% 100.00%
ECOS srl Italy Full 60.00% 0.00%
Exmar Gas Shipping ltd Hong Kong Full 100.00% 100.00%
Exmar Holdings Limited Liberia Full 100.00% 100.00%
Exmar Hong Kong Limited Hong Kong Full 100.00% 100.00%
Exmar LNG Holdings nv Belgium 0891.233.327 Full 100.00% 100.00%
Exmar LNG Hong Kong ltd Hong Kong Full 100.00% 100.00%
Exmar LNG Investments Ltd. Liberia Full 100.00% 100.00%
Exmar Lux sa Luxembourg Full 100.00% 100.00%
Exmar Marine nv Belgium 0424.355.501 Full 100.00% 100.00%
Exmar (Monteriggioni) Shipping Cy. Ltd Great-Britain Full 100.00% 100.00%
Exmar NV Belgium 0860.409.202 Full 100.00% 100.00%
Exmar Offshore Company USA Full 100.00% 100.00%
Exmar Offshore Limited Bermuda Full 100.00% 100.00%
Exmar Offshore Services sa Luxembourg Full 100.00% 100.00%
Exmar Offshore nv Belgium 0882.213.020 Full 100.00% 100.00%
Exmar Opti Ltd Hong Kong Full 100.00% 100.00%
Exmar Qeshm Private Limited Iran Full 100.00% 100.00%
Exmar Singapore Pte ltd Singapore Full 100.00% 0.00%
Exmar Shipmanagement nv Belgium 0442.176.676 Full 100.00% 100.00%
Exmar Shipping nv Belgium 0860.978.334 Full 100.00% 100.00%
Exmar Shipping USA Inc. USA Full 100.00% 100.00%
Exmar (UK) Shipping Company Limited Great-Britain Full 100.00% 100.00%
Franship Offshore Lux sa Luxembourg Full 100.00% 100.00%
Good Investment Ltd Hong Kong Full 100.00% 100.00%
G-TEC Shipmanagement GmbH Germany Full 0.00% 100.00%
Internationaal Maritiem Agentschap nv Belgium 0404.507.915 Full 98.96% 98.96%
Kellett Shipping Inc. Liberia Full 100.00% 100.00%
Seana Shipping & Trading . transport Company Iran Full 66.00% 66.00%
Tecto Cyprus Limited Cyprus Full 100.00% 100.00%
Tecto Luxembourg sa Luxembourg Full 100.00% 100.00%
Travel Plus nv Belgium 0442.160.147 Full 100.00% 100.00%
2010 2009
INCOME STATEMENT
Operating income 69,026 55,348Operating expenses -30,915 -19,349
OPERATING PROFIT 38,111 35,999
Net finance cost including change in fair value of financial instruments -27,556 10,011
Income taxes -307 -349
AGGREGATED PROFIT JOINT VENTURES 10,248 45,661
STATEMENT OF FINANCIAL POSITION
Vessels 682,856 689,972Other non-current assets 13,836 15,396
NON-CURRENT ASSETS 696,692 705,368
Cash and cash equivalents 53,870 38,363
Other current assets 10,831 3,344
CURRENT ASSETS 64,701 41,707
Non-current borrowings 597,916 649,470Financial instruments 37,648 26,985NON-CURRENT LIABILITIES 635,564 676,455
Current borrowings 33,778 22,695
Other current liabilities 17,078 10,071CURRENT LIABILITIES 50,856 32,766
110381 EXMAR JAARVERSLAG FINANCIEEL ENG.indd 72 28/04/11 14:25

73
35. Interest in joint ventures( in thousands of USD)
The Group has various interests in joint ventures. The following
items are included in the consolidated annual accounts, which are
in accordance with the Group's interest in the assets and liabilities,
income/expenses arising from joint ventures.
2010 2009
INCOME STATEMENT
Operating income 69,026 55,348Operating expenses -30,915 -19,349
OPERATING PROFIT 38,111 35,999
Net finance cost including change in fair value of financial instruments -27,556 10,011
Income taxes -307 -349
AGGREGATED PROFIT JOINT VENTURES 10,248 45,661
STATEMENT OF FINANCIAL POSITION
Vessels 682,856 689,972Other non-current assets 13,836 15,396
NON-CURRENT ASSETS 696,692 705,368
Cash and cash equivalents 53,870 38,363
Other current assets 10,831 3,344
CURRENT ASSETS 64,701 41,707
Non-current borrowings 597,916 649,470Financial instruments 37,648 26,985NON-CURRENT LIABILITIES 635,564 676,455
Current borrowings 33,778 22,695
Other current liabilities 17,078 10,071CURRENT LIABILITIES 50,856 32,766
110381 EXMAR JAARVERSLAG FINANCIEEL ENG.indd 73 28/04/11 14:25

74
36. Major exchange rates used
Closing rates Average rates
2010 2009 2010 2009
EXCHANGE RATES
USD 1,3362 1,4406 1,3294 1,3922
GBP 0,8608 0,8881 0,8583 0,8954
HKD 10,3856 11,1709 10,3266 10,7913
INR 59,7580 67,0400 60,8600 67,5143
All exchange rates used are expressed with reference to the EURO.
The worldwide audit and other fees in respect of services provided by
KPMG auditors or companies or persons related to the auditors, can
be detailed as follows:
There are no subsequent events to be disclosed.
37. Fees statutory auditor( in thousands of USD)
2010 2009
FEES STATUTORY AUDITOR
Audit services 364 432
Audit related services 16 143
Tax services 156 85
536 660
38. Subsequent events
110381 EXMAR JAARVERSLAG FINANCIEEL ENG.indd 74 28/04/11 14:25

75
36. Major exchange rates used
37. Fees statutory auditor( in thousands of USD)
2010 2009
FEES STATUTORY AUDITOR
Audit services 364 432
Audit related services 16 143
Tax services 156 85
536 660
38. Subsequent events
STATEMENT ON THE TRUE AND FAIR VIEW
Statement on the true and fair view on the consolidated fin statement and the fair overview of the management report
The Board of Directors, represented by Nicolas Saverys and Patrick
De Brabandere, and the executive committee, represented by
Nicolas Saverys and Didier Ryelandt, hereby confirm that, to the
best of their knowledge, the consolidated financial statements for
the twelve months period ended 31 December 2010, which have
been prepared in accordance with International Financial Reporting
Standards as adopted by the European Union, give a true and fair
view of the assets, liabilities, financial position and profit or loss
of the company and the entities included in the consolidation as a
whole, and that the consolidated management report includes a
fair overview of the development and performance of the business
and the position of the company and the entities included in the
consolidation, together with a description of the principal risks and
uncertainties which they are exposed to.
REPORT OF THE STATUTORY AUDITOR
Statutory auditor’s report to the general meeting of shareholders of EXMAR NV on the consolidated financial statements for the year ended 31 December 2010
In accordance with legal and statutory requirements, we report to
you on the performance of our audit mandate. This report includes
our opinion on the consolidated financial statements together with
the required additional comment.
Unqualified audit opinion on the consolidated financial statementsWe have audited the consolidated financial statements of
EXMAR NV (“the company”) and its subsidiaries (jointly “the group”),
prepared in accordance with International Financial Reporting
Standards, as adopted by the European Union, and with the legal
and regulatory requirements applicable in Belgium. These conso-
lidated financial statements comprise the consolidated statement
of financial position as at 31 December 2010 and the consolidated
income statement and consolidated statement of comprehensive
income, changes in equity and cash flows for the year then ended,
and notes, comprising a summary of significant accounting policies
and other explanatory information. The total of the consolidated
statement of financial position amounts to KUSD 1.761.543 and
the consolidated income statement shows a profit for the year
(Group share) of KUSD 14.358.
Board of Directors’ responsibility for the consolidated financial statements
The Board of Directors of the company is responsible for the prepara-
tion and fair presentation of these consolidated financial statements
in accordance with International Financial Reporting Standards
(IFRS), as adopted by the European Union and with the legal and
regulatory requirements applicable in Belgium, and for such internal
control as the Board of Directors determines is necessary to enable
the preparation of consolidated financial statements that are free
from material misstatement, whether due to fraud or error.
Auditor’s Responsibility
Our responsibility is to express an opinion on these consolidated
financial statements based on our audit. We conducted our audit
in accordance with International Standards on Auditing, legal
requirements and auditing standards applicable in Belgium, as
issued by the “Institut des Réviseurs d’Entreprises/Instituut der
Bedrijfsrevisoren”. Those standards require that we comply with
ethical requirements and plan and perform the audit to obtain
reasonable assurance whether the consolidated financial statements
are free from material misstatement.
An audit involves performing procedures to obtain audit evidence
about the amounts and disclosures in the consolidated financial
statements. The procedures selected depend on our judgment,
including the assessment of the risks of material misstatement of the
consolidated financial statements, whether due to fraud or error. In
making those risk assessments, we consider internal control relevant
to the group’s preparation and fair presentation of the consolidated
financial statements in order to design audit procedures that are ap-
propriate in the circumstances, but not for the purpose of expressing
an opinion on the effectiveness of the group’s internal control. An
audit also includes evaluating the appropriateness of the accounting
policies used and the reasonableness of accounting estimates made
by the Board of Directors as well as the overall presentation of the
consolidated financial statements.
Finally, we have obtained from management and responsible
officers of the company the explanations and information necessary
for our audit.
We believe that the audit evidence we have obtained provides a
reasonable basis for our audit opinion.
Opinion
In our opinion, the consolidated financial statements give a true
and fair view of the group’s net worth and consolidated financial
position as at 31 December 2010 and of its consolidated financial
performance and its consolidated cash flows for the year then ended
in accordance with International Financial Reporting Standards
(IFRS), as adopted by the European Union, and with the legal and
regulatory requirements applicable in Belgium.
110381 EXMAR JAARVERSLAG FINANCIEEL ENG.indd 75 28/04/11 14:25
76
The above report of the statutory auditors is identical to the original report of which a copy can be requested at the registered office of the Company.
31/12/2010 31/12/2009
ASSETS
FIXED ASSETS 612,146 597,876
Tangibles assets 323 311
Financial assets 611,823 597,565
CURRENT ASSETS 294,667 316,515
Amounts receivable after one year 78,772 85,555
Amounts receivable within one year 101,149 126,968
Investments 99,704 61,178
Cash and cash equivalents 14,055 41,700
Accrued income and deferred charges 987 1,114
TOTAL ASSETS 906,813 914,391
EQUITY AND LIABILITIES
EQUITY 439,814 454,944
Capital 88,812 88,812
Share premium 209,902 209,902
Reserves 92,975 88,837
Accumulated profits 48,125 67,393
PROVISIONS AND DEFERRED TAXES 4,153 4,661
Provisions and deferred taxes 4,153 4,661
LIABILITIES 462,846 454,786
Amounts payable after one year 347,981 358,206
Amounts payable within one year 72,623 81,873
Accrued charges and deferred income 42,242 14,707
TOTAL EQUITY AND LIABILITIES 906,813 914,391
BALANCE SHEET
Additional commentThe preparation of the Board of Directors report on the consolidated
financial statements and its content are the responsibility of the
Board of Directors.
Our responsibility is to supplement our report with the following
additional comment, which do not modify our audit opinion on the
financial statements:
• The report of the Board of Directors on the consolidated financial
statements includes the information required by law and is
consistent with the consolidated financial statements. We are,
however, unable to comment on the description of the principal
risks and uncertainties which the group is facing, and on its
financial situation, its foreseeable evolution or the significant
influence of certain facts on its future development. We can
nevertheless confirm that the matters disclosed do not present
any obvious inconsistencies with the information that we became
aware of during the performance of our mandate.
Kontich, 31 March 2011
KPMG Bedrijfsrevisoren
Statutory auditor
represented by
Serge Cosijns
Bedrijfsrevisor
Filip De Bock
Bedrijfsrevisor
110381 EXMAR JAARVERSLAG FINANCIEEL ENG.indd 76 28/04/11 14:25

77
2 Statutory accounts( in thousands of USD)
The annual accounts of EXMAR NV are provided hereafter in
summarised form. In accordance with the code of companies, the
annual accounts of EXMAR NV, together with the annual report and
the statutory auditor's report will be lodged with the National Bank
of Belgium. In their report the statutory auditors did not express any
reservations in respect of the annual accounts of EXMAR NV.
31/12/2010 31/12/2009
ASSETS
FIXED ASSETS 612,146 597,876
Tangibles assets 323 311
Financial assets 611,823 597,565
CURRENT ASSETS 294,667 316,515
Amounts receivable after one year 78,772 85,555
Amounts receivable within one year 101,149 126,968
Investments 99,704 61,178
Cash and cash equivalents 14,055 41,700
Accrued income and deferred charges 987 1,114
TOTAL ASSETS 906,813 914,391
EQUITY AND LIABILITIES
EQUITY 439,814 454,944
Capital 88,812 88,812
Share premium 209,902 209,902
Reserves 92,975 88,837
Accumulated profits 48,125 67,393
PROVISIONS AND DEFERRED TAXES 4,153 4,661
Provisions and deferred taxes 4,153 4,661
LIABILITIES 462,846 454,786
Amounts payable after one year 347,981 358,206
Amounts payable within one year 72,623 81,873
Accrued charges and deferred income 42,242 14,707
TOTAL EQUITY AND LIABILITIES 906,813 914,391
BALANCE SHEET
110381 EXMAR JAARVERSLAG FINANCIEEL ENG.indd 77 28/04/11 14:25
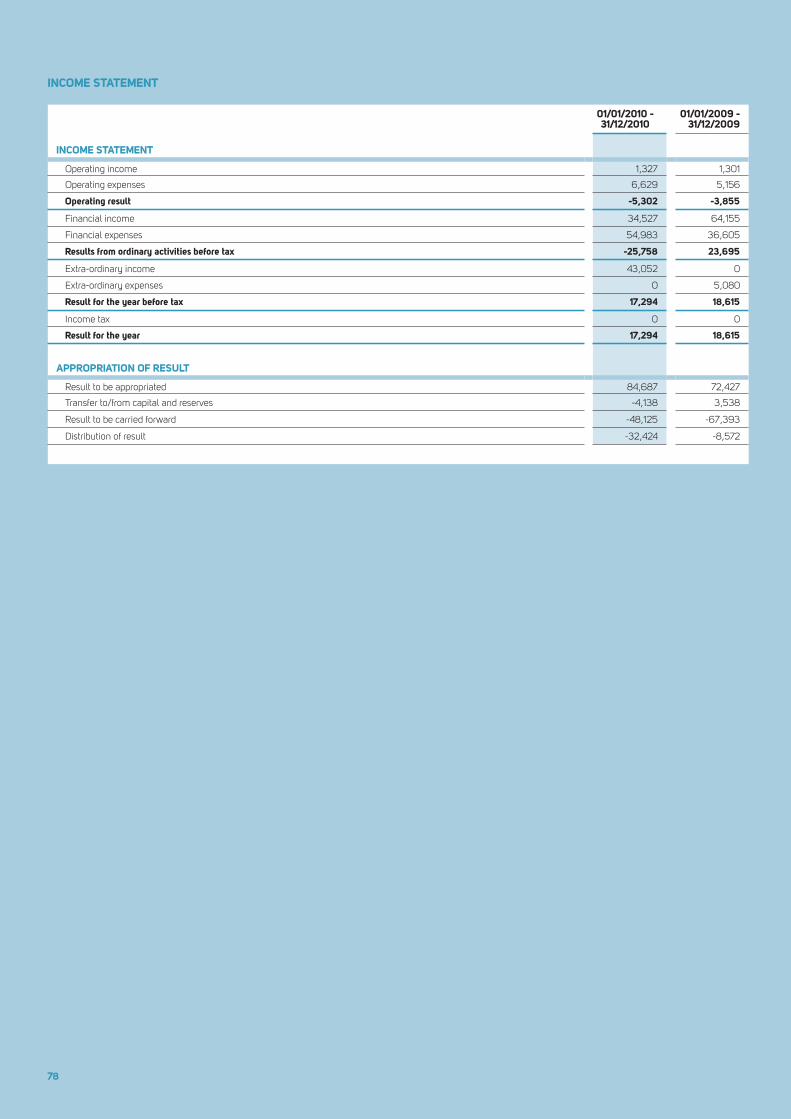
78
Colophon
01/01/2010 - 31/12/2010
01/01/2009 - 31/12/2009
INCOME STATEMENT
Operating income 1,327 1,301
Operating expenses 6,629 5,156
Operating result -5,302 -3,855
Financial income 34,527 64,155
Financial expenses 54,983 36,605
Results from ordinary activities before tax -25,758 23,695
Extra-ordinary income 43,052 0
Extra-ordinary expenses 0 5,080
Result for the year before tax 17,294 18,615
Income tax 0 0
Result for the year 17,294 18,615
APPROPRIATION OF RESULT
Result to be appropriated 84,687 72,427
Transfer to/from capital and reserves -4,138 3,538
Result to be carried forward -48,125 -67,393
Distribution of result -32,424 -8,572
INCOME STATEMENT
110381 EXMAR JAARVERSLAG FINANCIEEL ENG.indd 78 28/04/11 14:25

Board of Directors
Baron Philippe Bodson – Chairman
Nicolas Saverys – Managing Director/Chief Executive Officer
Leo Cappoen
Ludwig Criel
Patrick De Brabandere
François Gillet
Jens Ismar
Philippe van Marcke de Lummen
Guy Verhofstadt
Baron Philippe Vlerick
NV SAVEREX represented by Pauline Saverys
Executive commitee
Nicolas Saverys – Chief Executive Officer
Patrick De Brabandere – Chief Operating Officer
Pierre Dincq – Managing Director Shipping
David Lim – Managing Director Offshore
Didier Ryelandt – Chief Financial Officer
Paul Young – Chief Marketing Officer
Marc Nuytemans – CEO EXMAR Shipmanagement
Bart Lavent – Managing Director LNG upstream/downstream
Auditor
Klynveld Peat Marwick Goerdeler – auditors - represented by Mr. Serge Cosijns and Mr. Filip De Bock.
EXMAR Nv
De Gerlachekaai 20
2000 Antwerp
Tel.: +32(0)3 247 56 11
Fax: +32(0)3 247 56 01
Business registration number:
0860 409 202 RPR Antwerp
Website: www.exmar.be
E-mail: [email protected]
Contact
• All EXMAR press releases can be consulted
on the website: www.exmar.be
• Questions can be asked by telephone at
+32(0)3 247 56 11 or by e-mail to corpo-
[email protected], for the attention of Patrick
De Brabandere (COO), Didier Ryelandt
(CFO) or Karel Stes (Secretary).
• In case you wish to receive our annual or
halfyear report please mail:
Dit halfjaarverslag is eveneens besc hikbaar in
het Nederlands.
The Dutch version of this half year report must
be considered to be the official version.
Design and production: www.dmsgroup.eu
Cert no. CU-COC-809718-BV
Colophon
79
01/01/2010 - 31/12/2010
01/01/2009 - 31/12/2009
INCOME STATEMENT
Operating income 1,327 1,301
Operating expenses 6,629 5,156
Operating result -5,302 -3,855
Financial income 34,527 64,155
Financial expenses 54,983 36,605
Results from ordinary activities before tax -25,758 23,695
Extra-ordinary income 43,052 0
Extra-ordinary expenses 0 5,080
Result for the year before tax 17,294 18,615
Income tax 0 0
Result for the year 17,294 18,615
APPROPRIATION OF RESULT
Result to be appropriated 84,687 72,427
Transfer to/from capital and reserves -4,138 3,538
Result to be carried forward -48,125 -67,393
Distribution of result -32,424 -8,572
110381 EXMAR JAARVERSLAG FINANCIEEL ENG.indd 79 28/04/11 14:25

EXMAR NV
De Gerlachekaai 202000 Antwerp
Website: www.exmar.beE-mail: [email protected]
Tel.: +32(0)3 247 56 11 Fax: +32(0)3 247 56 01
Business registration number: 0860 409 202 rpr Antwerp
110381 EXMAR JAARVERSLAG FINANCIEEL ENG.indd 80 28/04/11 14:25

financial calender
Shareholders meeting 17 May 2011
Publication annual report 17 May 2011
Dividend 25 May 2011
Press release provisional results 1st Semester 2011 28 July 2011
Publication half year report 31 August 2011
Press release trading update 3 Quarter 2011 27 October 2011
Press release provisional results 2011 26 January 2012
Shareholders meeting 15 May 2012
Publication annual report 15 May 2012
COVER EXMAR A4 ENG.indd 5 28/04/11 16:01

COVER EXMAR A4 ENG.indd 6 28/04/11 16:01