EXIT POLL – ELECTION DAY SURVEY -...
44
Election 2008 Gallup Pakistan – Business Recorder EXIT POLL – ELECTION DAY SURVEY The survey was carried out by Gallup Pakistan in collaboration with PILDAT exclusively for the Daily Business Recorder and Aaj TV. March 2008
Transcript of EXIT POLL – ELECTION DAY SURVEY -...

Election 2008
Gallup Pakistan – Business Recorder
EXIT POLL – ELECTION DAY SURVEY
The survey was carried out by Gallup Pakistan in collaboration with PILDAT exclusively for the Daily Business Recorder and Aaj TV.
March 2008

Understanding Elections in Pakistan
Elections 2008
- 2 -

Understanding Elections in Pakistan
Elections 2008
- 3 -
C o n t e n t s Introduction
Profile of Leading Political Parties Vote Bank:
Age-wise Education-wise Income-wise Gender-wise Previous Voting Patterns of Current Voters
Voter Perceptions on Fairness of Elections:
Overall Perceptions Perceptions About Polling Station Fairness Perceptions About Electoral Environment Fairness
Views of Voters: On Powers of President and Prime minister
Voters and Leaders: Tips for Party Leaders about Voters’ choices for Political Alliances
Voting Behaviour: How voters make their choice:
Seven Types of Voters
Party loyal Value/Morality seeking Patronage seeking Legislation minded Development seekers Biradari bound Skeptics
Views of Voters on Prime Ministerial Favorites
Combination of Hope and Despair on Different Aspects of the Electoral Process
Differences and similarities in views of Leaders and Voters
PPP ahead among illiterate, PML-N among College educated
Voting Behavior Among Families of Overseas Pakistanis
Importance of Biradri in Voting Decisions
Methodology

Understanding Elections in Pakistan
Elections 2008
- 4 -

Understanding Elections in Pakistan
Elections 2008
- 5 -
INTRODUCTION
Gallup Pakistan carried out a large scale Election Day Survey on February
18 across all four provinces of Pakistan. The survey was not meant to be an
early prediction or to monitor the fairness of elections. It was a survey to
determine the age, income and education composition of the vote banks of the
leading political parties. But it also captured perceptions about fairness of
elections, voter's outlook on the powers of the prime minister and a host of other
issues.
The survey was carried out by Gallup Pakistan in cooperation with PILDAT
exclusively for the Daily Business Recorder and Aaj TV.
The findings are presented here in the form of eleven reports. Report 1
analyses profile of political party vote banks, by age, gender, education,
income group and previous voting history. Report 2 discusses voter
perceptions about fairness of the electoral process. Report 3 captures voters’
opinion on powers of the President and Prime Minister. Report 4 reveals
voters choices for various party alliances. Report 5 discussed motivations to
vote categorizing them into seven voters types. Report 6 looks at voters’
views on Prime Ministerial favorites. Report 7 discusses voters’ sense of
efficacy as well as apprehensions about incomplete tenures. Report 8 contrasts
the views of leaders and voters on the issue of Presidential powers. Report 9
compares voting behavior across education groups. Report 10 compares voting
behavior of families of Overseas Pakistanis. The final report in this series
analyses the role of biradri (kinship ties) in the electoral politics of Pakistan.

Understanding Elections in Pakistan
Elections 2008
- 6 -
The findings are based on a survey of 5338 statistically selected voters from
all the four provinces of Pakistan. They were randomly selected as they
stepped out of polling stations after casting their vote.
All of these reports were submitted for publication to the Daily Business
Recorder which has been serializing them during the period February 20, 2008
to March 4, 2008.

Understanding Elections in Pakistan
Elections 2008
- 7 -
Report # 1
PROFILE OF POLITICAL PARTY VOTE BANKS By Age, Education, Income, Gender and previous voting history.
AGE COMPOSITION
The vote bank of all three leading parties is fairly similar in age
composition.
PPP PML(N) PML(Q) Percent share New voters (Age 18-2 1) 6% 6% 6% Age 22-49 73% 74% 72% Age 50+ 21% 20% 22%
PPPP
6%
73% 21%
PML-N
6%
74% 20%
PML(Q)
6%
72%22%
18-21 years 22-49 22-49 years +50 years
Source: Gallup Pakistan/Pildat-Business Recorder Exit Poll Election Day Survey, 2008.

Understanding Elections in Pakistan
Elections 2008
- 8 -
EDUCATIONAL COMPOSITION PML(N) vote bank has a higher share of college-educated voters compared
to the other. The PPP vote bank has a notably higher share of illiterate
voters.
PPP PML(N) PML (Q) Percent share
Illiterate 43% 26% 27% Up to Middle School 29% 29% 34% High School and Intermediate 23% 34% 44% Bachelors and Masters (College) 5% 11% 5%
PPPP
Upto Middle29%
Illiterate43%
College5%
Upto Inter23%
PML-N Upto Middle29%
Illiterate43%
College11% Upto
Inter34%
PML-Q
Upto Middle31%
Illiterate43%
College5%
Upto Inter39%
Source: Gallup Pakistan/Pildat-Business Recorder Exit Poll Election Day Survey, 2008.

Understanding Elections in Pakistan
Elections 2008
- 9 -
INCOME POSITION PML(N) vote bank has a higher share of upper income groups followed by
PML(Q). PPP has higher share of the very poor.
PPP PML(N) PML(Q) Percent share Very Poor* 12% 8% 8% Lower Middle 65% 57% 60% Middle and Higher 23% 35% 32% *Income Group Definitions available on request
PPPP
12%
66%
22%
PML-N
8%
58%
34%
PML(Q)
8%60%
32%
Very Poor Lower Middle Middle and Higher
Source: Gallup Pakistan/Pildat-Business Recorder Exit Poll Election Day Survey, 2008.
GENDER COMPOSITION PML (Q) and PPP vote banks have higher share of women compared to PML
(N). PPP PML(N) PML(Q) Percent share Men 47% 50% 44% Women 53% 50% 56%
PPPP
47%
53%
PML-N
50%
50%PML(Q)
44%
56%
Male Female
Source: Gallup Pakistan/Pildat-Business Recorder Exit Poll Election Day Survey, 2008.

Understanding Elections in Pakistan
Elections 2008
- 10 -
Report # 2
PERCEPTIONS ON FAIRNESS OF ELECTIONS The majority of a scientific sample of voters from all across the country
perceived that the polling process on the Election Day was fair. However
views on environment prior to polling were mixed.
72 % perceived there was very little chance of unfair practice on their polling
stations, while 28% believed such a chance existed.
This preliminary report provides questions by answers to the relevant survey
questions. It is followed by a summary table on the indicators of perceptions
about fairness on Election Day and the electoral environment.
OVERALL
Question: Do you suspect Election Day rigging against the party/candidate you voted today for the national assembly seat at your polling station?
Percentage of respondents
Yes 28% No 72%
Yes28%
No72%
Source: Gallup Pakistan/Pildat-Business Recorder Exit Poll Election Day Survey, 2008.

Understanding Elections in Pakistan
Elections 2008
- 11 -
POLLING STATION LEVEL Question: Do you think that the polling staff at the polling station is impartial in
your constituency or partial towards a particular candidate? Percentage of respondents
Partial 7% Impartial 80% Don't Know 13%
Partial7%
Impartial80%
DK13%
Source: Gallup Pakistan/Pildat-Business Recorder Exit Poll Election Day Survey, 2008.
Question: Did you have your hand stamped after you cast your ballot? Percentage of respondents
Yes 96% No 3% No Response 1%
Yes96%
No3%
Don’t Recal
l1%
Source: Gallup Pakistan/Pildat-Business Recorder Exit Poll Election Day Survey, 2008.

Understanding Elections in Pakistan
Elections 2008
- 12 -
PRE-ELECTION ENVIRONMENT
Question: Do you think that the local administration is impartial in your constituency or is partial towards a particular candidate?
Percentage of respondents
Partial 20% Impartial 68% Don't Know 12%
Partial20%
Impartial68%
DK12%
Source: Gallup Pakistan/Pildat-Business Recorder Exit Poll Election Day Survey, 2008.
Question: Some people believe that the Caretaker Government is partial in the elections while some others believe that Government is impartial. What do you think?
Percentage of respondents
Partial 36% Impartial 51% Don't Know 13%
Partial36%
Impartial51%
DK13%
Source: Gallup Pakistan/Pildat-Business Recorder Exit Poll Election Day Survey, 2008.

Understanding Elections in Pakistan
Elections 2008
- 13 -
SUMMARY TABLES PERCEPTION ON FAIRNESS ON ELECTION DAY AND
ELECTORAL ENVIRONMENT
Overall
PollingStaff
Procedure Observance
Local Government
Caretaker Government
Fair 72% 79% 95% 68% 55%
Unfair 28% 9% 4% 20% 32%
No Response 0 12% 1 % 12% 13%
Source: Gallup Pakistan/Pildat-Business Recorder Exit Poll Election Day Survey, 2008.

Understanding Elections in Pakistan
Elections 2008
- 14 -

Understanding Elections in Pakistan
Elections 2008
- 15 -
Report # 3
VIEWS OF VOTERS ON POWERS OF
PRIME MINISTER AND THE PRESIDENT
The distribution of power between the President and the Prime Minister has
been a troublesome issue in Pakistan's recent political history. In some cases, it
led to the dissolution of the parliament while in others it created a situation
where the Parliament, in the view of many, ceased to perform its Constitutional
function. Given that background the voters who voted in the 2008 elections for
the Parliament in Pakistan were asked to give their understanding of who should
have more powers to run the country: the President or the Prime Minister. They
were also asked to state their expectations of what might happen in practice.
They were asked (irrespective of what their own preference was) who would
exercise more powers, once the new parliament is elected: the President or the
Prime Minister.
Seventy-eight percent (78%) of the national sample of voters interviewed in all
the four provinces (Total sample was 5538 voters interviewed on February 18,
as they stepped out of the polling stations) said they would prefer that the new
Prime Minister should exercise more powers than the President. However, when
asked to give their perceptions of what might actually happen, their views were
quite different. Forty percent (40%) believed that in reality the President will
exercise more powers. The survey found a sharp difference between the
preferences of voters and their expectations about the realization of their
preferences.
The survey showed a high degree of clarity among the cross-section of men and
women voters of all ages, educational and income status on who should exercise

Understanding Elections in Pakistan
Elections 2008
- 16 -
more powers as 78% support more powers to the Prime Minister. However the
survey findings also reflect a high degree of skepticism on the practice since
only 60 % believe that the new elected Prime Minister will actually have more
powers in running the country.
Understanding Elections in Pakistan
Elections 2008
- 17 -
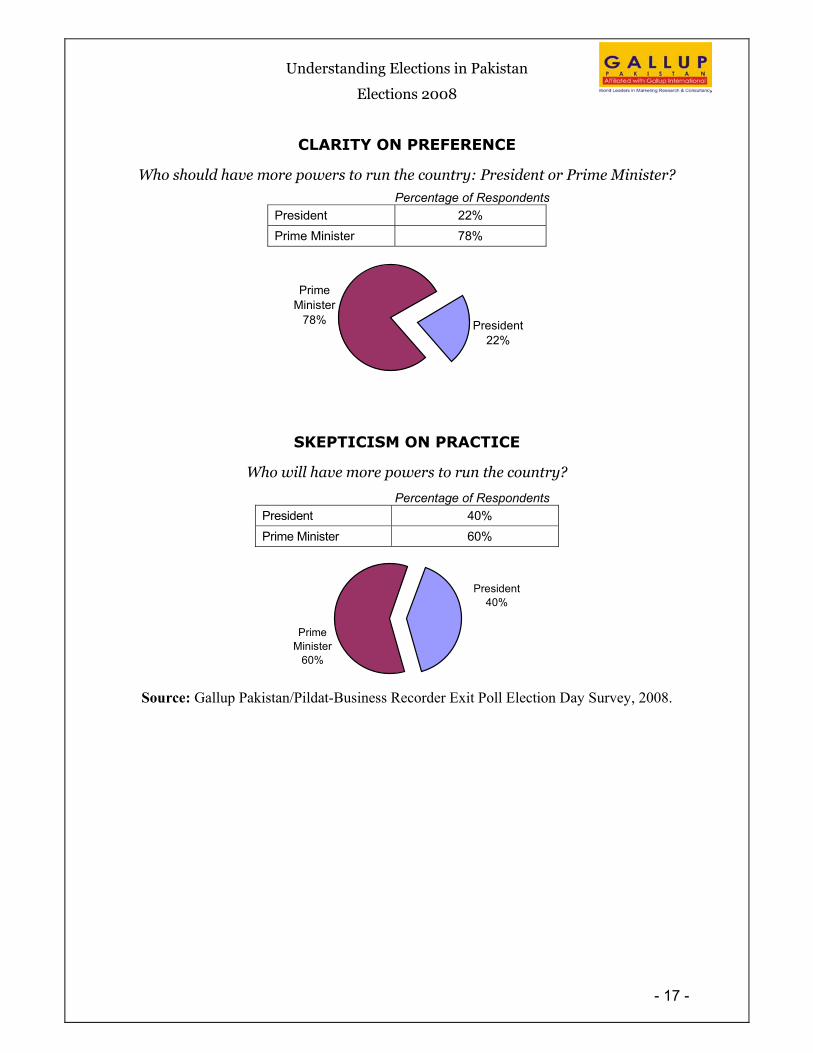
CLARITY ON PREFERENCE
Who should have more powers to run the country: President or Prime Minister?
Percentage of Respondents President 22% Prime Minister 78%
President22%
Prime Minister
78%
SKEPTICISM ON PRACTICE
Who will have more powers to run the country? Percentage of Respondents
President 40% Prime Minister 60%
Prime Minister
60%
President40%
Source: Gallup Pakistan/Pildat-Business Recorder Exit Poll Election Day Survey, 2008.

Understanding Elections in Pakistan
Elections 2008
- 18 -
Report # 4
VOTERS AND LEADERS
TIPS FOR PARTY LEADERS ABOUT VOTERS’ CHOICES FOR
POLITICAL ALLIANCES
As Asif Ali Zardari and Nawaz Sharif scramble to put together an alliance to
form a Government one thing must be on their mind: How would their voters
react to their alliance-formation. Are they emotionally supportive of some
political parties more than others? Are they pre-disposed to some alliances more
than others?
Anticipating this situation the Gallup Pakistan – Business Recorder Exit Poll
Survey had asked a nationally representative sample of voters on the Election
Day: “You have just voted for a person of your choice. Please let us know
who would have been your second best choice?”
The responses by the voters of all the leading parties were both interesting
and revealing. A sizeable group, although a minority, in each party refused
to give a second choice. They were firmly attached to the party of their first
choice and would not speculate on any other possibility. For want of a better
description we have termed them as the “Rigid Voters”. Yet a majority in
each party’s voters mentioned a second choice. These choices would be a
good tip for party leaders about the preferences of the voters who voted them
in as parliament members. Here are the findings:

Understanding Elections in Pakistan
Elections 2008
- 19 -
THE RIGID VOTERS
The proportion of rigid voters who would not even speculate on a second best
choice varies from party to party. Interestingly it was the lowest in the PML(N)
vote bank, 25 % and the highest in the PML(Q), 55 %.
RIGID VOTER RATIO IN VARIOUS POLITICAL PARTIES
PPP
35%
65%
PML-N
25%74%
1%PPP
54%
45%
1%
MQM
46%
54%
ANP40%
59%
1%
Rigid Voter Alliance Minded Voter NR
Source: Gallup Pakistan/Pildat-Business Recorder Exit Poll Election Day Survey, 2008.
PREFERRED ALLIES
PPP-PML(N) Alliance: Voter Affinities
The Exit Poll-Election Day Survey reveals that at this point the voters of the
two top parties, PPP and PML(N) have the highest level of mutual political
affinity. Thus, 40 % of PPP voters indicated PML(N) as their second best
choice; and 45 % of PML (N) voters said the same about PPP.

Understanding Elections in Pakistan
Elections 2008
- 20 -
PPP-PML(Q) Alliance: Voter Affinities
On the other hand only 14 % of PPP voters indicated PML(Q) as their second
best choice and 13 % of PML-Q voters would choose PPP as their second best
choice.
PPP-MQM Alliance: Voter Affinities
The survey showed very uneven relationship between PPP and MQM voters.
Among MQM voters 36 % would have PPP as their second choice. In contrast
only 1 % of PPP voters chose MQM as their second choice. Since the two
parties might need to ally in the Provincial Assembly of Sindh, the party leaders
would need to motivate their voters in favor of cooperation.
PML(Q)-MQM Alliance: Voter Affinities
The affinity between PML(Q) voters and MQM voters is also rather low.
Only 12 % of MQM voters indicated PML(Q) as their second best; the
comparable figure among PML(Q) voters for MQM was 9 %.
ANP Alliance with PPP and PML(N): Voter Affinities
ANP voters are divided roughly equally between PPP and PML(N) as their
second best choice. 17 % ANP voters indicated PPP and 18 % ANP voters
indicated PML-N as their second best choice.

Understanding Elections in Pakistan
Elections 2008
- 21 -
SECOND BEST CHOICE
Question: You have just voted for a person of your choice. Please let us know who would have been your second best choice?
PREFERENCES OF ALLIANCE MINDED VOTERS Among
voters of PPP PML-N PML-Q MQM ANP Others
RIGID VOTERS NR
PPP 40% 14% 1% 2% 8% 35 % 0% PML-N 45% 20% 1% 2% 7% 25 % 1% PML-Q 13% 17% 9% 0% 5% 55 % 1% MQM 36% 4% 12% 0% 3% 46 % 0% ANP 17% 18% 4% 1% 20% 40 % 1%
Source: Gallup Pakistan/Pildat-Business Recorder Exit Poll Election Day Survey, 2008.

Understanding Elections in Pakistan
Elections 2008
- 22 -
Report # 5
VOTING BEHAVIOR
SEVEN TYPES OF VOTERS
One issue often raised in political discourse about Pakistani politics is: To
what extent are the voters' loyalties bound to the individual candidate’s attributes
rather than the party in whose name he contested the elections? The Gallup
Pakistan – Business Recorder Exit Poll (Election Day Survey) has some
answers.
Analysis of the Exit Poll data suggests that voters can be classified into seven
major types by their motivation to vote: Party Loyals, Morality Seeking
Voters, Patron Seeking Voters, Legislation Minded Voters, Development
Seeking Voters, Biradari Bound, and Skeptic Voters.
A preliminary analysis of the data suggests that almost one quarter (24%)
of the voters in the 2008 General Elections like to be seen as Party
Loyals. The most important reason in their choice was the nomination of
their candidate by the party. They chose this reason from seven different
reasons provided to them on a circular card.
21 % of voters would pass as Development Seekers. They mentioned
their legislator's ability to execute development projects, such as,
bringing electricity and building roads for their community as the critical
reason behind their choice.
17 % percent of voters are the Patron-seeking types. The legislator's

Understanding Elections in Pakistan
Elections 2008
- 23 -
ability to help them with the police, courts and other officials stands out
as his major attribute.
12 % of voters are Legislation-Minded. They chose their legislator
because of his competence in the comprehension of national affairs.
Another 12 % voters would like to be seen as Morality/ Value Seeking
voters. They describe legislator's religiosity, honesty and integrity as the
principal motive behind their choice.
9 % admitted to be Biradari-bound. They said they followed their
Biradri's verdict in choosing the legislator.
Only 2 % placed themselves in the category of Skeptic Voters, that is
those who chose a certain legislator because he was most capable of
defeating the candidate whom the voter disliked or despised.

Understanding Elections in Pakistan
Elections 2008
- 24 -
Question: Would you tell us the most important reason, which led you to vote for
the candidate for whom you have just voted for the National Assembly?
Percentage of Respondents Party loyal 24% Development seekers 21% Patronage seekers 17% Legislation minded 12% Value/Morality seekers 12% Biradri bound 9% Skeptics 2% Don’t know 2% Others 1%
Party loyal 24%
Legislation minded 12%
Development seekers 21%
Value/Morality seeking 12%
Biradari bound 9%
Skeptics 2%
Patronage seeking
17%
Don’t know 2%
Others 1%
Source: Gallup Pakistan/Pildat-Business Recorder Exit Poll Election Day Survey, 2008.

Understanding Elections in Pakistan
Elections 2008
- 25 -
Report # 6
VOTERS SPEAK OUT
AMIN FAHEEM AND NAWAZ SHARIF ARE PRIME
MINISTERIAL FAVORITES
As the possibility of a coalition between the two leading political parties
increases, the decisive and divisive issue at hand is who will be the country’s
twenty-seventh Prime Minister. With the tragic assassination of PPP
chairperson, Benazir Bhutto, an obvious option is no longer available. As
parties look towards new and old leaders, voters have indicated some favorites
in the Gallup Pakistan – Business Recorder Exit Poll (Election Day Survey). A
nationally representative sample of voters on the Election Day was asked:
“Which political leader would you like to see as the next Prime Minister?”
Thirty-four percent (34 %) of the respondents nominated a candidate from the
Pakistan People’s Party. While 24 % selected PPP’s Makdoom Amin Faheem,
10% favored party Co-Chairman Asif Ali Zardari as the next Prime Minister.
Leader of PML-N and ex-Prime Minister Nawaz Sharif was the choice of twenty-
six percent (26 %) of the respondents. Another 21 % supported PML-Q leader
Chaudary Pervez Elahi. The remaining 19 % favored other miscellaneous.
While no leader was markedly ahead in the national sample, within parties the
tally of support for political leaders varies. Among respondents who voted for
PPP, a clear majority of 59 % supports Amin Faheem. Less than half of that
(26 %) support Asif Ali Zardari. The remaining are divided between Nawaz
Sharif (5 %) and other candidates (10 %).

Understanding Elections in Pakistan
Elections 2008
- 26 -
Among respondents who voted for PML-N, Nawaz Sharif received the
overwhelming support of 87 %.
Within the PML-Q vote bank, Pervez Elahi is the favorite candidate for 63 %
of the respondents. Compared to others, the PML-Q voter is more open to the
idea of a Prime Minister from outside the party. While 10 % supported Amin
Faheem, another 10 % supported Nawaz Sharif as the next Prime Minister.
For Amin Faheem, three fourths (77 %) of his support came from the PPP
voters while the rest from voters of other parties. Nawaz Sharif has a wider
support base; while two-thirds (65 %) of it came from within his own party, the
rest one third was roughly equally divided among the rest of the parties.
Although the decision of who will lead the government has not been
declared, whatever formula of power sharing is evolved, each party will
have to heed the choice of their party voters as well as the acceptability of
their Prime Ministerial candidate among the supporters of other political
parties.

Understanding Elections in Pakistan
Elections 2008
- 27 -
Question: “From the given names, who would you like to be the Prime Minister of the Country: Amin Fahim, Asif Zardari, Nawaz Sharif, Pervez Elahi or someone else?”
Pervez Elahi 21% Asif Zardari 10%
Others 19%
Nawaz Sharif 26%
Amin Faheem 24%
Source: Gallup Pakistan/Pildat-Business Recorder Exit Poll Election Day Survey, 2008
WHO SHOULD BE THE NEXT PRIME MINISTER OF PAKISTAN?
PPP Candidates PML-N PML-Q
Percent of Respondents Amin Faheem
Asif Zardari Nawaz
Sharif Pervez Elahi
Others/ NR
Among All (Read in Rows) 24% 10% 26% 21% 19% Among Voters of * (Read in Rows)
PPP 59% 26% 5% 2% 8% PML-N 4% 1% 87% 3% 5% PML-Q 10% 2% 10% 63% 15% MQM 8% 1% 5% 35% 51% * Those who voted for the party in 2008 National Assembly Election
Source: Gallup Pakistan/Pildat-Business Recorder Exit Poll Election Day Survey, 2008

Understanding Elections in Pakistan
Elections 2008
- 28 -
Report # 7
COMBINATION OF HOPE AND DESPAIR
ON DIFFERENT ASPECTS OF THE ELECTORAL PROCESS
The verdict is out on this very crucial election which President Pervez
Musharraf had casually and perhaps half jokingly termed as the “Mother of all
Elections”. Voters express a combination of hope and despair on different
aspects of the electoral process. Eighty percent (80 %) are confident their vote
can make a difference. Yet only 57 % believe this parliament will complete its
term.
The Gallup Pakistan – Business Recorder Exit Poll (Election Day Survey)
asked a nationally representative sample of voters on the Election Day: “Do you
think your vote will be helpful in improving the condition of our country or
not?” Eighty percent (80%) of the respondents expressed faith that their vote
will be helpful. Only 7% were despondent, while 13% remained uncertain.
Voters’ sense of efficacy has increased from 70% in 1997 when the same
question was asked in the 1997 Exit Poll. This increase is a healthy sign that
voters are increasingly confident about the ability of democracy to resolve the
country’s current political crises.
Regionally, the voter in Sindh was the most confident on Election Day.
Ninety-two percent (92%) said their vote will improve national affairs. They
were followed by voters in NWFP (78%), Punjab (77%) and then
Balochistan (71%). Among political parties while most followed the national
average, MQM voters were the most confident about the efficacy of their
vote (95 %).

Understanding Elections in Pakistan
Elections 2008
- 29 -
Despite this heightened sense of empowerment, when voters were asked, “Do
you think the Newly Elected Government will complete its five-year tenure
or not?” only 57 % said yes it will. Sixteen percent (16 %) were convinced that
the government will follow in the footsteps of its predecessors and be dismissed
in less than five years. A notable 27% remained dubious and said they did not
know. The average life expectancy of an elected Parliament in Pakistan is less
than three years. With four out of five recent governments dismissed before
their time, voters remain apprehensive about the prospects of the 2008
Parliament.
Within regions, voters in Sindh were again more hopeful; sixty-four percent
(64 %) said the new government will serve for five years. In Balochistan 68%,
in NWFP 57% and in Punjab 54% said the same. Among political parties, again
78% of MQM voters expected parliament to remain for five years. On the other
hand, PML-N voters were the most despondent; only 49% believed the new
government will be allowed to complete its term.
In an interesting comparison, the last time a government was elected to be
dismissed (1997), levels of hope about the longevity of the parliament were
even lower; only 40% of voters in the 1997 Exit Poll Survey on Election
Day believed the parliament would complete its term.
In the span of a decade, the expectations of voters have increased, not only
from the power of their own individual votes and their favored parties but also
from the ability of the system to deliver on its promises. As the new parliament
begins to take shape, one hopes it will rise up to these expectations.

Understanding Elections in Pakistan
Elections 2008
- 30 -
Question: “Do you think your vote will be helpful in improving the condition of our country or not?”
Percent of Respondents
Helpful 80%
Not helpful 7%
Don't Know 13%
Hopeful80%
Not helpful
7%
Don’t Know13%
Source: Gallup Pakistan/Pildat-Business Recorder Exit Poll Election Day Survey, 2008
COMPARISON WITH THE PAST
Question: “My vote will be helpful in improving the condition of our country”
73% 75%70%
80%
1990 1993 1997 2008
Source: Gallup Pakistan Exit Polls, 1990-2008

Understanding Elections in Pakistan
Elections 2008
- 31 -
Question: “Do you think the Newly Elected Government will complete its five-year
tenure or not?” Percentage of Respondents
It will Complete its tenure 57%
It will be Dismissed 16%
Don't Know 27%
It will Complete its
tenure57%
It will be Dismissed
16%
Don’t Know27%
Source: Gallup Pakistan/Pildat-Business Recorder Exit Poll Election Day Survey, 2008
COMPARISON WITH 1997
“I think the Newly Elected Government will complete its tenure”
40%
57%
1997 2008
Source: Gallup Pakistan/Pildat-Business Recorder Exit Poll Election Day Survey, 2008

Understanding Elections in Pakistan
Elections 2008
- 32 -
Report # 8
DIFFERENCES AND SIMILARITIES IN VIEWS OF LEADERS
AND VOTERS
Leaders of political parties have developed staunch views on issues of power
sharing, but do their views reflect the constituency they purport to represent?
Recent media reports indicate that PML-Q leadership is very articulate in
supporting President Musharraf to stay as President for the next five years,
while his other ally, MQM, had been taking a more cautious stance on the
subject. The Gallup Pakistan – Business Recorder Election Day survey
reveals an interesting contrast with the attitudes of their voters. Even though
the leadership is cautious, the voters of MQM are warm towards him and his
powers. To the contrary despite the unambiguous support by party
leadership, the voters of PML-Q are only lukewarm towards Musharraf.
More than 5000 voters were asked as they stopped out of polling booths
what was their opinion on the formula for power sharing. In response to the
question, “Who would you say should have more powers in the new
parliament” 57 % of MQM voters favor the President over the Prime
Minster. In contrast, only 34 % of PML-Q voters favor the President’s pre-
eminent role, Their enthusiasm hangs roughly in the middle of the scale
between MQM voters on the one end and PPP and PML-N voters on the
other, as only 13 % of PPP and 12 % of PML-N voters would like to see the
President to have more powers than the Prime Minister.
Among the voters of PPP and PML-N there is a resounding support for the
Prime Minster to have more authority in running the country (87% and 88%,

Understanding Elections in Pakistan
Elections 2008
- 33 -
respectively). This is not surprising since the last two Prime Minister to get
deposed by a presidential order belonged to these two parties.
WHO SHOULD HAVE MORE POWERS: PRESIDENT OR PRIME MINISTER?
Percentage of Respondents
Among Voters of * (Read in Rows) President
Prime Minister
PPP 13 % 87 %
PML-N 12 % 88 %
PML-Q 34 % 66 %
MQM 57 % 43 % * Those who voted for the party in 2008 National Assembly Election
Source: Gallup Pakistan/Pildat-Business Recorder Exit Poll Election Day Survey, 2008
Question: “Who would you say should have more powers in the new parliament: President or Prime Minister?”
PPP
13%87%
PML-N
12%88%
PML-Q
34%66%
MQM
57%
43%
Source: Gallup Pakistan/Pildat-Business Recorder Exit Poll Election Day Survey, 2008
Understanding Elections in Pakistan
Elections 2008
- 34 -
Report # 9
PPP AHEAD AMONG ILLITERATE, PML-N AMONG
COLLEGE EDUCATED
PPP and PML-N, the two emerging alliance partners in the aftermath of the
2008 Elections in Pakistan appeal to different socio-economic groups of
voters especially when it comes to educational attainment. The PPP has a
notable edge among the bottom of the scale, those with low levels or no
education, while the PML-N has a notable edge among the top of the scale,
among voters with college and university education.
At the all Pakistan level, 34 % low education group voted for PPP and only
half as many, 17 %, voted from PML-N. Conversely among those with
college education, PML-N has a notable edge over PPP; 35 % of them voted
for PML-N and only 25% for PPP. The pattern is the same in Punjab, the
most populous province of the country where the two leading parties
competed for voters. Among the lower education groups in Punjab, PPP was
ahead of PML-N by a margin of 5 %. But PML-N more than made up for
this gap among the college educated scoring 51 % against only 18 % for
PPP.
Between now and the next elections the two leading political parties might
try to improve their position among groups that they are currently weak in.
However in the meantime their alliance provides a sound basis for ensuring
between the two of them a wider appeal for both the upscale and the
downscale sections of the Pakistani population.

Understanding Elections in Pakistan
Elections 2008
- 35 -
VOTING BEHAVIOR BY EDUCATIONAL ATTAINMENTS
Among voters (read in rows) PPP PML-N Others Illiterate or up to Middle School education only 34 % 26 % 40 % Secondary and Higher Secondary Education 26 % 21 % 53 % College and University Education 25 % 35 % 40 %
34%
26% 26%21%
25%
35%
Low Education MediumEducation
High Education
PPP PML-N
Source: Gallup Pakistan/Pildat-Business Recorder Exit Poll Election Day Survey, 2008
Understanding Elections in Pakistan
Elections 2008
- 36 -
Report # 10
VOTING BEHAVIOR AMONG
FAMILIES OF OVERSEAS PAKISTANIS
Nearly 15% or 5.3 million of those who voted on February 18 in Pakistan's 9th
National Elections are intimately linked to the world because they have an
immediate family member who is working abroad as an overseas worker. This
figure corresponds with the latest estimates on Pakistanis abroad, as
approximately 4 million Pakistanis coming from close to 15% of Pakistani
households are currently working abroad. Thus they turned out to vote in the
same proportion as the rest of the population, neither higher nor lower.
Did any of the political parties enjoy a notable edge of support among the
overseas Pakistani families?
They generally voted in the same proportions for various political parties as
their neighbors and other constituents. But there were some exceptions. PML-N
in Punjab enjoyed an edge over PPP among the OP (Overseas Pakistani)
families in Punjab. Similarly and more surprisingly PPP enjoyed an edge over
MQM among OP families in urban Sindh (Karachi) where it was otherwise a
distant runner up. 51 % of OP families claimed to vote for PPP as opposed to
40% to MQM.
As a spillover from the electoral behaviour survey the Gallup Pakistan –
Business Recorder Exit Poll (Election Day Survey) produced a good indication
of OP families in different parts of the country. It showed that 18% of
households in each of Punjab and NWFP, 9% in Sindh and only 2% in

Understanding Elections in Pakistan
Elections 2008
- 37 -
Balochistan had one or more family members who are currently working
abroad. Their voting behaviour is however only marginally different from their
neighbors with no household members working abroad.
VOTERS PROFILE OF LEADING POLITICAL PARTIES
Percentage of respondents
Voters of PPP PML-N PML-Q
Share of OP families in party’s voters Nationally 13 % 18 % 19 %
Share of OP families in party’s voters in Punjab 15 % 19 % 21 %
OVERSEAS PAKISTANI FAMILIES
SHARE IN TOTAL VOTERS OF LEADING PARTIES
PPP Voters Nationally
13%87%
PML-N Voters Nationally
18%82%
PPP Voters in Punjab
15%85%
PML-N Voters in Punjab
19%81%
Non-Overseas Pakistani Families Overseas Pakistanis Families
Source: Gallup Pakistan/Pildat-Business Recorder Exit Poll Election Day Survey, 2008.
Understanding Elections in Pakistan
Elections 2008
- 38 -
Report # 11
IMPORTANCE OF BIRADRI IN VOTING DECISIONS
Does Biradri play a role in voting decisions? Only 9% in the Gallup Pakistan –
Business Recorder Exit Poll (Election Day Survey) say it does. But the subject
is perhaps more complicated than reaching this simple conclusion. Firstly, while
only 9 % nationally say "Biradri" or "kinship group" was the single most
important influence in their voting decision, the proportion in some areas of the
country is much larger. Incidentally, it might be appropriate to translate
"Biradri" in English as "kinship" as opposed to “caste” which has several other
connotations and usually a fixed hierarchy attached to it. Secondly, the
influence of "Biradri" on voting decision is more complex than a
straightforward "yes" and "no". As we have discovered in our research, "group-
thinking" comprising deliberations in the community and negotiating political
loyalties as "corporate" groups in the sociological sense is an important part of
election campaign. It happens in rural settings as well as urban neighborhoods,
and occupational syndicates of various levels and kinds. People may not always
decide to vote for a person from their own community or "biradri". Yet meeting
as a community or "biradri" to deliberate and decide on who to vote for is much
more common than what might be otherwise understood as voting for a
candidate of ones own “biradri”. It should also be noted that in many cases
competing candidates are from the same biradri and that biradri can be a very
loose concept encompassing at one level tens of millions of people leaving very
little room for narrow and binding group loyalty. In a nutshell, "Biradri" plays a
role in voting behaviour well understood by the players in the game but not
necessarily its observers and analysts. Here is an attempt to reveal at least one
layer of understanding as captured though survey research among a nationally

Understanding Elections in Pakistan
Elections 2008
- 39 -
representative sample of over 5000 voters on the Election Day and a follow up
survey with over 1000 voters across the country.
Percent of respondents indicating
BIRADRI AS THE SINGLE MOST IMPORTANT INFLUENCE
ON VOTING DECISIONS
Question: “Would you tell us the most important reason, which led you to vote for
the candidate for whom you have just voted for the National Assembly?”
All Pakistan 9 % Province-wise
Punjab 9 % Sindh 7 %* NWFP 15 % Baluchistan 7 %
Rural-Urban-wise Urban 7 % Rural 11 %
* This figure is for all of Sindh. The figure is higher for Rural Sindh. In NWFP, it also includes the tribal areas
Source: Gallup Pakistan/Pildat-Business Recorder Exit Poll Election Day Survey, 2008.
PROPORTION OF “BIRADRI BOUND” VOTERS IN VOTE BANKS OF
LEADING POLITICAL PARTIES
Interestingly, the three leading parties have the same share of “Biradri Bound”
voters in their vote bank. However, the biradri bound voters have a much higher
proportion in the vote bank of ‘Independent’ candidates who did not contest the
election under a party banner.

Understanding Elections in Pakistan
Elections 2008
- 40 -
PPP
Biradri Bound
8%92%
PML-N
Biradri Bound
8%92%
PML-Q
Biradri Bound
8%92%
Independents
Biradri Bound
15%
85%
Source: Gallup Pakistan/Pildat-Business Recorder Exit Poll Election Day Survey, 2008.
ROLE OF BIRADRI IN VOTING DECISION PROCESS Two questions were asked in a follow-up survey of voters a week after the
Pakistan National Elections 2008. The findings show that approximately 20%
said they voted for someone who belonged to their Biradri. This figure is higher
than the 9 % who told us in the Election Day – Exit Poll that "Biradri" bonds
critically determined their voting decision, indicating that even when they vote
for someone from their own "Biradri" they do not necessarily think or admit the
decision was guided by that consideration. Whether the continuing role of
"Biradri" in Pakistani society is considered desirable or undesirable, the survey
findings confirm its existence as an important civil society institution. Thus,
37% of rural voters and 27 % of urban voters claim that they gathered in a
meeting of their Biradri to deliberate on whom to vote for.

Understanding Elections in Pakistan
Elections 2008
- 41 -
Percent of respondents
SAYING THE PERSON THEY VOTED FOR
belonged to their Biradri
Question: “The person whom you voted for in this National Election was from
your Biradri or some other?”
All Pakistan 20% Location-wise
Urban 12% Rural 25%
Source: Gallup Pakistan Survey, 23-24 February 2008
Percent of respondents
SAYING THEY MET AS BIRADRI GROUP TO DELIBERATE ON A
VOTING DECISION
Question: “Did you meet as Biradri group to deliberate on a voting decision?”
All Pakistan 33%
Location-wise Urban 27% Rural 37%
Source: Gallup Pakistan Survey, 23-24 February 2008
Summary Table
IMPORTANCE OF BIRADRI IN VOTING DECISIONS
Percentage of Respondents who say All Pakistan Urban Rural
Biradri was the single most important influence in their voting decision 9% 7 % 11 %
The person they voted for belonged to their Biradri 20% 12 % 25 %
They met as Biradri group to deliberate on a voting decision 33% 27 % 37 %
Source: Gallup Pakistan Survey, 23-24 February 2008.

Understanding Elections in Pakistan
Elections 2008
- 42 -

Understanding Elections in Pakistan
Elections 2008
- 43 -
Methodology
The survey was conducted with a statistically selected sample of 5,338 men
and women voters comprising a cross-section of all ages, income and
educational backgrounds. The survey was conducted in the rural and urban
polling stations of all the four provinces of Pakistan. Interviews were face to
face conducted by a team of more than 200 men and women between 8 am to
5 pm on the polling day (February 18). The respondents were selected
through time sampling method soon after they stepped out of the polling
station. Every voter stepping out at the end of 10-minute slot was selected
for interview. The purpose was to randomize the selection independent of
arbitrary role of the interviewer. The process was continued throughout
polling time to ensure randomization of voters casting their votes during
different parts of the day. All data are computer processed. The error margin
is estimated to be + 2-5% at 95% confidence level.
They survey was carried out by Gallup Pakistan in collaboration with PILDAT
exclusively for the Daily Business Recorder and Aaj TV.
The project was supervised and directed by Dr. Ijaz Shafi Gilani, Chairman,
Gallup Pakistan.

Understanding Elections in Pakistan
Elections 2008
H-45, St. 52, F-7/4, Islamabad, Pakistan. Tel (+92-51) 2825745; Fax: (+92-51) 2827417 Email: [email protected]; Web: www.gallup.com.pk