Corporate Governance and Reporting an Empirical Study of the Listed Companies in Bangladesh
THE JOURNAL OF FINANCE • VOL. LXVIII, NO. 6 • DECEMBER 2013
Exit as Governance: An Empirical Analysis
SREEDHAR T. BHARATH, SUDARSHAN JAYARAMAN, and VENKY NAGAR∗
ABSTRACT
Recent theory posits a new governance channel available to blockholders: threat ofexit. Threat of exit, as opposed to actual exit, is difficult to measure directly. However,a crucial property is that it is weaker when stock liquidity is lower and vice versa. Weuse natural experiments of financial crises and decimalization as exogenous shocksto stock liquidity. Firms with larger blockholdings experience greater declines (in-creases) in firm value during the crises (decimalization), particularly if the manager’swealth is sensitive to the stock price and thus to exit threats. Additional tests suggestexit threats are distinct from blockholder intervention.
TRADITIONAL THEORIES OF BLOCKHOLDER governance focus primarily on block-holder intervention in management decisions. However, recent theories positthat blockholders can govern firms even when they have no intervention power.These theories view blockholders as informed traders who control manage-ment through “exit,” that is, selling a firm’s stock based on private information(Admati and Pfleiderer (2009), Edmans (2009), Edmans and Manso (2011)).Blockholder exit in these models exerts downward pressure on the stock price,which hurts management through its equity interest in the firm. Managementtherefore wants to make sure its actions are such that blockholders are willingto stay with the firm.
When blockholders are informed traders, management undertakes produc-tive effort and investment to improve firm value and dissuade blockholdersfrom exiting. The true governance force therefore comes from the threat ofblockholder exit, not actual exit. Even if no exit is observed, blockholders couldbe governing effectively because their exit threat is sufficient to discipline man-agement.
This study is a first attempt to empirically test the governance impact ofblockholder exit threats. Since threats cannot be directly observed, this study
∗Sreedhar T. Bharath is with Arizona State University, Tempe; Sudarshan Jayaraman is withWashington University in St. Louis; and Venky Nagar is with the University of Michigan. We areespecially grateful to main reviewer, whose contribution to improving the paper was significantand substantial. We are also grateful to Editor Campbell Harvey, the Associate Editor, and a final-stage advisory reviewer for their detailed suggestions. In addition, we thank Anat Admati, YakovAmihud, Alex Edmans, and workshop participants and discussants at Emory University, the GIAconference hosted by the University of North Carolina at Chapel Hill, Indian School of Business,Journal of Accounting, Auditing and Finance annual conference, Stanford University, the WesternFinance Association annual meeting, University of Alabama, University of Michigan, the UtahWinter Accounting conferences, and Washington University. All errors remain our own.
DOI: 10.1111/jofi.12073
2515

2516 The Journal of Finance R©
focuses instead on a key mechanism that facilitates exit threats, namely, stockliquidity. Exit threat models suggest that stock liquidity enhances the power ofexit threats and improves firm value. For example, in Edmans (2009) the man-ager is compensated based on the stock price and can take fundamental actionsto improve firm value. Stock liquidity encourages strategic traders to acquiremore information on firm fundamentals and trade on it in larger volumes (orblocks). The manager is sensitive to the resulting stock price, and thereforetakes actions to increase firm value and induce (informed) blockholders to stay.Liquidity thus enhances the power of blockholder exit threats and improvesfirm value. This theoretical prediction forms the basis of our empirical tests.
A full structural model of liquidity, blockholdings, and firm value is not onlydifficult to construct, but also confounded by the fact that the finance literaturehas not converged on a definitive measure of liquidity. We therefore bypass thestructural approach entirely, appealing instead to exogenous liquidity shocks.We first examine two foreign financial crises, namely, the Russian default crisisand the Asian financial crisis—unexpected exogenous events (from an individ-ual firm’s perspective) whose duration was unknown at the time of their onset.A significant body of work indicates that these events significantly decreasedliquidity in the U.S. stock market (Acharya and Pedersen (2005), Chordia,Sarkar, and Subrahmanyam (2005)). We test how the association between firmvalue (Q) and blockholding shifts around the above exogenous liquidity shocks.We find that firms with larger block ownership were impacted significantlymore during these crises. A one standard deviation increase in block owner-ship corresponds to a decrease in Q of about 4.1% during the crisis period, aneconomically large effect.1 Blockholder exit threats thus appear to be stronglyoperating in our sample.
Due to the foreign nature of the above crises, we have some confidence inpositing that their impact on the U.S. stock market was primarily throughstock liquidity. However, it is possible that these crises affected Q directly. Wetherefore pick a noncrisis candidate for an exogenous liquidity shock, namely,the decimalization in early 2001 when the NYSE and Amex (and subsequentlyNASDAQ) started quoting and trading their listed issues in dollars and centsas opposed to increments of a sixteenth of a dollar. Decimalization is thereforea liquidity-increasing shock. We expect and find a significantly greater increasein firm value postdecimalization for firms with larger block holdings. The eco-nomic magnitude is also significant, with a one standard deviation increase inblock ownership corresponding to an increase in Q of about 7.1%.
One concern with tests using liquidity shocks is that the observed resultscould simply be an artifact of an ongoing trend, for example, if the associationbetween block ownership and firm value was trending downwards before thecrises and upwards before decimalization. In such a case, the continuation of
1 We compute the effect of a one standard deviation increase in block ownership on Q during thecrisis period, relative to the median Q in the sample, separately for the Russian (4.7%) and Asian(3.5%) financial crises. We then average the effects for the two crisis periods to arrive at the 4.1%figure.
Exit as Governance: An Empirical Analysis 2517
this trend would be an alternative explanation for our results. To alleviate thisconcern, we run falsification tests by constructing periods of “pseudo-shocks” todenote periods of equal length before the actual liquidity shocks (Russian crisis,Asian crisis, and decimalization). We do not find any analogous significanteffects around pseudo-shocks, lending further confidence to our interpretationthat the effect of liquidity on the association between firm value and blockownership is not due to trends, but rather to exit threats.
Finally, we conduct the same analysis for the recent U.S. financial crisis in2008, and find strong results for this event as well. A one standard deviationincrease in block ownership corresponds to a decrease in Q of about 2.5% duringthe crisis period. However, we are cautious in imputing this result solely to exitthreats. The economic impact of the recent crisis on our sample of U.S. firmsextended far beyond just liquidity shocks; the accompanying collapse of thehousing sector and the economic downturn also adversely affected firms’ fun-damentals (e.g., demand for their products). It is therefore difficult to attributeQ-based results around the U.S. financial crisis to just liquidity effects.2
The above-mentioned results on the role of stock liquidity in modulating theassociation between blockholdings and firm value do not conclusively implicateexit threats. Liquidity can improve firm valuation even when blockholdersgovern through intervention (i.e., “voice”). For example, Maug’s (1998) modelshows that liquidity enhances voice because it allows the blockholder to buyadditional shares at a price that does not reflect the benefits of intervention.Since both intervention and exit threats could be operating in the data, it isimportant to separate the two. One distinction between intervention theoriesand exit threat theories is that the sensitivity of managerial wealth to thestock price (i.e., stock option delta) plays no direct role in the interventiontheories. By contrast, exit threat models predict that the threat of blockholderexit will be more effective in firms whose managers’ wealth is more sensitiveto the stock price. Accordingly, we find that the impact of liquidity shocks onthe blockholder–firm value association is far more pronounced for firms whosemanagers have a significant interest in the firm’s stock price.
We measure management’s interest in the stock price through management’sequity incentives. However, management’s equity position also confers controlrights, which could be valuable for deterring blockholder intervention. To testthis possibility, we conduct the analysis with management blockholdings ratherthan management sensitivity to stock price, as it is the ownership of shares thatconfers control rights. The results indicate that management blockholdingsdo not drive our results. The insignificance of management blockholdings isfurther consistent with exit threat theories, because, except in cases of severeinternal discord, management is unlikely to threaten itself with exit.
We next make another attempt to separate the threat of exit from interven-tion. We assume that blockholder intervention, while prevalent, is likely to be
2 Analogously, Lemmon and Lins (2003) argue that the Asian financial crisis imparted severeshocks to investment and expropriation opportunities for firms in the home countries, which inturn significantly altered these firms’ ownership–performance relations.
2518 The Journal of Finance R©
less effective when managers are more entrenched. Using an entrenchmentindex measure to proxy for this variation, we find that the results continue tohold even among firms with entrenched managers, suggesting exit rather thanintervention as the source of our results. In addition, Admati and Pfleiderer(2009) propose that the effectiveness of exit threats lies not so much in pro-moting good investments by the manager as in deterring bad investments bythe manager (by contrast, blockholder intervention should be equally effectivein both cases). Admati and Pfleiderer (2009) suggest that the “bad” agencyproblem is more severe in cash-rich firms. Consistent with this view, we findthat our liquidity shock results hold significantly more strongly for cash-richfirms, suggesting that governance via exit, while potentially concomitant withgovernance via intervention, is distinct from it.
We conclude by placing our study in the context of the corporate governanceliterature. Many studies examine the motivation for and information contentof blockholder exit, which is made possible by regulation viewing blockholdersales as a material event (Parrino, Sias, and Starks (2003)) and thus requir-ing all beneficial owners owning more than 10% of a firm’s shares to reporttheir sales on Forms 4 and 5.3 McCahery, Sautner, and Starks (2010) use sur-vey evidence to show that institutions use exit as their primary governancemechanism. However, they do not have direct evidence. With respect to directevidence, Boehmer and Kelley (2009) link blockholders to price informative-ness by showing that institutional ownership improves price efficiency evenafter controlling for institutions’ trading behavior (i.e., actual exits). To theextent that ownership carries with it an implicit threat of exit, the study’s find-ings correlate well with our study. However, Boehmer and Kelley do not showany links to firm value. On the other hand, Gallagher, Gardner, and Swan(2013) link blockholders to price informativeness and firm value, but they nei-ther study the effect of liquidity (in their study, liquidity is a measure of priceinformativeness so it is a dependent rather than independent variable), nor dothey use natural experiments. Fang, Noe, and Tice (2009) use natural experi-ments to study the effect of liquidity on firm value. Our study makes a numberof contributions above and beyond prior studies: we show that the effect isparticularly strong when block ownership is higher (providing evidence thatliquidity acts through “governance through exit” rather than other channels),we perform falsification tests, and we show that the effect is particularly strongfor equity-aligned managers (a feature specific to exit theories). The results ofour study complement Edmans, Fang, and Zur (2012), who use an exogenousshock to liquidity to identify a threat of exit. Specifically, they show that liq-uidity encourages blocks to form in the first place, and that conditional uponblock formation, the blockholder is more likely to choose exit than voice.
Section I reviews the theory and develops the hypotheses. Section II describesthe data, while Sections III and IV discuss the results. Section V concludes.
3 This reporting requirement was further accelerated by the Sarbanes-Oxley Act. Seehttp://www.sec.gov/answers/form345.htm.
Exit as Governance: An Empirical Analysis 2519
I. Theory and Hypotheses
A. Analytical Models
The traditional view is that blockholders exert governance through inter-vention (e.g., Admati, Pfleiderer, and Zechner (1994)). However, recent studiessuch as Admati and Pfleiderer (2009), Edmans (2009), and Edmans and Manso(2011) argue that even if blockholders are unable to engage in intervention,they can exert governance by engaging in informed trading. The manager takesactions (e.g., effort or investment) that affect the firm’s fundamental value, buthe is compensated according to the stock price. The blockholder has informa-tion on the firm’s fundamental value, and her subsequent trading activitiesimpound this information into the stock price. The stock price more closely re-flects the firm’s fundamental value, thus rewarding or punishing the managerfor his actions.
However, why is such informed trading undertaken by blockholders (ratherthan any other trader)? In standard microstructure models (e.g., Kyle (1985)),the trader’s information acquisition incentives are independent of her initialstake. The key link is developed by Edmans (2009): in the presence of short-sales constraints (or nontrivial short-sales costs), a trader with no stake haslittle incentive to acquire information, due to her inability to trade on it if itturns out to be negative. A blockholder can both buy on positive informationand sell on negative information, and so has a greater incentive to acquireinformation in the first place.4
The blockholder’s acquisition of private information about fundamentals isnot enough to discipline the manager; the private information must reachthe stock price and affect the value of the manager’s shareholdings. In exitthreat models, stock liquidity plays a key role in how a blockholder’s privateinformation gets impounded into the price. First, liquidity encourages moretrade by informed traders. However, there is a force in the opposite direction—when the stock is more liquid, a given blockholder trade has a smaller effect onprices (and thus the manager’s wealth) because it is camouflaged by liquiditytraders. In the standard Kyle model, these two effects exactly cancel out andthere is no effect of liquidity on price informativeness. In the exit threat models,the effect of liquidity is not only that it facilitates exit (as this effect is exactlycanceled by the camouflage effect) but also that it encourages the blockholderto gather information in the first place and encourages more blocks to form inthe first place. It is the combination of these two effects that causes liquidityto increase the potency of the exit threat and discipline management’s actionsand investments, thus improving firm value.5
4 If there are no short-sales constraints, the exit threat argument will still hold if blockholdersfind it easier to be privately informed relative to outsiders who have no present ownership inthe firm. For example, Admati and Pfleiderer (2009, p. 2649) write that, “The large shareholderobserves some information privately before other investors and may be able to sell shares on thebasis of this information.”
5 The above price formation mechanism is modeled explicitly in Edmans (2009) and discussedin detail in Admati and Pfleiderer (2009, Section 6.1). Also see Edmans and Manso (2011), who
2520 The Journal of Finance R©
The idea that liquidity improves the value of firms with larger blockholdingsis not exclusive to exit threat models. Although the traditional view of Coffee(1991) and Bhide (1993) is that liquidity encourages the blockholder to engagein exit rather than voice, and thus worsens governance, other studies such asMaug (1998) show that liquidity enhances voice because it allows the block-holder to buy additional shares at a price that does not reflect the benefits ofintervention.6 Faure-Grimaud and Gromb (2004) consider a blockholder whofaces the risk of having to sell her stake before her intervention has bornefruit. Liquidity encourages intervention because it increases price efficiency;hence, the price at which she sells will incorporate the benefits of intervention.Note that the act of trading itself does not exert governance, unless the man-ager’s wealth is tied to the stock price (in the absence of which, the managertakes no action at all). This is the critical distinction between exit theories andintervention theories.
Specifically, in Edmans (2009), management is willing to make positive NPVinvestments because management is invested in the stock, and blockholder in-formation acquisition and trading activities serve to make the stock price moreinformative about fundamentals. Admati and Pfleiderer (2009) introduce twotypes of projects: a “good” project that has a stochastic but positive NPV, anda “bad” project that has a (stochastic) negative NPV but provides consump-tion perquisites to management. Admati and Pfleiderer (2009) show that exitthreats are much more effective in preventing management from undertak-ing “bad” projects that provide private benefits to management but decreasefirm value than in persuading management to undertake “good” projects thatincrease firm value but impose private costs on management.
The rationale once again lies in the specific details of the manager–blockholder game, the payoffs, and the information setup. The main intuitionis that, as the difference in firm value between taking and not taking a project(the parameter δ in the model, which is positive for a good project and negativefor a bad project) increases in magnitude, the bad project poses a greater agencycost (as firm value falls more) and the act of selling by the large blockholderhas a greater disciplining role. In contrast, under the good action, the largerthe δ, the greater is the increase in firm value, and the blockholder’s sale (if atall) is likely to be due to a liquidity shock as there is no need to discipline byexit. Admati and Pfleiderer (2009, p. 2649) summarize this intuition succinctlyas “ . . . the differences in results for the bad and the good action models are dueto the fact that the inferences that can be made in equilibrium regarding thevalue of the firm condition on exit behave differently in the two types of agencyproblems.” This result further distinguishes exit threats from blockholder inter-vention activities, which should be symmetrically effective in controlling both
extend this idea to the case of multiple blockholders that cannot collude but must compete fortrading profits.
6 As with Edmans (2009), Maug (1998) and Kahn and Winton (1998) also show that liquidityencourages an investor to acquire a block in the first place.
Exit as Governance: An Empirical Analysis 2521
“good” and “bad” agency problems. The next subsection describes how this studyempirically approaches these central predictions of the exit threat models.
B. Empirical Predictions
As discussed in the previous section, exit threat models indicate that liquidityincreases the potency of blockholder exit threats and disciplines management,thus increasing firm value. This hypothesis cannot be tested by regressing firmvalue on the interaction between liquidity and blockholdings—there could bereverse causality from firm value to liquidity (investors are more willing totrade well-performing stocks) or from firm value to blockholders (blockholdersare more willing to take stakes in well-performing stocks) or there could beomitted variables that jointly affect both firm value and liquidity/blockholdings.A potential solution would be to employ a structural approach. The advantage ofthis approach is the ability to test detailed predictions of the theory models, butthe disadvantage is the difficulty in constructing such a structural model—onewould have to include all possible channels of reverse causality from firm valueto liquidity or blockholdings, and all possible variables that jointly affect both(or at least any omitted channels be orthogonal to the ones included), and thisis clearly not possible. Thus, the best approach is to find an exogenous shockto liquidity and ascribe a causal effect to observed reduced-form correlations inthis setting. As explained in the next section, we use several shocks to liquiditywhose origins appear to be exogenous to any individual firm, and we observehow these shocks to liquidity impact the firm value–blockholder association.
In exit threat models, the disciplining force of blockholder exit threat existsbecause the manager is invested in the stock price. While managerial exposureto stock price can take several forms, for example, the possibility of job loss(Jenter and Lewellen (2010)) and takeover threats (Edmans, Goldstein, andJiang (2012)), many of these factors are difficult to estimate precisely ex ante.It is not possible, for example, to measure the ex ante sensitivity of managementturnover to firm performance at the individual firm level. We therefore followthe exit threat models and focus on one concrete and clearly measurable exante factor, namely, management’s equity-based incentives. Specifically, weexamine whether the impact of exogenous shocks to stock liquidity on the firmvalue–blockholder association is more severe for firms whose managerial delta(sensitivity of total wealth to stock price) is higher.
Finally, as discussed in Section I.A, we further distinguish exit threat theo-ries from blockholder intervention theories based on the recommendations ofAdmati and Pfleiderer (2009, Section 7). Specifically, we examine whether ourmain tests hold more strongly for cash-rich firms that are more susceptibleto the “bad” agency problem of management undertaking unprofitable invest-ments for personal perquisites (Admati and Pfleiderer (2009)). These linkages,while natural in exit threat theories, are not immediately evident in traditionalintervention theories of blockholder governance.
Our experimental design captures the valuation impact of shocks to exitthreats. We do not examine the medium- and long-run real effects of these
2522 The Journal of Finance R©
shocks, for two reasons. First, we are unable to predict the time period overwhich these real effects manifest themselves. Second, the relevance of thesereal effects depends on their importance to firm value, which is our dependentvariable. For direct evidence on the real effects of exit threats, we refer theinterested reader to Edmans, Fang, and Zur (2012).
II. Sample and Variable Definitions
A. Exogenous Liquidity Shocks
We first locate settings that, from an individual firm’s perspective, were ex-ogenous, unanticipated, severe, and of uncertain duration, and that decreasedliquidity. Financial crises are natural candidates, but we have to be careful toensure that the primary impact of the crisis on our sample firms was a liquidityshock. We therefore look to foreign crises. Arguably, the effects of these criseson our sample of U.S. firms are primarily liquidity shocks transmitted throughinternational capital markets, as opposed to shocks to operating fundamen-tals. Our first candidate is the Russian default crisis. On August 17, 1998,the Russian government and the Central Bank of Russia issued a statementeffectively declaring that Russia was forced to default on some of its short-termsovereign debt, devalue its currency, and declare a suspension of payments bycommercial banks to foreign creditors (Desai (2000)). Declining productivity,an artificially high fixed exchange rate between the ruble and foreign curren-cies, and a chronic fiscal deficit characterized the economic context prior to themeltdown. The inability of the Russian government to implement a coherentset of economic reforms led to a severe erosion in investor confidence and achain reaction that led investors to flee the financial markets. Studies such asAcharya and Pedersen (2005) and Chordia, Sarkar, and Subrahmanyam (2005)provide evidence of a significant drop in stock liquidity during the Russian cri-sis, suggesting that the liquidity shock was indeed substantive. We refer to theperiod from August 1998 to December 1998 as the Russian default crisis anduse it as a period in which blockholder expectations of future liquidity declined.
The Russian crisis also coincided with the Long Term Capital Manage-ment (LTCM) collapse, which itself caused liquidity problems in the U.S. stockmarket. Our second natural experiment therefore considers an earlier crisis,namely, the Asian financial crisis that gripped much of Asia beginning in July1997 and raised fears of a worldwide economic meltdown due to financial con-tagion following the financial collapse of the Thai baht. On October 27, 1997,the Dow Jones industrial plunged 554 points, or 7.2%, amid ongoing worriesabout the Asian economies, and the NYSE briefly suspended trading.7 Priorstudies such as Acharya and Pedersen (2005) and Chordia, Sarkar, and Subrah-manyam (2005) provide evidence of a sizeable decrease in stock liquidity duringthe Asian financial crisis. We refer to the period from July 1997 to December1997 as the Asian crisis, and use it as another period in which blockholderexpectations of future liquidity declined.
7 This clearly implies that the shock was not perceived as fleeting or insignificant.
Exit as Governance: An Empirical Analysis 2523
The assumption that the foreign crises only affect U.S. firms through stockliquidity and not through any other channel, while plausible, cannot be estab-lished conclusively. As our next candidate, we employ a cleaner shock to liquid-ity alone. This shock is decimalization, an exogenous change in liquidity in early2001 when U.S. stock and option markets began quoting prices in decimal in-crements rather than fractions of a dollar. At the same time, the minimum priceincrement (or tick size) was reduced to a penny on the stock markets. WhileNYSE (as well as Amex) replaced the system of fractional pricing on January29, 2001, the NASDAQ decimalized shortly thereafter, on April 9, 2001. Chor-dia, Sarkar, and Subrahmanyam (2005) show that the decimalization shockto liquidity was very large, reducing the bid–ask spread on average by 61%,suggesting that decimalization constituted a powerful positive liquidity shock.
A key difference between the crises and the decimalization events is thatthe former were unanticipated while the latter was anticipated. In the theo-retical models, what matters is liquidity, regardless of whether it is expectedor unexpected. Liquidity allows blockholders to trade on information—even ifliquidity is expected, its benefit is not diminished. However, expected liquidityshocks can have a different effect from unexpected liquidity shocks if the mar-ket impounds the benefits of the expected shock into Q before the shock itself.In addition, trading in anticipation of an expected liquidity shock could alsomake blockholdings endogenous to liquidity. However, all these considerationsserve to weaken the decimalization results, as the effect on Q would have oc-curred well before the decimalization event, making it harder to find a changepre- versus postdecimalization. We therefore consider both the crises and thedecimalization events equally.
Finally, another exogenous liquidity event that we study is the recent U.S.financial crisis. While this crisis was a shock to liquidity, it was also a direct eco-nomic shock (arguably more so than the foreign crises events) to the value of oursample U.S. firms.8 We therefore view this event mainly as a robustness test.
B. Data
Our sample period is 1996 to 2002. We use blockholder data from two publicsources. For the years 1996 to 2001, we use the blockholder data set of Dlugoszet al. (2006). As those authors note in detail, the Securities Exchange Act of1934 (SEA) defines blockholders as parties whose beneficial ownership in thefirm exceeds 5%. These parties have to publicly disclose both their transactionsand their holdings. Dlugosz et al. (2006) and Jeng, Metrick, and Zeckhauser(2003), among others, argue that, while trading data would appear to providethe most current and comprehensive blockholder information, these data arenoisy and cannot be used to infer the level of individual blockholdings. Dlugoszet al. (2006) therefore recommend the annual proxy data required by Regulation
8 It is for the same reason that we cannot use firm-specific shocks to liquidity. Events that drivethese shocks, for example, expanded investor recognition and analyst following or inclusion in anindex, do not occur randomly but are triggered by changes in firm fundamentals (e.g., Denis et al.(2003)).
2524 The Journal of Finance R©
14 A of SEA as the preferred data source of blockholding information. Dlugoszet al. (2006) have also provided these data to the public.9
However, the Dlugosz et al. (2006) sample stops in 2001; our decimalizationtests require post-2001 data since some firms have fiscal year ends beforedecimalization. We therefore hand-collect blockholder data from the proxystatements for 2002 following the procedure outlined in Dlugosz et al. (2006).We then merge our blockholder data with CRSP and Compustat. Our finalsample consists of 7,143 observations for 1,587 large publicly listed U.S. firmscovered by the Investor Responsibility Research Center (IRRC) for the period1996 to 2002.
C. Variable Definitions
Our measure of firm value is Tobin’s Q (Q). We define Q as the ratio of themarket value of assets divided by the book value of assets, both computed atthe end of each fiscal year.
There is no single accepted measure of block ownership in the literature.For example, Edmans and Manso (2011) model multiple blockholders whocannot coordinate their orders and maximize combined trading profits. As aresult, these blockholders trade competitively, impounding more informationinto prices, which in turn strengthens the threat of disciplinary trading andinduces higher managerial effort and firm value. Thus, both the level of blockownership and the number of blockholders matter for “threat of exit” models(also see Laeven and Levine (2008)). Our constructs of blockholder ownershipmeasure the share of all block owners, the share of the largest block owner,and the number of block owners. We also combine total block ownership andthe number of block owners into a single measure (BlockOwnership) using thefirst principal component of the common variation, computed each fiscal year.While these measures are highly correlated, each is likely to measure a dif-ferent facet of block ownership and finding consistent results across all thesemeasures would increase the confidence in our results. Note that managementcan also be blockholders, and the models we test pertain to nonmanagementblockholders. In our construction of block ownership measures, we thereforeexclude management (i.e., officers).10
Our control variables are motivated by Laeven and Levine (2008). Firm sizeis defined as the log of the market value of equity (Size). Growth is measured
9 See http://www.som.yale.edu/faculty/am859/data.html.10 For a small set of firms in the sample, management also has block ownership. Identification of
management is easy in the Dlugosz et al. (2006) data set because they explicitly indicate whetherthe beneficial owner is an officer. However, the Dlugosz et al. (2006) data set is not available for2002, so we have to hand-collect the data. To economize on collection costs, we do not explicitlyidentify the beneficial owners who are also officers for 2002; instead, we assume that managementblock ownership is unchanged from 2001 and 2002, and use 2001 management block ownershipdata as proxies for 2002 management block ownership data. This imputing procedure is unlikely tobe critical. For a sample of 50 firms in 2002, we manually collect the management block ownership.The correlation between this measure and the imputed value from the 2001 data is 0.95. As afurther robustness check, we also verify that our main results hold when we drop the 2002 sample.
Exit as Governance: An Empirical Analysis 2525
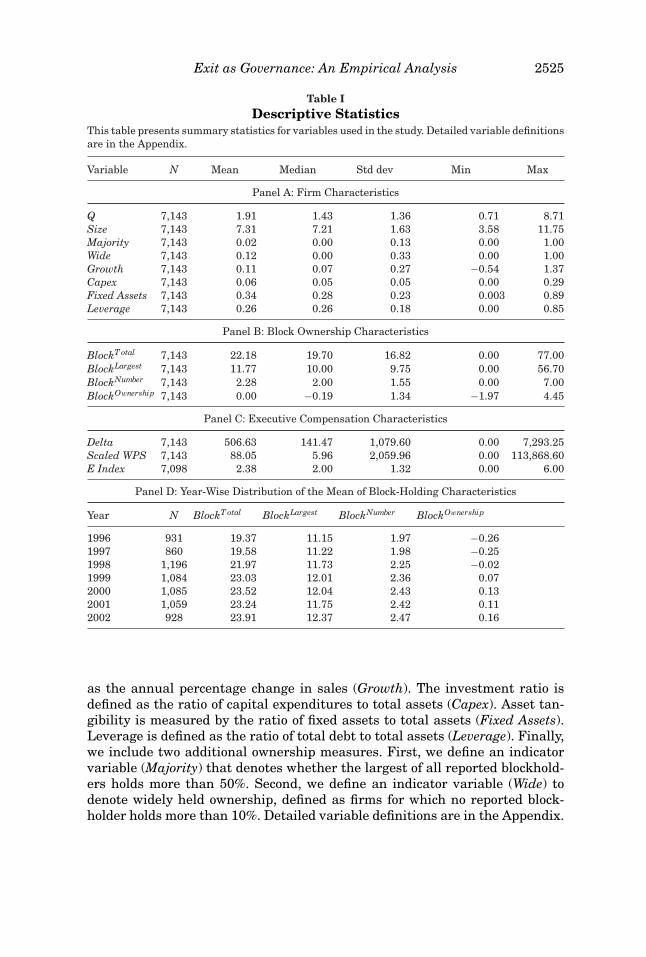
Table IDescriptive Statistics
This table presents summary statistics for variables used in the study. Detailed variable definitionsare in the Appendix.
Variable N Mean Median Std dev Min Max
Panel A: Firm Characteristics
Q 7,143 1.91 1.43 1.36 0.71 8.71Size 7,143 7.31 7.21 1.63 3.58 11.75Majority 7,143 0.02 0.00 0.13 0.00 1.00Wide 7,143 0.12 0.00 0.33 0.00 1.00Growth 7,143 0.11 0.07 0.27 −0.54 1.37Capex 7,143 0.06 0.05 0.05 0.00 0.29Fixed Assets 7,143 0.34 0.28 0.23 0.003 0.89Leverage 7,143 0.26 0.26 0.18 0.00 0.85
Panel B: Block Ownership Characteristics
BlockT otal 7,143 22.18 19.70 16.82 0.00 77.00BlockLargest 7,143 11.77 10.00 9.75 0.00 56.70BlockNumber 7,143 2.28 2.00 1.55 0.00 7.00BlockOwnership 7,143 0.00 −0.19 1.34 −1.97 4.45
Panel C: Executive Compensation Characteristics
Delta 7,143 506.63 141.47 1,079.60 0.00 7,293.25Scaled WPS 7,143 88.05 5.96 2,059.96 0.00 113,868.60E Index 7,098 2.38 2.00 1.32 0.00 6.00
Panel D: Year-Wise Distribution of the Mean of Block-Holding Characteristics
Year N BlockT otal BlockLargest BlockNumber BlockOwnership
1996 931 19.37 11.15 1.97 −0.261997 860 19.58 11.22 1.98 −0.251998 1,196 21.97 11.73 2.25 −0.021999 1,084 23.03 12.01 2.36 0.072000 1,085 23.52 12.04 2.43 0.132001 1,059 23.24 11.75 2.42 0.112002 928 23.91 12.37 2.47 0.16
as the annual percentage change in sales (Growth). The investment ratio isdefined as the ratio of capital expenditures to total assets (Capex). Asset tan-gibility is measured by the ratio of fixed assets to total assets (Fixed Assets).Leverage is defined as the ratio of total debt to total assets (Leverage). Finally,we include two additional ownership measures. First, we define an indicatorvariable (Majority) that denotes whether the largest of all reported blockhold-ers holds more than 50%. Second, we define an indicator variable (Wide) todenote widely held ownership, defined as firms for which no reported block-holder holds more than 10%. Detailed variable definitions are in the Appendix.

2526 The Journal of Finance R©
Table I, Panels A and B, present descriptive statistics for the sample. Themean and median Q of 1.91 and 1.43 correspond closely to the 1.97 and 1.41of Dlugosz et al (2006). The largest nonofficer blockholder in the sample holdson average 11.77% of the firm’s shares. The median firm has two nonofficerblockholders while the sample maximum is seven. As the sample compriseslarge firms, the average log market value is 7.31 or about U.S. $1.5 billion.The largest blockholder holds a majority in only 1.7% of the sample, while only12.3% of all firms are widely held.11 The median firm grew its sales by around7% during the year. Consistent with the presence of growth opportunities, theaverage firm invested in capital expenditures to the tune of 6% of its assetbase. Mean leverage is 26%. Table I, Panel C, provides data on executive com-pensation characteristics, which we describe and use in Section IV.IV.B. PanelD of Table I provides year-wise means of the various blockholder ownershipmeasures: these appear to be stable over time.12
III. Results
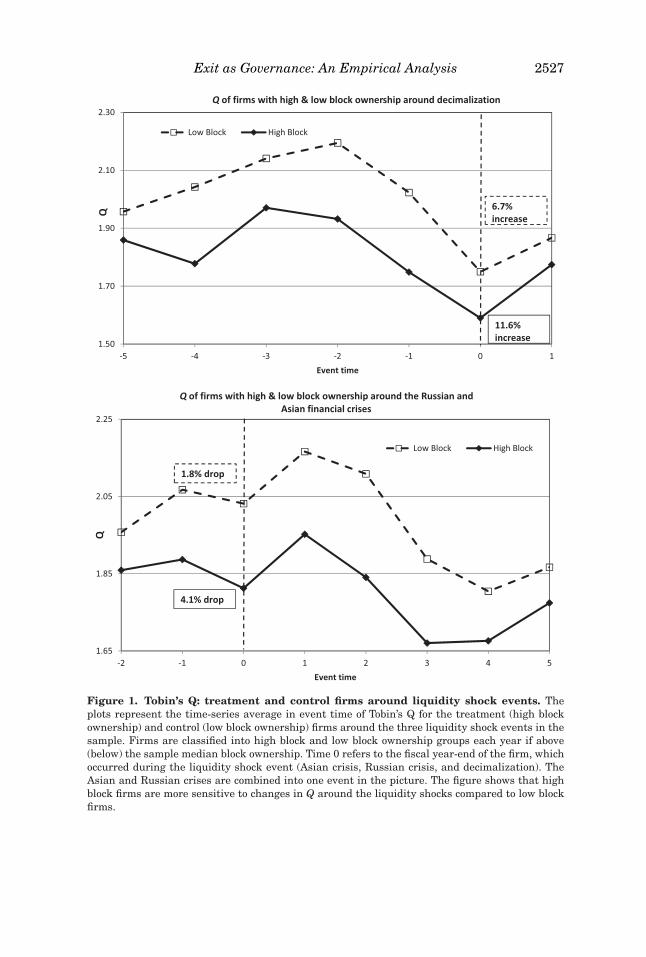
Figure 1 provides a parallel trends graph by plotting the behavior of Q forhigh block ownership firms and low block ownership firms in event time forboth the crises and decimalization. The goal of a parallel trends graph is tovisually show that postevent relationships between variables are not a contin-uation of their pre-event trends. Figure 1 suggests that Q of the high blockownership firms suffers more from the crises, and benefits more from decimal-ization, as predicted. These shocks to Q do not appear (at least visually) to bethe continuation of a time trend. Therefore, we have some confidence in assert-ing that the impact of the crises and decimalization events on Q are causal, asopposed to an ongoing temporal phenomenon.13
We supplement the univariate analysis in Figure 1 with panel data regres-sions that use Q as the dependent variable and block ownership measures aswell as various interaction terms as regressors. Following Himmelberg, Hub-bard, and Palia (1999), these specifications use firm-fixed effects to differenceout the unobservable, time-invariant firm-specific characteristics (i.e., all ouranalyses are “within-firm”). In addition, we use year-fixed effects and compute
11 This result is consistent with Holderness (2009), who argues that ownership patterns in theUnited States are not as diffused as is commonly believed.
12 Our hand-collection procedure for 2002 yielded fewer observations than in 2001. However,the 2002 means are statistically no different from the 2001 values; our hand-collected 2002 dataare thus comparable with the 1996 to 2001 Dlugosz et al. (2006) data set.
13 Although Figure 1 is in event time, we have plotted the data for the full duration of thesample. The event date is therefore not at the center of the graph as the crisis events occurredin the first half of the sample and decimalization in the second half. In the crisis figure, period 0represents a period of time corresponding to the Russian and Asian crises and thus shows a declinein Q by period 0. In the decimalization picture period 0 is the date of decimalization and hence thefirst year after decimalization shows an increase in Q. A t-test for the difference in pre-event timetrends between the low and high block groups is insignificant for all the three natural experiments.The t-statistics are 1.10, 0.58, and 1.23, respectively, for the Russian, Asian, and decimalizationexperiments.
Exit as Governance: An Empirical Analysis 2527
Figure 1. Tobin’s Q: treatment and control firms around liquidity shock events. Theplots represent the time-series average in event time of Tobin’s Q for the treatment (high blockownership) and control (low block ownership) firms around the three liquidity shock events in thesample. Firms are classified into high block and low block ownership groups each year if above(below) the sample median block ownership. Time 0 refers to the fiscal year-end of the firm, whichoccurred during the liquidity shock event (Asian crisis, Russian crisis, and decimalization). TheAsian and Russian crises are combined into one event in the picture. The figure shows that highblock firms are more sensitive to changes in Q around the liquidity shocks compared to low blockfirms.
2528 The Journal of Finance R©
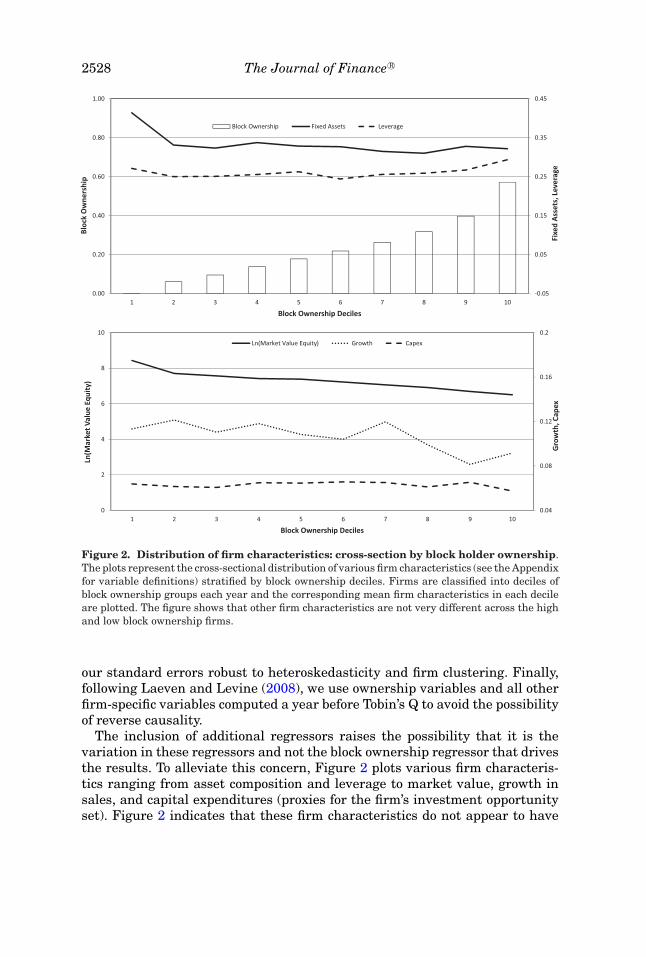
Figure 2. Distribution of firm characteristics: cross-section by block holder ownership.The plots represent the cross-sectional distribution of various firm characteristics (see the Appendixfor variable definitions) stratified by block ownership deciles. Firms are classified into deciles ofblock ownership groups each year and the corresponding mean firm characteristics in each decileare plotted. The figure shows that other firm characteristics are not very different across the highand low block ownership firms.
our standard errors robust to heteroskedasticity and firm clustering. Finally,following Laeven and Levine (2008), we use ownership variables and all otherfirm-specific variables computed a year before Tobin’s Q to avoid the possibilityof reverse causality.
The inclusion of additional regressors raises the possibility that it is thevariation in these regressors and not the block ownership regressor that drivesthe results. To alleviate this concern, Figure 2 plots various firm characteris-tics ranging from asset composition and leverage to market value, growth insales, and capital expenditures (proxies for the firm’s investment opportunityset). Figure 2 indicates that these firm characteristics do not appear to have

Exit as Governance: An Empirical Analysis 2529
clear trends across the block ownership deciles, providing more confidence inattributing our results to the block ownership factor.14
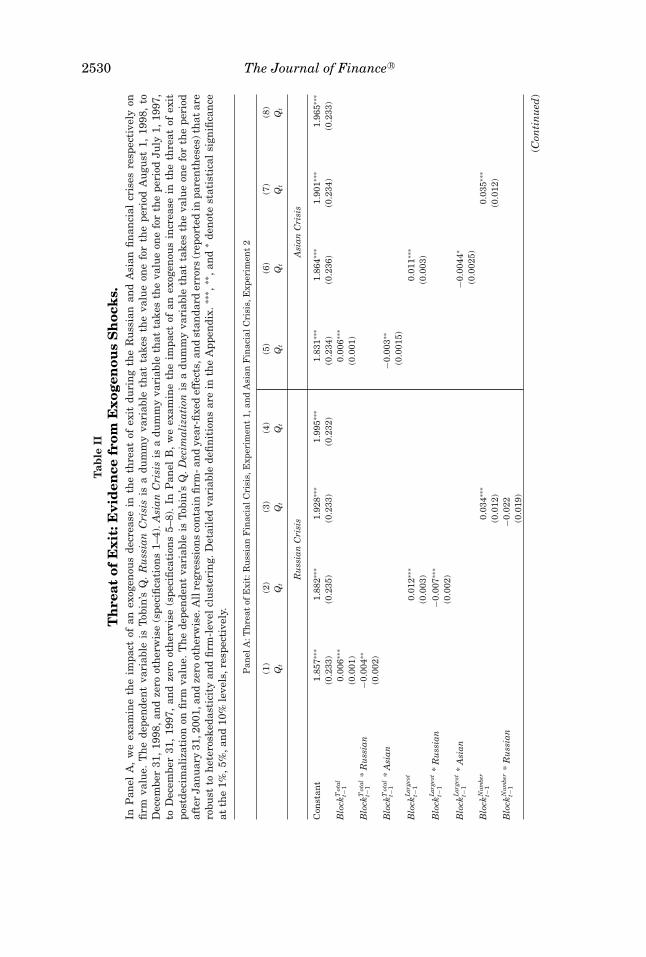
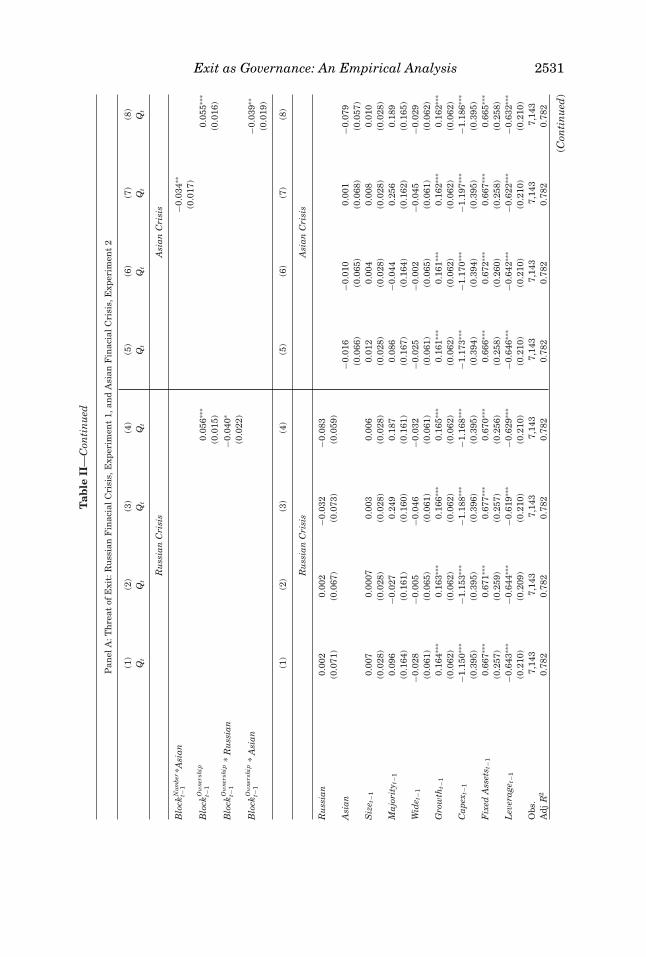
We now turn to our multivariate regressions. We define Russian and Asian asindicator variables denoting the Russian default crisis and the Asian financialcrisis, respectively. In particular, Russian is set to one for fiscal year-endsbetween August 1998 and December 1998, while Asian takes the value of onefor fiscal year-ends between July 1997 and December 1997. Table II, Panel A,indicates that the periods during the two crises saw a significantly weakenedassociation between block ownership and firm value, as predicted. In seven outof our eight specifications, the interaction term Block * Crisis is negative andsignificant at the 10% level or better, with the only insignificant result (thoughof the correct sign) being the number of blockholders for the Russian crisis. Theeconomic magnitude is also large, with a one standard deviation increase intotal block ownership corresponding to a decrease in Q of about 0.05 in the Asiancrisis and about 0.07 in the Russian crisis. These are economically large effectsof about 3.5% and 4.7% of the median Q, given the sample median (σ ) value of1.4 (1.4). We also include the level of block ownership in all our specificationsto control for the direct effect as well, which is positive.
In interpreting the regression in Table II, Panel A, our maintained assump-tion is that crises are exogenous shocks to liquidity and not to the overallstructural model of block ownership. Consistent with this assumption, we findno significant changes in block ownership measures around the Russian andAsian crises. Overall, the force of the interactive effect comes from the exoge-nous liquidity shock. Also note the presence of firm-fixed effects, which implythat the results represent the cross-sectional average of “within-firm” impactwhen the crises hit. While all further results in the paper continue to holdfor all four blockholder measures and the two crisis experiments, for brevitywe report all subsequent tests using the total block ownership measure and acombined crisis indicator for both the Russian and the Asian financial crises.
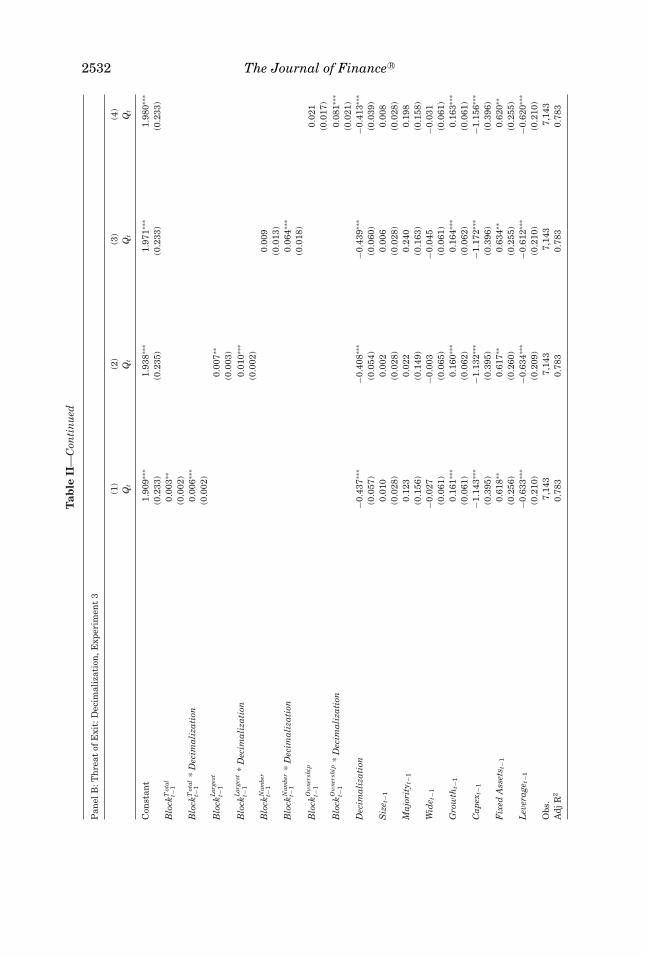
We define Decimalization as an indicator variable that takes the value of onefor firm-years with fiscal year-ends after January 2001. The decimalizationtests are in Table II, Panel B.15 We find that, for all four measures of blockownership, the relation between block ownership and firm value is significantlymore pronounced in the postdecimalization period (the interaction term Block* Decimalization is positive and significant at the 1% level or better in allfour specifications). The economic magnitude is also large, with a one standarddeviation increase in total block ownership corresponding to an increase inQ of about 0.10. This is an economically large effect of about 7.1%, given Q’ssample median (σ ) 1.4 (1.4). In all further tests in the paper we continue to
14 The Internet Appendix tabulates the distribution of various firm attributes for the high blockownership and low block ownership subsamples. The Internet Appendix may be found in the onlineversion of this article.
15 Our decimalization regression specification drops the year-fixed effects for 2002. Our resultsare virtually identical when we drop both 2001 and 2002 fixed year effects. We retain the 2001fixed year effects to control for the Internet crash.
2530 The Journal of Finance R©
Tab
leII
Th
reat
ofE
xit:
Evi
den
cefr
omE
xoge
nou
sS
hoc
ks.
InP
anel
A,
we
exam
ine
the
impa
ctof
anex
ogen
ous
decr
ease
inth
eth
reat
ofex
itdu
rin
gth
eR
uss
ian
and
Asi
anfi
nan
cial
cris
esre
spec
tive
lyon
firm
valu
e.T
he
depe
nde
nt
vari
able
isTo
bin
’sQ
.R
uss
ian
Cri
sis
isa
dum
my
vari
able
that
take
sth
eva
lue
one
for
the
peri
odA
ugu
st1,
1998
,to
Dec
embe
r31
,199
8,an
dze
root
her
wis
e(s
peci
fica
tion
s1–
4).A
sian
Cri
sis
isa
dum
my
vari
able
that
take
sth
eva
lue
one
for
the
peri
odJu
ly1,
1997
,to
Dec
embe
r31
,19
97,
and
zero
oth
erw
ise
(spe
cifi
cati
ons
5–8)
.In
Pan
elB
,w
eex
amin
eth
eim
pact
ofan
exog
enou
sin
crea
sein
the
thre
atof
exit
post
deci
mal
izat
ion
onfi
rmva
lue.
Th
ede
pen
den
tva
riab
leis
Tobi
n’s
Q.D
ecim
aliz
atio
nis
adu
mm
yva
riab
leth
atta
kes
the
valu
eon
efo
rth
epe
riod
afte
rJa
nu
ary
31,2
001,
and
zero
oth
erw
ise.
All
regr
essi
ons
con
tain
firm
-an
dye
ar-fi
xed
effe
cts,
and
stan
dard
erro
rs(r
epor
ted
inpa
ren
thes
es)t
hat
are
robu
stto
het
eros
keda
stic
ity
and
firm
-lev
elcl
ust
erin
g.D
etai
led
vari
able
defi
nit
ion
sar
ein
the
App
endi
x.∗∗
∗ ,∗∗
,an
d∗
den
ote
stat
isti
cal
sign
ifica
nce
atth
e1%
,5%
,an
d10
%le
vels
,res
pect
ivel
y.
Pan
elA
:Th
reat
ofE
xit:
Ru
ssia
nF
inac
ialC
risi
s,E
xper
imen
t1,
and
Asi
anF
inac
ialC
risi
s,E
xper
imen
t2
(1)
(2)
(3)
(4)
(5)
(6)
(7)
(8)
Qt
Qt
Qt
Qt
Qt
Qt
Qt
Qt
Ru
ssia
nC
risi
sA
sian
Cri
sis
Con
stan
t1.
857∗∗
∗1.
882∗∗
∗1.
928∗∗
∗1.
995∗∗
∗1.
831∗∗
∗1.
864∗∗
∗1.
901∗∗
∗1.
965∗∗
∗
(0.2
33)
(0.2
35)
(0.2
33)
(0.2
32)
(0.2
34)
(0.2
36)
(0.2
34)
(0.2
33)
Blo
ckT
otal
t−1
0.00
6∗∗∗
0.00
6∗∗∗
(0.0
01)
(0.0
01)
Blo
ckT
otal
t−1
*R
uss
ian
−0.0
04∗∗
(0.0
02)
Blo
ckT
otal
t−1
*A
sian
−0.0
03∗∗
(0.0
015)
Blo
ckL
arge
stt−
10.
012∗∗
∗0.
011∗∗
∗
(0.0
03)
(0.0
03)
Blo
ckL
arge
stt−
1*
Ru
ssia
n−0
.007
∗∗∗
(0.0
02)
Blo
ckL
arge
stt−
1*
Asi
an−0
.004
4∗
(0.0
025)
Blo
ckN
umbe
rt−
10.
034∗∗
∗0.
035∗∗
∗
(0.0
12)
(0.0
12)
Blo
ckN
umbe
rt−
1*
Ru
ssia
n−0
.022
(0.0
19)
(Con
tin
ued
)
Exit as Governance: An Empirical Analysis 2531T
able
II—
Con
tin
ued
Pan
elA
:Th
reat
ofE
xit:
Ru
ssia
nF
inac
ialC
risi
s,E
xper
imen
t1,
and
Asi
anF
inac
ialC
risi
s,E
xper
imen
t2
(1)
(2)
(3)
(4)
(5)
(6)
(7)
(8)
Qt
Qt
Qt
Qt
Qt
Qt
Qt
Qt
Ru
ssia
nC
risi
sA
sian
Cri
sis
Blo
ckN
umbe
rt−
1*A
sian
−0.0
34∗∗
(0.0
17)
Blo
ckO
wne
rshi
pt−
10.
056∗∗
∗0.
055∗∗
∗
(0.0
15)
(0.0
16)
Blo
ckO
wne
rshi
pt−
1*
Ru
ssia
n−0
.040
∗
(0.0
22)
Blo
ckO
wne
rshi
pt−
1*
Asi
an−0
.039
∗∗
(0.0
19)
(1)
(2)
(3)
(4)
(5)
(6)
(7)
(8)
Ru
ssia
nC
risi
sA
sian
Cri
sis
Ru
ssia
n0.
002
0.00
2−0
.032
−0.0
83(0
.071
)(0
.067
)(0
.073
)(0
.059
)A
sian
−0.0
16−0
.010
0.00
1−0
.079
(0.0
66)
(0.0
65)
(0.0
68)
(0.0
57)
Siz
e t−1
0.00
70.
0007
0.00
30.
006
0.01
20.
004
0.00
80.
010
(0.0
28)
(0.0
28)
(0.0
28)
(0.0
28)
(0.0
28)
(0.0
28)
(0.0
28)
(0.0
28)
Maj
orit
y t−1
0.09
6−0
.027
0.24
90.
187
0.08
6−0
.044
0.25
60.
189
(0.1
64)
(0.1
61)
(0.1
60)
(0.1
61)
(0.1
67)
(0.1
64)
(0.1
62)
(0.1
65)
Wid
e t−1
−0.0
28−0
.005
−0.0
46−0
.032
−0.0
25−0
.002
−0.0
45−0
.029
(0.0
61)
(0.0
65)
(0.0
61)
(0.0
61)
(0.0
61)
(0.0
65)
(0.0
61)
(0.0
62)
Gro
wth
t−1
0.16
4∗∗∗
0.16
3∗∗∗
0.16
6∗∗∗
0.16
5∗∗∗
0.16
1∗∗∗
0.16
1∗∗∗
0.16
2∗∗∗
0.16
2∗∗∗
(0.0
62)
(0.0
62)
(0.0
62)
(0.0
62)
(0.0
62)
(0.0
62)
(0.0
62)
(0.0
62)
Cap
ext−
1−1
.150
∗∗∗
−1.1
53∗∗
∗−1
.188
∗∗∗
−1.1
68∗∗
∗−1
.173
∗∗∗
−1.1
70∗∗
∗−1
.197
∗∗∗
−1.1
86∗∗
∗
(0.3
95)
(0.3
95)
(0.3
96)
(0.3
95)
(0.3
94)
(0.3
94)
(0.3
95)
(0.3
95)
Fix
edA
sset
s t−1
0.66
7∗∗∗
0.67
1∗∗∗
0.67
7∗∗∗
0.67
0∗∗∗
0.66
6∗∗∗
0.67
2∗∗∗
0.66
7∗∗∗
0.66
5∗∗∗
(0.2
57)
(0.2
59)
(0.2
57)
(0.2
56)
(0.2
58)
(0.2
60)
(0.2
58)
(0.2
58)
Lev
erag
e t−1
−0.6
43∗∗
∗−0
.644
∗∗∗
−0.6
19∗∗
∗−0
.629
∗∗∗
−0.6
46∗∗
∗−0
.642
∗∗∗
−0.6
22∗∗
∗−0
.632
∗∗∗
(0.2
10)
(0.2
09)
(0.2
10)
(0.2
10)
(0.2
10)
(0.2
10)
(0.2
10)
(0.2
10)
Obs
.7,
143
7,14
37,
143
7,14
37,
143
7,14
37,
143
7,14
3A
djR
20.
782
0.78
20.
782
0.78
20.
782
0.78
20.
782
0.78
2
(Con
tin
ued
)
2532 The Journal of Finance R©T
able
II—
Con
tin
ued
Pan
elB
:Th
reat
ofE
xit:
Dec
imal
izat
ion
,Exp
erim
ent
3
(1)
(2)
(3)
(4)
Qt
Qt
Qt
Qt
Con
stan
t1.
909∗∗
∗1.
938∗∗
∗1.
971∗∗
∗1.
980∗∗
∗
(0.2
33)
(0.2
35)
(0.2
33)
(0.2
33)
Blo
ckT
otal
t−1
0.00
3∗∗
(0.0
02)
Blo
ckT
otal
t−1
*D
ecim
aliz
atio
n0.
006∗∗
∗
(0.0
02)
Blo
ckL
arge
stt−
10.
007∗∗
(0.0
03)
Blo
ckL
arge
stt−
1*
Dec
imal
izat
ion
0.01
0∗∗∗
(0.0
02)
Blo
ckN
umbe
rt−
10.
009
(0.0
13)
Blo
ckN
umbe
rt−
1*
Dec
imal
izat
ion
0.06
4∗∗∗
(0.0
18)
Blo
ckO
wne
rshi
pt−
10.
021
(0.0
17)
Blo
ckO
wne
rshi
pt−
1*
Dec
imal
izat
ion
0.08
1∗∗∗
(0.0
21)
Dec
imal
izat
ion
−0.4
37∗∗
∗−0
.408
∗∗∗
−0.4
39∗∗
∗−0
.413
∗∗∗
(0.0
57)
(0.0
54)
(0.0
60)
(0.0
39)
Siz
e t−1
0.01
00.
002
0.00
60.
008
(0.0
28)
(0.0
28)
(0.0
28)
(0.0
28)
Maj
orit
y t−1
0.12
30.
022
0.24
00.
198
(0.1
56)
(0.1
49)
(0.1
63)
(0.1
58)
Wid
e t−1
−0.0
27−0
.003
−0.0
45−0
.031
(0.0
61)
(0.0
65)
(0.0
61)
(0.0
61)
Gro
wth
t−1
0.16
1∗∗∗
0.16
0∗∗∗
0.16
4∗∗∗
0.16
3∗∗∗
(0.0
61)
(0.0
62)
(0.0
62)
(0.0
61)
Cap
ext−
1−1
.143
∗∗∗
−1.1
32∗∗
∗−1
.172
∗∗∗
−1.1
56∗∗
∗
(0.3
95)
(0.3
95)
(0.3
96)
(0.3
96)
Fix
edA
sset
s t−1
0.61
8∗∗0.
617∗∗
0.63
4∗∗0.
620∗∗
(0.2
56)
(0.2
60)
(0.2
55)
(0.2
55)
Lev
erag
e t−1
−0.6
33∗∗
∗−0
.634
∗∗∗
−0.6
12∗∗
∗−0
.620
∗∗∗
(0.2
10)
(0.2
09)
(0.2
10)
(0.2
10)
Obs
.7,
143
7,14
37,
143
7,14
3A
djR
20.
783
0.78
30.
783
0.78
3
Exit as Governance: An Empirical Analysis 2533
include all the control variables used in Table II, but do not report them forbrevity.
We next estimate a regression similar to Table II, with the key differencebeing that we interact the four block ownership measures with the firm’s liq-uidity measure for the current fiscal period. The liquidity measure is the logof the negative of the Amihud (2002) illiquidity measure. This specification isthus a nonevent, steady-state panel regression, where the assumption is thatliquidity in the current period is blockholders’ expectation for future liquidity,and identification occurs through firm-fixed effects. The results (in the InternetAppendix) indicate that the interactions between measures of block ownershipand liquidity are highly significant at the 1% level, suggesting that the impactof block holdings on firm value is significantly higher when blockholders’ ex-pectations of liquidity are higher. We rerun the panel analysis with alternateliquidity measures such as the negative log of the bid–ask spread and the logof share turnover (annual average daily trading volume scaled by the numberof shares outstanding), and find equally significant results. However, we donot pursue this nonevent estimation technique any further because of omittedvariable-related identification concerns.
Finally, a potential issue with a dummy variable instrument (e.g., a crisisor a decimalization event) is that the dummy could be picking up other thingsthat happened at the time of the event that are unrelated to liquidity. Oneway to address this concern is to use the actual change in liquidity at thetime of the event, to ensure that we are capturing changes in liquidity ratherthan anything else that was changing at the time.16 We extend the regressionspecification of Table II by sorting firms based on ex post liquidity changesaround the liquidity shocks. In results reported in the Internet Appendix, wefind that, during the crisis periods, the impact of blockholdings on Q declinedsignificantly more for those firms whose liquidity decreased. Reassuringly, thedecimalization event produces the opposite result, with the impact of block-holdings on Q significantly more for those firms whose liquidity increased. Wealso find that the effect of both the crises and decimalization is significantlymore pronounced for smaller firms, which are presumably more likely to besusceptible to market-wide liquidity shocks (see the Internet Appendix). Theseresults provide additional evidence in support of the operating strength of exitthreats.
A. Falsification Tests
The results in Table II strongly indicate that the threat of exit is a pow-erful governance mechanism available to blockholders. However, one concernis that the change in the relationship between Q and blockholdings after theshock could be the continuation of a pre-existing trend rather than an effectcaused by the shock (e.g., it could be the case that the link between Q and
16 The identifying assumption is that the change in liquidity is driven entirely by the event. Seeequation (3) in Fang, Noe, and Tice (2009).
2534 The Journal of Finance R©
blockholdings rose over time because blockholders became more effective atgovernance, rather than because of a liquidity effect). While the parallel trendsgraph in Figure 1 and the year-fixed effects in the regressions partly alleviatethis concern, we supplement this analysis with falsification tests to hone in onthe shock itself.
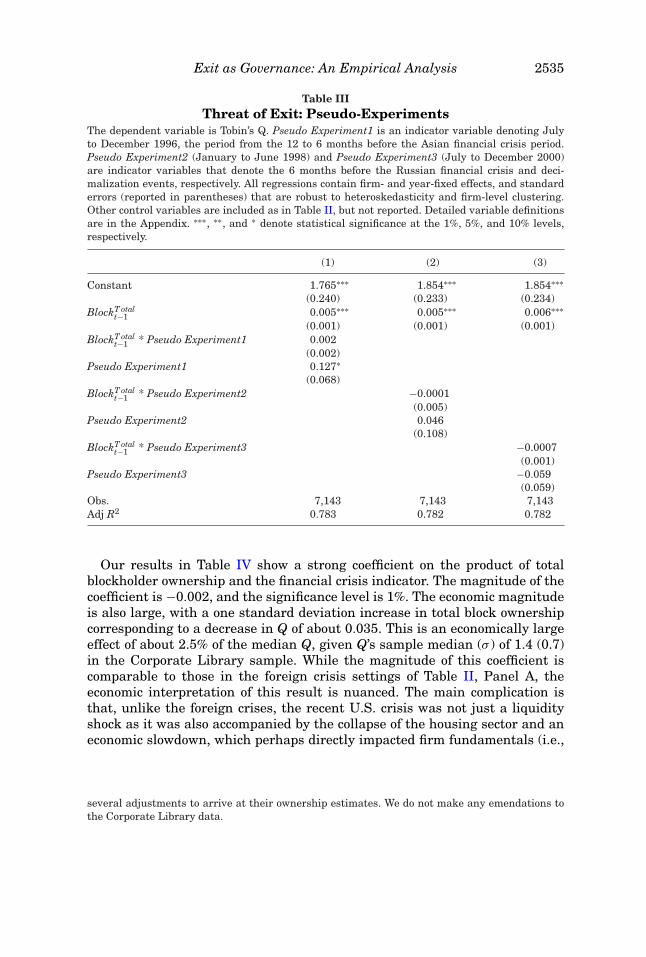
Specifically, we create pseudo-shock periods prior to the actual shocks and ex-amine whether the relation between block ownership and firm value changessubstantially during these periods. We define three indicator variables rep-resenting the 6-month periods prior to decimalization and the Russian cri-sis, and the 12–6 months prior to the Asian crisis. We do not pick Januaryto June 1997, the 6-month period immediately prior to the Asian crisis, be-cause Amex moved to 1/16th tick size in May 1997 and NYSE and NAS-DAQ switched in June 1997, and these liquidity shocks could contaminate ourresults.17
We examine how the association between firm value and total block own-ership changes during these pseudo-shock periods. Given the placebo na-ture of this test, we do not expect to find significant results. The results, inTable III, show that the coefficients on all three interaction terms betweenblock ownership and the pseudo-shocks are insignificant, suggesting no dif-ference in the relation between total block ownership and firm value betweenregular periods and pseudo-shock periods. These falsification tests, combinedwith the univariate analyses in Figures 1 and 2 and the multivariate analysesin Table II, indicate that our three original events capture exogenous shocks tostock liquidity and are not mere manifestations of time trends in stock liquidityor other spurious temporal factors.
We also conduct more placebo tests by defining pseudo-experiments usingeven earlier periods. The results, reported in the Internet Appendix, are againinsignificant, providing further assurance that our principal findings indeedrepresent the effect of exogenous liquidity shocks and not a continuing timetrend.18
B. Other Liquidity Events
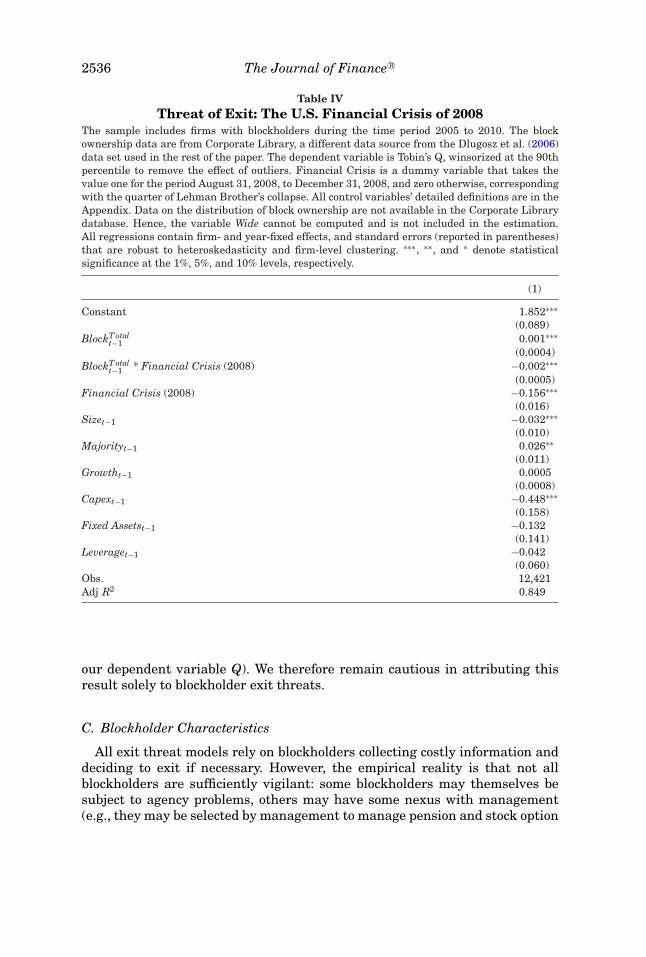
We first replicate the specification of Table II for the recent U.S. financialcrisis. We denote the liquidity crisis period as September 2008 to Decem-ber 2008, the quarter of Lehman’s collapse. Our sample period for this set-ting covers 2005 through 2010. We limit our sample to firms with blockhold-ers and obtain blockholder data from the Corporate Library database. TheCorporate Library’s extended coverage results in a sample of 12,421 firm-yearobservations.19
17 Our results, however, are the same if we use the 6-month period prior to the Asian crisis.18 Also note that our original shocks are spread over time. Therefore, periods further away from
one of our original shocks are likely to cross another original shock. The Internet Appendix containsfurther details.
19 The Corporate Library data do not extend as far back as the time period of Table II, whichis why that table uses data from Dlugosz et al. (2006). In addition, Dlugosz et al. (2006) make
Exit as Governance: An Empirical Analysis 2535
Table IIIThreat of Exit: Pseudo-Experiments
The dependent variable is Tobin’s Q. Pseudo Experiment1 is an indicator variable denoting Julyto December 1996, the period from the 12 to 6 months before the Asian financial crisis period.Pseudo Experiment2 (January to June 1998) and Pseudo Experiment3 (July to December 2000)are indicator variables that denote the 6 months before the Russian financial crisis and deci-malization events, respectively. All regressions contain firm- and year-fixed effects, and standarderrors (reported in parentheses) that are robust to heteroskedasticity and firm-level clustering.Other control variables are included as in Table II, but not reported. Detailed variable definitionsare in the Appendix. ∗∗∗, ∗∗, and ∗ denote statistical significance at the 1%, 5%, and 10% levels,respectively.
(1) (2) (3)
Constant 1.765∗∗∗ 1.854∗∗∗ 1.854∗∗∗(0.240) (0.233) (0.234)
BlockT otalt−1 0.005∗∗∗ 0.005∗∗∗ 0.006∗∗∗
(0.001) (0.001) (0.001)BlockT otal
t−1 * Pseudo Experiment1 0.002(0.002)
Pseudo Experiment1 0.127∗(0.068)
BlockT otalt−1 * Pseudo Experiment2 −0.0001
(0.005)Pseudo Experiment2 0.046
(0.108)BlockT otal
t−1 * Pseudo Experiment3 −0.0007(0.001)
Pseudo Experiment3 −0.059(0.059)
Obs. 7,143 7,143 7,143Adj R2 0.783 0.782 0.782
Our results in Table IV show a strong coefficient on the product of totalblockholder ownership and the financial crisis indicator. The magnitude of thecoefficient is −0.002, and the significance level is 1%. The economic magnitudeis also large, with a one standard deviation increase in total block ownershipcorresponding to a decrease in Q of about 0.035. This is an economically largeeffect of about 2.5% of the median Q, given Q’s sample median (σ ) of 1.4 (0.7)in the Corporate Library sample. While the magnitude of this coefficient iscomparable to those in the foreign crisis settings of Table II, Panel A, theeconomic interpretation of this result is nuanced. The main complication isthat, unlike the foreign crises, the recent U.S. crisis was not just a liquidityshock as it was also accompanied by the collapse of the housing sector and aneconomic slowdown, which perhaps directly impacted firm fundamentals (i.e.,
several adjustments to arrive at their ownership estimates. We do not make any emendations tothe Corporate Library data.
2536 The Journal of Finance R©
Table IVThreat of Exit: The U.S. Financial Crisis of 2008
The sample includes firms with blockholders during the time period 2005 to 2010. The blockownership data are from Corporate Library, a different data source from the Dlugosz et al. (2006)data set used in the rest of the paper. The dependent variable is Tobin’s Q, winsorized at the 90thpercentile to remove the effect of outliers. Financial Crisis is a dummy variable that takes thevalue one for the period August 31, 2008, to December 31, 2008, and zero otherwise, correspondingwith the quarter of Lehman Brother’s collapse. All control variables’ detailed definitions are in theAppendix. Data on the distribution of block ownership are not available in the Corporate Librarydatabase. Hence, the variable Wide cannot be computed and is not included in the estimation.All regressions contain firm- and year-fixed effects, and standard errors (reported in parentheses)that are robust to heteroskedasticity and firm-level clustering. ∗∗∗, ∗∗, and ∗ denote statisticalsignificance at the 1%, 5%, and 10% levels, respectively.
(1)
Constant 1.852∗∗∗(0.089)
BlockT otalt−1 0.001∗∗∗
(0.0004)BlockT otal
t−1 * Financial Crisis (2008) −0.002∗∗∗
(0.0005)Financial Crisis (2008) −0.156∗∗∗
(0.016)Sizet−1 −0.032∗∗∗
(0.010)Majorityt−1 0.026∗∗
(0.011)Growtht−1 0.0005
(0.0008)Capext−1 −0.448∗∗∗
(0.158)Fixed Assetst−1 −0.132
(0.141)Leveraget−1 −0.042
(0.060)Obs. 12,421Adj R2 0.849
our dependent variable Q). We therefore remain cautious in attributing thisresult solely to blockholder exit threats.
C. Blockholder Characteristics
All exit threat models rely on blockholders collecting costly information anddeciding to exit if necessary. However, the empirical reality is that not allblockholders are sufficiently vigilant: some blockholders may themselves besubject to agency problems, others may have some nexus with management(e.g., they may be selected by management to manage pension and stock option
Exit as Governance: An Empirical Analysis 2537
plans), and yet others may be passive. It is therefore instructive to see whichcategory of blockholders primarily drives our findings.
It is a difficult task for an empirical researcher to unambiguously measureblockholder intent and vigilance. For example, blockholders have to disclosetheir ownership intent in item 4 of Schedule 13-D filings. However, any suchtextual disclosure is open to ambiguity and multiple interpretations, and stud-ies that use these filings have had to exercise significant judgment in classifyingintent (e.g., Brav et al. (2008, Section II)). We therefore do not interpret theSchedule 13-D filings explicitly, but simply partition our (nonofficer) blockhold-ers into the following two mutually exclusive categories: (i) those who manageemployee stock option plans (ESOP) or are directors, and (ii) those who areoutsiders, and other categories.
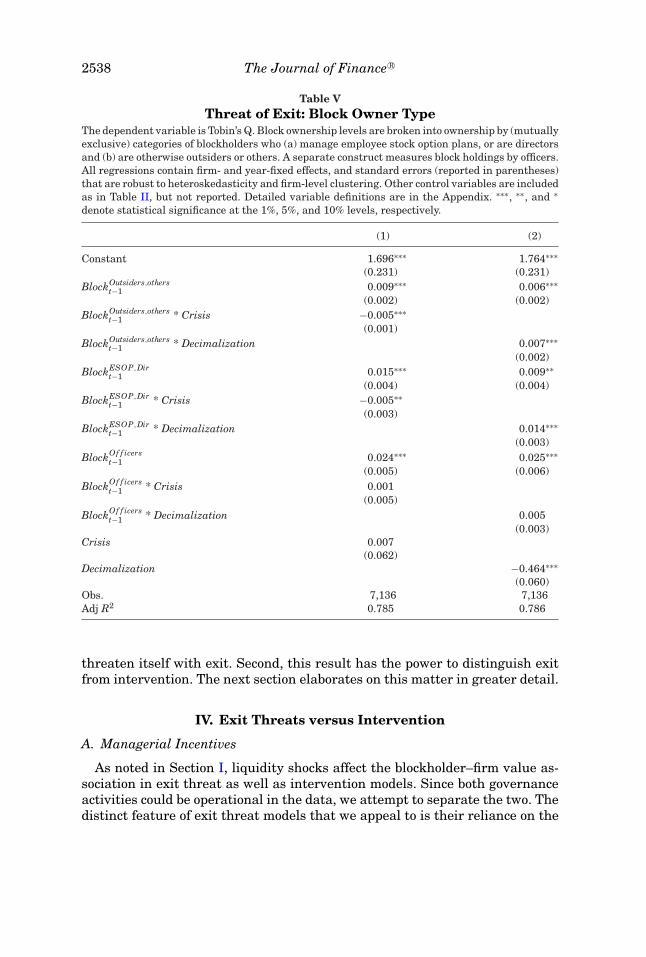
Table V provides the results based on blockholder type. We find that exoge-nous liquidity shocks significantly impact (in the right direction) the associationbetween firm value and both categories of blockholders, that is, outsider anddirector/ESOP blockholders. In other words, both types of blockholders exertsignificant exit threat on the firm. The lack of behavioral variation across theseblockholder types is consistent with Davis and Kim (2007), who find that mu-tual funds’ nexus with management through pension plans only rarely makethese funds acquiescent to management decisions. That is, client relationshipsdo not significantly matter for blockholder governance activities. Similarly,prior research also shows that directors are not always acquiescent and on oc-casions oppose management (e.g., Agrawal and Chen (2010)). Table V indicatesthat directors are also willing to engage in exit threats.
Table V also speaks to an important aspect of exit threat theories. Admatiand Pfleiderer (2009) note that the efficacy of exit threats in their model de-pends crucially on there being a low ex ante probability of the blockholderselling for personal reasons: in that case, blockholder exit is more informativeto the market, and the exit threat commensurately more powerful. The authorssuggest that an empirical measure of ex ante blockholder longevity would beuseful for testing their theories. Ex post blockholder longevity may not be agood indicator of ex ante intent, because ex post longevity depends both on theblockholder’s liquidity shock and actual firm performance. Table V suggests analternative way of classifying blockholder intent to stay with the firm: ESOPand directors are likely to have an ex ante interest in staying with the firm,unlike, for example, fund manager blockholders who are subject to short-termflows (Dasgupta and Piacentino (2012)). The significant results in Table V fordirector/ESOP blockholders further bolsters an exit threat interpretation ofour findings.20
Finally, the officer–block ownership interaction term is insignificant. Thisresult is important on two counts. First, it further supports exit threat theoriesbecause, barring some serious internal discord, management is unlikely to
20 Blockholders such as index funds also have ex ante longevity intent. Data collection costs forour sample period preclude analysis of these blockholders.
2538 The Journal of Finance R©
Table VThreat of Exit: Block Owner Type
The dependent variable is Tobin’s Q. Block ownership levels are broken into ownership by (mutuallyexclusive) categories of blockholders who (a) manage employee stock option plans, or are directorsand (b) are otherwise outsiders or others. A separate construct measures block holdings by officers.All regressions contain firm- and year-fixed effects, and standard errors (reported in parentheses)that are robust to heteroskedasticity and firm-level clustering. Other control variables are includedas in Table II, but not reported. Detailed variable definitions are in the Appendix. ∗∗∗, ∗∗, and ∗denote statistical significance at the 1%, 5%, and 10% levels, respectively.
(1) (2)
Constant 1.696∗∗∗ 1.764∗∗∗(0.231) (0.231)
BlockOutsiders,otherst−1 0.009∗∗∗ 0.006∗∗∗
(0.002) (0.002)BlockOutsiders,others
t−1 * Crisis −0.005∗∗∗
(0.001)BlockOutsiders,others
t−1 * Decimalization 0.007∗∗∗
(0.002)BlockESOP,Dir
t−1 0.015∗∗∗ 0.009∗∗
(0.004) (0.004)BlockESOP,Dir
t−1 * Crisis −0.005∗∗
(0.003)BlockESOP,Dir
t−1 * Decimalization 0.014∗∗∗
(0.003)BlockOf f icers
t−1 0.024∗∗∗ 0.025∗∗∗
(0.005) (0.006)BlockOf f icers
t−1 * Crisis 0.001(0.005)
BlockOf f icerst−1 * Decimalization 0.005
(0.003)Crisis 0.007
(0.062)Decimalization −0.464∗∗∗
(0.060)Obs. 7,136 7,136Adj R2 0.785 0.786
threaten itself with exit. Second, this result has the power to distinguish exitfrom intervention. The next section elaborates on this matter in greater detail.
IV. Exit Threats versus Intervention
A. Managerial Incentives
As noted in Section I, liquidity shocks affect the blockholder–firm value as-sociation in exit threat as well as intervention models. Since both governanceactivities could be operational in the data, we attempt to separate the two. Thedistinct feature of exit threat models that we appeal to is their reliance on the

Exit as Governance: An Empirical Analysis 2539
manager’s interest in the firm’s stock price. We test this feature by examiningwhether our main results are more pronounced for firms whose managementhas a higher interest in the firm’s stock price.
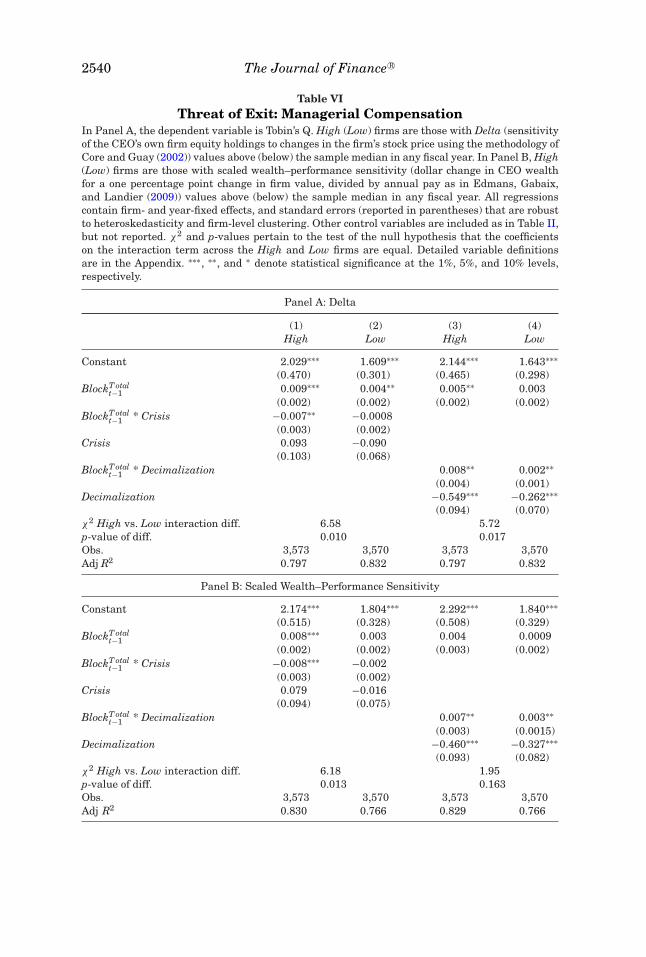
To compute management’s sensitivity to the stock price, we estimate thesensitivity of the dollar value of the CEO’s equity portfolio to a dollar changein the stock price (Delta), using the methodology in Core and Guay (2002). Wethen split the sample into two groups based on the median Delta in each fiscalyear.21 Observations with Delta above the median are called the High group,while those below form the Low Group. Based on exit threat theory, we expectthe impact of the crises and decimalization on the association between firmvalue and block ownership to be stronger in the High group than in the Lowgroup.
Table VI, Panel A, presents the results. While we report these results usingthe total block ownership measure for brevity, results are similar using theother three measures. Each set of columns presents the results first for thehigh Delta group (High) and then for the low Delta group (Low). As predicted,the crises have a much stronger impact on the relationship between blockownership and Q for firms whose management has a larger exposure to stockprice. The test for the difference between the coefficients on the interactionterm across the two groups during the crises is significant with a p-valueof 0.01. The economic magnitudes are also substantially different, with thehigh Delta group reporting an interaction effect almost nine times larger thanthe low Delta group. In the case of decimalization, the high Delta group hasan interaction effect almost four times larger than the low Delta group, thedifference being significant at a p-value of 0.017.
In tests reported in the Internet Appendix, we confirm the stability of thefindings by changing the binary High–Low Delta specification with the originallinear specification on the entire sample combined with an additional tripleinteraction regressor of block ownership times the crisis indicator times Delta.22
The triple interaction term is significantly negative for the crises at the 1%level and significantly positive for the decimalization setting at the 5% level,attesting to the empirical robustness of the management compensation effect.
Edmans, Gabaix, and Landier (2009) point out that existing measures ofmanagerial incentives are strongly related to firm size. They compute a mea-sure called “scaled-wealth-performance sensitivity,” which is defined as thedollar change in CEO wealth for a one percentage point change in firm value,divided by annual pay. We examine the robustness of our inferences to the useof the Edmans, Gabaix, and Landier (2009) measure.23 The results in Table VI,Panel B, are similar to those in Panel A, with the impact of the crises on thehigh incentives group now four times the impact on the low incentives group.
21 Some of our sample firms have no option data on Execucomp. We checked their 10-K filings toensure that they indeed had minimal option issuances. For these firms, as suggested by Core andGuay (2002), we estimated sensitivity to performance based on executive share ownership data.
22 We include all the relevant double interaction terms and also Delta as control variables.23 The data are available at http://finance.wharton.upenn.edu/aedmans/data.html.
2540 The Journal of Finance R©
Table VIThreat of Exit: Managerial Compensation
In Panel A, the dependent variable is Tobin’s Q. High (Low) firms are those with Delta (sensitivityof the CEO’s own firm equity holdings to changes in the firm’s stock price using the methodology ofCore and Guay (2002)) values above (below) the sample median in any fiscal year. In Panel B, High(Low) firms are those with scaled wealth–performance sensitivity (dollar change in CEO wealthfor a one percentage point change in firm value, divided by annual pay as in Edmans, Gabaix,and Landier (2009)) values above (below) the sample median in any fiscal year. All regressionscontain firm- and year-fixed effects, and standard errors (reported in parentheses) that are robustto heteroskedasticity and firm-level clustering. Other control variables are included as in Table II,but not reported. χ2 and p-values pertain to the test of the null hypothesis that the coefficientson the interaction term across the High and Low firms are equal. Detailed variable definitionsare in the Appendix. ∗∗∗, ∗∗, and ∗ denote statistical significance at the 1%, 5%, and 10% levels,respectively.
Panel A: Delta
(1) (2) (3) (4)High Low High Low
Constant 2.029∗∗∗ 1.609∗∗∗ 2.144∗∗∗ 1.643∗∗∗(0.470) (0.301) (0.465) (0.298)
BlockT otalt−1 0.009∗∗∗ 0.004∗∗ 0.005∗∗ 0.003
(0.002) (0.002) (0.002) (0.002)BlockT otal
t−1 * Crisis −0.007∗∗ −0.0008(0.003) (0.002)
Crisis 0.093 −0.090(0.103) (0.068)
BlockT otalt−1 * Decimalization 0.008∗∗ 0.002∗∗
(0.004) (0.001)Decimalization −0.549∗∗∗ −0.262∗∗∗
(0.094) (0.070)χ2 High vs. Low interaction diff. 6.58 5.72p-value of diff. 0.010 0.017Obs. 3,573 3,570 3,573 3,570Adj R2 0.797 0.832 0.797 0.832
Panel B: Scaled Wealth–Performance Sensitivity
Constant 2.174∗∗∗ 1.804∗∗∗ 2.292∗∗∗ 1.840∗∗∗(0.515) (0.328) (0.508) (0.329)
BlockT otalt−1 0.008∗∗∗ 0.003 0.004 0.0009
(0.002) (0.002) (0.003) (0.002)BlockT otal
t−1 * Crisis −0.008∗∗∗ −0.002(0.003) (0.002)
Crisis 0.079 −0.016(0.094) (0.075)
BlockT otalt−1 * Decimalization 0.007∗∗ 0.003∗∗
(0.003) (0.0015)Decimalization −0.460∗∗∗ −0.327∗∗∗
(0.093) (0.082)χ2 High vs. Low interaction diff. 6.18 1.95p-value of diff. 0.013 0.163Obs. 3,573 3,570 3,573 3,570Adj R2 0.830 0.766 0.829 0.766
Exit as Governance: An Empirical Analysis 2541
Similar differences in results across the two subsamples obtain for the decimal-ization event as well, albeit with weaker statistical significance. In sum, exitthreats are significantly more effective when management has strong equityinterests.
B. Equity Exposure as a Proxy for Management Control
The standard method of computing management’s interest in the stock priceuses management’s equity exposure. However, equity also confers control rightsto management, which it might use to thwart intervention (Stulz (1988)). So,management equity holdings could proxy for the likelihood of blockholder in-tervention via takeover and other threats. In addition, Brav et al.’s (2008)Table III indicates that their sample of firms targeted for intervention by hedgefunds had higher liquidity than a matched control sample. So one could arguethat our results in the previous section may be driven by an increase (decrease)in intervention activities following liquidity increases (decreases).
The theoretical analysis of Edmans (2009) indicates that the interactionbetween control and exit threats can be very subtle. We abstract from thesenuances, and model control as arising from the level of management’s owner-ship stake. Prior literature has not converged on the precise ownership levelthreshold at which management gains control; we simply use the 5% cutoff.If control considerations are indeed salient to our sample, the interaction be-tween management block ownership and liquidity shocks should be significantin Table V. This, however, is not the case; the interaction term between officerownership and liquidity shocks is insignificant in Table V. On the other hand,this insignificance is consistent with exit threat models because managementis unlikely to threaten itself with exit.24 To investigate this point further, werecompute Delta for just the annual option grants. These grants, while likelycorrelated with managerial ownership, should have no immediate control con-siderations and hence should be insignificant under the intervention view. Ofcourse, to the extent that these grants do impact management sensitivity tostock price, they should be significant under the exit threat view. The results,reported in the Internet Appendix, show significance. The results in Table VIare thus likely driven by exit threat, not control considerations.
C. Managerial Entrenchment
We attempt to further differentiate exit threat models from interventionmodels. Because blockholder intervention activities comprise many activities,we try to measure the opposite, namely, management’s power to resist theseactivities. Specifically, we measure management entrenchment using the En-trenchment index (E-index) of Bebchuk, Cohen, and Ferrell (2009). This in-dex is based on six provisions: staggered boards, limits to shareholder bylaw
24 The power of the test is always a concern in such situations. However, note that the Delta ofmanagement’s equity exposure is highly significant in Table VI.
2542 The Journal of Finance R©
amendments, poison pills, golden parachutes, super-majority requirements formergers, and charter amendments. Bebchuk, Cohen, and Ferrell (2009) doc-ument that firms with higher E-index scores receive lower valuations, whichthe authors interpret as evidence of governance failures in such firms. TheE-index score thus likely represents a higher degree of management immunityto blockholder intervention activities.
We recognize that blockholders could be engaging in intervention in bothhigh-entrenchment and low-entrenchment firms.25 If we assume that inter-vention activities are less successful on average in a large-sample cross-sectionof high-entrenchment firms, we should see a relatively weaker impact in suchfirms. On the other hand, exit threat models are likely to hold even amongfirms that have high E-indices—the exit threat stems from the manager’s ex-posure to the stock price, and an entrenched manager could still have such anexposure.
As in Table VI, we split our sample into two groups defining Low E (HighE) firms as firms below- (above-) sample median entrenchment in any fiscalyear; the Low E firms are therefore less entrenched. The results, presentedin Table VII, indicate that the effect of liquidity shocks on the relation be-tween firm value and blockholding are not any different between high- andlow-entrenchment firms. In other words, the threat of exit is significantly op-erational even in high-entrenchment firms. Thus, exit threats appear to con-stitute a governance mechanism different from voice.
D. Additional Tests of the Admati and Pfleiderer (2009) Model
The analytical propositions of Admati and Pfleiderer (2009) are difficult totest directly because they depend on several theoretical parameters that haveno obvious empirical counterparts. However, in their Section 7, the authorsprovide empirical implications of their propositions. One of their main results isthat blockholder exit threats are more effective at preventing the “bad” agencyproblem of wasteful investment by management for perquisites. The authorsargue that this situation is more likely in cash-rich firms. Table VIII tests thishypothesis by stratifying the sample based on median free cash flows, andchecking if exit threats operate more strongly in cash-rich firms. The resultsindicate that the weakening of exit threats due to foreign crises is significantlymore strongly felt in cash-rich firms. The coefficients indicate that the effectis about 16 times higher in cash-rich firms, with the difference significant ata p-value of 0.01. In the decimalization experiment, the interaction effect isagain much stronger in the cash-rich firms, and is about four times higherthan that in the low cash firms, with the difference significant at a p-value of0.056. This strong prediction, of course, is not offered by any of the interventiontheories of blockholder governance: there is no ex ante reason to assume such
25 For example, Brav et al. (2008) examine hedge fund activism from 2001 to 2006, which is afterour sample period, and find that these funds typically target smaller firms that also have takeoverdefenses.
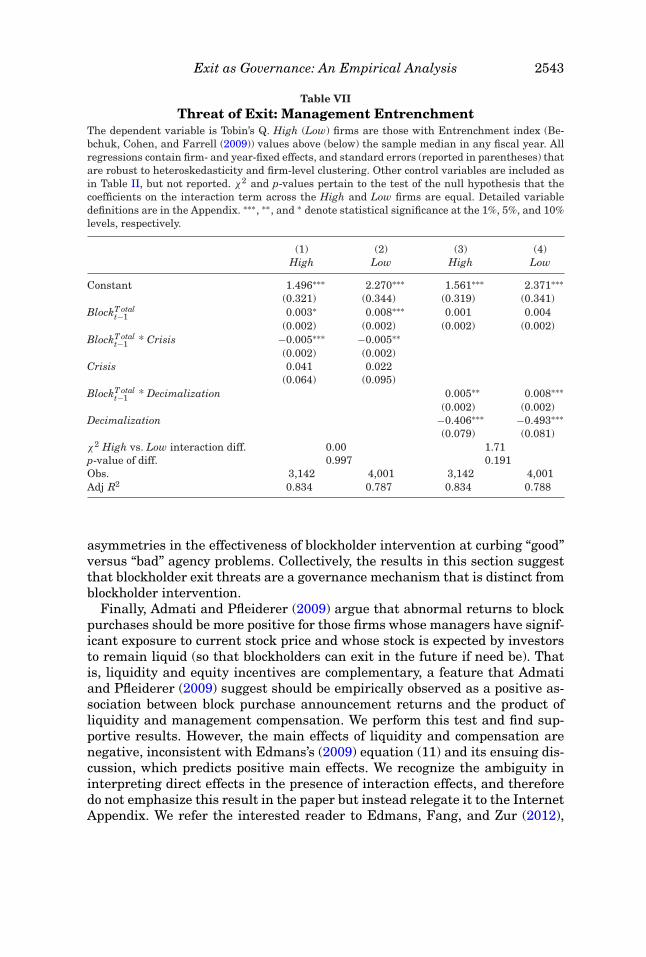
Exit as Governance: An Empirical Analysis 2543
Table VIIThreat of Exit: Management Entrenchment
The dependent variable is Tobin’s Q. High (Low) firms are those with Entrenchment index (Be-bchuk, Cohen, and Farrell (2009)) values above (below) the sample median in any fiscal year. Allregressions contain firm- and year-fixed effects, and standard errors (reported in parentheses) thatare robust to heteroskedasticity and firm-level clustering. Other control variables are included asin Table II, but not reported. χ2 and p-values pertain to the test of the null hypothesis that thecoefficients on the interaction term across the High and Low firms are equal. Detailed variabledefinitions are in the Appendix. ∗∗∗, ∗∗, and ∗ denote statistical significance at the 1%, 5%, and 10%levels, respectively.
(1) (2) (3) (4)High Low High Low
Constant 1.496∗∗∗ 2.270∗∗∗ 1.561∗∗∗ 2.371∗∗∗(0.321) (0.344) (0.319) (0.341)
BlockT otalt−1 0.003∗ 0.008∗∗∗ 0.001 0.004
(0.002) (0.002) (0.002) (0.002)BlockT otal
t−1 * Crisis −0.005∗∗∗ −0.005∗∗
(0.002) (0.002)Crisis 0.041 0.022
(0.064) (0.095)BlockT otal
t−1 * Decimalization 0.005∗∗ 0.008∗∗∗
(0.002) (0.002)Decimalization −0.406∗∗∗ −0.493∗∗∗
(0.079) (0.081)χ2 High vs. Low interaction diff. 0.00 1.71p-value of diff. 0.997 0.191Obs. 3,142 4,001 3,142 4,001Adj R2 0.834 0.787 0.834 0.788
asymmetries in the effectiveness of blockholder intervention at curbing “good”versus “bad” agency problems. Collectively, the results in this section suggestthat blockholder exit threats are a governance mechanism that is distinct fromblockholder intervention.
Finally, Admati and Pfleiderer (2009) argue that abnormal returns to blockpurchases should be more positive for those firms whose managers have signif-icant exposure to current stock price and whose stock is expected by investorsto remain liquid (so that blockholders can exit in the future if need be). Thatis, liquidity and equity incentives are complementary, a feature that Admatiand Pfleiderer (2009) suggest should be empirically observed as a positive as-sociation between block purchase announcement returns and the product ofliquidity and management compensation. We perform this test and find sup-portive results. However, the main effects of liquidity and compensation arenegative, inconsistent with Edmans’s (2009) equation (11) and its ensuing dis-cussion, which predicts positive main effects. We recognize the ambiguity ininterpreting direct effects in the presence of interaction effects, and thereforedo not emphasize this result in the paper but instead relegate it to the InternetAppendix. We refer the interested reader to Edmans, Fang, and Zur (2012),
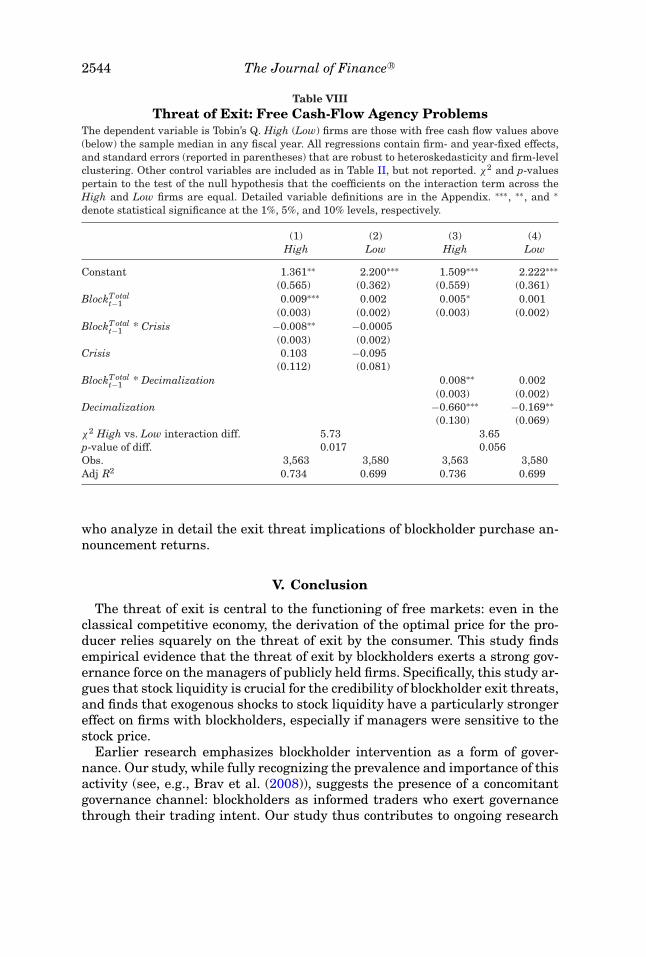
2544 The Journal of Finance R©
Table VIIIThreat of Exit: Free Cash-Flow Agency Problems
The dependent variable is Tobin’s Q. High (Low) firms are those with free cash flow values above(below) the sample median in any fiscal year. All regressions contain firm- and year-fixed effects,and standard errors (reported in parentheses) that are robust to heteroskedasticity and firm-levelclustering. Other control variables are included as in Table II, but not reported. χ2 and p-valuespertain to the test of the null hypothesis that the coefficients on the interaction term across theHigh and Low firms are equal. Detailed variable definitions are in the Appendix. ∗∗∗, ∗∗, and ∗denote statistical significance at the 1%, 5%, and 10% levels, respectively.
(1) (2) (3) (4)High Low High Low
Constant 1.361∗∗ 2.200∗∗∗ 1.509∗∗∗ 2.222∗∗∗(0.565) (0.362) (0.559) (0.361)
BlockT otalt−1 0.009∗∗∗ 0.002 0.005∗ 0.001
(0.003) (0.002) (0.003) (0.002)BlockT otal
t−1 * Crisis −0.008∗∗ −0.0005(0.003) (0.002)
Crisis 0.103 −0.095(0.112) (0.081)
BlockT otalt−1 * Decimalization 0.008∗∗ 0.002
(0.003) (0.002)Decimalization −0.660∗∗∗ −0.169∗∗
(0.130) (0.069)χ2 High vs. Low interaction diff. 5.73 3.65p-value of diff. 0.017 0.056Obs. 3,563 3,580 3,563 3,580Adj R2 0.734 0.699 0.736 0.699
who analyze in detail the exit threat implications of blockholder purchase an-nouncement returns.
V. Conclusion
The threat of exit is central to the functioning of free markets: even in theclassical competitive economy, the derivation of the optimal price for the pro-ducer relies squarely on the threat of exit by the consumer. This study findsempirical evidence that the threat of exit by blockholders exerts a strong gov-ernance force on the managers of publicly held firms. Specifically, this study ar-gues that stock liquidity is crucial for the credibility of blockholder exit threats,and finds that exogenous shocks to stock liquidity have a particularly strongereffect on firms with blockholders, especially if managers were sensitive to thestock price.
Earlier research emphasizes blockholder intervention as a form of gover-nance. Our study, while fully recognizing the prevalence and importance of thisactivity (see, e.g., Brav et al. (2008)), suggests the presence of a concomitantgovernance channel: blockholders as informed traders who exert governancethrough their trading intent. Our study thus contributes to ongoing research
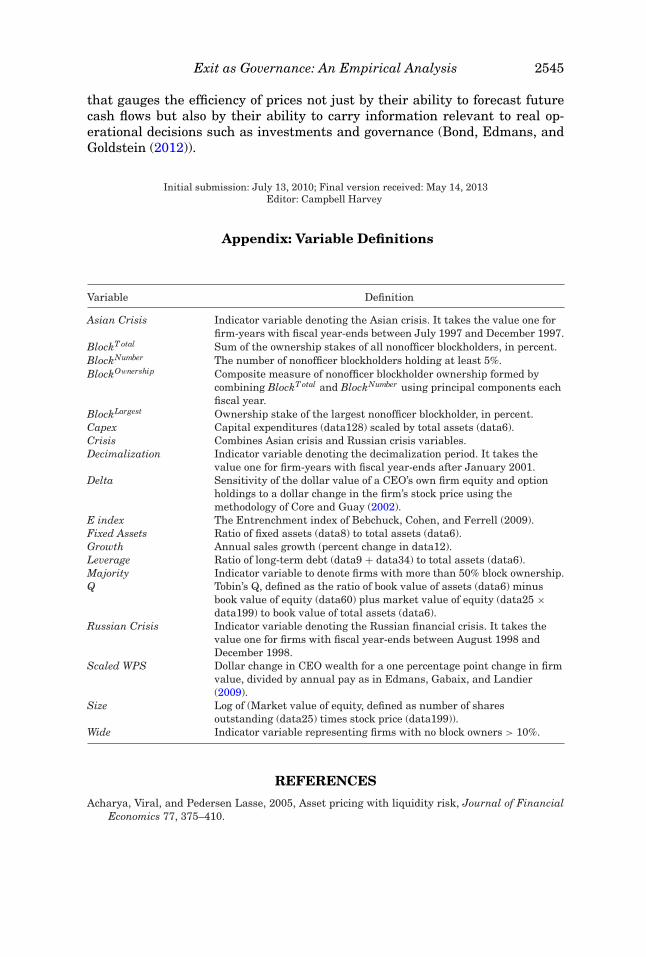
Exit as Governance: An Empirical Analysis 2545
that gauges the efficiency of prices not just by their ability to forecast futurecash flows but also by their ability to carry information relevant to real op-erational decisions such as investments and governance (Bond, Edmans, andGoldstein (2012)).
Initial submission: July 13, 2010; Final version received: May 14, 2013Editor: Campbell Harvey
Appendix: Variable Definitions
Variable Definition
Asian Crisis Indicator variable denoting the Asian crisis. It takes the value one forfirm-years with fiscal year-ends between July 1997 and December 1997.
BlockT otal Sum of the ownership stakes of all nonofficer blockholders, in percent.BlockNumber The number of nonofficer blockholders holding at least 5%.BlockOwnership Composite measure of nonofficer blockholder ownership formed by
combining BlockT otal and BlockNumber using principal components eachfiscal year.
BlockLargest Ownership stake of the largest nonofficer blockholder, in percent.Capex Capital expenditures (data128) scaled by total assets (data6).Crisis Combines Asian crisis and Russian crisis variables.Decimalization Indicator variable denoting the decimalization period. It takes the
value one for firm-years with fiscal year-ends after January 2001.Delta Sensitivity of the dollar value of a CEO’s own firm equity and option
holdings to a dollar change in the firm’s stock price using themethodology of Core and Guay (2002).
E index The Entrenchment index of Bebchuck, Cohen, and Ferrell (2009).Fixed Assets Ratio of fixed assets (data8) to total assets (data6).Growth Annual sales growth (percent change in data12).Leverage Ratio of long-term debt (data9 + data34) to total assets (data6).Majority Indicator variable to denote firms with more than 50% block ownership.Q Tobin’s Q, defined as the ratio of book value of assets (data6) minus
book value of equity (data60) plus market value of equity (data25 ×data199) to book value of total assets (data6).
Russian Crisis Indicator variable denoting the Russian financial crisis. It takes thevalue one for firms with fiscal year-ends between August 1998 andDecember 1998.
Scaled WPS Dollar change in CEO wealth for a one percentage point change in firmvalue, divided by annual pay as in Edmans, Gabaix, and Landier(2009).
Size Log of (Market value of equity, defined as number of sharesoutstanding (data25) times stock price (data199)).
Wide Indicator variable representing firms with no block owners > 10%.
REFERENCES
Acharya, Viral, and Pedersen Lasse, 2005, Asset pricing with liquidity risk, Journal of FinancialEconomics 77, 375–410.
2546 The Journal of Finance R©
Admati, Anat, and Paul Pfleiderer, 2009, The Wall Street walk and shareholder activism: Exit asa form of voice, Review of Financial Studies 22, 2645–2685.
Admati, Anat, Paul Pfleiderer, and Josef Zechner, 1994, Large shareholder activism and financialmarket equilibrium, Journal of Political Economy 102, 1097–1130.
Agrawal, Anup, and Mark Chen, 2010, Boardroom brawls: Determinants and Consequences ofdisputes involving directors, Working paper, University of Alabama.
Amihud, Yakov, 2002, Illiquidity and stock returns: Cross-section and time-series effects, Journalof Financial Markets 5, 31–56.
Bebchuk, Lucian, Alma Cohen, and Allen Ferrell, 2009, What matters in corporate governance?Review of Financial Studies 22, 783–827.
Bhide, Amar, 1993, The hidden costs of stock-market liquidity, Journal of Financial Economics34, 31–51.
Boehmer, Ekkehart, and Eric Kelley, 2009, Institutional investors and the informational efficiencyof prices, Review of Financial Studies 22, 3563–3594.
Bond, Philip, Alex Edmans, and Itay Goldstein, 2012, The real effects of financial markets, AnnualReview of Financial Economics 4, 339–360.
Brav, Alon, Wei Jiang, Frank Partnoy, and Randall Thomas, 2008, Hedge fund activism, corporategovernance, and firm performance, Journal of Finance 63, 1729–1775.
Chordia, Tarun, Asani Sarkar, and Avanidhar Subrahmanyam, 2005, An empirical analysis ofstock and bond market liquidity, Review of Financial Studies 18, 85–129.
Coffee, John, 1991, Liquidity versus control: The institutional investor as corporate monitor,Columbia Law Review 91, 1277–1368.
Core, John, and Wayne Guay, 2002, Estimating the value of employee stock option portfolios andtheir sensitivities to price and volatility, Journal of Accounting Research 40, 613–630.
Dasgupta, Amil, and Giorgia Piacentino, 2012, The Wall Street walk when blockholders competefor flows, Working paper, London School of Economics.
Davis, Gerald, and E. Han Kim, 2007, Business ties and proxy voting by mutual funds, Journal ofFinancial Economics 85, 552–570.
Denis, Diane, John McConnell, Alexei Ovtchinnikov, and Yun Yu, 2003, S&P 500 Index additionsand earnings expectations, Journal of Finance 58, 1821–1840.
Desai, Padma, 2000, Why did the ruble collapse in August 1998? American Economic Review 90,48–52.
Dlugosz, Jennifer, Rudiger Fahlenbrach, Paul Gompers, and Andrew Metrick, 2006, Large blocksof stock: Prevalence, size, and measurement, Journal of Corporate Finance 12, 594–618.
Edmans, Alex, 2009, Blockholder trading, market efficiency, and managerial myopia, Journal ofFinance 64, 2481–2583.
Edmans, Alex, Vivian Fang, and Emmanuel Zur, 2012, The effect of liquidity on governance,Working paper, University of Pennsylvania.
Edmans, Alex, Xavier Gabaix, and Augustin Landier, 2009, A multiplicative model of optimal CEOincentives in market equilibrium, Review of Financial Studies 22, 4881–4917.
Edmans, Alex, Itay Goldstein, and Wei Jiang, 2012, The real effects of financial markets: Theimpact of prices on takeovers, Journal of Finance 67, 933–971.
Edmans, Alex, and Gustavo Manso, 2011, Governance through exit and voice: A theory of multipleblockholders, Review of Financial Studies 24, 2395–2428.
Fang, Vivian, Thomas Noe, and Sheri Tice, 2009, Stock market liquidity and firm value, Journalof Financial Economics 94, 150–169.
Faure-Grimaud, Antoine, and Denis Gromb, 2004, Public trading and private incentives, Reviewof Financial Studies 17, 985–1014.
Gallagher, David, Peter Gardner, and Peter Swan, 2013, Governance through trading: Institu-tional swing trades and subsequent firm performance, Journal of Financial and QuantitativeAnalysis 48, 429–458.
Himmelberg, Charles, R. Glenn Hubbard, and Darius Palia, 1999, Understanding the determi-nants of managerial ownership and the link between ownership and performance, Journal ofFinancial Economics 53, 353–384.
Exit as Governance: An Empirical Analysis 2547
Holderness, Clifford, 2009, The myth of diffuse ownership in the United States, Review of FinancialStudies 22, 1377–1408.
Jeng, Leslie, Andrew Metrick, and Robert Zeckhauser, 2003, Estimating the returns to insidertrading: A performance-evaluation perspective, Review of Economics and Statistics 85, 453–471.
Jenter, Dirk, and Katharina Lewellen, 2010, Performance-induced CEO turnover, Working paper,Stanford University.
Kahn, Charles, and Andrew Winton, 1998, Ownership structure, speculation, and shareholderintervention, Journal of Finance 53, 99–129.
Kyle, Albert, 1985, Continuous auctions and insider trading, Econometrica 53, 1315–1335.Laeven, Luc, and Ross Levine, 2008, Complex ownership structures and corporate valuations,
Review of Financial Studies 21, 579–604.Lemmon, Michael, and Karl Lins, 2003, Ownership structure, corporate governance, and firm
value: Evidence from the East Asian financial crisis, Journal of Finance 58, 1445–1468.Maug, Ernst, 1998, Large shareholders as monitors: Is there a trade-off between liquidity and
control? Journal of Finance 53, 65–98.McCahery, Joseph, Zacharias Sautner, and Laura Starks, 2010, Behind the scenes: The corporate
governance preferences of institutional shareholders, Working paper, University of Amster-dam.
Parrino, Robert, Richard Sias, and Laura Starks, 2003, Voting with their feet: Institutional own-ership changes around forced CEO turnover, Journal of Financial Economics 68, 3–46.
Stulz, Rene, 1988, Managerial control of voting rights: Financing policies and the market forcorporate control, Journal of Financial Economics 20, 25–34.