EXISTING TR ANSI T SYSTEM OVERVIEW
27
SRTP EXISTING TRANSIT SYSTEM OVERVIEW
Transcript of EXISTING TR ANSI T SYSTEM OVERVIEW

SRTP EXISTING TRANSIT SYSTEM
OVERVIEW
klamberton
Preliminary Results
klamberton
Draft

March 2021
Existing Conditions Overview
58
4 Existing Transit System Overview An assessment of existing public transportation services and performance based on information available from Vista Transit including service hours, frequency, revenue hours, revenue miles, ridership, operating cost, fleet characteristics, bus stop amenities, and fare structures. This section provides a summary of Vista Transit operations and an analysis of system performance.
Fixed Route Characteristics This section describes fixed route operating characteristics such as route schedules and frequencies, and includes a summary of system performance, as reported to the National Transit Database (NTD).
Currently in 2021, Vista Transit operates a total of five routes. The weekday service includes three routes operating from 7:00 am to 6:00 pm, each with 60-minute frequencies, as shown in Table 4-1. The weekday (Monday-Friday) service includes the Blue/Central, the Green/East, and the Orange/West routes. The weekend (Saturday only) service includes the Red/West & Central and the Brown/Fort Huachuca routes which operate from 9:30 am to 6:00 pm with 60-minutes frequencies.
As depicted in F igure 4-1, the routes begin at the Sierra Vista Transit Center and operate primarily in one-way loops from the centralized transit hub. There is bi-directional service for the Orange/West route along East Wilcox Drive between South 7th Street and South Coronado Drive. Some routes deviate off the loop to serve key destinations, such as Cochise College, the University of Arizona South, the Sierra Vista public library, and the Canyon Vista Medical Center.
For the weekday service, there are 33 revenue hours per weekday required for the three fixed routes. There are 17 total revenue hours between the two routes on Saturdays. The weekday and weekend routes generally only require one bus to complete the route cycle time for each route. The existing transit network requires all weekday routes stop at the centrally located transit center for a timed transfer generally on the top and bottom of the hour. On the other hand, some routes have options for flexible routes based on rider request.
Table 4-1: Existing Fixed Route Characteristics
Route Schedule Frequency (Minutes)
Trips Per Day
Hours of Operation
Vehicles in Service
Blue (Central) Monday – Friday 7:00 am – 6:00 pm 60 11 11 1
Orange (West) Monday – Friday 7:00 am – 6:00 pm 60 11 11 1
Green (East) Monday – Friday 7:00 am – 6:00 pm 60 11 11 1
Red (West & Central) Saturday Only 9:30 am – 6:00 pm 60 8 8.5 1
Brown (Fort Huachuca) Saturday Only 9:30 am – 6:00 pm 60 8 8.5 1
Source: Vista Transit, 2019
March 2021
Existing Conditions Overview
59
Figure 4-1: Vista Transit Fixed Route System Map
Source: City of Sierra Vista, Vista Transit, 2019
Table 4-2 provides a six-year summary of operating data for the fixed route transit service, which can be analyzed to determine how Vista Transit as an agency has performed recently. Passenger trips peaked in 2015 with 163,271 annual trips followed by a steady decline in 2016 and 2017, however, passenger trips have increased over the last two years with 140,746 annual trips most recently in 2019 – a 13.8 percent decrease from the peak in 2015.
Total ridership has decreased since the six-year high in 2015 while operating costs experienced a slight rise in 2017 while ridership was at the six-year low. However, in 2018 and 2019, the annual operating costs had been decreasing approximately 10 percent since 2015, while ridership continued to rise. Passengers per hour recovered in 2018 and 2019, after experiencing an 11 percent reduction in 2016 and 2017, while cost performance per revenue hour was up 9.5 percent since the six-year low in 2016. However, the farebox recovery ratio in 2019 has risen nearly 20 percent after a six-year low in 2017.
Despite farebox revenue being at its highest in 2019 and increasing nearly 10 percent from 2018, farebox revenues had nearly an eight percent reduction year over the year from the years 2014-2018 while the subsidy per passenger, also increased $0.34, or 20.6 percent during the same time period. The data shows cost effectiveness was being impacted, particularity in 2016 and 2017, which is largely attributable to the reduction in ridership. However, ridership has been rising since 2017 and so have the cost effectiveness of Vista Transit operations reinforcing the importance and relationship between ridership and agency performance. The overall performance and cost effectiveness of Vista Transit operations between 2014 and 2019 is further illustrated in Figure 4-2 through Figure 4-7.

March 2021
Existing Conditions Overview
60
Table 4-2: Fixed Route National Transit Database Six-Year Summary
Year 2014 2015 2016 2017 2018 2019 Passenger Trips 161,552 163,271 148,408 133,741 139,700 140,746 Operating Costs (Budget) $870,619 $858,355 $853,825 $863,328 $778,365 $776,358 Farebox Revenue $96,399 $95,686 $92,107 $90,767 $88,871 $97,456 Revenue Miles 158,021 158,021 163,860 146,433 138,087 133,492 Revenue Hours 12,974 12,974 13,304 11,958 11,151 11,052 Performance & Cost Effectiveness Passengers per Revenue Hour 12.5 12.6 11.2 11.2 12.5 12.7 Passengers per Revenue Mile 1.02 1.03 0.91 0.91 1.0 1.1 Operating Costs per Passenger $5.39 5.26 $5.75 $6.46 $5.57 $5.52 Operating Costs per Revenue Hour $67.10 $66.16 $64.18 $72.20 $69.80 $70.25 Operating Cost per Revenue Mile $5.51 $5.43 $5.21 $5.90 $5.64 $5.82 Farebox Recovery Ratio 11.1% 11.1% 10.8% 10.5% 11.4% 12.6% Subsidy per Passenger* $4.79 $4.67 $5.13 $5.78 $4.94 $4.82 *Subsidy per Passenger represents operating cost less fare revenue divided by total passenger trips. Source: City of Sierra Vista, Vista Transit, National Transit Database, 2014-2019
Figure 4-2: Fixed Route Operating Cost per Revenue Mile (2014-2019)
Figure 4-3: Fixed Route Passengers per Revenue Mile (2014-2019)
$5.51 $5.43 $5.21
$5.90 $5.64
$5.82
$4.50
$5.00
$5.50
$6.00
2014 2015 2016 2017 2018 2019
Operating Cost per Revenue Mile
1.0 1.00.9 0.9 1.0 1.1
0.0
0.5
1.0
1.5
2014 2015 2016 2017 2018 2019
Passengers per Revenue Mile

March 2021
Existing Conditions Overview
61
Figure 4-4: Fixed Route Passengers per Revenue Hour (2014-2019)
Figure 4-5: Fixed Route Operating Cost per Revenue Hour (2014-2019)
Figure 4-6: Fixed Route Operating Cost per Passenger (2014-2019)
Figure 4-7: Fixed Route Farebox Recovery Ratio (2014-2019)
12.5 12.6
11.2 11.2
12.5 12.7
10
12
14
2014 2015 2016 2017 2018 2019
Passengers per Revenue Hour
$67.10 $66.16 $64.18
$72.20 $69.80 $70.25
$60.00
$65.00
$70.00
$75.00
2014 2015 2016 2017 2018 2019
Operating Costs per Revenue Hour
$5.39 5.26$5.75
$6.46
$5.57 $5.52
$4.00
$5.00
$6.00
$7.00
2014 2015 2016 2017 2018 2019
Operating Costs per Passenger
11.1% 11.1% 10.8% 10.5%11.4%
12.6%
9.0%10.0%11.0%12.0%13.0%
2014 2015 2016 2017 2018 2019
Farebox Recovery Ratio

March 2021
Existing Conditions Overview
62
Route Profiles This section provides a description of the five fixed routes operated by Vista Transit by illustrating ridership, route alignments, stop configurations and locations, and route scheduling and timing.
Fixed Route Ridership Table 4-3 provides data on ridership performance for Fiscal Year 2020 for each of the three weekday routes and the two Saturday routes. The Orange/West route is the strongest performer with an average of 175 boardings per day. The Green/East route was the weakest performer with an average of 71 daily boardings, almost 50 less boardings per day than the weekday average. On Saturdays, approximately 42 percent of the ridership comes from the Brown route servicing Fort Huachuca.
Table 4-3: Fixed Route Ridership (FY 2020)
Route Total Boardings AVG Daily Boardings
Boardings per Hour
Revenue Hours
Blue (Central) 21,499 82 7 11 Orange (West) 45,672 175 16 11 Green (East) 18,591 71 6 11 Weekday Summary 85,762 329 30 33 Red (West & Central) 4,135 80 9 8.5 Brown (Fort Huachuca) 2,960 57 7 8.5 Weekend Summary 7,095 136 16 17 Source: Vista Transit, 2020
All routes converge at the Transit
Center located at Wilcox
Drive and Coronado Drive, where
passengers can transfer to other routes and
other regional transit providers
March 2021
Existing Conditions Overview
63
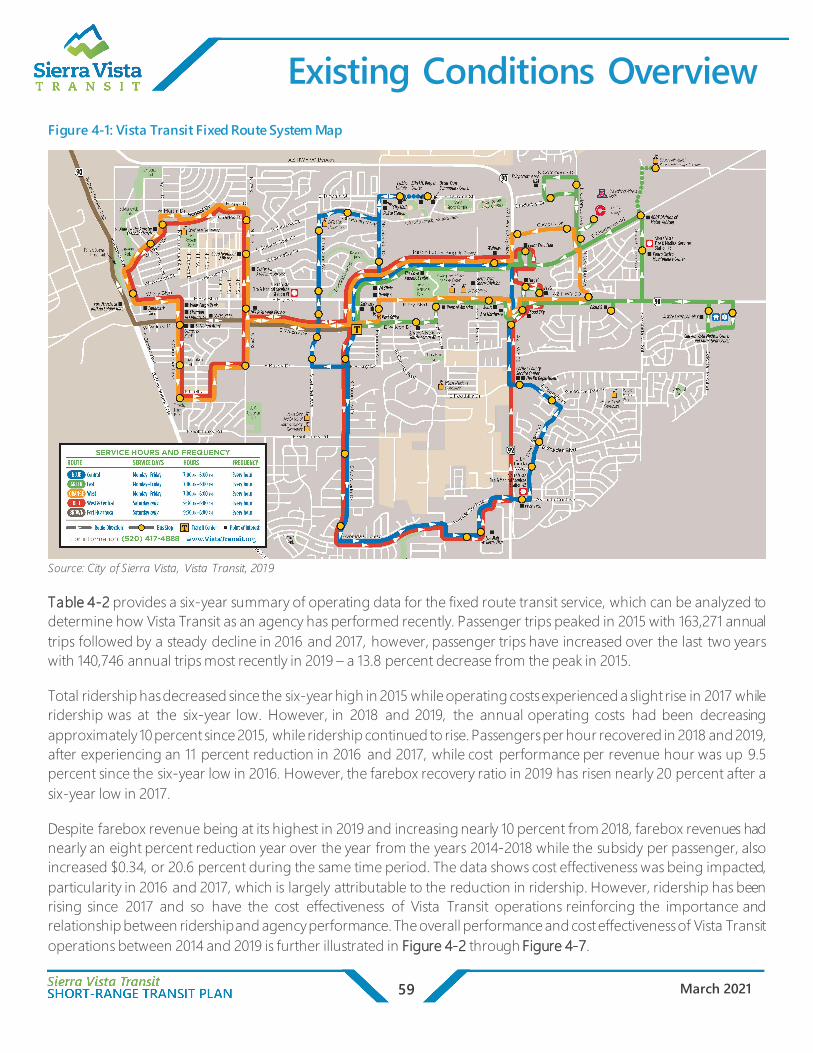
Blue Route (Central) The Blue Route meanders through the central portion of Sierra Vista by navigating through both the northern and the south/southeast parts of the City. Further illustrated in Figure 4-8, the Blue Route initially operates in a clockwise loop from the transit center, but then the operates in a counter- clockwise direction after returning to the Transit Center.
The Blue Route has a leg on the north part of the route that provides a flex route servicing the Ethel H. Berger Center and Oscar Yrun Community Center based upon rider request, as shown in the blue dotted line on the Blue Route Map.
The Blue Route operates with a 60-minute frequency service which originates at the Sierra Vista Transit Center. The schedule of service is from 7:00 am to 6:00 pm. This results in 11 runs per day and 11 hours of service for one vehicle.
Figure 4-8: Blue Route (Central) Map
Source Vista Transit, 2020
March 2021
Existing Conditions Overview
64
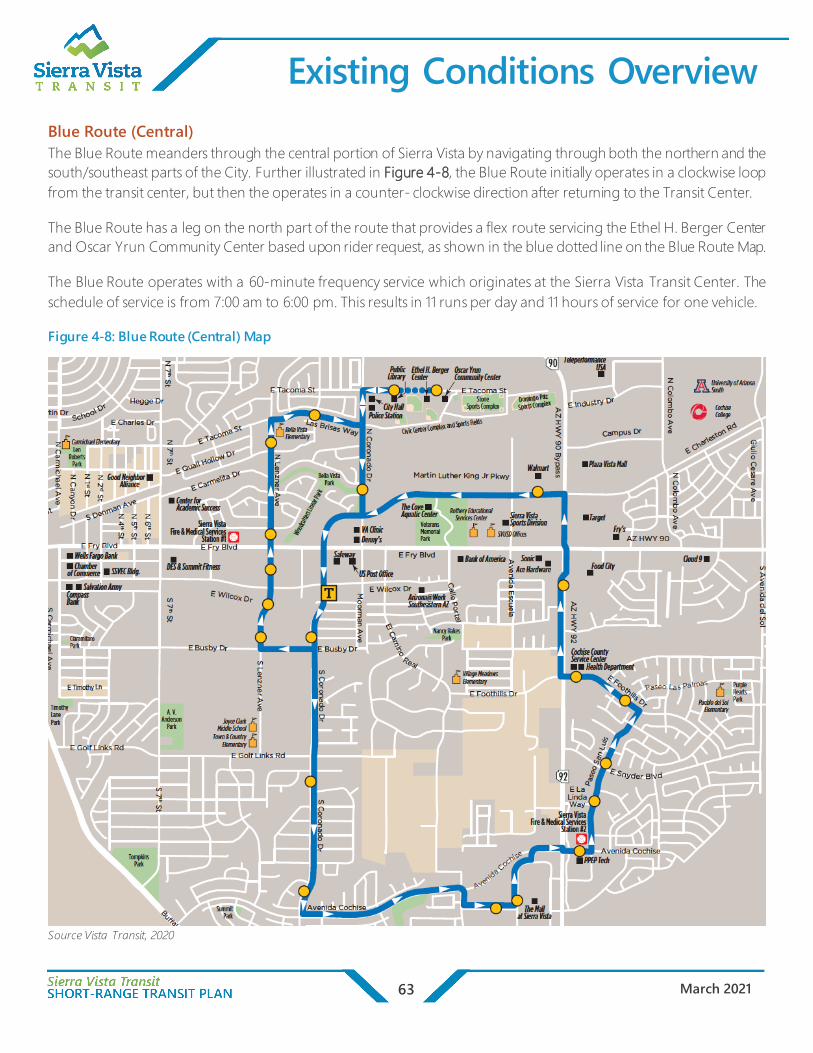
Table 4-4 shows some of the key destinations served by the Green Route as well as the bus stops while denoting the hourly schedule when the bus arrives at the different stops.
The Blue Route is approximately 11 miles in length with 23 stops. And as previously mentioned, operates in two loops with the first loop having 10 stops taking approximately 20 minutes for the bus to traverse; while the second loop has 13 stops and takes approximately 37 minutes for the bus to traverse as it returns to the Transit Center.
Table 4-4: Blue Route Bus Stops, Route Timing, & Key Destinations Served
Key Destinations Served Stop Bus Stop Timing
• Belle Vista Elementary School • City Hall • Public Library • Ethel Berger Center • Oscar Yrun Community Center • Stone Sports Complex • Domingo Piaz Sports Complex • Center for Academic Success • U.S. Post Office • The Mall at Sierra Vista • PPEP Tech • Cochise County Service Center • Health Department • Food City • Target • Walmart • The Cove Aquatic Center
Transit Center :10 Bonita Vista Apartments :12 Vista del la Sierra Apartments :13 Montego Bay Apartments :13 Bell Aire Mobile Home Park :14 N. Lenzner Avenue :17 Bella Vista School :18 Las Brisas Apartments :20 Sierra Vista Public Library :22 N. Coronado Dr. | MLK Jr. Parkway :24 Transit Center :30 S. Coronado Drive | Crestwood Drive :32 S. Coronado Drive | S. Sunburst Drive :33 Rodeo Drive :36 The Mall at Sierra Vista :37 Avenida Cochise | AZ Hwy 92 :39 Paseo San Luis | E. La Linda Way :40 Paseo San Luis | E. Snyder Boulevard :41 E. Foothills Dr. | Paseo Las Palmas :42 Cochise County Service Center :43 Buffalo Wild Wings :45 Walmart :50 Transit Center :57
Source Vista Transit, 2020

March 2021
Existing Conditions Overview
65
Green Route (East) The Green Route has a more untraditional route pattern compared to the other two weekday routes. As depicted in F igure 4-9, the Green Route serves parts of Sierra Vista to the east and northeast. The route operates in a counter-clockwise direction from the transit center with two branches that spread out from the mainline serving key areas of the City.
The Green Route has a leg in the northeast that provides a flex route servicing the Buena High School based upon rider request, as shown in the green dotted line on the Green Route Map.
The Green Route operates 60-minute frequency service which originates at the Sierra Vista Transit Center. The schedule of service is from 7:00 am to 6:00 pm. Monday through Friday. This results in 11 runs per day and 11 hours of service for one vehicle.
Figure 4-9: Green Route (East) Map
Source: Vista Transit, 2020

March 2021
Existing Conditions Overview
66
Table 4-5 shows some of the key destinations served by the Green Route as well as the bus stops while denoting the hourly schedule when the bus arrives at the different stops.
The Green Route is approximately 10 miles in length with 19 stops, and as previously mentioned, operates in one loop with two branches that separate off the mainline that have two stops each. The entire Green Route takes approximately 47 minutes for the bus to traverse the route.
Table 4-5: Green Route Bus Stops, Route Timing, & Key Destinations Served
Key Destinations Served Stop Bus Stop Timing
• Arizona @Work Southeastern AZ • Bank of America • Food City • Cloud 9 • Target • Fry’s Grocery Store • Justice Court Complex • Canyon Vista Medical Center • Pedro Castro Center • ADOT Division Motor Vehicles • Buena High School • Buena Performing Arts Center • Cochise College • University of Arizona South • Plaza Vista Mall • Walmart • The Cove Aquatic Center
Transit Center :05 Cochise College | Downtown Center :07 Calle Portal :09 Sonic :12 Food City :15 Fry’s Food & Drug :17 Target :19 Cloud Nine :22 Hospital East Side :26 Justice Court Complex :28 Pete Castro Center :32 Giulio Cesare | E. Charleston Road :33 Cochise College :37 Colombo Ave. | N. Commerce Drive :40 E. Industry Drive :42 San Pedro Apartments :43 Plaza Vista Mall (Ross Plaza) :45 Walmart :48 Transit Center :53
Source: Vista Transit, 2020

March 2021
Existing Conditions Overview
67
Orange Route (West) The Orange Route has the largest service area of any of the other two weekday routes and is the only weekday route to serve the west side of Sierra Vista. As depicted in F igure 4-10, the route operates in two loops on both sides of the Transit Center in counter-clockwise directions once it turns north on 7th Street and Fry Boulevard from Wilcox Drive.
The Orange Route operates with a 60-minute frequency service which originates at the Sierra Vista Transit Center. The schedule of service is from 7:00 am to 6:00 pm. Monday through Friday. This results in 11 runs per day and 11 hours of service for one vehicle.
Figure 4-10: Orange Route (West) Map
Source: Vista Transit, 2020

March 2021
Existing Conditions Overview
68
Table 4-6 shows some of the key destinations served by the Orange Route as well as the bus stops while denoting the hourly schedule when the bus arrives at the different stops.
The Orange Route is approximately 10 mile sin length with 20 stops, and as previously mentioned, operates in one loop with two branches that separate off the mainline serving different parts of the City in proximity to Fry Blvd. . The entire Orange Route takes approximately 51 minutes for the bus to traverse the route.
Table 4-6: Orange Route Bus Stops, Route Timing, & Key Destinations Served
Key Destinations Served Stop Bus Stop Timing
• Department of Economic Security • Summit Fitness • Salvation Army • Compass Bank • Good Neighbor Alliance • Center for Academic Success • U.S. Post Office • Safeway • VA Clinic • Food City • Fry’s Grocery Store • Walmart • Plaza Vista Mall
Transit Center :00 Department of Economic Security (DES) :04 N. 7th Street | E. Quail Hollow Drive :05 N. 7th Street | E. Charles Drive :06 St. Andrew Catholic Church :10 North Avenue | W. Taylor Drive :11 N. Garden Avenue | W. Whitton Street :12 S. Carmichael Avenue | Wilcox Drive :16 S. Carmichael Avenue| Busby Drive :16 S. Carmichael Avenue | Timothy Lane :17 E. Busby Dr. | S. 7th Street :20 Transit Center :30 Moorman Ave. :32 Sonic :35 Food City :37 N. Colombo Ave. | AZ Hwy. 90 :39 Campus Dr. | N. Colombo Ave. :43 Campus Dr. | AZ Hwy. 90 Bypass :44 Walmart :46 Transit Center :51
Source Vista Transit, 2020

March 2021
Existing Conditions Overview
69
Red (West & Central) & Brown (For Huachuca) Route Both the Red and Brown Route operate on Saturdays only. As shown in F igure 4-11, the Red Route provides coverage of much of the weekday routes by performing two loops which depart from the Sierra Vista Transit Center. The Brown Route provides service to Fort Huachuca and is the only route which is offered to the base entering the post from the Van Deman Gate. The Brown Route also may make minor deviations off route upon request.
The Red Route operates a 60-minute frequency service which originates at the Sierra Vista Transit Center, while the Brown operates a 60-minute frequency service which originates at Fort Huachuca. Both the Red and Brown Route have a scheduled service from 9:30 am to 6:00 pm
Figure 4-11: Red (West & Central) & Brown (Fort Huachuca) Route Map
Source Vista Transit, 2020

March 2021
Existing Conditions Overview
70
Table 4-7 shows some of the key destinations served by both the Red and Brown Route as well as the bus stops while denoting the hourly schedule when the buses arrive at the corresponding stop.
The Red Route is approximately 13 miles in length with 19 stops. And as previously mentioned, operates in two loops that separate off the mainline with multiple stops on each loop. The entire Red Route takes approximately 60 minutes for the bus to traverse the route. The Brown Route is almost seven miles in length with five stops which services Fort Huachuca by originating at the MIV Pavilion and traversing to the Transit Center before returning to the Fort. Brown Route riders can transfer to the Red Route at the Vista Transit Center to access other key destinations throughout the City of Sierra Vista. The entire Brown Route takes approximately 60 minutes for the bus to traverse the route.
Table 4-7: Red (West & Central) & Brown (For Huachuca) Route Map
Key Destinations Served Stop Bus Stop Timing Red Route
• U.S. Post Office • Safeway • VA Clinic • Food City • Fry’s Grocery Store • Walmart • Plaza Vista Mall • Belle Vista Elementary School • City Hall / Public Library • Oscar Yrun Community Center • Stone Sports Complex • Center for Academic Success • The Mall at Sierra Vista • PPEP Tech • Cochise County Service Center • Health Department • Target • The Cove Aquatic Center
Transit Center :30 Dept. of Economic Security (DES) :34 N. 7th Street | E. Quail Hollow Drive :36 N. 7th Street | E. Charles Drive :37 St Andrew Catholic Church :40 North Avenue | W. Taylor Drive :41 N. Garden Avenue | W. Whitton Street :42 S. Carmichael Avenue | Wilcox Drive :46 S. Carmichael Avenue | Busby Drive :46 S. Carmichael Avenue | E. Timothy Drive :47 E. Busby Drive | S. 7th Street :50 Transit Center :00 The Mall at Sierra Vista :09 Food City :15 Fry’s Food & Drug :17 Target :18 Plaza Vista Mall (Ross Plaza) :21 Walmart :25 Transit Center :30
Brown Route
• Department of Economic Security • Summit Fitness • Salvation Army
MIV Pavilion :30 Post Exchange :35 Transit Center :00 Post Exchange :25 MIV Pavilion :30
Source Vista Transit, 2020

March 2021
Existing Conditions Overview
71
Paratransit Characteristics In accordance with ADA mandates, Vista Transit also offers complementary paratransit service to people who are unable to use the fixed route bus service, due to a disability. ADA requires transit agencies to provide paratransit to the disabled populations for trips with origins and destinations within 3/4 of a mile of a route or bus stop. However, Vista Transit currently provides paratransit service throughout the city limits of Sierra Vista, which is beyond of the mandated 3/4 mile zone from fixed route services, as was envisioned and a stated goal of the City of Sierra Vista's General Plan. Vista Transit travels within city limits for paratrasit services and special needs customers, Monday through Friday, 7:00 a.m. to 6:00 p.m., and Saturday from 9:30 a.m. to 6:00 p.m. All paratransit vehicles are wheelchair accessible. Reservations must be called in 24 hours in advance, Monday – Friday between the hours of 7:00 am. – 4:00 pm. There are usually two paratransit vehicles in service at any given time during the hours of operation. However, sometimes there is only one paratransit vehicle needed during the hours of operation. F igure 4-12 shows the service are for Vista Transit’s paratransit service.
Figure 4-12: Vista Transit Paratransit Service Area (2019)
Source: Vista Transit, 2019
Table 4-8 provides a six-year summary of operating data for the paratransit service, which can be analyzed to determine how the service has performed recently. Passenger trips peaked in 2014 and 2015 with 9,825 annual trips followed by a steady decline through 2019. The paratransit operating cost increased nearly 28 percent from 2015 and 2016, after dropping approximately 28 percent the prior year between 2014 and 2015. Since 2016, the operating costs and passenger trip have been declining steadily. However, in 2019 the operating cost per revenue mile jumped to $9.45 from $5.54 in 2018, a $4.00 or 70% increase - likely connected to the decrease in revenue miles and hours between 2018 and 2019. In short, this pattern of steady decline of service without an equivalent level of decline in operating cost

March 2021
Existing Conditions Overview
72
could warrant fare structure or service area adjustments. The overall performance and cost effectiveness of Vista Transit operations between 2014 and 2019 is further illustrated in Figure 4-13 through Figure 4-18.
Table 4-8: Paratransit NTD Data Six-Year Summary
Year 2014 2015 2016 2017 2018 2019 Passenger Trips 9,825 9,825 8,265 7,219 6,906 5,525 Operating Costs (Budget) $260,055 $188,419 $240,823 $201,735 $182,579 $175,885 Farebox Revenue $19,598 $21,004 $18,229 $14,776 $13,280 $11,695 Revenue Miles 51,200 36,788 47,178 35,090 32,943 18,617 Revenue Hours 4,567 4,567 6,225 3,250 1,334 970 Performance & Cost Effectiveness Passengers per Revenue Hour 2.2 2.2 1.3 2.2 5.2 5.7 Passengers per Revenue Mile 0.19 0.27 0.18 0.21 0.21 0.30 Operating Costs per Passenger $5.39 $19.18 $29.14 $27.95 $26.44 $31.83 Operating Costs per Revenue Hour $56.94 $41.26 $38.69 $62.07 $136.87 $181.32 Operating Cost per Revenue Mile $5.08 $5.12 $5.10 $5.75 $5.54 $9.45 Farebox Recovery Ratio 7.5% 11.1% 7.6% 7.3% 7.3% 6.6% Subsidy per Passenger* $24.47 $17.04 $26.93 $25.90 $24.51 $29.72 *Subsidy per Passenger represents operating cost less fare revenue divided by total passenger trips. Source: City of Sierra Vista, Vista Transit, National Transit Database, 2014-2019
Figure 4-13: Paratransit Operating Cost per Revenue Mile (2014-2019)
$5.08 $5.12 $5.10 $5.75 $5.54
$9.45
$0.00
$2.00
$4.00
$6.00
$8.00
$10.00
2014 2015 2016 2017 2018 2019
Operating Cost per Revenue Mile

March 2021
Existing Conditions Overview
73
Figure 4-14: Paratransit Passengers per Revenue Mile (2014-2019)
Figure 4-15: Paratransit Operating Cost per Revenue Mile (2014-2019)
Figure 4-16: Paratransit Operating Cost per Revenue Hour (2014-2019)
0.190.27
0.18 0.21 0.21
0.30
0.00
0.10
0.20
0.30
0.40
2014 2015 2016 2017 2018 2019
Passengers per Revenue Mile
2.2 2.21.3
2.2
5.2 5.7
0.0
2.0
4.0
6.0
2014 2015 2016 2017 2018 2019
Passengers per Revenue Hour
$56.94 $41.26 $38.69 $62.07
$136.87 $181.32
$0.00
$100.00
$200.00
2014 2015 2016 2017 2018 2019
Operating Costs per Revenue Hour

March 2021
Existing Conditions Overview
74
Figure 4-17: Paratransit Operating Cost per Passenger (2014-2019)
Figure 4-18: Paratransit Fare Box Recovery (2014-2019)
Vista Transit Fares & Pricing Most transit agencies employ largely flat fare systems, which charge the same price, regardless of time of day, distance or direction traveled, or quality of service. However, they do not reflect the actual costs of providing service, which constantly fluctuate throughout the day. Peak period operation, longer trip routes, and premium service all cost the agency more money to operate and require more capital investments. Fares for riding Vista Transit vary for different types of passengers:
• Regular passengers – basic, full ticket price passengers. • Senior citizens – 65 years or older. • Citizens with disabilities. • Students – kindergarten through college. • Curbside-to-curbside service – ADA Paratransit service. • Transfers/promotional rides – children under five years of age, caregivers, transfer riders (no
fare collected for these passengers).
Vista Transit tickets and passes may be purchased at one of the two following locations:
1. Oscar Yrun Center 3020 E. Tacoma St. 520-458-7922
2. Vista Transit Station 2050 E. Wilcox Dr. 520-417-4888
$5.39
$19.18
$29.14 $27.95 $26.44 $31.83
$0.00$10.00$20.00$30.00$40.00
2014 2015 2016 2017 2018 2019
Operating Costs per Passenger
7.5%11.1%
7.6% 7.3% 7.3% 6.6%
0.0%
5.0%
10.0%
15.0%
2014 2015 2016 2017 2018 2019
Farebox Recovery Ratio
March 2021
Existing Conditions Overview
75
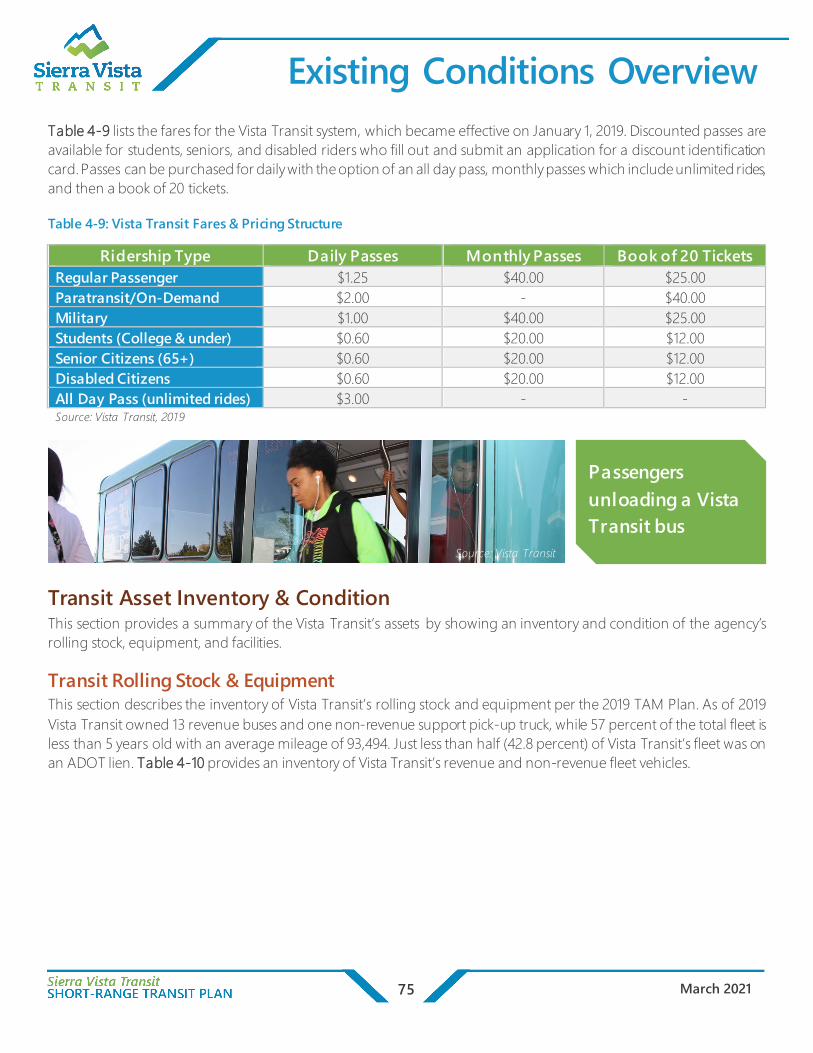
Table 4-9 lists the fares for the Vista Transit system, which became effective on January 1, 2019. Discounted passes are available for students, seniors, and disabled riders who fill out and submit an application for a discount identification card. Passes can be purchased for daily with the option of an all day pass, monthly passes which include unlimited rides, and then a book of 20 tickets.
Table 4-9: Vista Transit Fares & Pricing Structure
Ridership Type Daily Passes Monthly Passes Book of 20 Tickets Regular Passenger $1.25 $40.00 $25.00 Paratransit/On-Demand $2.00 - $40.00 Military $1.00 $40.00 $25.00 Students (College & under) $0.60 $20.00 $12.00 Senior Citizens (65+) $0.60 $20.00 $12.00 Disabled Citizens $0.60 $20.00 $12.00 All Day Pass (unlimited rides) $3.00 - - Source: Vista Transit, 2019
Transit Asset Inventory & Condition This section provides a summary of the Vista Transit’s assets by showing an inventory and condition of the agency’s rolling stock, equipment, and facilities.
Transit Rolling Stock & Equipment This section describes the inventory of Vista Transit’s rolling stock and equipment per the 2019 TAM Plan. As of 2019 Vista Transit owned 13 revenue buses and one non-revenue support pick-up truck, while 57 percent of the total fleet is less than 5 years old with an average mileage of 93,494. Just less than half (42.8 percent) of Vista Transit’s fleet was on an ADOT lien. Table 4-10 provides an inventory of Vista Transit’s revenue and non-revenue fleet vehicles.
Passengers unloading a Vista Transit bus Source: Vista Transit

March 2021
Existing Conditions Overview
76
Table 4-10: Vista Transit Fleet Inventory
Vehicle ID Number (VIN)
Funding Source
V e h icle Type Year Make Model M ile a g e A m bu latory
Seat C o n d ition
Code ADOT Lien?
Revenue Transit Fleet Bus #374 VIN #0108 FTA 5311 5 2009 ARBOC Spirit of
Mobility 168,128 21 4 Yes
Bus #377 VIN #3692 5311 5 2009 ARBOC Spirit of
Mobility 167,976 21 4 Yes
Bus #379 VIN #4333
ARRA Grant 2 2010 El Dorado E-Z 164,061 30 4 No
Bus #380 VIN #4334
ARRA Grant 2 2010 El Dorado Rider 151,053 30 4 No
Bus #381 VIN #4335
ARRA Grant 2 2010 El Dorado E-Z 146,620 30 4 No
Bus #2091 VIN #6116 5311 5 2013 ARBOC Rider 132,860 17 4 Yes
Bus #2092 VIN #6218 5311 5 2013 ARBOC E-Z 140,245 17 4 Yes
Bus #2121 VIN #0498 5311 5 2014 ARBOC Rider 127,387 18 4 Yes
Bus #2122 VIN #1287 5311 5 2014 ARBOC Spirit of
Freedom 102,935 18 4 Yes
Bus #2186 VIN # 1201 5307 5 2016 ARBOC Spirit of
Freedom 47,826 18 5 No
Bus #2187 VIN # 8471 5307 5 2016 ARBOC Spirit of
Mobility 50,253 18 5 No
Van #2066 VIN #0540 5311 8 2010 Dodge Spirit of
Mobility 29,422 7 4 No
Bus # VIN #009963 5307 5 2018 ARBOC Spirit of
Freedom 29,422 18 5 No
Non-Revenue Transit Vehicles VIN# IHA6GUBG9HN 5339 9 2018 Chevy Colorado
Pick-up 4,588 0 5 No
Source: Vista Transit, 2019
In Table 4-10, the vehicle type and condition are indicated through a coding system as determined through the FTA Transit Economic Requirements Model (TERM) Scale. As noted, all of vehicles are in Excellent or Good condition per FTA’s TERM Scale Transit agencies are required to track and report the condition of vehicles as part of the useful life benchmarking (ULB) when reporting annual TAM Plans. The ULB metrics are used in gauging performance measures as outlined in the TAM Plan. Table 4-11 and Table 4-12 provides a description of the vehicle type and vehicle condition code as outlined in Table 4-10.

March 2021
Existing Conditions Overview
77
Table 4-11: FTA TERM Scale Vehicle Type/Class Coding
FTA TERM Scale Vehicle Type/Class Coding Code Description
1 Heavy duty buses/coaches (including over the road coach): 40+ feet in length 2 Heavy duty buses: 30 to 40 feet in length, up to 40 ambulatory passengers 5 Light duty medium size cutaways (body on chassis): 15-25 feet in length, up to 25 ambulatory passengers 6 Light duty small size cutaways (body on chassis): 10-20 feet in length, up to 9 ambulatory passengers 7 Maxi vans/standard vans up to 8 ambulatory with lift or up to 12-15 ambulatory passengers without lift/ramp 8 Minivans: up to 5 ambulatory with ramp or 7 ambulatory passengers without lift/ramp 9 Support vehicles (sedans, station wagons, SUV's, Pickups, etc.) 10 Other (trolleys, etc.)
Source: Federal Transit Administration (FTA)
Table 4-12: FTA TERM Scale Fleet & Equipment Condition Coding
FTA TERM Scale Fleet & Equipment Condition Coding Code Description
1 FAILURE - Is impossible or unsafe to use, using as spare or for parts. 2 POOR - Becoming unsafe and unreliable to operate, frequent breakdowns, excessive repair costs. 3 FAIR - At midpoint of useful life, signs of wear, regular maintenance keeps it safe and operable, but costs exceed norm. 4 GOOD - Well-maintained, no ongoing mechanical problems, shows minor wear. 5 EXCELLENT - Relatively new, no mechanical problems.
Source: Federal Transit Administration (FTA)
Transit Facilities Vista Transit’s facilities include a maintenance yard, a combined administration office, and central transit center, 42 bus stops and two enhanced bus stops. The maintenance yard was constructed in 2002 and the central transit center in 2007. There are currently no parking facilities, rail or trolley facilities.
Vista Transit Bus - 2018 ARBOC Spirit of Freedom
Source: Vista Transit

March 2021
Existing Conditions Overview
78
All these facilities, including each individual bus stop, are inspected weekly by Vista Transit maintenance staff. Regular maintenance activities are undertaken daily at the maintenance yard and central transit facility. At any time, but particularly after any inspection, work orders are submitted for any needed repairs, replacements or any special needs to address a problem with the physical site. These work orders are immediately prioritized with those items addressing safety identified as a top priority. Other routine maintenance items are undertaken on a schedule that is approved each year as part of the annual budget. Table 4-13 provides a description of the transit facility condition code.
Table 4-13: FTA TERM Scale Facility Condition Coding
FTA TERM Scale Facility Condition Coding Code Description*
1 POOR – Critically damaged or in need of immediate repair; well past useful life 2 MARGINAL– Defective or deteriorated in need of replacement; exceeded useful life 3 ADEQUATE – Moderately deteriorated or defective; but has not exceeded useful life 4 GOOD – Good condition, but no longer new, may be slightly defective or deteriorated, but is overall functional 5 EXCELLENT – No visible defects, new or near new condition, maybe still be under warranty, if applicable
*An asset is deemed to be in good repair if it has a rating of 3, 4, or 5 on this scale. Likewise, an asset is deemed to not be in good repair if it has a rating of 1 or 2. Source: Federal Transit Administration (FTA)
The 2019 bus stop inventory found that 100 percent of bus stops and shelters were in Excellent or Good Condition and zero percent falling into the Adequate, Marginal or Poor conditions. Table 4-14 shows the results of the most recent bus stop inventory.
Table 4-14: Vista Transit Bus Stop Inventory
Bus Stop ID# Location Shelter Bench Sign Trash Can Shelter/Stop Condition Orange/ #1 DES YES YES OK √ Good Orange/ #2 Quail Hollow YES YES OK √ Good Orange/ #3 Hegge NO NO OK Good Orange/ #4 St. Andrew's Church YES YES OK Good Orange/ #5 North/Taylor YES YES OK Good Orange/ #6 Whitton YES YES OK Good Orange/ #7 Carm/Wilcox YES YES OK √ Good Orange/ #8 Carm/Busby NO NO OK Good Orange/ #9 Carm/Timothy YES YES OK Good Orange/ #10 Busby/7th YES YES OK √ Good Green/ #11 Cochise College YES YES OK √ Good Green/ #12 Calle Portal YES YES OK Good Green/ #13 Cloud 9 YES YES OK Good Green/ #14 Courthouse YES YES OK √ Good Green/ #16 PCC YES YES OK √ Good Green/ #17 DMV YES YES OK √ Good

March 2021
Existing Conditions Overview
79
Bus Stop ID# Location Shelter Bench Sign Trash Can Shelter/Stop Condition Green/ #18 College YES YES OK Good Green/ #19 San Pedro YES YES OK Good
Orange/ #20 Sonic YES YES √ (2) Good Orange/ #21 Food City NO YES Both ok Good Orange/ #22 Fry's NO YES OK Good Orange/ #23 Target NO NO OK Good Orange/ #24 Ross Plaza NO YES OK Good Orange/ #25 Wal Mart YES (2) YES OK √ (2) Good
Blue/ #26 Bonita NO YES OK Good Blue/ #27 Sierra Bella YES YES OK Good Blue/ #28 Montego bay YES YES OK Good Blue/ #29 Bel Air MHP NO NO OK Good Blue/ #30 N. Lenzner/Fry YES YES OK √ Good Blue/ #31 N. Lenzner/Tacoma YES YES OK √ Good Blue/ #32 Las Brisas YES YES OK √ Good Blue/ #33 Library YES YES OK Good Blue/ #34 EBC YES YES OK √ Good Blue/ #35 OYCC NO YES OK Good Blue/ #36 Parkway YES YES OK Good Blue/ #37 Moorman NO NO OK Good Blue/ #38 Crestwood NO NO OK Good Blue/ #39 Sunburst NO NO OK Good Blue/ #40 Rodeo YES YES OK Good Blue/ #41 Mall YES YES OK Good Blue/ #42 Avenida Cochise YES YES OK Good Blue/ #43 General Dental NO NO OK Good Blue/ #44 Snyder YES YES OK √ Good Blue/ #45 Las Palmas YES YES OK Good Blue/ #46 Foothills/92 YES YES OK √ Good Blue/ #47 Foothills/Verde NO NO OK Good
Brown/ #46 MIV Pavillion YES YES OK Good Brown/ #47 Post Exchange YES YES OK Good
Source: Vista Transit, 2019
Financial Overview Vista Transit is administered within the City of Sierra Vista’s Public Works Department, which owns, operates and manages capital assets while also operating five fixed routes and paratransit services within the City of Sierra Vista. The operations, maintenance, and capital assets in order to provide public transportation are currently funded through a combination of federal and local resources. Vista Transit is a recipient of federal financial assistance under 49 U.S.C.

March 2021
Existing Conditions Overview
80
Chapter 53 and transportation funding sources are FTA 5307 funds, which is used to operate both the modes of service (fixed route and paratransit services) which includes the ADA 10% provisions. The local funding source for Vista Transit’s operations, maintenance, and capital assets derive primarily from the City of Sierra Vista’s General Fund and some fare recovery revenues.
Funding Expenditures This section provides a brief overview of the recent revenues and funding expenditures as well as a five-year summary of revenues and expenditures.
Most recently in 2019, Vista Transit received and expended a total of $1,118,242 for the operations, maintenance and capital assets, as shown in Table 4-15. The majority of the funding in 2019, or 55.6 percent, were received through federal assistance which amounted to $621,512. The local funding source – the City of Sierra Vista General Fund – accounted for the next largest portion of the funding expenditures in 2019 equating to $399,274 or 35.7 percent, followed by the revenues generated through fare collections which resulted in $97,456, or 8.7 percent of the funding expenditures in 2019.
Table 4-15: 2019 Total Transit Funds Expended
2019 Total Transit Funds Expended
Source of Funds Amount % Fare Revenues $97,456 8.7% Local Funds $399,274 35.7% State Funds - 0.0% Federal Assistance $621,512 55.6% Other Funds 0.0% Total Funds Expended $1,118,242 100.0% Source: City of Sierra Vista, Vista Transit, National Transit Database, 2019
Vista Transit uses sources of revenues for expenditures under operations and maintenance of the transit system, or expenditures on capital assets. Capital funds are generally spent on assets intended to last for many years like busses, maintenance facilities, bus shelter and bus stops. While operating costs are spent mainly on one year’s activities to facilitate and run the public transit services. In 2019, Vista Transit utilized 85.2 percent of the available funding, or $952,243, on operations and maintenance, while using 14.8 percent of the available funds, or $165,999, on capital assets, as shown in Figure 4-19.
Table 4-16 and Table 4-17 provide detail on which sources of revenue were used to fund Vista Transit’s operations and capital expenditures in 2019.
55.6%35.7%
8.7% Federal Assistance
Local Funds
Fare Revenues
85.2%
14.8%
Operating FundsExpended
Capital FundsExpended
Figure 4-19: 2019 Operating vs. Capital Expenditures

March 2021
Existing Conditions Overview
81
As previously mentioned, Vista Transit used $952,243 on operations and maintenance expenditures in 2019. These operating and maintenance expenditures were funded through three funding sources: federal funds, local funds, and fare revenues. The federal funding assistance accounted for most of the operating expenditures in 2019 followed by the local funds, which resulted in $488,713 and $366,074 respectfully. Ten percent, or $97,456 of the operating expenditures were funded by fare revenues, which is lower than the average fare recovery across the nation. Of the $165,999 used on capital expenditures in 2019, $33,200 was derived from local funds and $132,799 was used from federal funds. The composition of funds used for capital expenditures is split 80 percent federal funds and 20 percent local funds which is a standard disposition among most transit agencies across the nation.
Table 4-16: 2019 Operating Funds Expended
2019 Operating Funds Expended
Source of Funds Amount % Fare Revenues $97,456 10.2% Local Funds $366,074 38.4% State Funds - 0.0% Federal Assistance $488,713 51.3% Other Funds - 0.0% Total Operating Funds Expended $952,243 100.0% Source: City of Sierra Vista, Vista Transit, National Transit Database, 2019
Table 4-17: 2019 Capital Funds Expended
2019 Capital Funds Expended
Source of Funds Amount % Fare Revenues - 0.0% Local Funds $33,200 20.0% State Funds - 0.0% Federal Assistance $132,799 80.0% Other Funds - 0.0% Total Capital Funds Expended $165,999 100.0% Source: City of Sierra Vista, Vista Transit, National Transit Database, 2019
The figures on the following page provide a snapshot Vista Transit’s funding and expenditures over the past six years, from 2014 to 2019. F igure 4-20 shows how Vista Transit has used funding towards capital and operations side-by-side. Operating expenditures have been steadily declining since 2016 and peaked in 2014 at $1,130,674, while capital expenditures have experienced more fluctuation over the six-year period, which is likely due to demand in fleet replacement. Figure 4-21 illustrates the total funding composition for Vista Transit over the past six years between 2014 and 2019. The total funding has remained above $1,000,000 each year, peaking in 2015 which was the year Vista Transit received the highest amount of federal assistance.
51.3%38.4%
10.2%Federal Assistance
Local Funds
Fare Revenues
80.0%
20.0%Federal Assistance
Local Funds

March 2021
Existing Conditions Overview
82
Figure 4-20: Six-Year Summary of Capital and Operating Expenditures (2014-2019)
Source: City of Sierra Vista, Vista Transit, National Transit Database, 2019
Figure 4-21: Six-Year Summary of Expenditures by Funding Source (2014-2019)
Source: City of Sierra Vista, Vista Transit, National Transit Database, 2019
2014 2015 2016 2017 2018 2019Fare Revenues $115,997 $116,690 $110,406 $105,543 $102,151 $97,456Local Funds $343,917 $403,778 $426,490 $402,355 $393,226 $399,274Federal Assistance $720,192 $812,518 $577,730 $557,165 $739,919 $621,512
$-
$200,000
$400,000
$600,000
$800,000
$1,000,000
$1,200,000
$1,400,000
Total Funding Source (2014-2019)
Federal Assistance Local Funds Fare Revenues
$1,130,674
$1,046,774
$1,094,648
$1,065,063 $960,944
$952,243 $850,000
$900,000
$950,000
$1,000,000
$1,050,000
$1,100,000
$1,150,000
2014 2015 2016 2017 2018 2019
Operating Funds Expended Summary
$49,432
$286,212
$19,978
0
$274,352
$165,999
$- $50,000
$100,000 $150,000 $200,000 $250,000 $300,000 $350,000
2014 2015 2016 2017 2018 2019
Capital Funds Expended Summary

March 2021
Existing Conditions Overview
83
5 Other Regional Transit Connections Currently, within the SVMPO region, there are three public transportation services available, while there are a number of other transportation services offered within Cochise County that are available by transferring from one of the three services provided within the SVMPO region. The three services provided in the SVMPO region include Sierra Vista Transit, Huachuca City Transit, and the Cochise Connection.
Transit service is available through transfer from the Cochise Connection at Benson (Benson Area Transit) and Douglas (Douglas Bus), which both offer both fixed-route (deviated) and paratransit services to residents, while Bisbee (Bisbee Bus) offers a deviated fixed-route service. Regional transportation providers offering service within the study area include daily interstate bus service offered by Greyhound Lines, with a service point in Benson, and connections to Tucson and Phoenix, among others. Also available at the terminal in Benson is Amtrak, with connections similar to Greyhound. Table 5-1 provides each transportation service available within the study region in more detail.
Table 5-1: Other Regional Transit Connections
Service Service Provided Region covered NotesHuachuca City Transit Reservation-based Huachuca City and Sierra
Vista
Free serviceEligibility: Huachuca City residents 24-hour advanced reservationMonday-Friday service
Cochise Connection
Fixed Route Douglas, Bisbee, Sierra Vista, Huachuca City, and Benson
Deviated route options upon requestMonday-Saturday service Free service for seniors and disabled
Bisbee Bus Deviated Fixed Route Bisbee, Old Bisbee, San Jose, Naco, Saginaw, and Warren
Managed by Douglas Rides Monday-Saturday serviceDeviation request must be made in advance
Benson Area Transit
Fixed Route Benson, Pomerane, Monday-Friday service Paratransit Benson, Pomerene, St.
David, and J-Six-Mescal Eligibility-based: Seniors (60+) and disabled Monday-Friday service24-hour advanced reservation
Douglas Rides Fixed Route Douglas, Pirtleville, and Bay Acres
2 routes with service Monday-Saturday Deviations permitted on Saturday
Douglas and Bisbee Monday-Thursday service during school yearElfrida Service Douglas and Elfrida Service runs every other Friday Paratransit Douglas, Pirtleville, and
Bay Acres Eligibility-based: Seniors (60+) and disabled 24-hour advanced reservation
Greyhound Reservation-based Benson, Tucson, Phoenix, Yuma, and Flagstaff
Service provided twice daily to specific cities.Service suspended from Sierra Vista to Tucson due to reduction in ridership from COVID-19
Amtrak Reservation-based Benson, Tucson, Phoenix, Yuma, Kingman, Maricopa, Flagstaff, and Winslow
Service provided every day
Source: SEACOG Regional Transportation Coordination Plan Update 2018-2019


![TR 102 260 - V1.1.1 - Electromagnetic compatibility and ... · [4] ANSI/TIA -97-E: "Recommended Minimum Performance Standards for cdma2000 Spread Spectrum Base Stations". [5] ANSI/TIA](https://static.fdocuments.in/doc/165x107/5b9646ca09d3f2d0248b892d/tr-102-260-v111-electromagnetic-compatibility-and-4-ansitia-97-e.jpg)