Rui Eduardo de Transmissão de Vídeo em Tempo Real em Redes ...

History
Cobb is the World's oldest Pedigree Broiler Breeder. From modest beginnings in 1916, Cobb has grown and progressed into one of the world's leading suppliers of Broiler Breeding Stock with distribution in more than 120 countries around the globe.

A Cobb é a companhia de genética
para produção de matrizes de corte
mais antiga do mundo
Desde 1916, a Cobb se desenvolveu
para tornar-se líder mundial na
produção de material genético para
matrizes de corte
Os produtos da Cobb são distribuídos
em mais de 120 países
A empresa contribui para o dinâmico
crescimento global do setor avícola
A Cobb transformou a carne de
frango em uma alternativa de fonte
de proteína popular, acessível e
saudável
“A Cobb está
comprometida com a
criação de um futuro
sustentável para os
Colaboradores,
clientes e para as
comunidades em que
atua.” Jerry Moye

Bear Hollow Farm
Human Population of the World (millions)
Table 1. Human population of the world (millions)
Region 2000 2010 2015 2020 2030
Number % Number % Number % Number % Number %
Africa 811.1 13.3 1,022.2 14.8 1,145.3 15.7 1,278.2 16.7 1,562.1 18.8
Americas 834.7 13.6 934.6 13.6 982.1 13.5 1,026.6 13.4 1,103.3 13.2
Asia 3,719.0 60.7 4,164.3 60.4 4,375.5 60.1 4,565.5 59.6 4,867.7 58.5
Europe 726.8 11.9 738.2 10.7 742.1 10.2 744.2 9.7 741.2 8.9
Oceania 31.1 0.5 36.6 0.5 39.4 0.5 42.1 0.6 47.1 0.6
WORLD 6,122.8 100.0 6,895.9 100.0 7,284.3 100.0 7,656.5 100.0 8,321.4 100.0
Source: FAO
In 2013, the population of China was assessed at nearly 1,391 million or nearly one-third of the regional total. India was the second most populous nation with 1,275 million or nearly 30 per cent. However, as India’s population is expanding at a shade over one per cent per year compared with China’s 0.25 per cent, by 2023 there will be more people living in India than China. The third most populated country is Indonesia with 247 million followed by Pakistan (183 million), Bangladesh (154 million), Japan (126 million) and the Philippines (98 million), these seven accounting for 81 per cent of the regional total in 2013.

Bear Hollow Farm
Source: World Bank. World Development Indicators database
Population
(Millions) 1990 2000 2010 2012
Bangladesh 157 72% 59% 43% 42%
Brazil 200 16% 10% 5% 4%
China 1,357 61% 36% 9% 6%
Indonesia 250 54% 48% 18% 16%
India 1,252 54% 45% 33% 24%
Pakistan 182 65% 29% 17% 13%
Philippines 98 33% 25% 18% 19%Percent of World 49.1%
Percent of Population Earning
Less than $1.25 per Day

Bear Hollow Farm
Consumo de Proteinas (Global)

Bear Hollow Farm
0
2
4
6
8
10
12
14
1990 1995 2000 2005 2010 2015 2020
U.S. farm-level prices: Corn, wheat, and soybeans
Dollars per bushel
Corn
Wheat
Soybeans
USDA, 2013

Bear Hollow Farm
Bovinos 6.0 kg de Ração 365 dias (Confinamento)
Suínos 3.0 kg de Ração 180 dias
Ovos 2.0 kg de Ração
Frangos 1.8 Kg de Ração 42 dias
(2,8 Kg Frango Vivo)
Bovinos 0.0 Kg de Grãos Pastagem
Nós acreditamos que as aves seguirão sendo os grande fornecedores de proteína animal! Porque???

Bear Hollow Farm
Manejo das Aves
Levantamentos iniciais sobre as causas de mortalidade nos EUA (1912 - 1930), indicaram problemas com Ascaridia, Heterakis papillosa, Ascite, Coccidiose, Endocardite, Fígado Gorduroso, Gota, Intussuscepção, Problemas de Pernas, Leucemia, Peritonite, Pneumonia, Vários tipos de Tumores, e muitas outras causas de mortalidade, resultando em grandes prejuísos!

Balanço entre os objetivos
Nos últimos 15 anos, a mortalidade dos frangos de corte vem reduzindo 0.05% por ano e adicionalmente a condenação de carcaça reduziu de 1,79% para 0,24%. (National Chicken Council, 2015 ; USDA, 2015).
Isto demonstra que é possível aumentar a produtividade dos frangos de corte modernos sem comprometer a saude das aves.

Leucosys

Seleção dos Pedigree e Progesso Genético

Atender as demandas dos clientes
Informação - rápida e confiável do mercado (tendências e preferências)
Retorno econômico
Carne de baixo custo
Qualidade da carne (Características organolépticas, etc..)
Bem estar animal – regulamentos e exigências
– Saúde imunidade inata

O Equilíbrio no Melhoramento Genético
Peso Corporal
Rendimento de peito
Produção de ovos
Conversão Alimentar Qualidade das pernas
Eclodibilidade
Viabilidade

Entre 1960 e 2004, nos EUA os preços dos produtos avícolas aumentaram a metade em relação aos preços de todos os outros produtos (USDA, Economic Research Service, 2004), devido as melhorias na taxa de crescimento e eficiência.
Esta foi a principal causa para o aumento do consumo per capita da carne de frango entre 1966 (14,59 Kg) e uma projeção para 2016 (41,00 Kg) – USDA, July 10, 2015
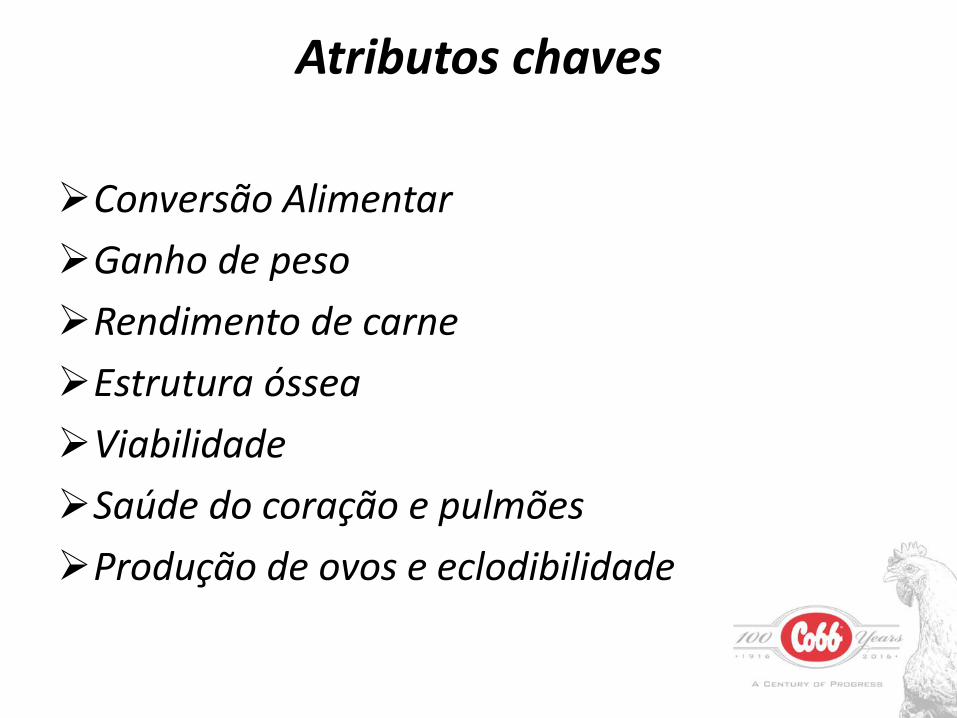
Conversão Alimentar
Ganho de peso
Rendimento de carne
Estrutura óssea
Viabilidade
Saúde do coração e pulmões
Produção de ovos e eclodibilidade
Atributos chaves

O que efetivamente acontece?

Escolha dos melhores indivíduos!

… Como é um frango ? Macho com 2,9 Kg (73,90%)
Exchange rate: 1 US$ = R$ 3,80
Dezembro, 2015
40 to 50% ??????
Otras vezes, pagamos para
remover
Produtos como ossos, plumas, vísceras, etc..
Wings = 7,64%
External Market
USD 2.30 FOB
Domestic Market
USD 2.00 FOB
Bone-in-leg
( 24, 53%)
Boneless
(17,55%)
LQ DM – USD 0.95 FOB
LQ EM – USD 0.90 FOB
BL EM - USD 1.65 FOB
Whole leg
DM USD - 1.20 FOB
Breast Meat
(23,70%)
Fillet = (19,54%)
External Market
USD 1.45 FOB
Domestic Market
USD 1.71 FOB

World Broiler
Thailand
5%
Argentina
3%
China
4%
Brazil
34%
Other
8%
Turkey
4%
United States
32%
EU-27
10%
© EMI Analytics
All Rights Reserved
2014
Forecast
Exports (excludes paws)
Demanda Específica: Mercado Doméstico e Mercado Internacional

Custo de Produção Frangos de Corte (Vivo) US$ / Cents / Kg
Indústria Americana : 2004 - 2014
Agristats, 2015

23
Feeding Costs
1999 2008 2015
Feed Cost 12.33 23.62 34.88
Live Cost 23.91 35.49 48.43
Feed Cost as a % of Live Cost
51.6% 66.6% 72%

Custos de Produção dos Frangos Processados
• Agristats (Maio de 2015)
• Taxa de Câmbio (1 US$ = 3,90 Reais)
• Agristats (Setembro de 2015)
Brasil EUA
US$ / Kg Taxa de Câmbio = 3,06 (Maio, 2015)
0,67 0,84
US$ / Kg Taxa de Câmbio = 1,95 (Maio, 2012)
1,05 0,84
Top 5
Custo de Produção (Frangos Vivos – USA) Peso Vivo, Kg Conversão Calórica (Kcal / Kg)
US$ / Kg 0,53 (R$ / Kg 2,06) 3,40 5500

25
Após 1990’s….
↑ EM & PB ↑ EM & ↓ PB ↓ EM & ↑ AA
1950’s 1970’s & 1980’s 2000’s
As necessidades das aves favoreceram: Mais AA e menos EM
Economicamente Favorável: Mais AA e menos energia….

26
Formulation trends (1990 versus now): digestible Lys
Day of age 42
1.40
1.00
1.20
0.80
2015
1990
20% increase in digestible Lys
Kidd, 2015

63
Requerimentos de Aminoácidos

Industria Avícola
Com uma parte, de alta variabilidade,
produzimos vários produtos
HISTOGRAMA E DISTRIBUIÇÃO NORMAL DE UM EXPERIMENTO COM FRANGOS
2860
2880
2900
2920
2940
2960
2980
3000
3020
3040
3060
3080
3100
3120
3140
PESO ABATE
0
1
2
3
4
5
6
7
8
9
No o
f obs
Média= 2997 g; s=54 g- s + 3s+ 2s
+ s- 3s - 2s
HISTOGRAMA E DISTRIBUIÇÃO NORMAL DE UM EXPERIMENTO COM FRANGOS
2860 2880 2900 2920 2940 2960 2980 3000 3020 3040 3060 3080 3100 3120 3140
PESO ABATE
0
1
2
3
4
5
6
7
8
9
No of obs
Média= 2997 g; s=54 g- s + 3s+ 2s
+ s- 3s - 2s

Peso Corporal
C.A.
Rendimento de peito
Aminoácidos
Vieira et al., 2004 e Dozier et al., 2009

Digestible Lys needs: Recent estimates
% Lys
Day of age Performance BMY Sex Strain Reference
10-21 1.16 NA M 500 Rostagno et al. (2007)
10-21 1.12 NA F 500 Rostagno et al. (2007)
14-28 1.10 NA M TP16 Dozier et al. (2009)
14-28 1.01 NA F TP16 Dozier et al. (2009)
14-28 1.18 NA M TP16 Dozier et al. (2009)
20-35 1.04 NA M 500 Rostagno et al. (2007)
20-35 1.10 NA F 500 Rostagno et al. (2007)
28-42 1.02 0.96 M TP16 Dozier et al. (2010)
28-42 0.99 0.99 M 700 Dozier et al. (2010)
35-49 0.99 0.97 M/F 500 Shirley et al. (2009)
35-49 0.89 0.90 M M99 x 500 Dimova et al. (2010)
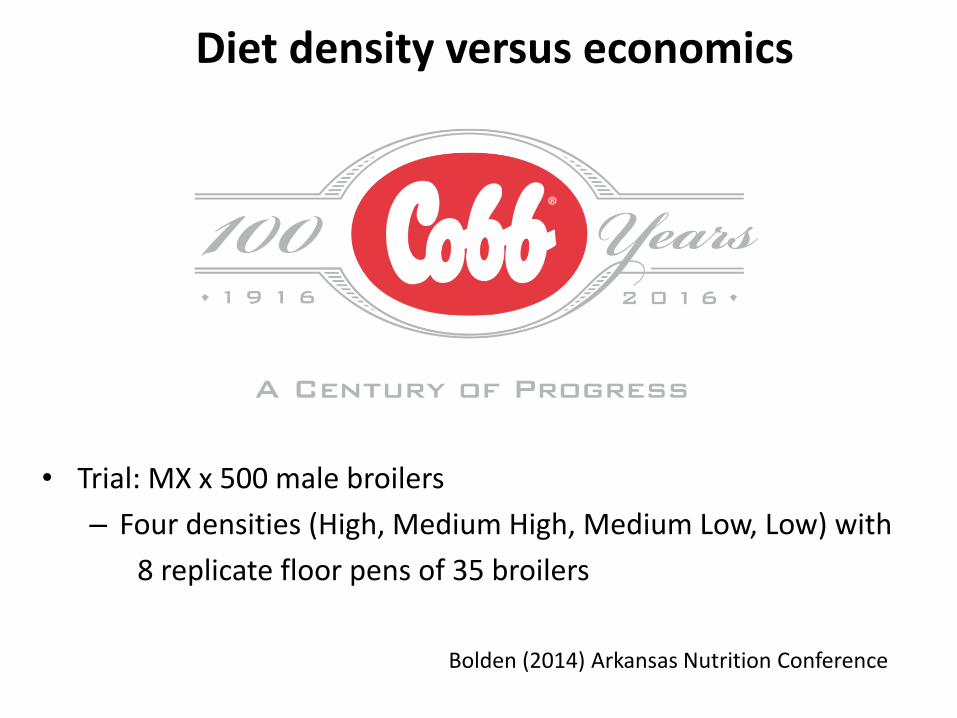
Diet density versus economics
• Trial: MX x 500 male broilers
– Four densities (High, Medium High, Medium Low, Low) with
8 replicate floor pens of 35 broilers
Bolden (2014) Arkansas Nutrition Conference

Key nutrients and energy ME, kcal/kg CP, % TSAA, % dig. Lys, % dig. Calorie/protein
0-14 d H 3,041 23.02 0.94 1.28 132
0-14 d MH 3,041 22.01 0.87 1.18 138
0-14 d ML 2,984 21.02 0.80 1.08 142
0-14 d L 2,984 19.01 0.73 0.99 157
15-28 d H 3,108 21.92 0.86 1.13 142
15-28 d MH 3,108 20.27 0.80 1.05 153
15-28 d ML 3,085 19.00 0.75 0.99 162
15-28 d L 3,085 17.50 0.69 0.91 176
29-42 d H 3,180 20.51 0.84 1.08 155
29-42 d MH 3,180 19.02 0.78 1.00 167
29-42 d ML 3,175 18.02 0.74 0.95 176
29-42 d L 3,175 16.60 0.69 0.88 191
Protein contributing ingredients: corn, full fat soybeans, soybean meal, DL-Met, L-Lys HCl & L-Thr
Bolden (2014) Arkansas Nutrition Conference

Results: 42 d
Parameter L ML MH H Improvement
BW (g) 2,788 2,869 (81) 2,951 (82) 3,006 (55) + 218 g
Feed conversion 1.88 1.85 (3) 1.81 (4) 1.78 (3) - 10 points
Carcass weight (g) 68.83 69.21 (.38) 70.67 (1.46) 71.03(0.36)
+ 2.20 %
Boneless breast (g) 21.53 22.70 (1.17) 23.41 (.71) 23.86 (.45) + 2.33 %
(incremental improvements)
Bolden (2014) Arkansas Nutrition Conference

Formulation density and value per bird (USD)
1,28 1,32
2,91
1,27 1,33
3,05
1,26 1,4
3,17
1,22 1,38
3,28
0
0,5
1
1,5
2
2,5
3
3,5
Live bird market Whole carcass market Debone breast market
L ML MH H
* *
*
Bolden (2014) Arkansas Nutrition Conference

Formulation to meet economic priorities
L ML MH H
-Minimum feed costs -Feed costs/kg bird
-Whole carcass -Average daily gain -Feed conversion -White meat yields
Bolden (2014) Arkansas Nutrition Conference

Energy and AA Study

Performed by Dr. Dozier at Auburn university
Four phases (Starter, grower, finisher, withdraw)
Still on going (38-56days and total period)
Four different energy levels per phase
Two different amino acid levels per phase
Energy study

Two most expensive parts of feed: Energy and Protein.
Energy and protein are highly correlated in feed for broiler performance.
Since 1986 feed energy has been lowered by 60-80 kcal/kg.
Energy study

* No response to energy, clear effect of AA on FCR
Energy study, Starter (day 1- 14)
Energy level (kcal /kg) BWG (g) Feed intake (g) FCR*
2931 453 611 1.333
2997 460 621 1.347
3064 457 622 1.340
3130 461 612 1.343
AA level % of Cobb BWG (g) Feed intake (g) FCR*
92% 449a 618 1.368a
100% 467b 615 1.314b
*Based on gain and adjusted for mortality

Again no response on energy, AA show clear effect on FCR
Energy study, Grower (day 14-32)
Energy level (kcal /kg) BW (kg) BWG (kg) Feed intake (kg) FCR*
2997 2.092 1.611 2.486 1.539
3064 2.059 1.582 2.447 1.548
3130 2.046 1.575 2.447 1.557
3196 2.057 1.586 2.435 1.536
AA level % of Cobb BW (kg) BWG (kg) Feed intake (kg) FCR*
92% 2.046 1.572 2.480 1.574a
100% 2.081 1.605 2.428 1.516b
*Based on gain and adjusted for mortality

White Striping

Higher energy tended to induce more white striping.
Higher AA resulted in more fillet yield.
Energy study, Grower (day 14-32)
Energy level (kcal /kg) Fat Carcass Fillet Breast White striping
2997 1.05 70.35 18.31 22.38 0.757
3064 1.08 70.48 18.12 22.50 0.703
3130 1.14 70.66 18.20 22.53 0.705
3196 1.19 70.97 18.34 22.31 0.900
AA level % of Cobb Fat Carcass Fillet Breast White striping
92% 1.19a 70.62 18.06a 22.21 0.629
100% 1.04b 70.61 18.42b 22.65 0.649
Yield expressed as percentage of live weight White striping is a numerical number

FCR improved with higher energy levels, only a trend in AA.
Energy study, Finisher (day 28-42)
Energy level (kcal /kg) BW (kg) BWG (kg) Feed intake (kg) FCR*
3042 2.757 1.060 2.024 1.918a
3108 2.696 1.022 1.986 1.929a
3173 2.742 1.097 1.991 1.825b
3240 2.724 1.069 1.958 1.821b
AA level % of Cobb BW (kg) BWG (kg) Feed intake (kg) FCR*
92% 2.714 1.042 2.008 1.919
100% 2.745 1.082 1.971 1.828
*Based on gain and adjusted for mortality

Higher energy levels increased the amount of abdominal fat, higher tendency of white striping.
Higher AA levels increased breast yield.
Energy study, Finisher (day 28-42)
Energy level (kcal /kg) Fat Carcass Breast White striping
3042 1.06a 72.76 23.62 0.654
3108 1.11a 71.78 23.63 0.764
3173 1.36b 72.14 23.48 0.764
3240 1.23b 72.06 23.57 0.833
AA level % of Cobb Fat Carcass Breast White striping
92% 1.22 71.76 23.18a 0.725
100% 1.16 72.61 23.97b 0.794
Yield expressed as percentage of live weight White striping is a numerical number

Phase four (day 35-49) and whole lifetime study, almost finished
Cobb 500’s continue to show a consistent response in FCR and breast yield to amino acid levels
Study shows that lower energy levels in early feeds give the same response as recommended energy levels; altering our recommendations
Energy study

Digestible Thr needs: Recent estimates
Day of age % Thr Strain Reference
14-28
20-40
0.75
0.60
Ross x TP-16
Multiple
Corzo et al. (2009)
Leclercq (1998)
21-42 0.61 Ross x Hubbard Webel et al. (1996)
21-42 0.61 Peterson x Arbor Acres Penz et al. (1997)
21-42 0.65 Multiple Kidd et al. (2004)
28-42
30-42
0.68
0.61
Ross x TP-16
Ross x 308
Everett et al. (2010)
Kidd and Kerr (1997)
35-49 0.72 Ross x 708 Meiji et al. (2012)
42-56 0.52 Ross x Hubbard Webel et al. (1996)
42-56 0.58 Ross x Hubbard Kidd et al. (1999)
42-56 0.59 Ross x 308 Dozier et al. (2000)

Dietas Sem Promotores de Crescimento
Tyson Foods elimina uso de antibióticos em frangos de corte
Tyson Foods já parou de usar todos os antibióticos em seus 35 centros de incubação de frangos de corte, exigindo prescrição de antibiótico usado para produção de frangos de corte e reduzindo o uso de antibióticos humanos para tratar frangos de corte. Quinta-feira, 25 de Junho de 2015, 10:13:40Mercado Externo, Nutrição, Saúde Animal A produtora de alimentos Americana Tyson Foods anunciou que se esforçará para eliminar o uso de antibióticos humanos em sua produção americana de frangos de corte até o final de Setembro de 2017. A empresa irá apresentar relatórios anuais sobre o progresso, começando com seu Relatório de Sustentabilidade do ano fiscal de 2015. Tyson Foods já parou de usar todos os antibióticos em seus 35 centros de incubação de frangos de corte, exigindo prescrição de antibiótico usado para produção de frangos de corte e reduzindo o uso de antibióticos humanos para tratar frangos de corte em mais de 80% desde 2011. Preocupação mundial da saúde “Infecções resistentes aos antibióticos é uma preocupação global de saúde”, diz Donnie Smith, presidente e CEO da Tyson Foods. “Estamos confiantes que nossas carnes e aves são produtos seguros, mas queremos fazer a nossa parte para reduzir de forma responsável os antibióticos humanos na produção, para que esses medicamentos sejam utilizados para tratar doenças quando necessários”. “Dado o progresso que já tivemos reduzindo os antibióticos em nossos frangos de corte, nós acreditamos que é possível eliminar totalmente o uso até o final do nosso ano fiscal de 2017. Mas não vamos colocar em risco o bem-estar dos animais apenas para chegar lá. Vamos usar os melhores tratamentos disponíveis para manter nossos frangos saudáveis, sob supervisão veterinária”, disse Smith”. Smith disse que a decisão não irá afetar o desempenho financeiro da empresa. Fonte: World Poultry
0
1
2
3
4
5
6
0 7 14 21 28 35 42 49 56 63 70 77 84
Cornish SSR LSR XL/XXL
Normal Pathogen Production Curve
Assumption:
14 days out time
will cut pathogen
load in half
0.95
74
4.9
82,500
82,500
0.85
64
5.7
107,000
130,000
0.72
53
6.9
153,300
352,500
0.60
42
8.7
232,000
1.1 Mill
Density
Days per cycle – 14 days out)
Cycles per year
Birds per year per house
Pathogens load at slaughter
Un
its o
f P
ath
og
en
s P
rod
uce
d
Days
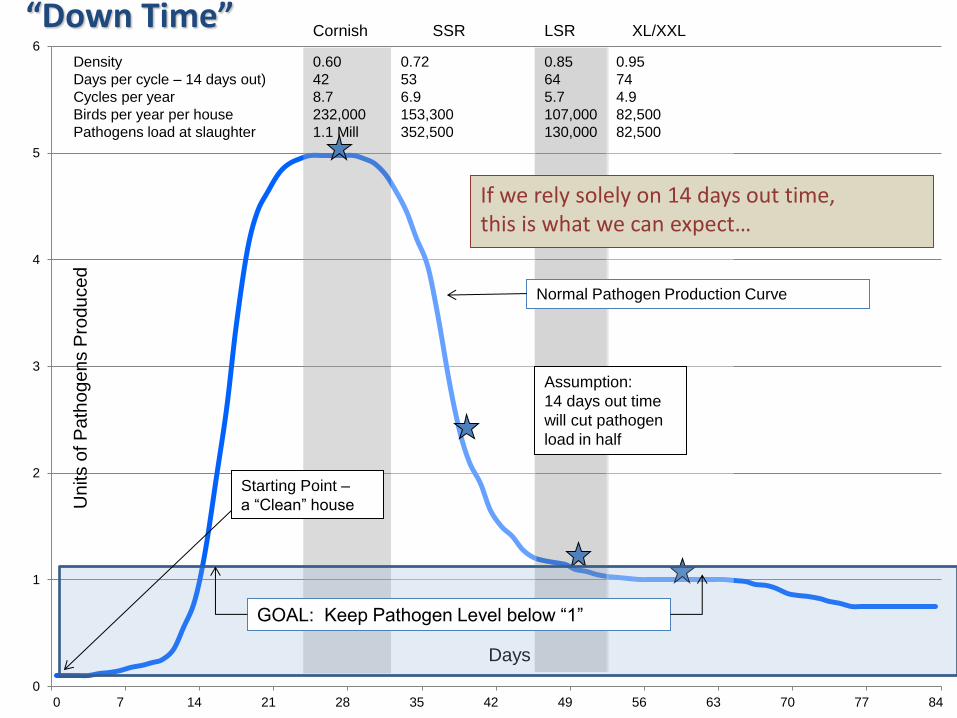
GOAL: Keep Pathogen Level below “1”
If we rely solely on 14 days out time, this is what we can expect…
Starting Point –
a “Clean” house
“Down Time”

“Down Time”
•Assuming a 14 day “half life” of pathogen load, the
longer the out time, the lower the load
•14 days out time, alone, is not enough for small birds
•Cons – may not be cost effective, achievable or
sustainable

Thr needs: Do dirty environments
increase the minimum need?
(Increased 12%, Kidd et al., 2003)
(Increased 5%, Corzo et al., 2007)

50
63
75
88
100
0.45 0.52 0.59 0.66 0.73 0.80
Total % Thr
(g
/b
ird
/d
)
2.00
2.38
2.75
3.13
3.50
0.45 0.52 0.59 0.66 0.73 0.80
Total % Thr
(g
/g
)
Thr needs: Dirty vs clean floor pens -Cobb 500 -42 to 56 d -Dirty = P > 0.05 Linear
(Kidd et al., 2015)
-Thr deficiency reduces intestinal mucin synthesis (Faure et al. 2005). -0.63 vs 0.67 to 0.70 (Thr/Lys) for NE challenged broiler (Star et al., 2012).
BWG FCR

Digestible Val needs: Recent estimates
Day of age % Val Strain Reference
1-14 0.91 Ross x 308 Corzo et al. (2008)
1-21 0.90 Cobb x 500 Goodgame et al. (2011)
7-21 0.84 Cobb x 500 Campos et al. (2009)
14-28 0.86 Ross x 308 Corzo et al. (2008)
21-35 0.84 Cobb x 500 Goodgame et al. (2011)
21-42 0.65 Ross x 508 Thornton et al. (2006)
21-42 0.72 Ross x 708 Corzo et al. (2007)
28-40 0.77 Cobb x 500 Campos et al. (2009)
28-42 0.78 Ross x 308 Corzo et al. (2008)
42-56 0.67 Ross x 308 Corzo et al. (2004)

Valine Study

Dietary Ingredients 4th Limiting Amino Acid In Broiler Feeds
Corn
Corn
Corn
Sorghum
Sorghum
Sorghum
Wheat
Wheat
Wheat
Kidd & Hackenhaar, CAB Reviews, 2005 and Kidd, 2014
What’s fourth limiting?
Poultry Meal: 8%
Meat Blend: 8% (Poultry Meal 3%; Meat & Bone Meal 3%; Feather Meal 2%)
- Soy
- Soy
- Soy
- Soy
- Soy
- Soy
- Soy
- Soy
- Soy
- Poultry
- Poultry
- Poultry
- Meat Blend
- Meat Blend
- Meat Blend
Valine
Valine
Isoleucine
Isoleucine
Tryptophan
Arginine

Most limiting amino acid is Methionine, the second is Lysine, the third is Threonine.
The fourth is currently not know, however the discussion is on ingredient composition to determine which it is.
Valine Study
Ingredient composition Fourth limiting AA
Corn/Soybean meal Valine
Sorghum/Soybean meal Arginine
Wheat/Soybean meal Valine
Corn/Soybean meal/Meat product Isoleucine/Tryptophane
Wheat/Soybean meal/Meat product Isoleucine
Adapted from: Kidd and Hackenhaar, 2005

Performed on the university of Arkansas with Dr. Kidd
3 Phases (day 14-28, 28-42, 42-56)
8 Treatments per phase – Valine as an percentage of Lysine – 1 Control
Preliminary results, awaiting further analyses
Valine study

Valine study, day 14-28
Valine level (%) Feed intake (g/day) ADG (g) BW at 28 (kg) FCR*
64 105 74.6 1.47 1.487
67 106 75.5 1.48 1.453
70 107 76.2 1.49 1.466
73 103 73.9 1.44 1.465
76 104 74.4 1.46 1.476
79 102 73.2 1.43 1.462
82 104 74.5 1.45 1.454
No response to Valine levels.
BW at 28 days related to BW at 14 days.
*Based on gain and adjusted for mortality

Valine study, day 28-42
Valine level (%) Feed intake (g/day) ADG (g) BW at 42 (kg) FCR*
64 185 91.6 2.72 1.764
67 180 90.7 2.65 1.733
70 177 91.4 2.64 1.702
73 183 91.4 2.71 1.753
76 178 87.6 2.63 1.761
79 180 89.8 2.64 1.751
82 178 89.4 2.63 1.756
No response to Valine levels
*Based on gain and adjusted for mortality

Valine study, day 42
Valine level (%) Carcass weight (g) Yield (%) Fat (g) Fillet yield (%) Leg yield (%)
64 2014.6 74.0 48.6 19.7 22.0
67 2001.5 74.1 48.3 19.9 22.2
70 1969.0 73.8 46.8 19.9 22.2
73 1982.3 73.9 49.7 19.5 22.2
76 1969.2 74.0 44.7 19.7 22.3
79 1980.6 73.6 51.4 18.9 22.1
82 1988.2 73.9 47.7 19.8 22.0
No response to Valine levels, however there appears to be a trend favoring lower Valine.
Yield expressed as percentage of carcass weight

No direct response to Valine levels found in any of the analyzed data.
Data from Day 14-28 suggests Day 0-14 might have a stronger result.
Comparison with control on Day 14-28 and 28-42 indicated that the high usage of synthetic amino acids and glutamic acid influenced performance.
We will await completion of the data analyses and a second study before possibly altering our recommendations.
Valine Study, Conclusion

Muito Obrigado